Ameresco, Inc. · NYSE:AMRC
Ameresco — Investor Presentation (November 2026)
31 slides from Ameresco's investor presentation, November 2026
Slide 1: Leading Energy Infrastructure Company
Leading Energy Infrastructure Company Delivering integrated solutions to provide reliable power & modernize infrastructure Investor Presentation | NYSE:AMRC November 2026 © 2026 Ameresco, Inc. All rights reserved. ameresco.com
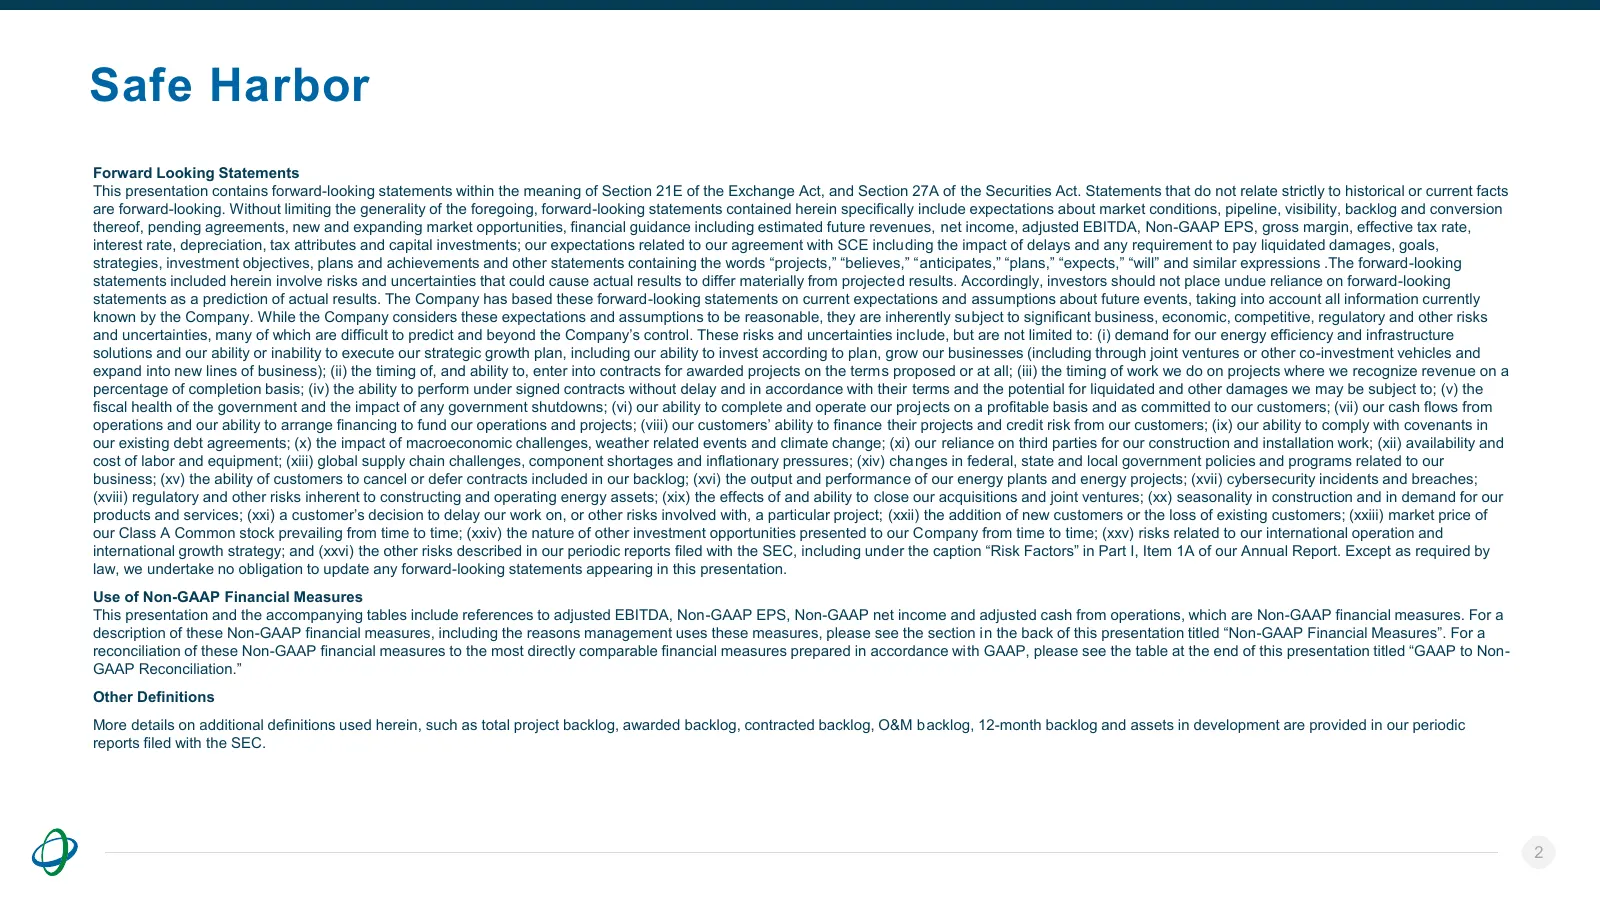
Slide 2: Safe Harbor
Safe Harbor Forward Looking Statements This presentation contains forward-looking statements within the meaning of Section 21E of the Exchange Act, and Section 27A of the Securities Act. Statements that do not relate strictly to historical or current facts are forward-looking. Without limiting the g
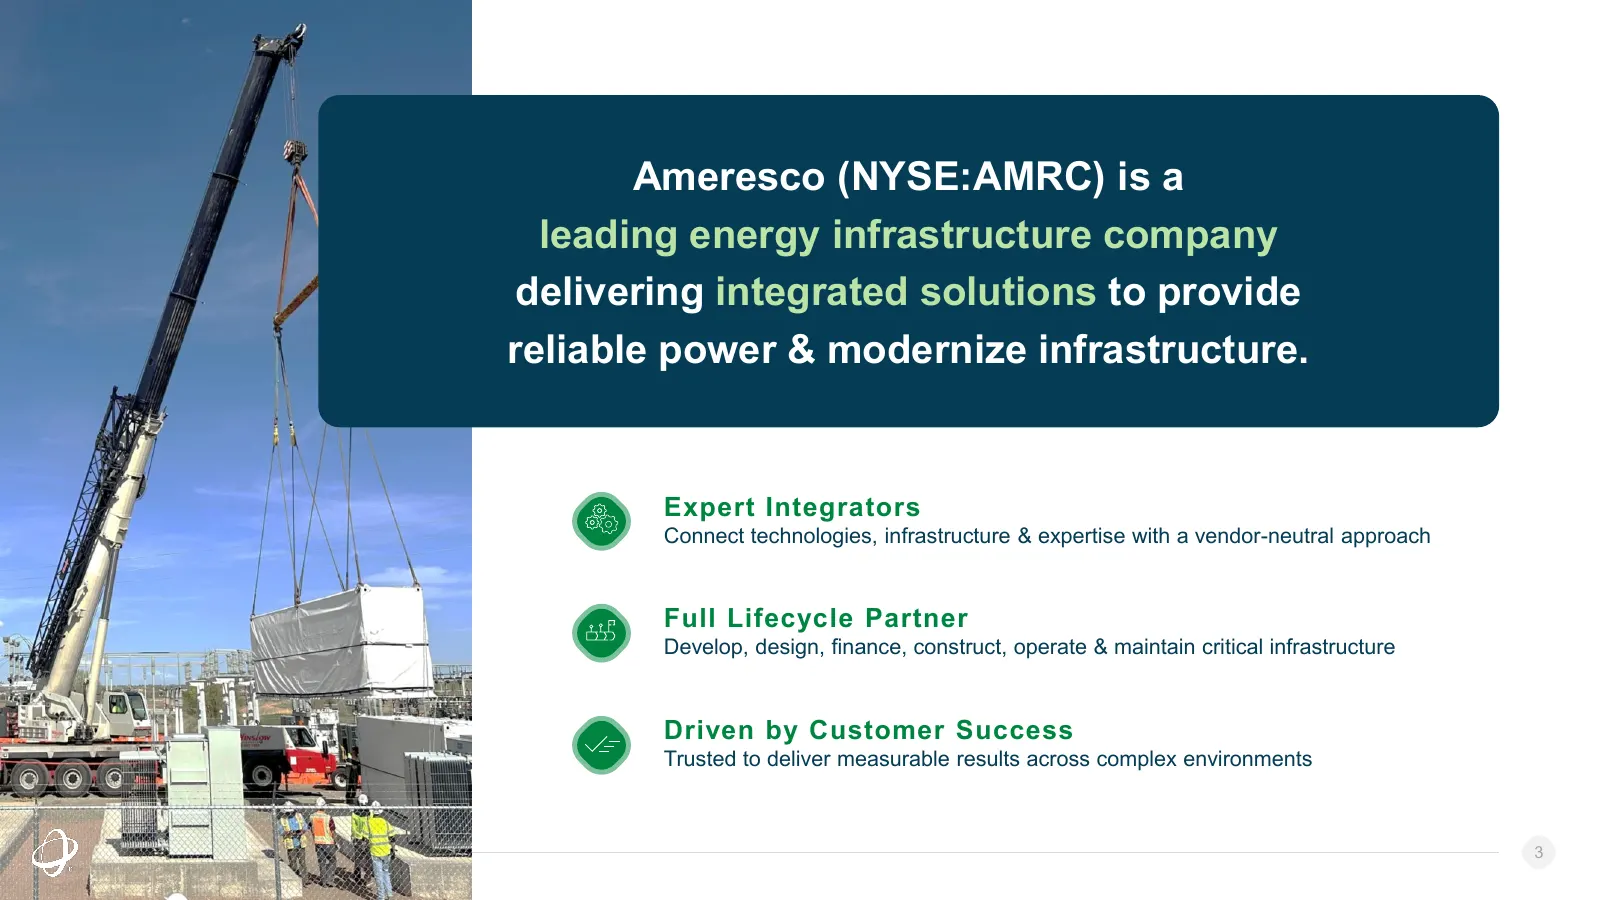
Slide 3: Ameresco is a leading energy infrastructure company
Ameresco (NYSE:AMRC) is a leading energy infrastructure company delivering integrated solutions to provide reliable power & modernize infrastructure. Expert Integrators Connect technologies, infrastructure & expertise with a vendor-neutral approach Full Lifecycle Partner Develop, design, finance, co
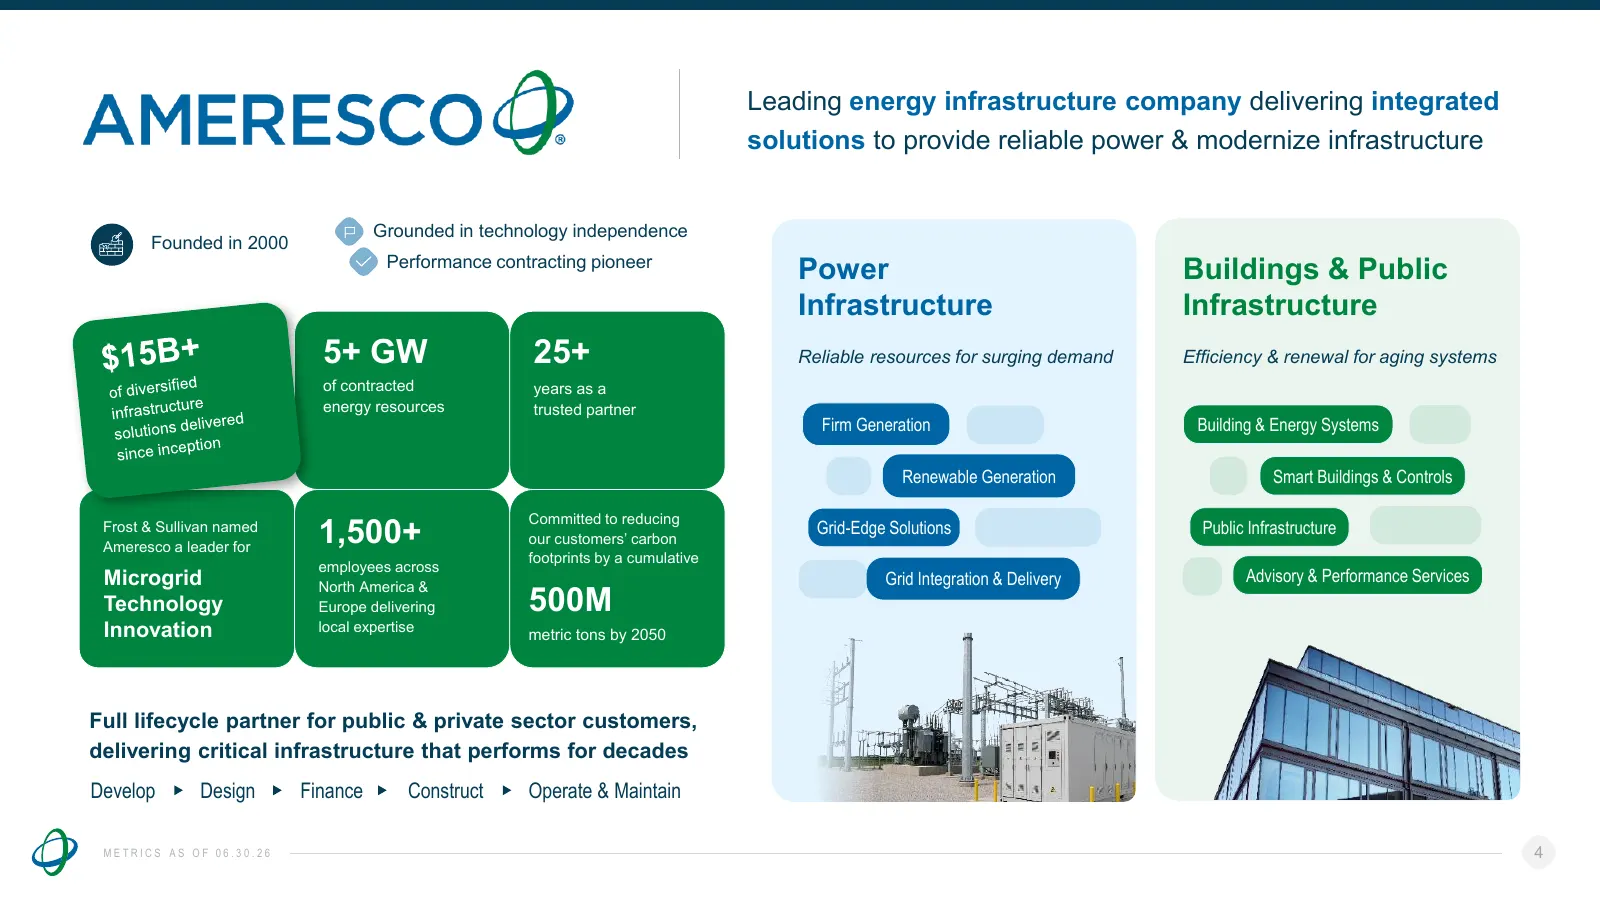
Slide 4: Leading energy infrastructure company at a glance
Leading energy infrastructure company delivering integrated solutions to provide reliable power & modernize infrastructure Grounded in technology independence Founded in 2000 Performance contracting pioneer Power Buildings & Public Infrastructure Infrastructure 5+ GW Top Market 25+ Reliable resource
Slide 5: Trusted Partner for Full Lifecycle
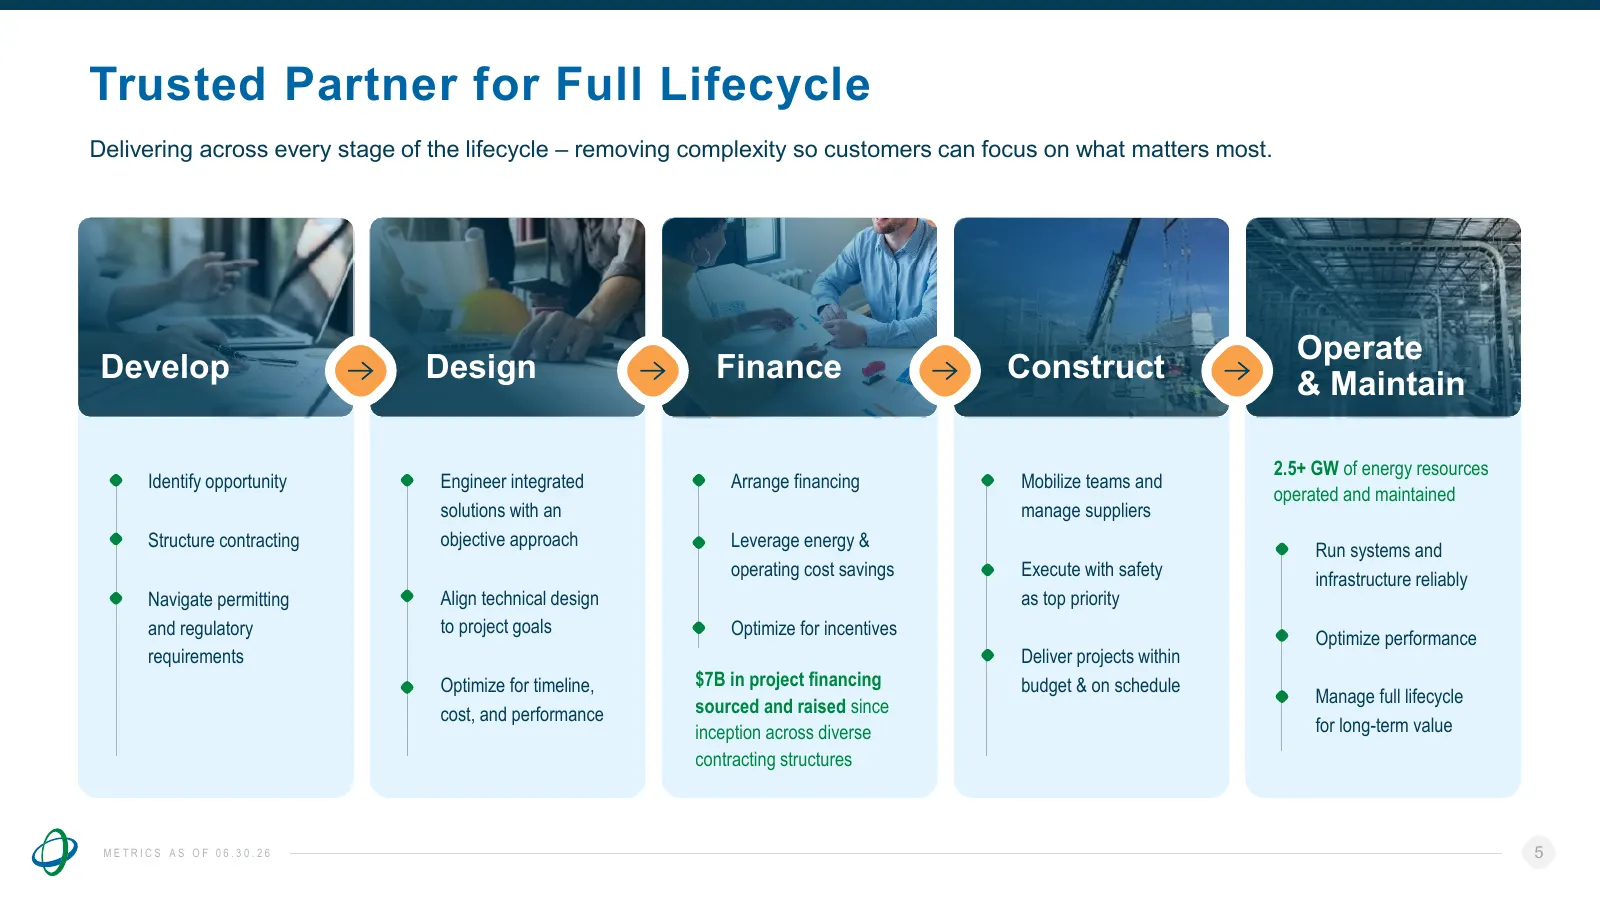
Trusted Partner for Full Lifecycle Delivering across every stage of the lifecycle – removing complexity so customers can focus on what matters most. Operate Develop Design Finance Construct & Maintain 2.5+ GW of energy resources Identify opportunity Engineer integrated Arrange financing Mobilize tea
Slide 6: Power Infrastructure: Reliable Resources for Surging Demand
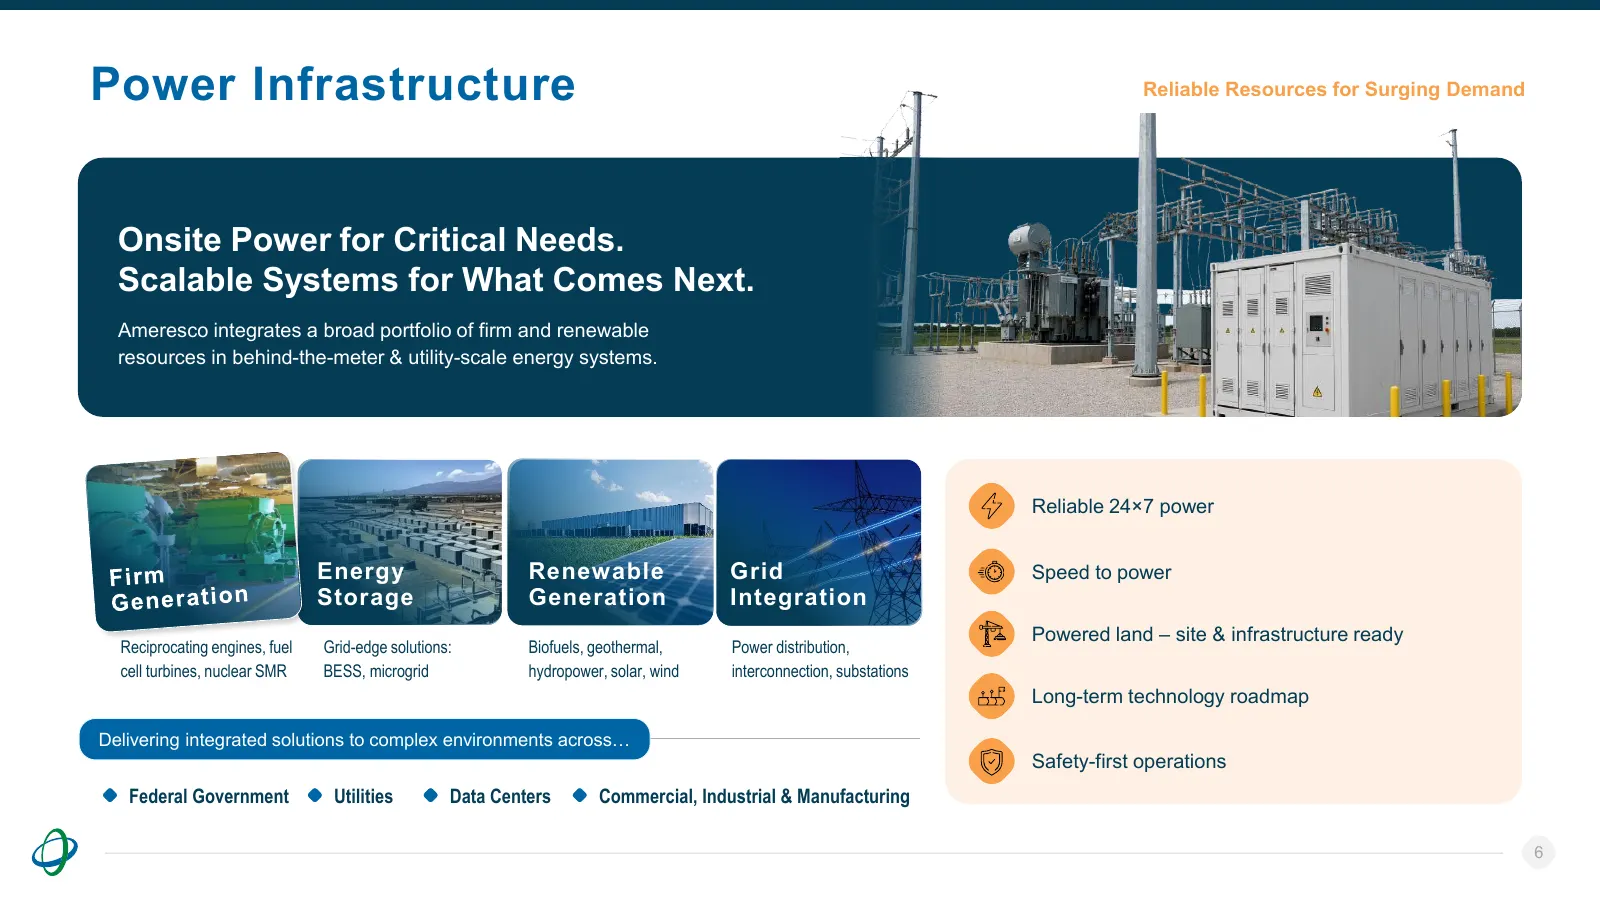
Power Infrastructure Reliable Resources for Surging Demand Onsite Power for Critical Needs. Scalable Systems for What Comes Next. Ameresco integrates a broad portfolio of firm and renewable resources in behind-the-meter & utility-scale energy systems. Reliable 24×7 power Energy Renewable Grid Speed
Slide 7: Buildings & Public Infrastructure
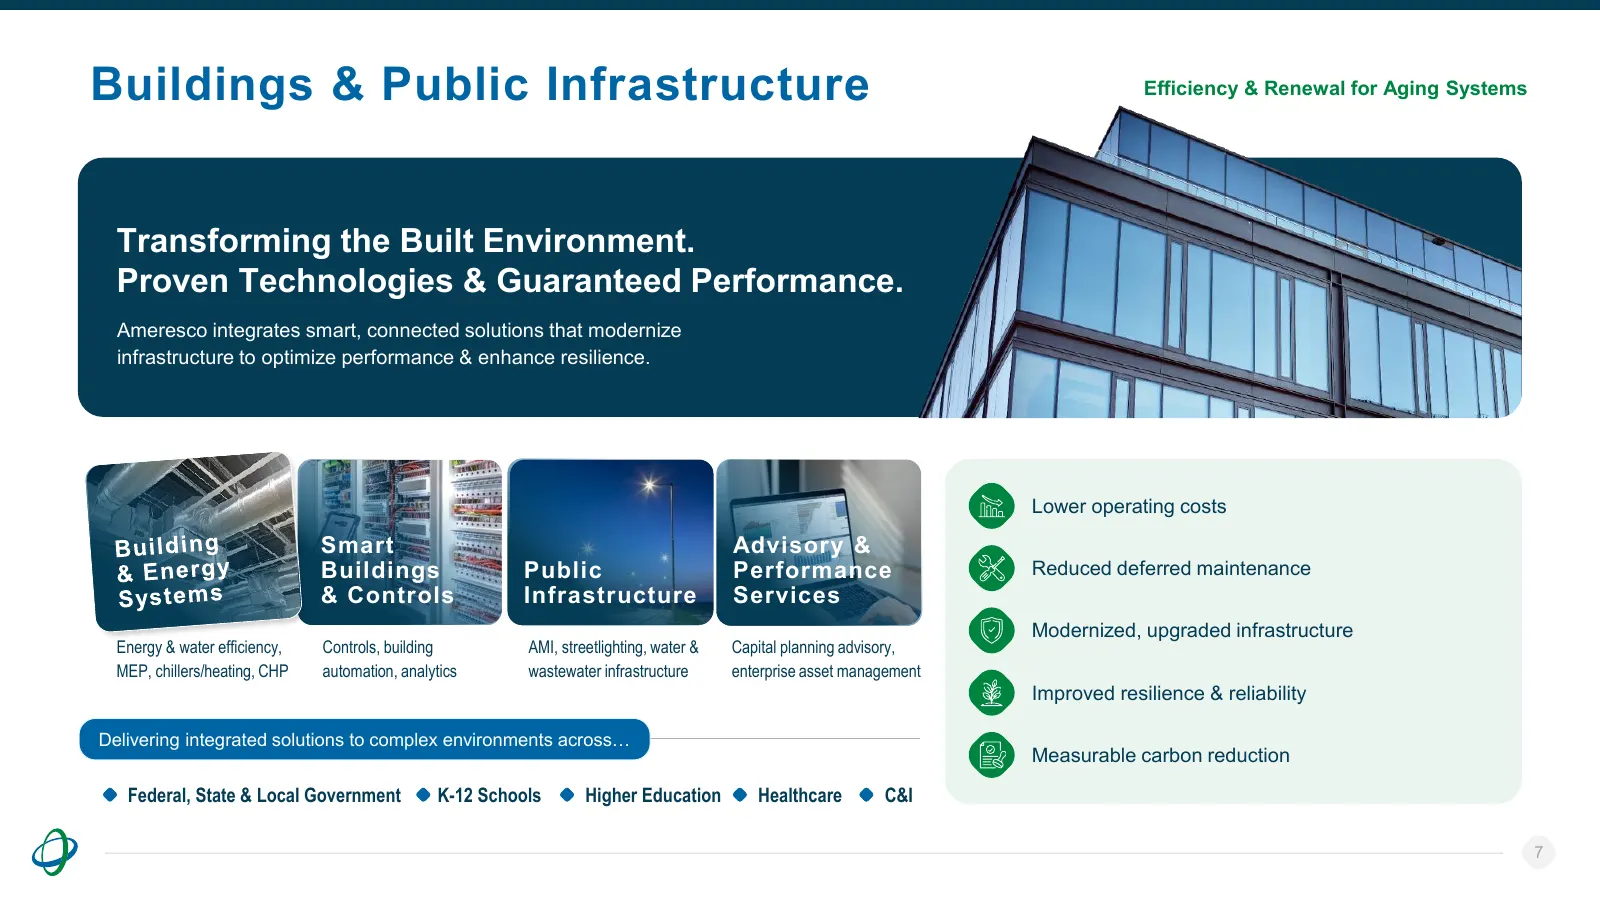
Buildings & Public Infrastructure Efficiency & Renewal for Aging Systems Transforming the Built Environment. Proven Technologies & Guaranteed Performance. Ameresco integrates smart, connected solutions that modernize infrastructure to optimize performance & enhance resilience. Lower operating costs
Slide 8: Powering the Next Decade of Growth
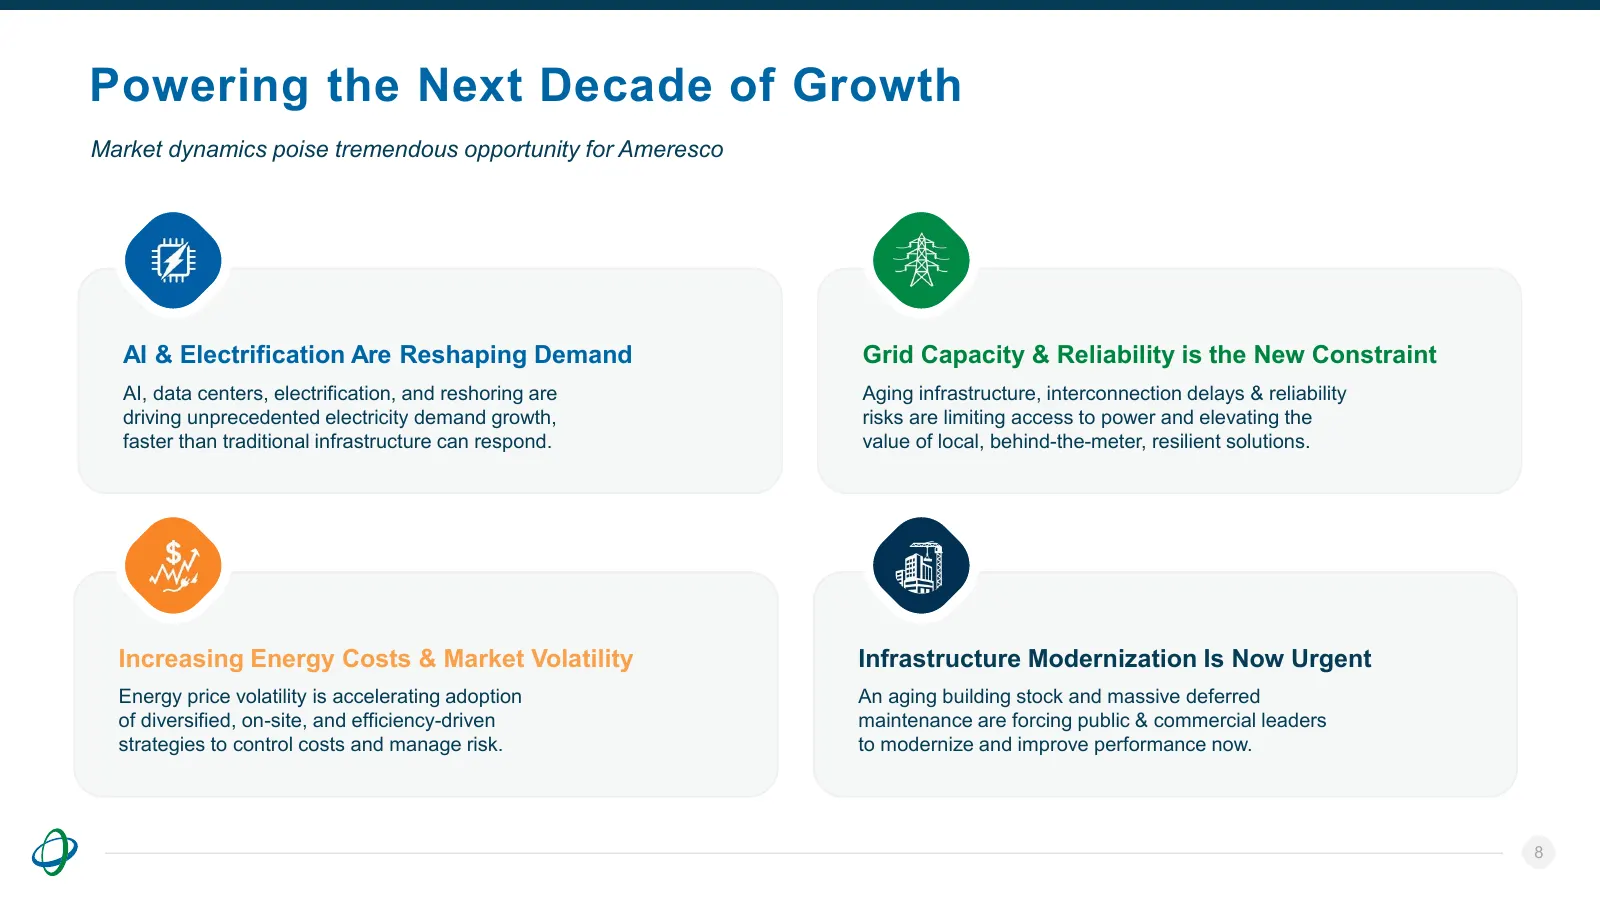
Powering the Next Decade of Growth Market dynamics poise tremendous opportunity for Ameresco AI & Electrification Are Reshaping Demand Grid Capacity & Reliability is the New Constraint AI, data centers, electrification, and reshoring are Aging infrastructure, interconnection delays & reliability dri
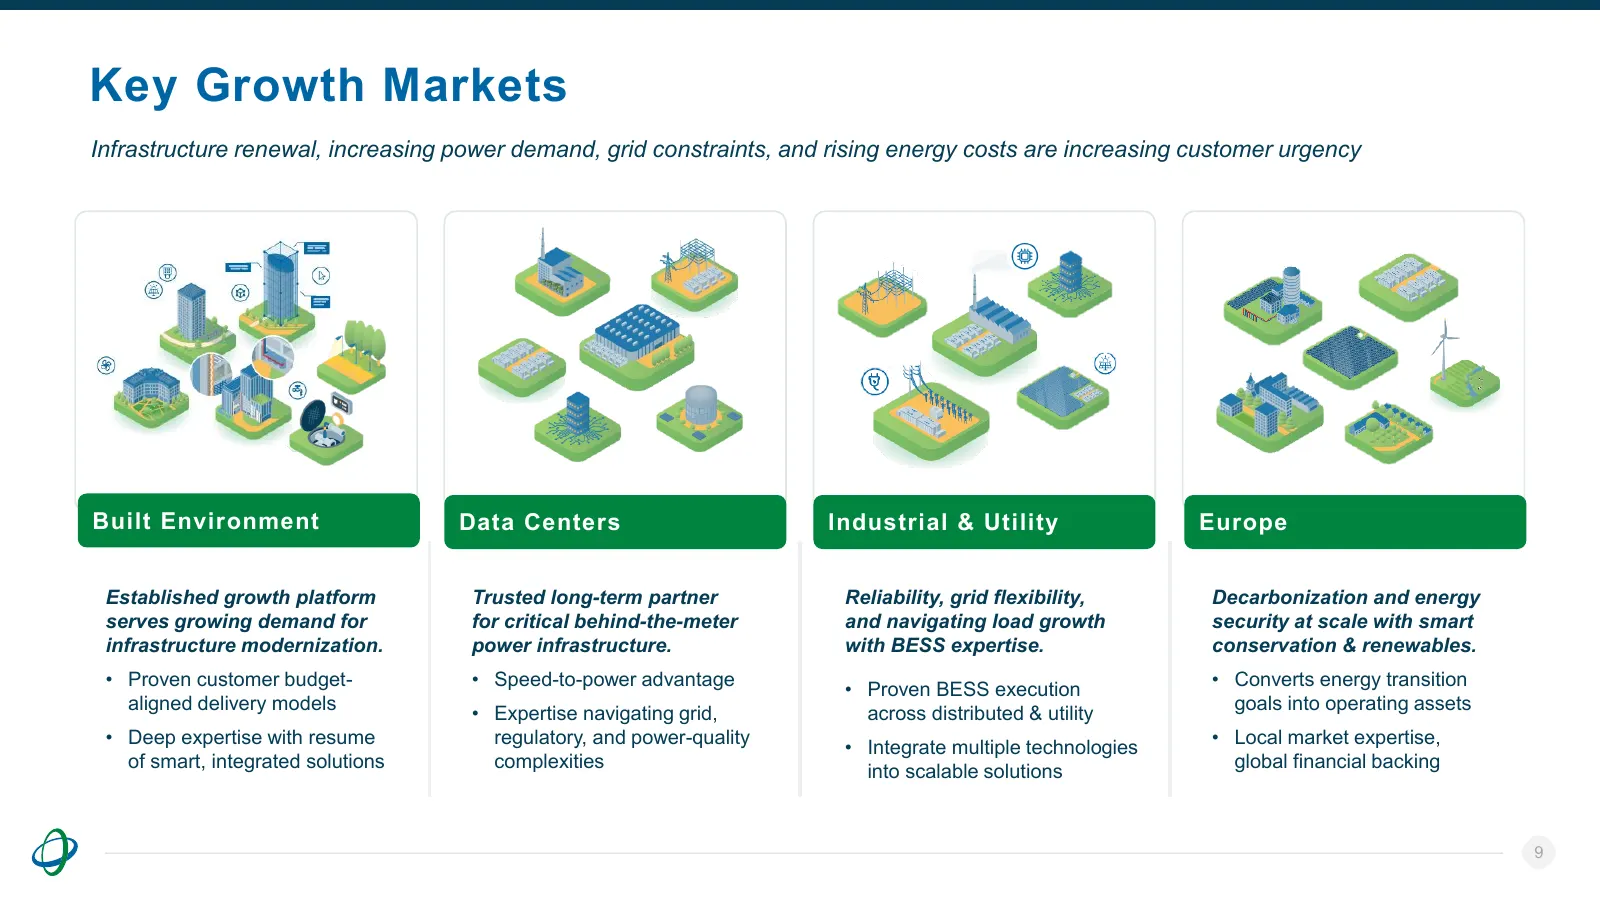
Slide 9: Key Growth Markets
Key Growth Markets Infrastructure renewal, increasing power demand, grid constraints, and rising energy costs are increasing customer urgency Built Environment Data Centers Industrial & Utility Europe Established growth platform Trusted long-term partner Reliability, grid flexibility, Decarbonizatio
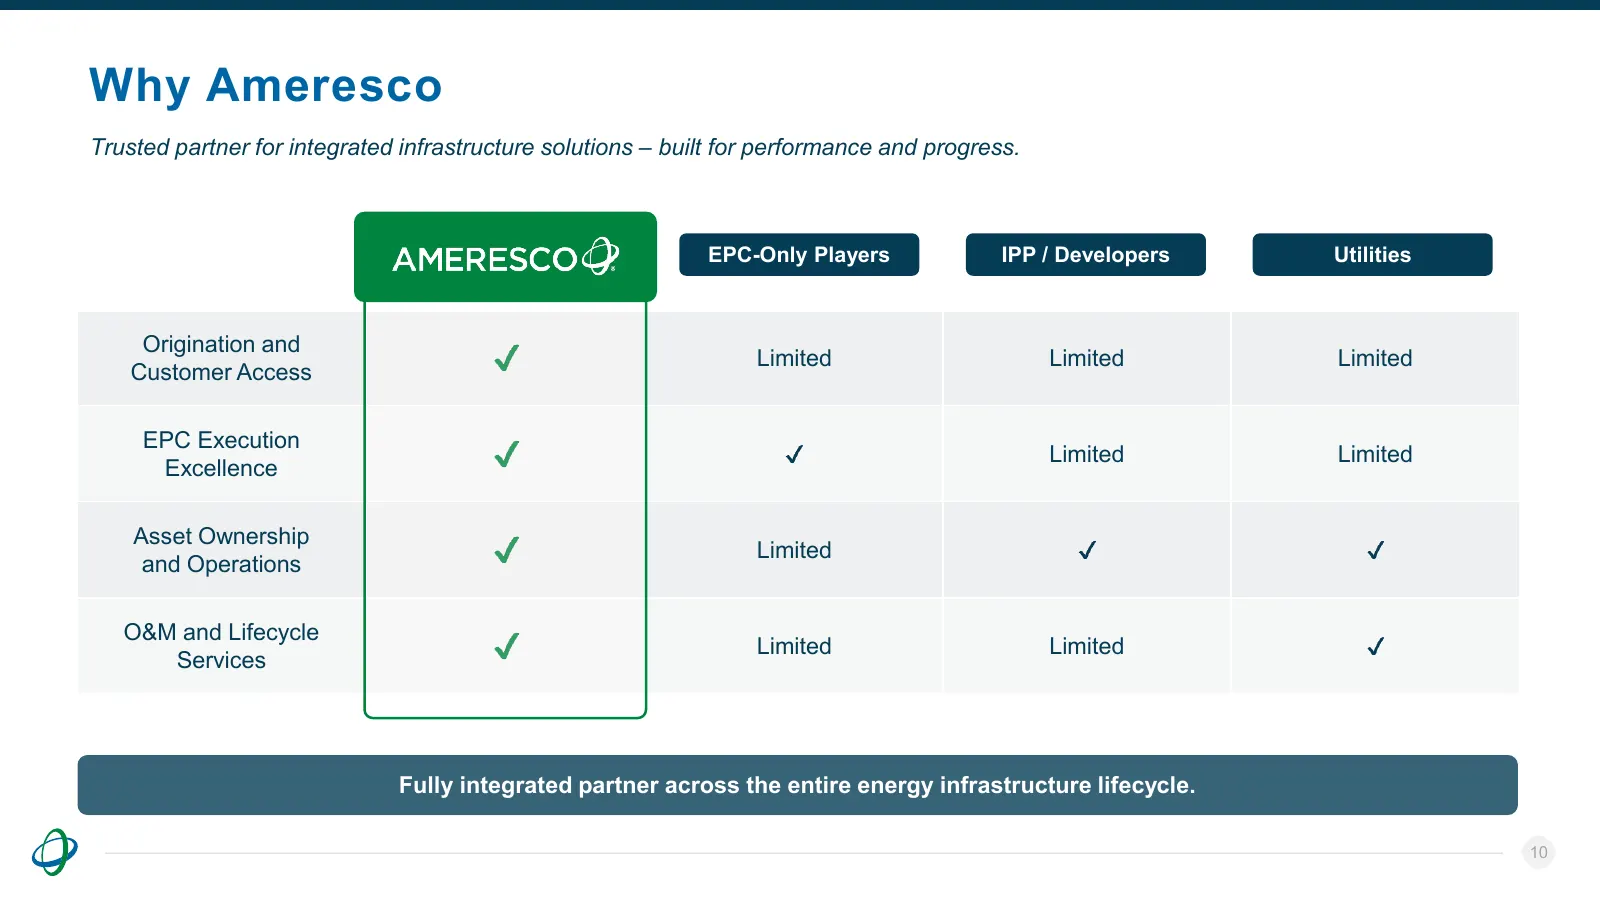
Slide 10: Why Ameresco
Why Ameresco Trusted partner for integrated infrastructure solutions – built for performance and progress. Ameresco EPC-Only Players EPC-Only Players IPP // Developers IPP Developers Utilities Utilities Origination and Limited Limited Limited Customer Access EPC Execution Limited Limited Excellence
Slide 11: Financials
Financials 11
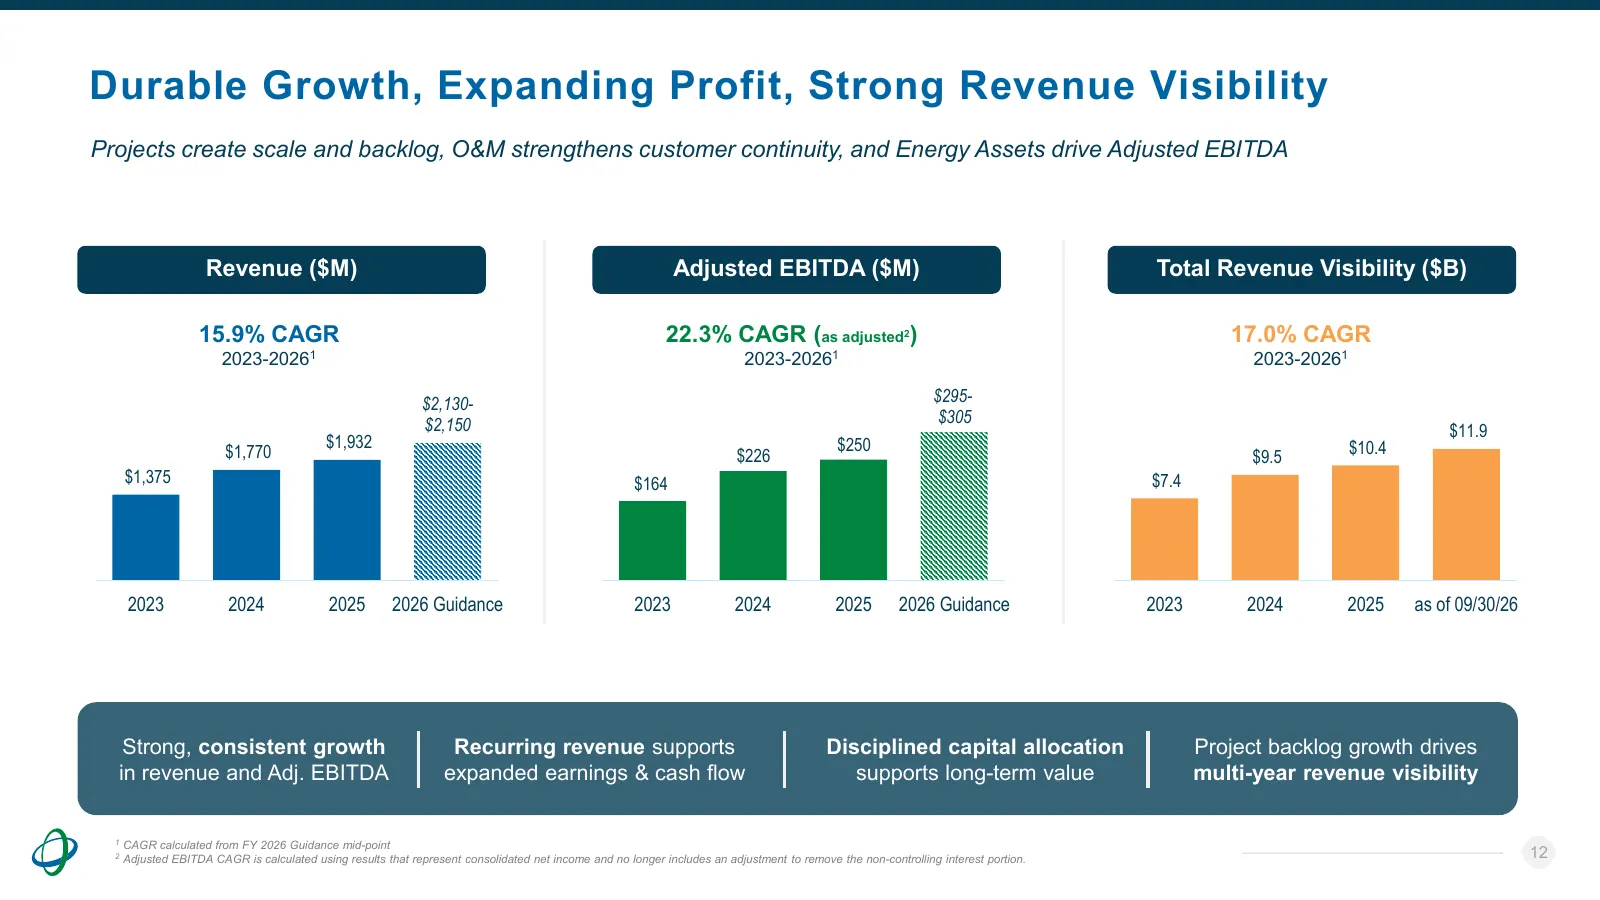
Slide 12: Durable Growth, Expanding Profit, Strong Revenue Visibility
Durable Growth, Expanding Profit, Strong Revenue Visibility Projects create scale and backlog, O&M strengthens customer continuity, and Energy Assets drive Adjusted EBITDA Revenue ($M) Adjusted EBITDA ($M) Total Revenue Visibility ($B) 15.9% CAGR 22.3% CAGR (as adjusted2) 17.0% CAGR 2023-20261 2023-
Slide 13: Integrated Platform: Three Lines of Business
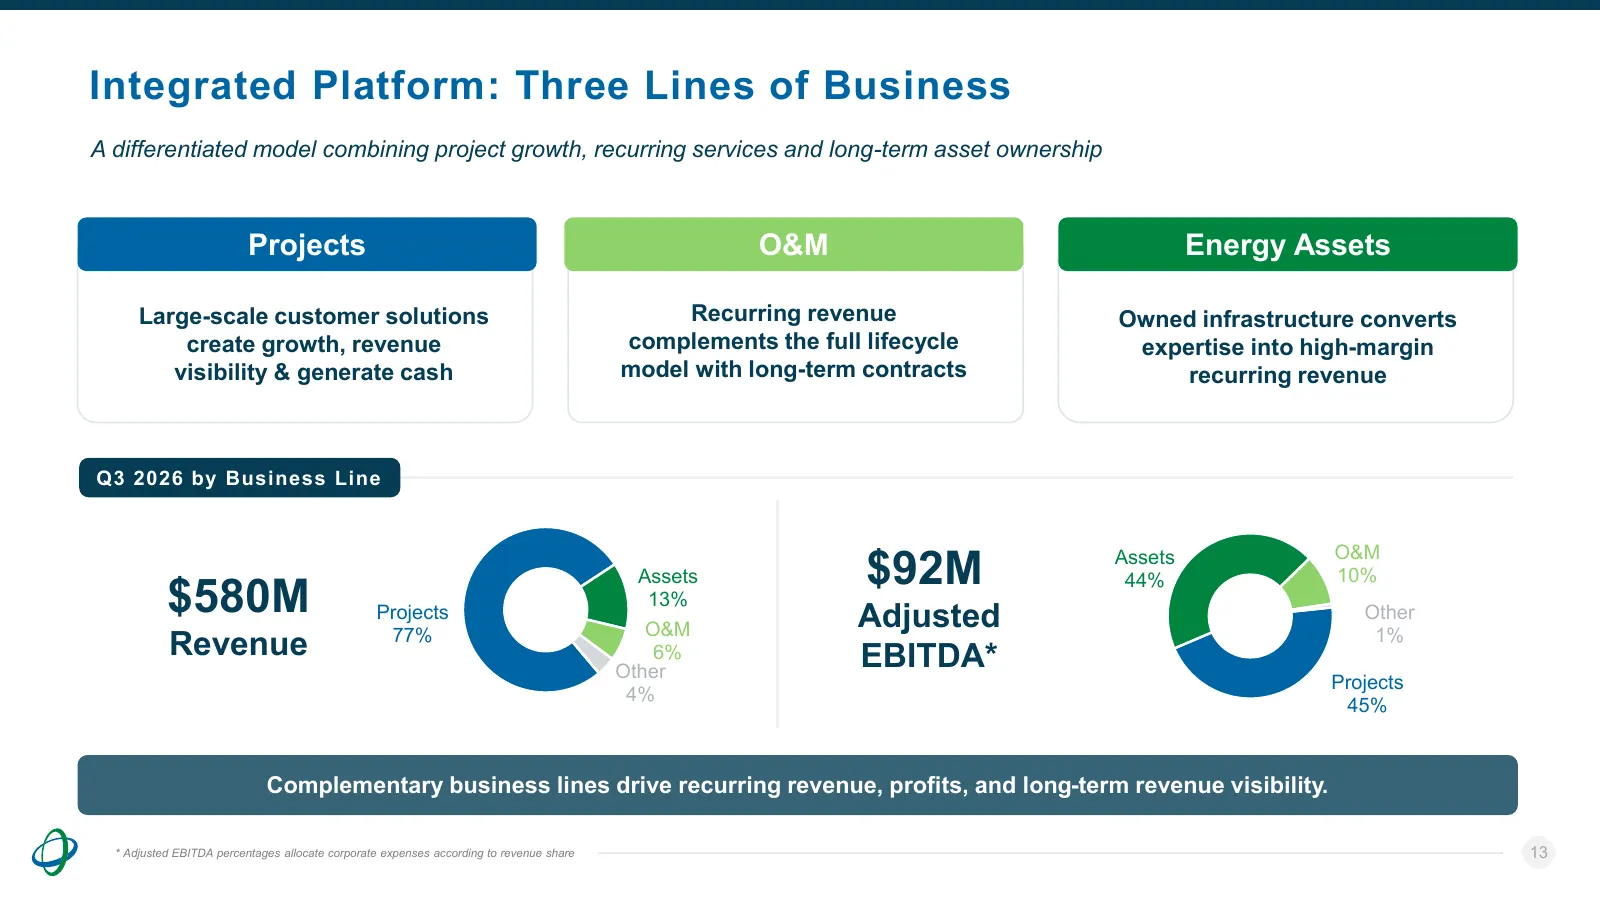
Integrated Platform: Three Lines of Business A differentiated model combining project growth, recurring services and long-term asset ownership Projects O&M Energy Assets Large-scale customer solutions Recurring revenue Owned infrastructure converts create growth, revenue complements the full lifecyc
Slide 14: Project Backlog Funnel with Recurring Revenue Foundation
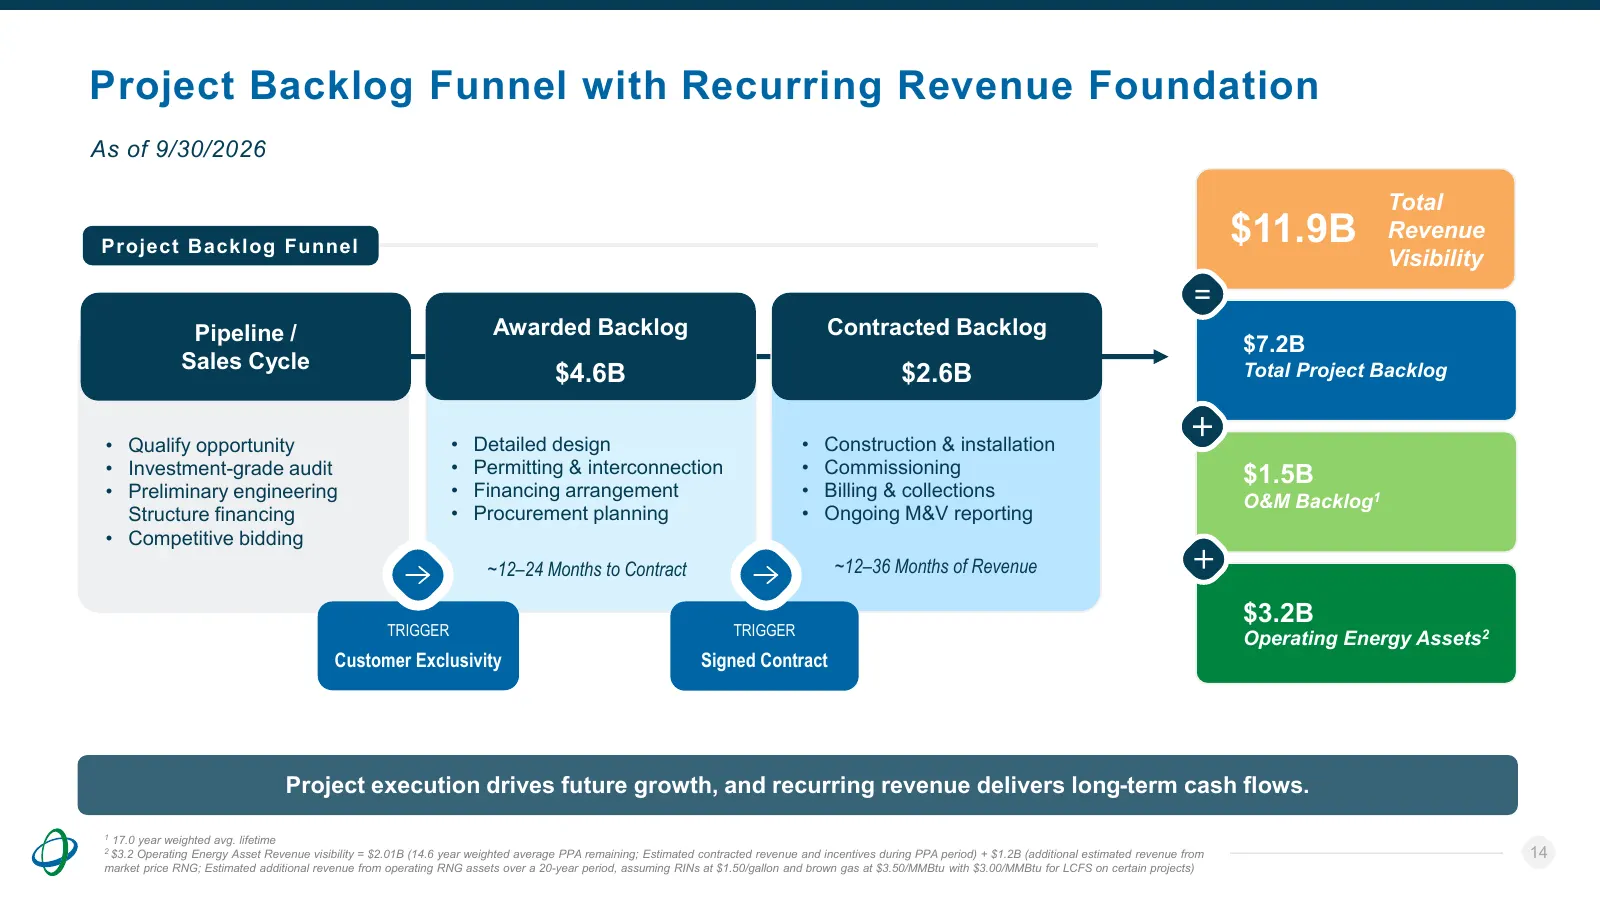
Project Backlog Funnel with Recurring Revenue Foundation As of 9/30/2026 Total Project Backlog Funnel $11.9B Revenue Visibility = Pipeline / Awarded Backlog Contracted Backlog $7.2B Sales Cycle $4.6B $2.6B Total Project Backlog • Qualify opportunity • Detailed design • Construction & installation •
Slide 15: Diversified Total Project Backlog of $7.2B
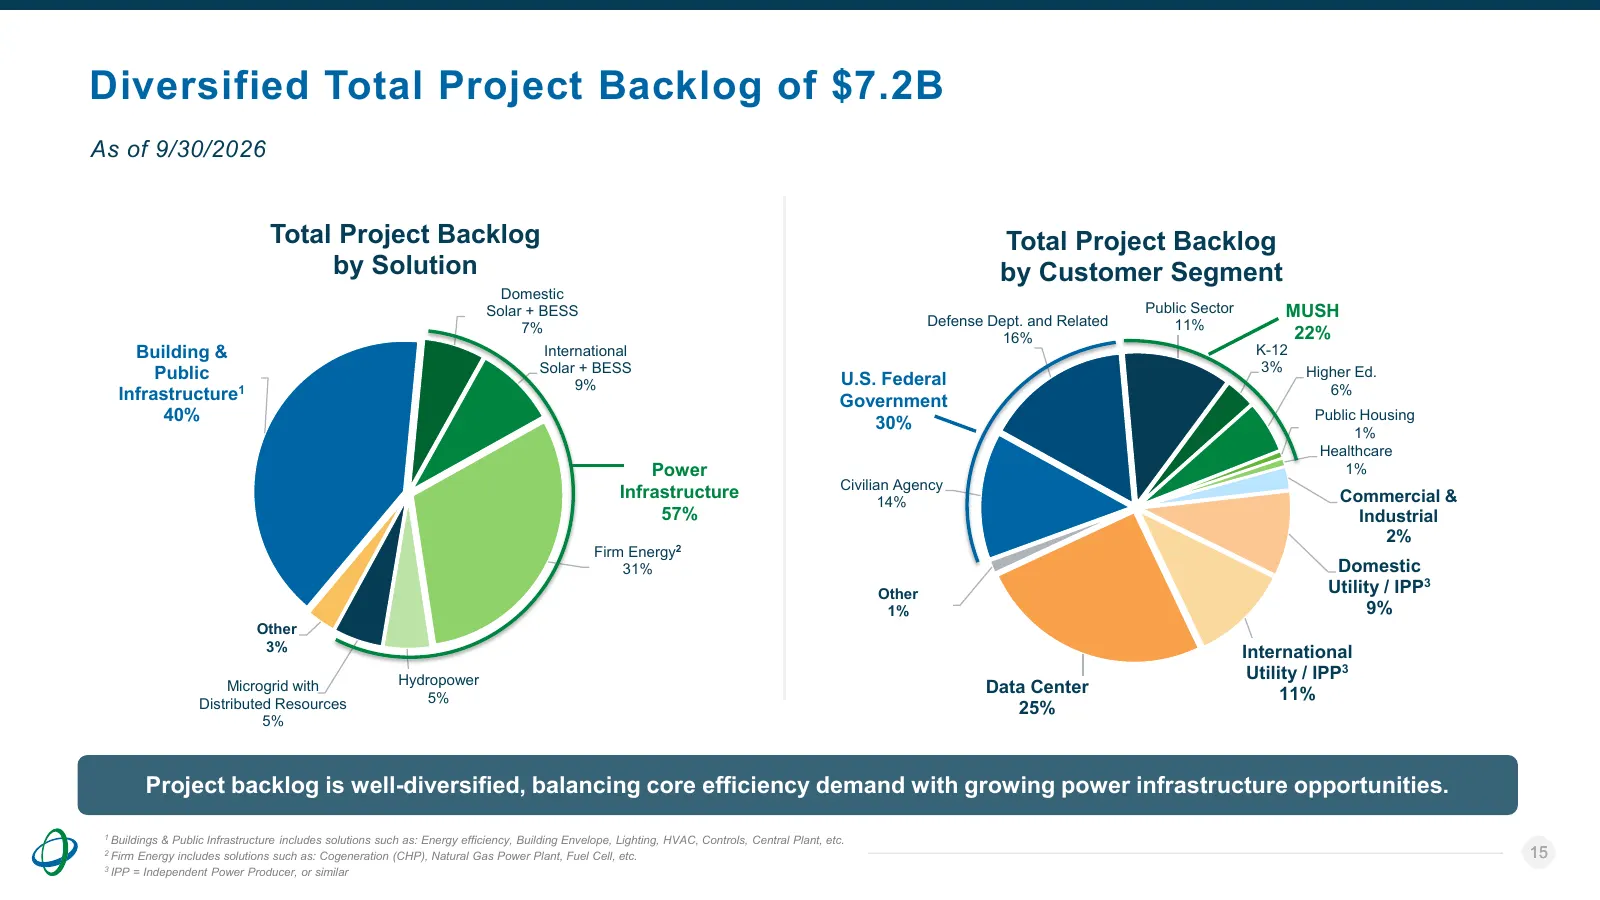
Diversified Total Project Backlog of $7.2B As of 9/30/2026 Total Project Backlog Total Project Backlog by Solution by Customer Segment Domestic Solar + BESS Public Sector MUSH 7% Defense Dept. and Related 11% 16% 22% Building & International K-12 Public Solar + BESS 3% Higher Ed. 9% U.S. Federal Inf
Slide 16: Energy Asset Portfolio – Ameresco's Ownership
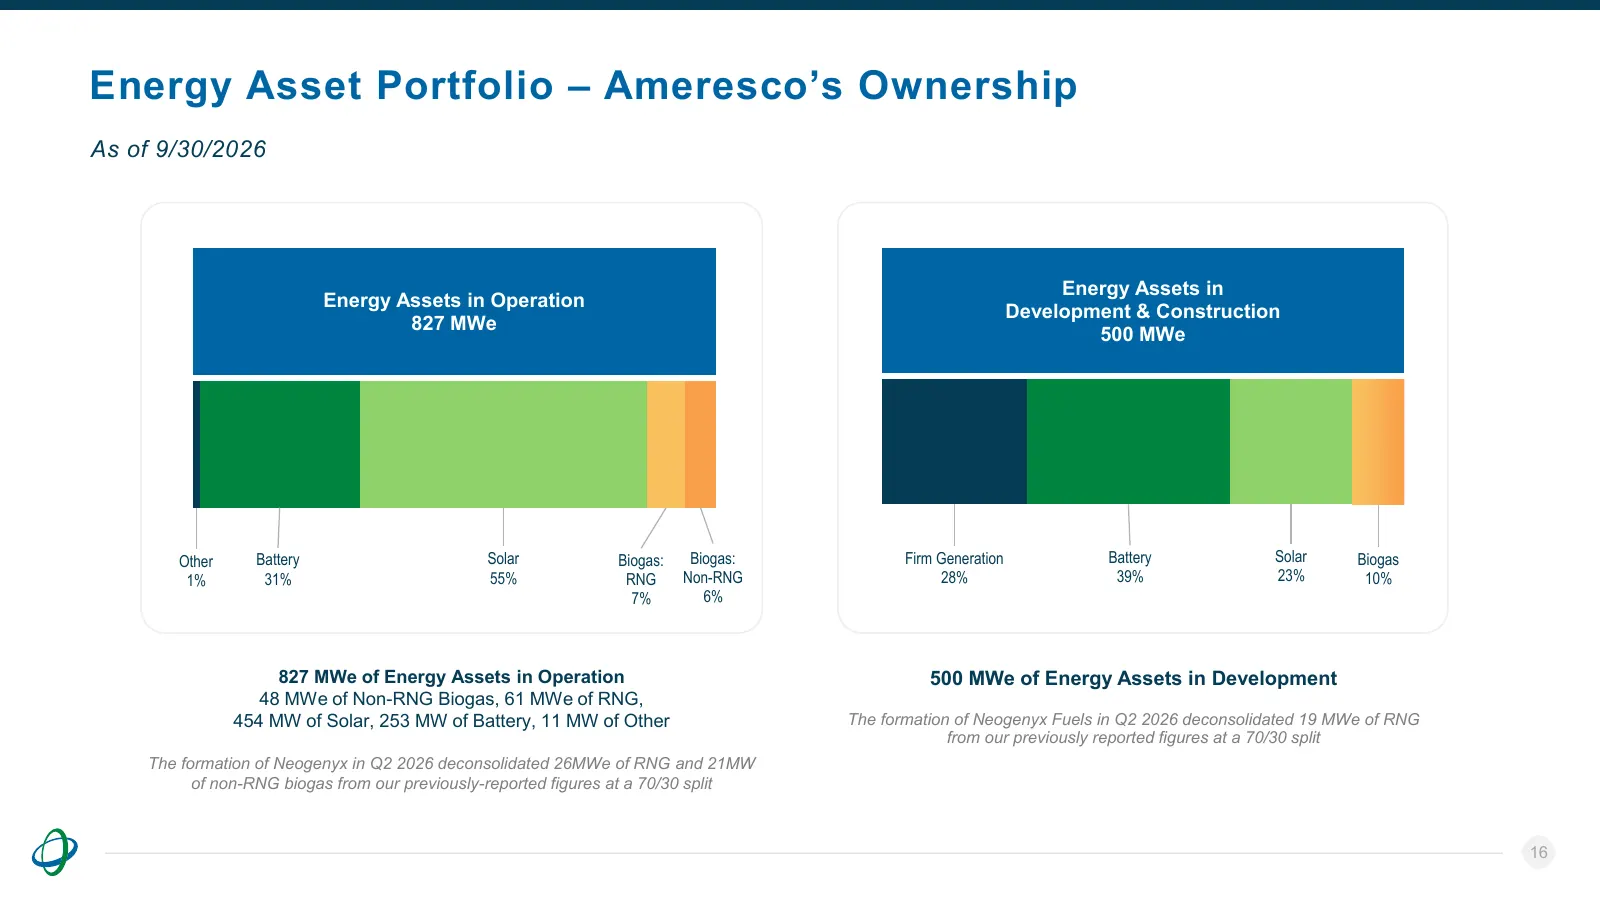
Energy Asset Portfolio – Ameresco’s Ownership As of 9/30/2026 Energy Assets in Energy Assets in Operation Development & Construction 827 MWe 500 MWe Other Battery Solar Biogas: Biogas: Firm Generation Battery Solar Biogas 1% 31% 55% RNG Non-RNG 28% 39% 23% 10% 7% 6% 827 MWe of Energy Assets in Opera
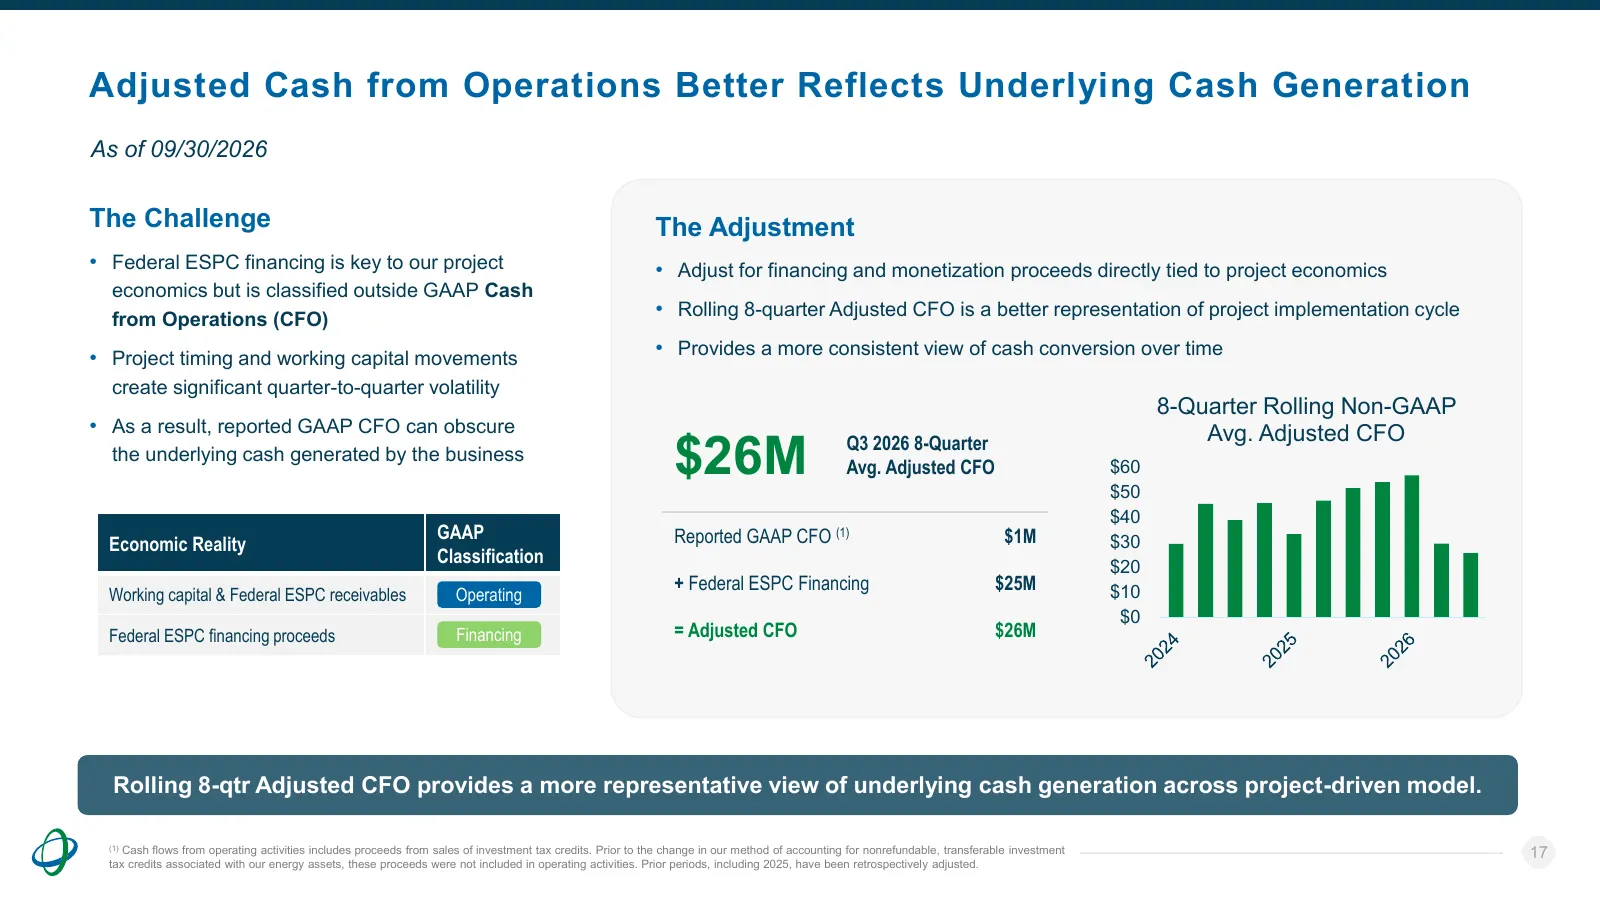
Slide 17: Adjusted Cash from Operations Better Reflects Underlying Cash Generation
Adjusted Cash from Operations Better Reflects Underlying Cash Generation As of 09/30/2026 The Challenge The Adjustment • Federal ESPC financing is key to our project • Adjust for financing and monetization proceeds directly tied to project economics economics but is classified outside GAAP Cash from
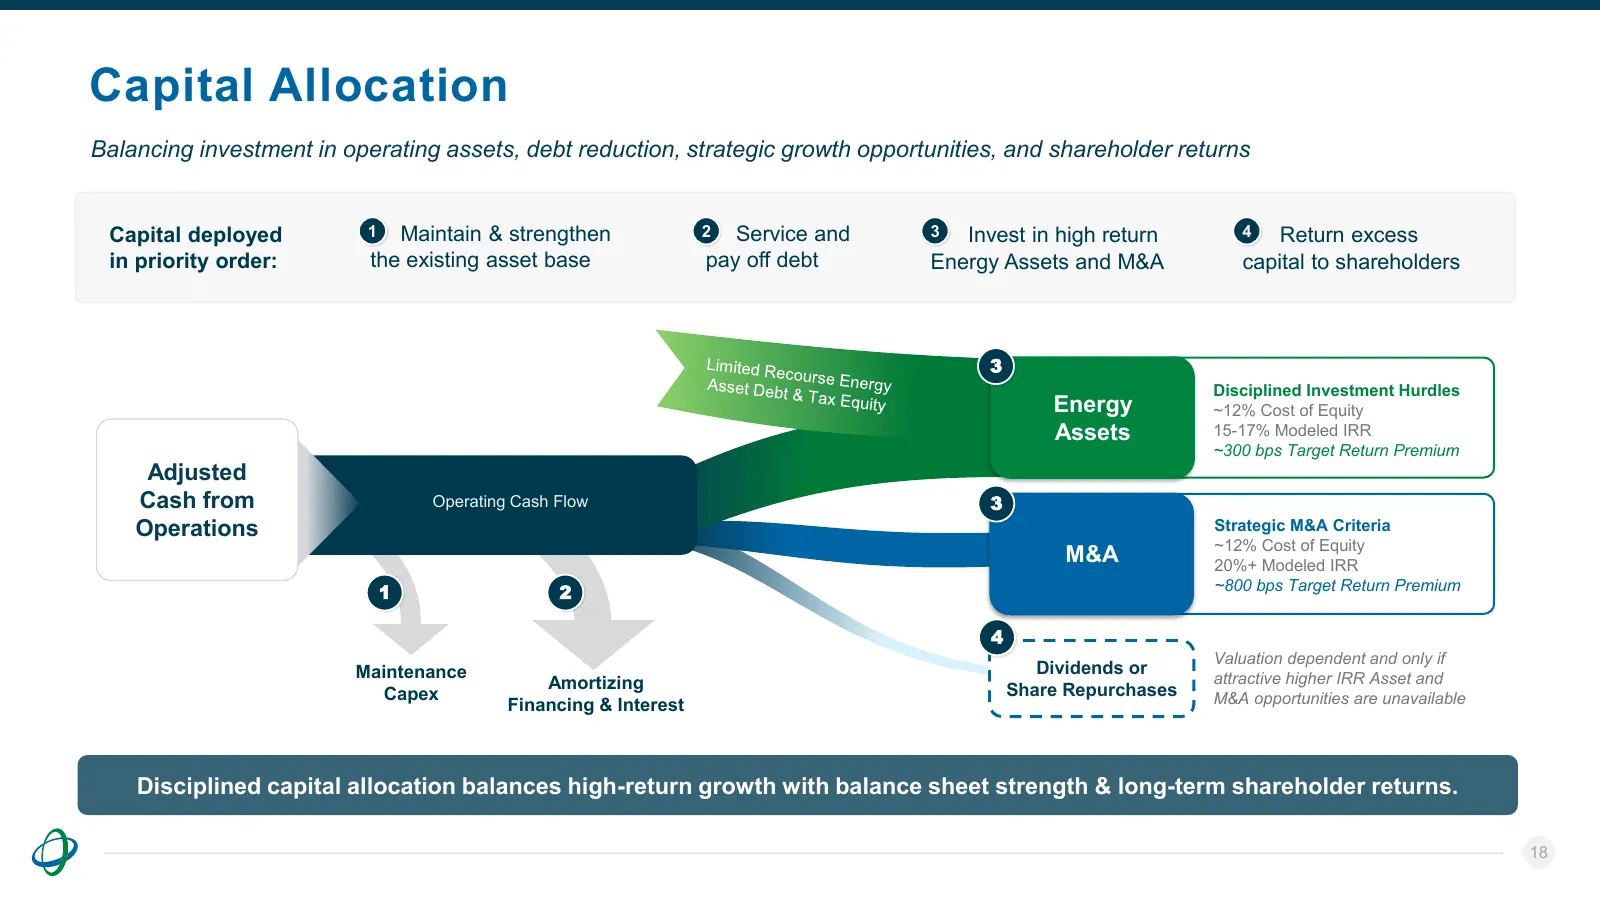
Slide 18: Capital Allocation
Capital Allocation Balancing investment in operating assets, debt reduction, strategic growth opportunities, and shareholder returns Capital deployed 1 Maintain & strengthen 2 Service and 3 Invest in high return 4 Return excess in priority order: the existing asset base pay off debt Energy Assets an
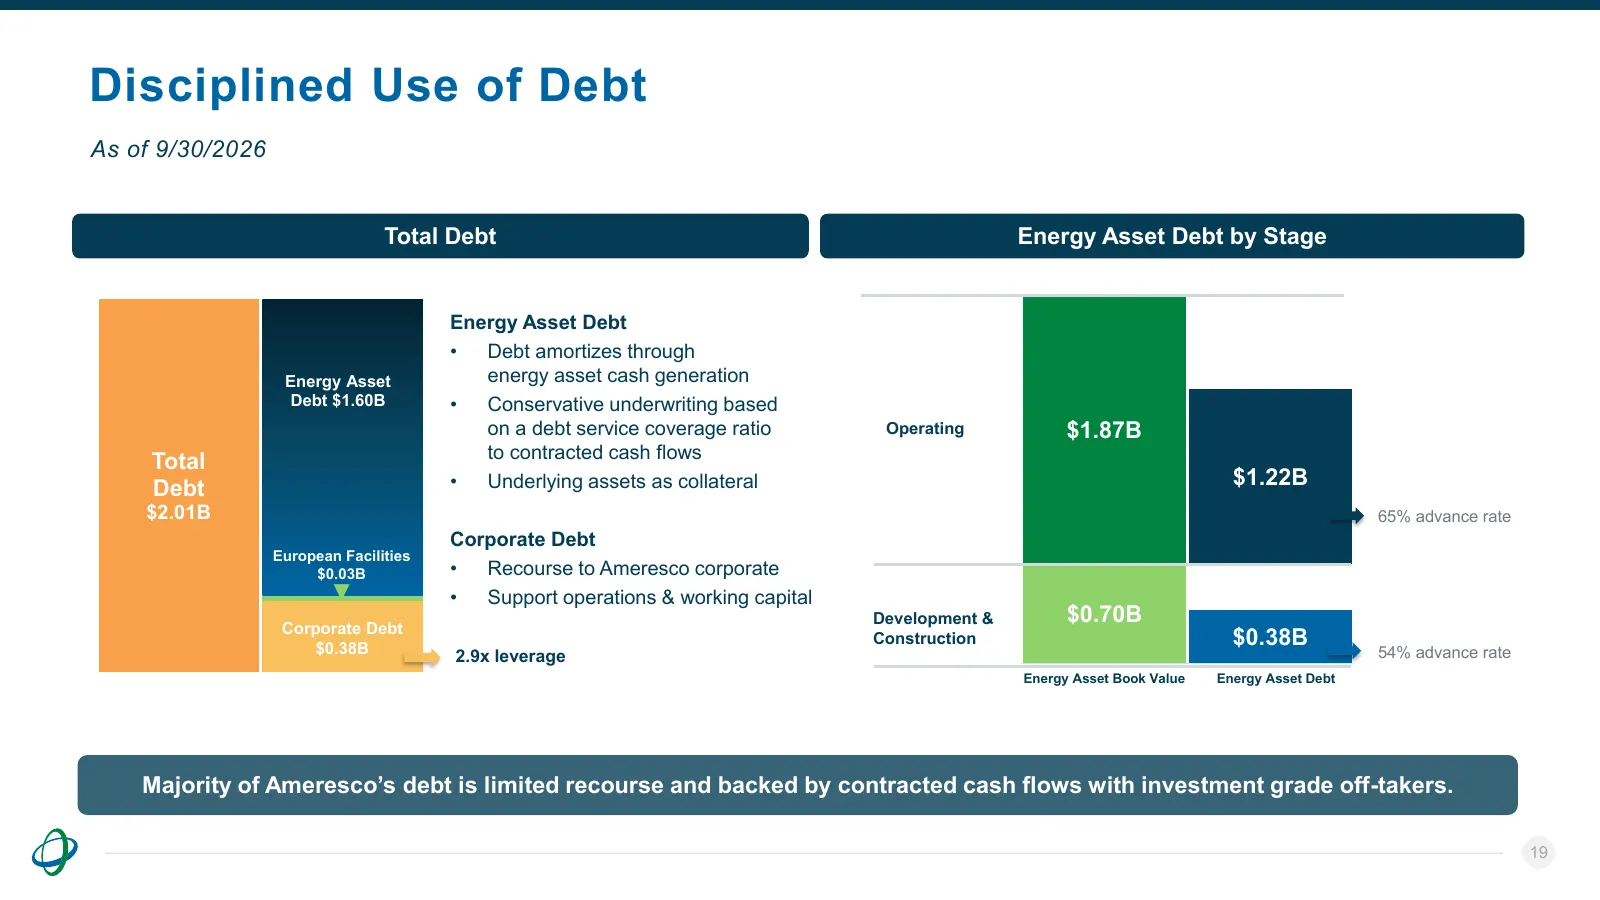
Slide 19: Disciplined Use of Debt
Disciplined Use of Debt As of 9/30/2026 Total Debt Energy Asset Debt by Stage Energy Asset Debt • Debt amortizes through Energy Asset energy asset cash generation Debt $1.60B • Conservative underwriting based on a debt service coverage ratio Operating $1.87B Total to contracted cash flows Debt • Und
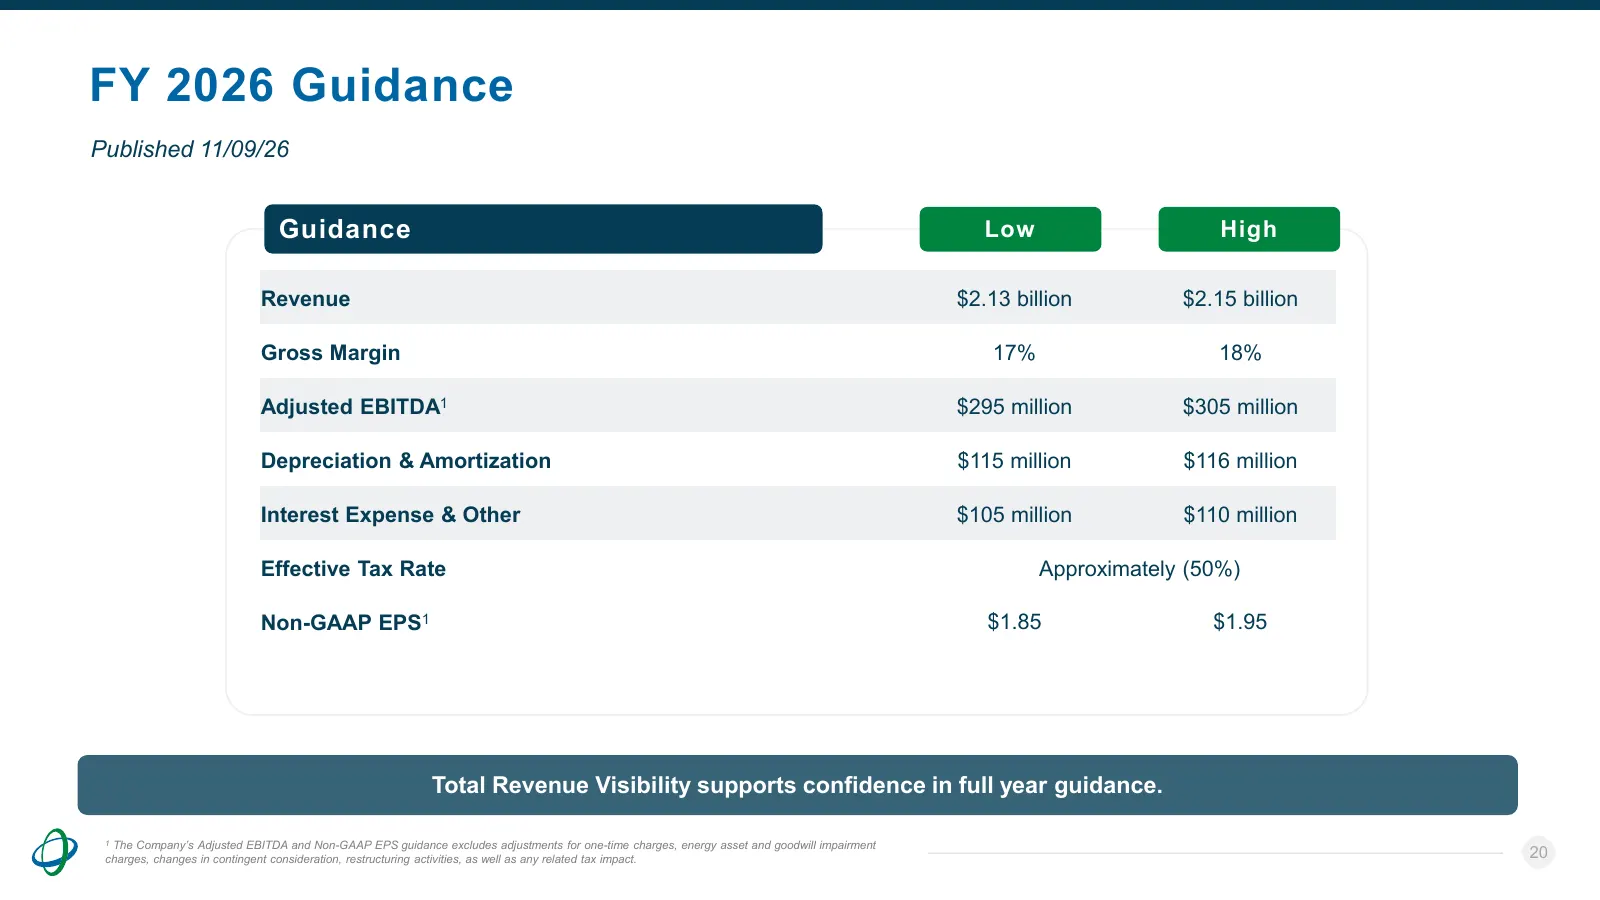
Slide 20: FY 2026 Guidance
FY 2026 Guidance Published 11/09/26 Guidance Low High Revenue $2.13 billion $2.15 billion Gross Margin 17% 18% Adjusted EBITDA1 $295 million $305 million Depreciation & Amortization $115 million $116 million Interest Expense & Other $105 million $110 million Effective Tax Rate Approximately (50%) No
Slide 21: Long-Term Value Creation
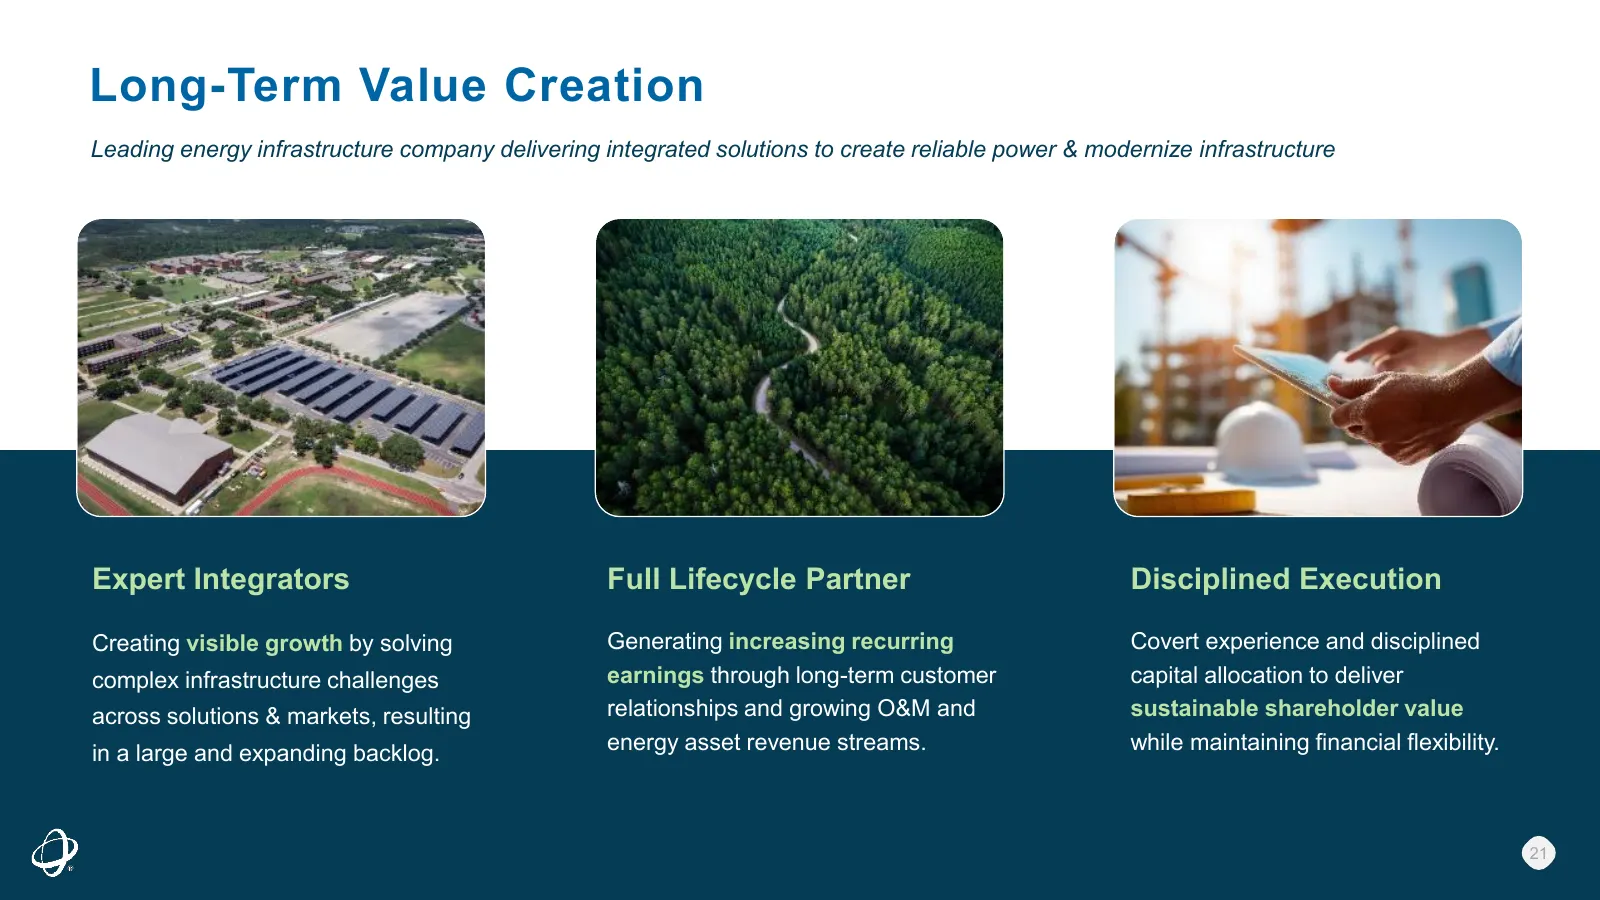
Long-Term Value Creation Leading energy infrastructure company delivering integrated solutions to create reliable power & modernize infrastructure Expert Integrators Full Lifecycle Partner Disciplined Execution Creating visible growth by solving Generating increasing recurring Covert experience and
Slide 22: Leading energy infrastructure company delivering integrated solutions
Leading energy infrastructure company delivering integrated solutions to provide reliable power & modernize infrastructure. NYSE: AMRC © 2026 Ameresco, Inc. All rights reserved. ameresco.com
Slide 23: Appendix
Appendix 23
Slide 24: Industry Recognition & Acclaim
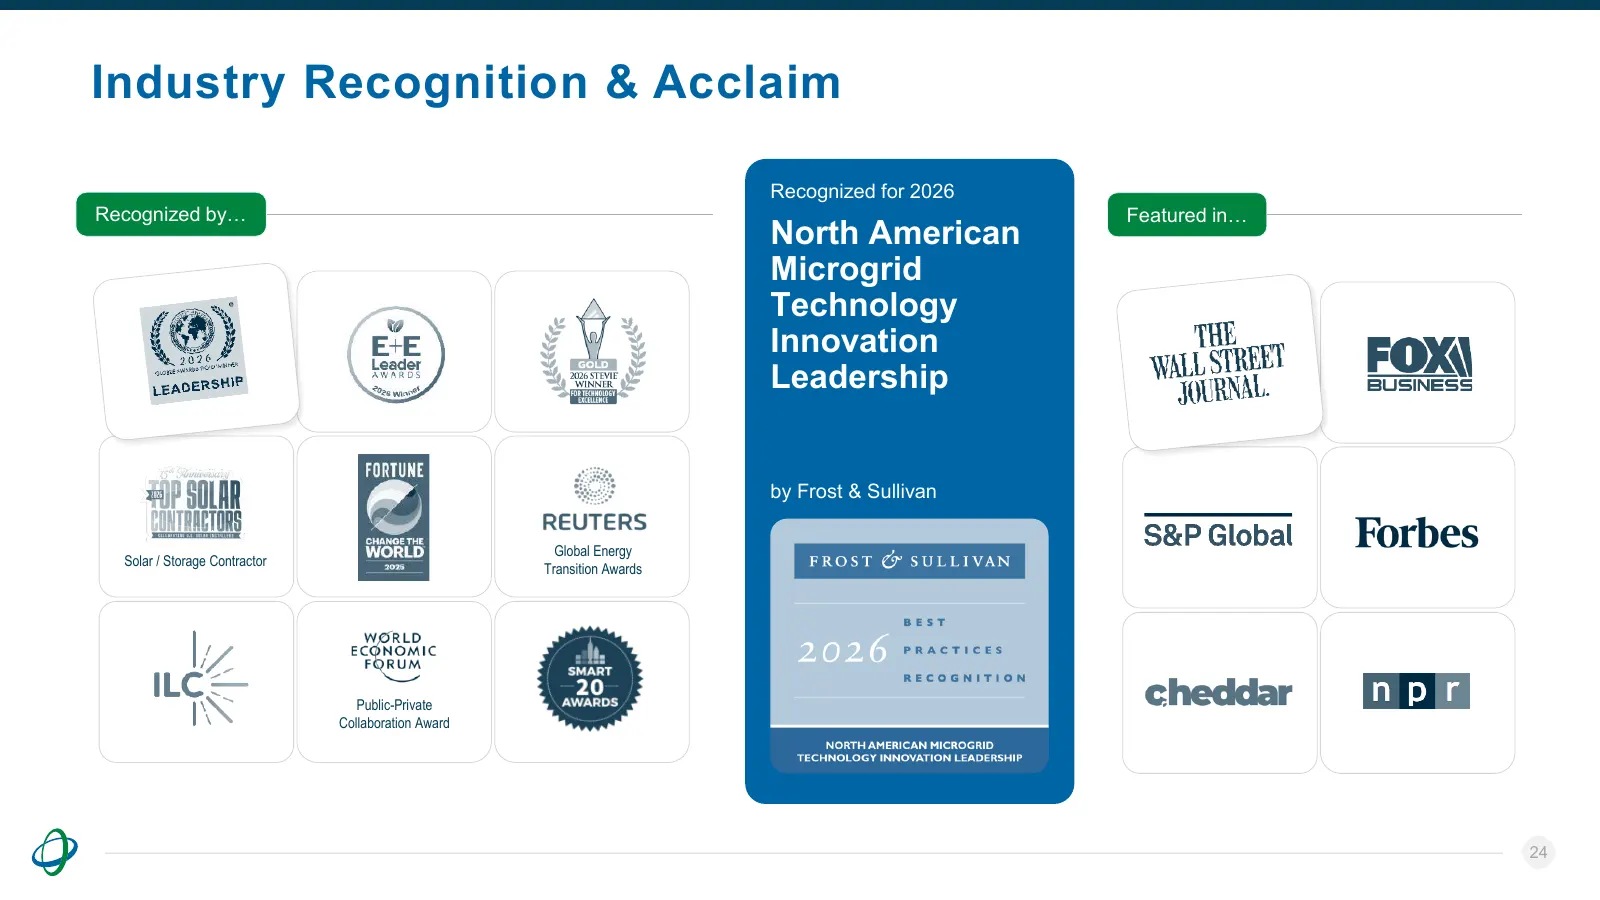
Industry Recognition & Acclaim Recognized for 2026 Recognized by… Featured in… North American Microgrid Technology The Wall Street Journal Logo - Newfound Research Innovation Fox Business - Wikipedia Leadership A blue rectangular sign with white text AI-generated content may be incorrect. by Frost &
Slide 25: Building Value with Performance Contracting
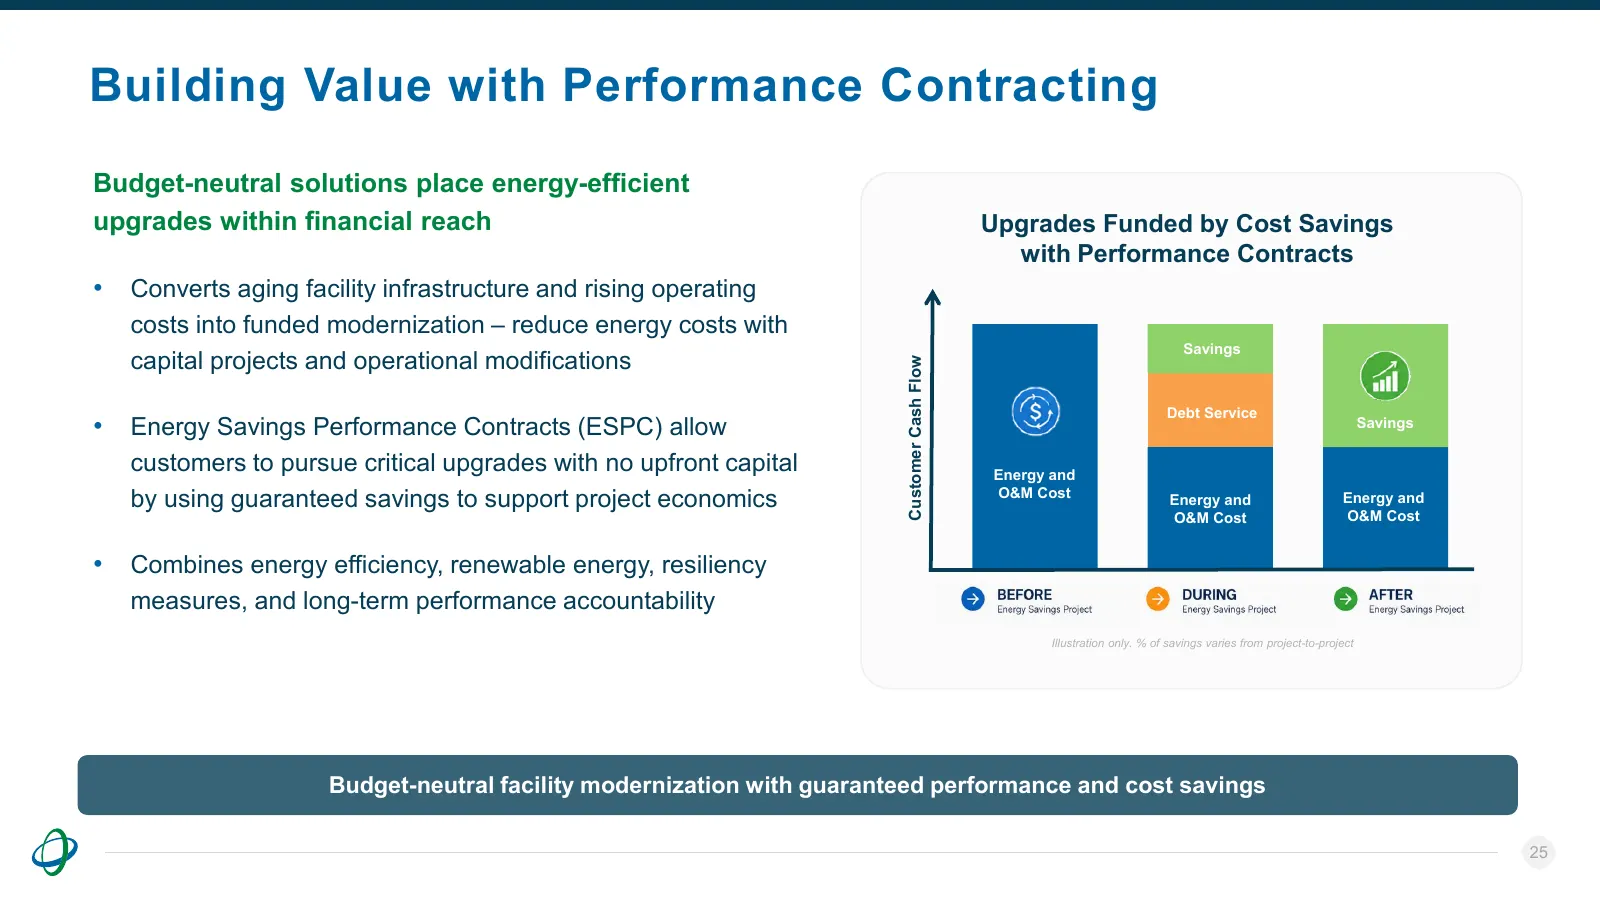
Building Value with Performance Contracting Budget-neutral solutions place energy-efficient upgrades within financial reach Upgrades Funded by Cost Savings with Performance Contracts • Converts aging facility infrastructure and rising operating costs into funded modernization – reduce energy costs w
Slide 26: Our Vision to Energize a Sustainable World
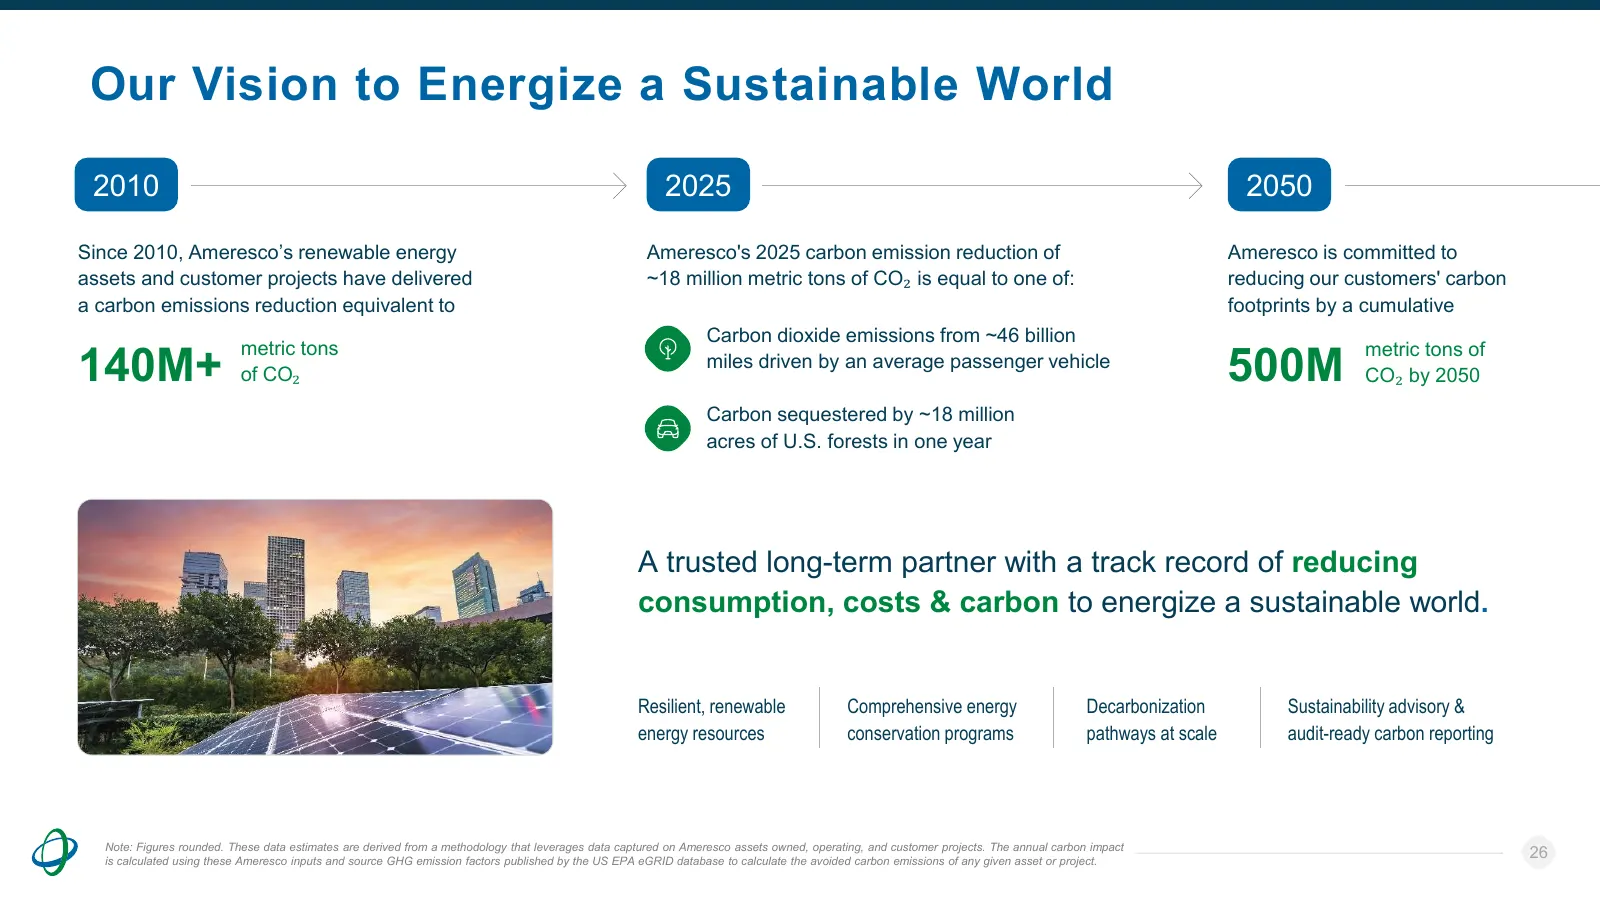
Our Vision to Energize a Sustainable World 2010 2025 2050 Since 2010, Ameresco’s renewable energy Ameresco's 2025 carbon emission reduction of Ameresco is committed to assets and customer projects have delivered ~18 million metric tons of CO₂ is equal to one of: reducing our customers' carbon a carb
Slide 27: Doing Well by Doing Good
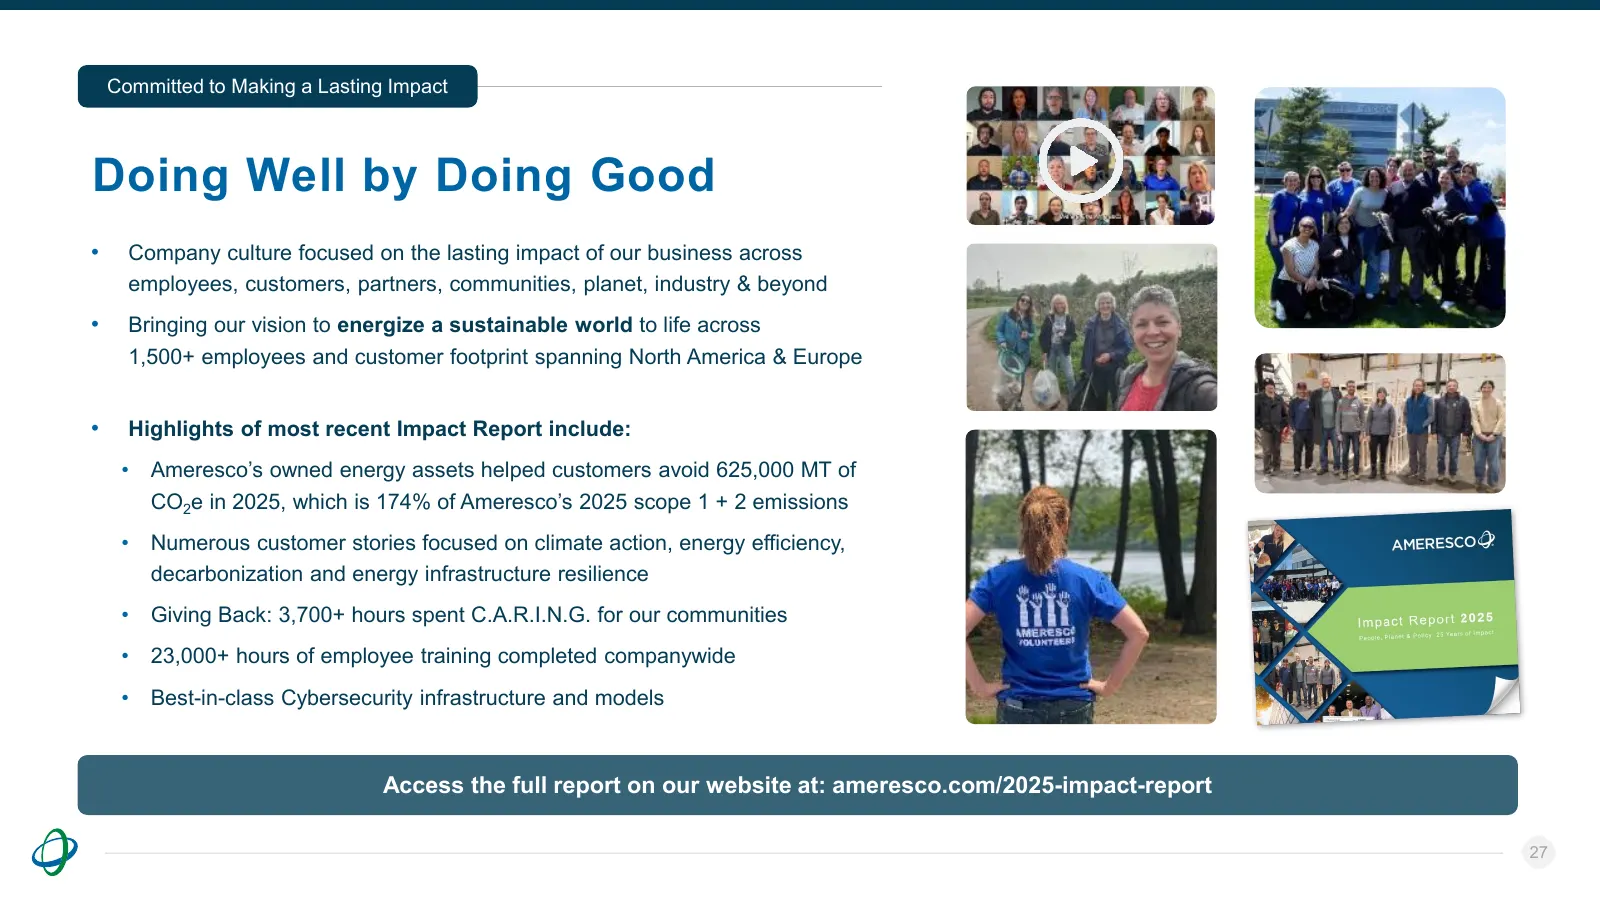
Committed to Making a Lasting Impact Doing Well by Doing Good • Company culture focused on the lasting impact of our business across employees, customers, partners, communities, planet, industry & beyond • Bringing our vision to energize a sustainable world to life across 1,500+ employees and custom
Slide 28: Non-GAAP Financial Measures
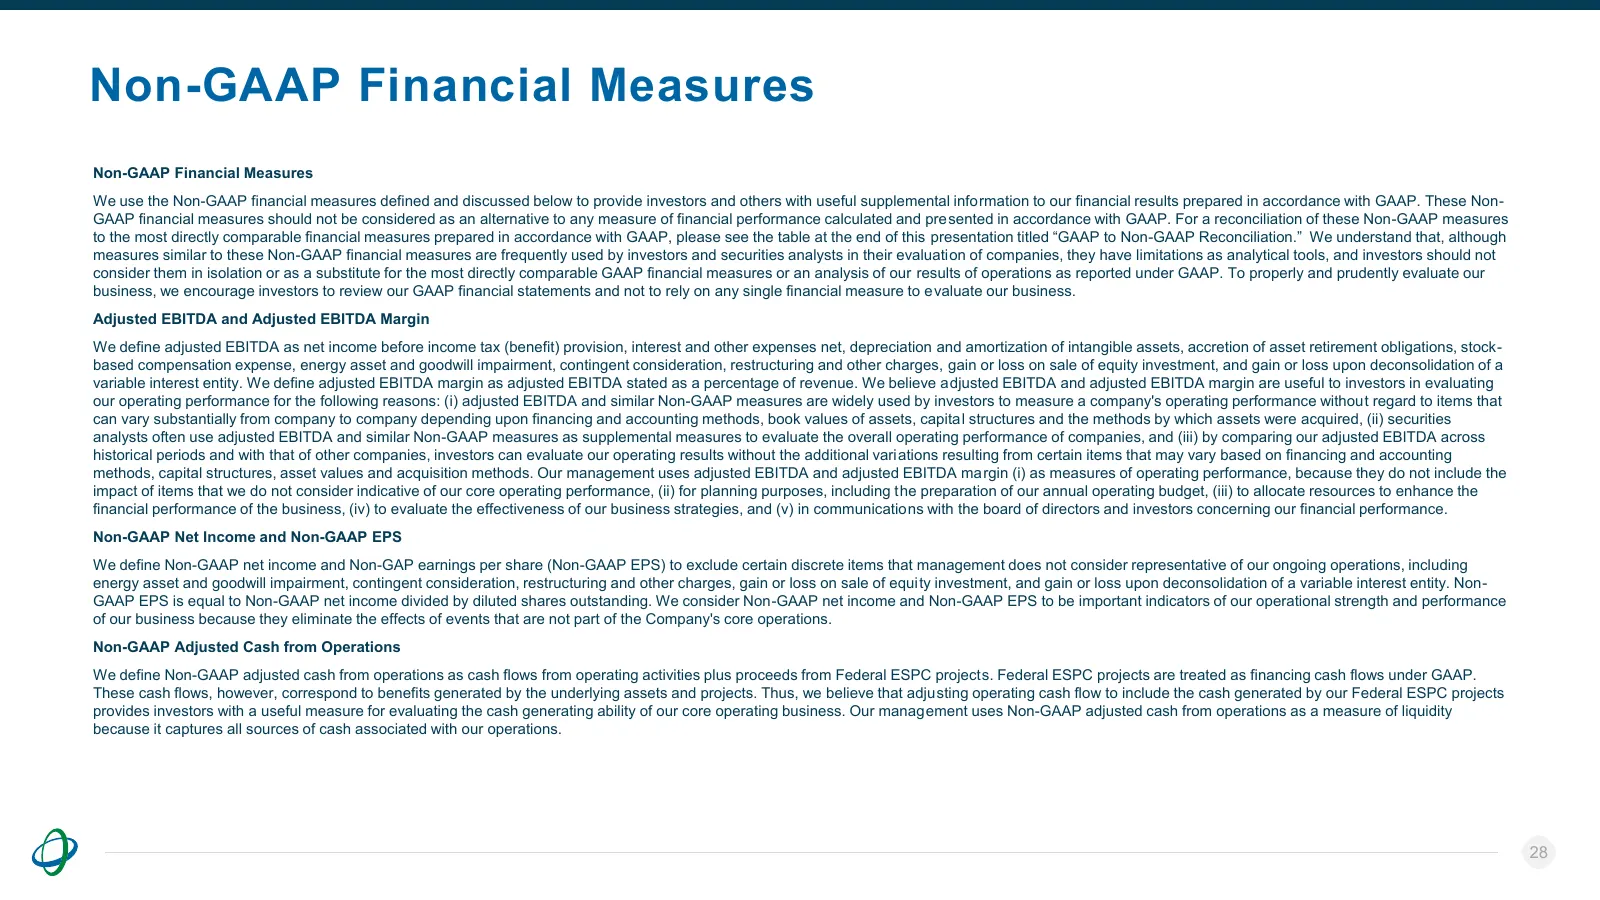
Non-GAAP Financial Measures Non-GAAP Financial Measures We use the Non-GAAP financial measures defined and discussed below to provide investors and others with useful supplemental information to our financial results prepared in accordance with GAAP. These Non- GAAP financial measures should not be
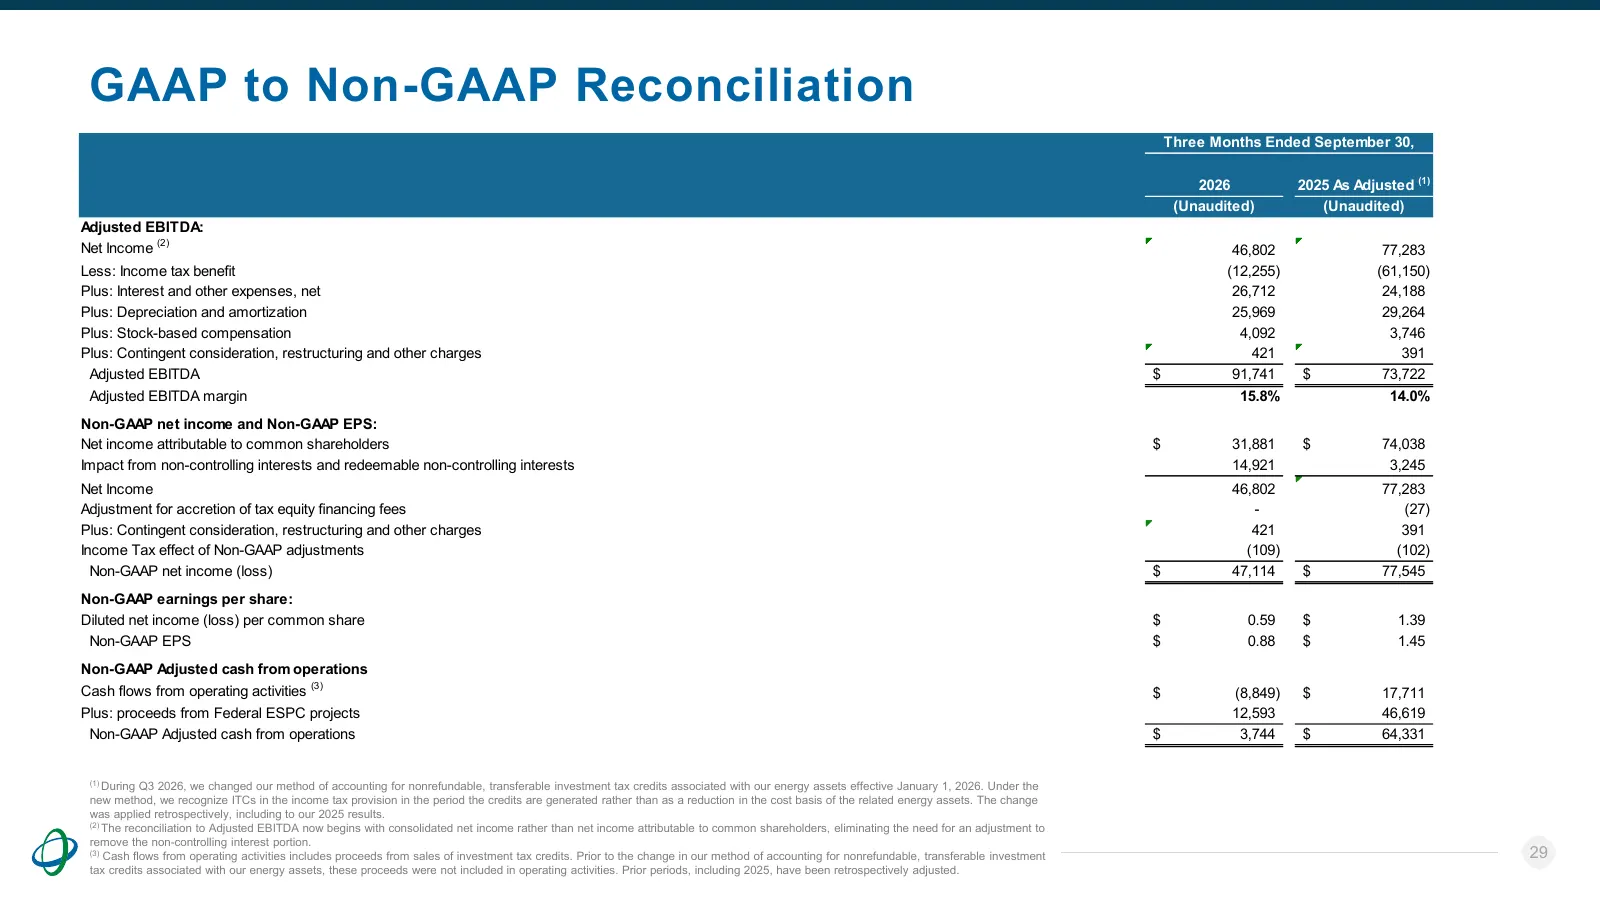
Slide 29: GAAP to Non-GAAP Reconciliation
GAAP to Non-GAAP Reconciliation Three Months Ended September 30, 2026 2025 As Adjusted (1) (Unaudited) (Unaudited) Adjusted EBITDA: Net Income (2) 46,802 77,283 Less: Income tax benefit (12,255) (61,150) Plus: Interest and other expenses, net 26,712 24,188 Plus: Depreciation and amortization 25,969
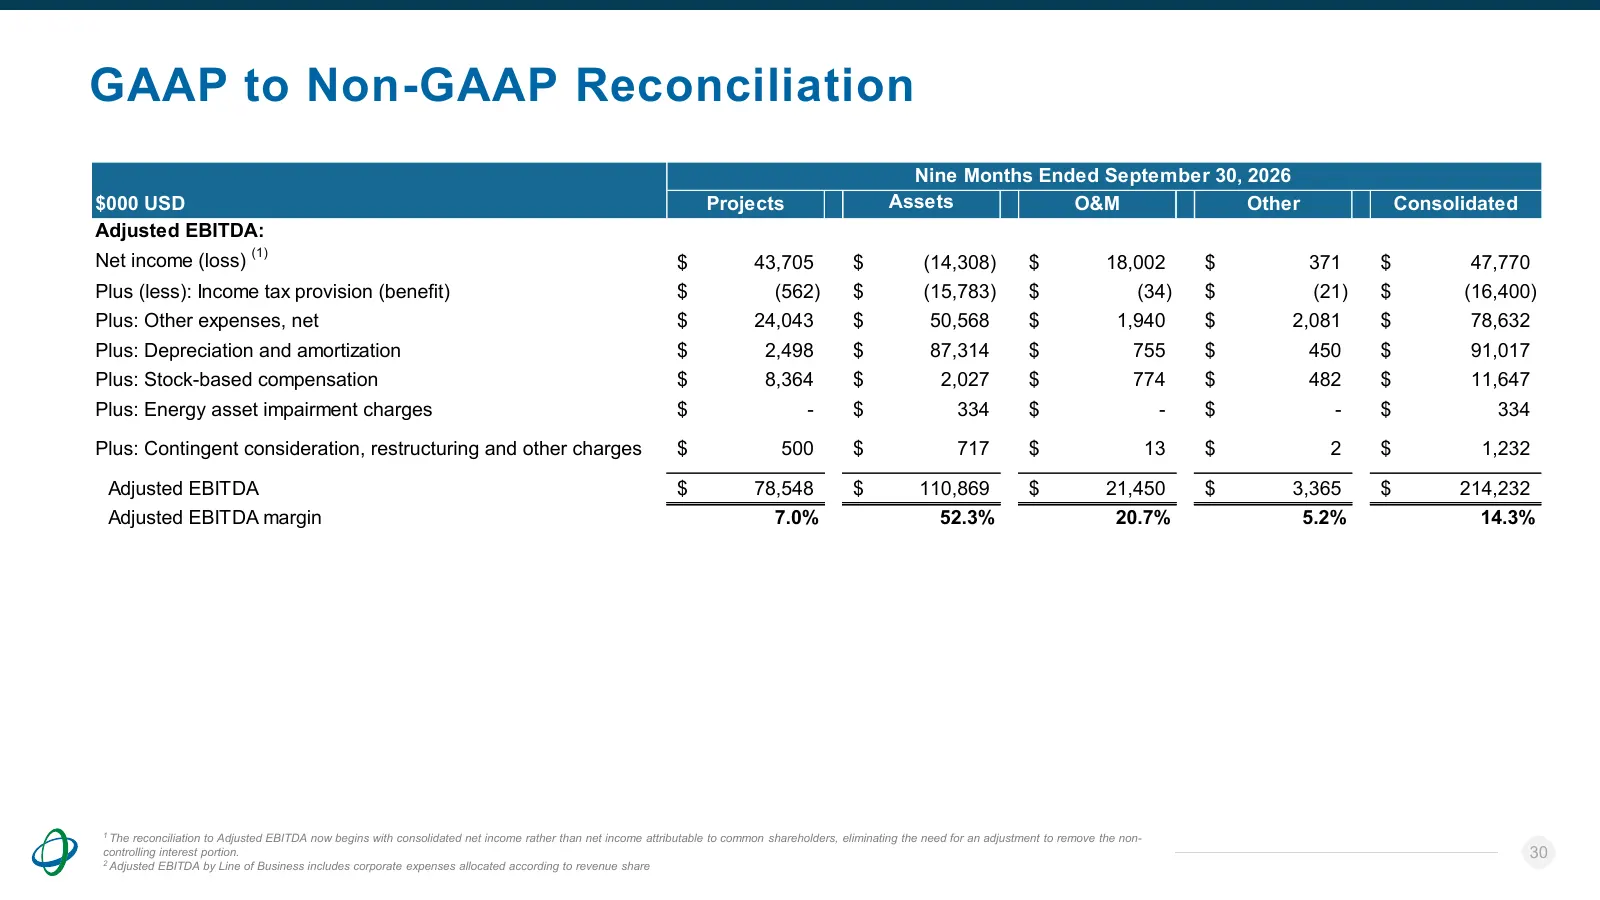
Slide 30: GAAP to Non-GAAP Reconciliation
GAAP to Non-GAAP Reconciliation Nine Months Ended September 30, 2026 Operating $000 USD Projects Assets O&M Other Consolidated Adjusted EBITDA: (1) Net income (loss) $ 43,705 $ (14,308) $ 18,002 $ 371 $ 47,770 Plus (less): Income tax provision (benefit) $ (562) $ (15,783) $ (34) $ (21) $ (16,400) Pl
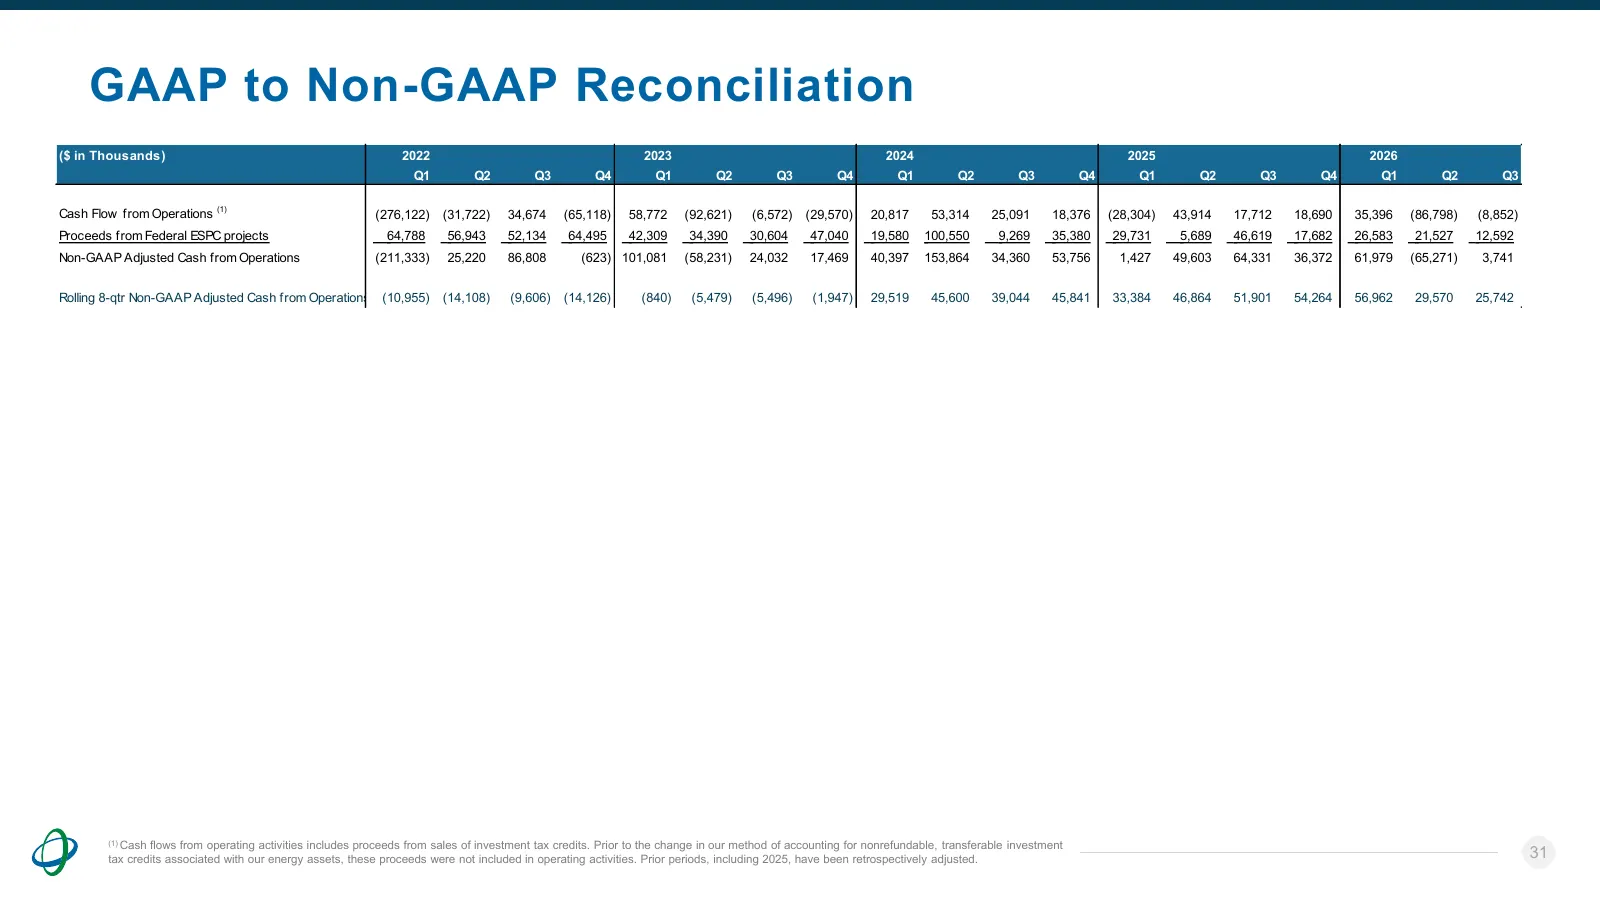
Slide 31: GAAP to Non-GAAP Reconciliation
GAAP to Non-GAAP Reconciliation ($ in Thousands) 2022 2023 2024 2025 2026 Q1 Q2 Q3 Q4 Q1 Q2 Q3 Q4 Q1 Q2 Q3 Q4 Q1 Q2 Q3 Q4 Q1 Q2 Q3 Cash Flow from Operations (1) (276,122) (31,722) 34,674 (65,118) 58,772 (92,621) (6,572) (29,570) 20,817 53,314 25,091 18,376 (28,304) 43,914 17,712 18,690 35,396 (86,79
Source: company website
More decks from Ameresco, Inc.
 Q3 2026 Earnings Presentation14 slides · Nov 9, 2026
 Q2 2026 Earnings Presentation15 slides · Aug 3, 2026
 Investor Presentation (August 2026)34 slides · August 2026
 Q1 2026 Earnings Presentation19 slides · May 4, 2026
 Q4 2025 Earnings Presentation16 slides · Mar 2, 2026
 Q3 2025 Earnings Presentation16 slides · Nov 3, 2025