Mariner Energy — FBR Conference Call (April 2007)
34 slides from Mariner Energy's conference presentation, Apr 20, 2007
Slide 1: FBR Conference Call Presentation
FBR Conference Call Presentation Mariner Energy, Inc. April 20, 2007
Slide 2: Disclosure
Disclosure This presentation includes forward-looking statements within the meaning of Section 27A of the Securities Act of 1933 and Section 21E of the Securities Exchange Act of 1934. All statements, other than statements of historical facts, that address activities that Mariner assumes, plans, exp
Slide 3: GOM Opportunity
GOM Opportunity ~850,000 net acres 120+ prospects, ~4 year inventory Access to 7,000 blocks recent vintage 3-D seismic data Large scale GOM lease sales Underexploited shelf assets Successful track record Experienced staff
Slide 4: Prospect Inventory
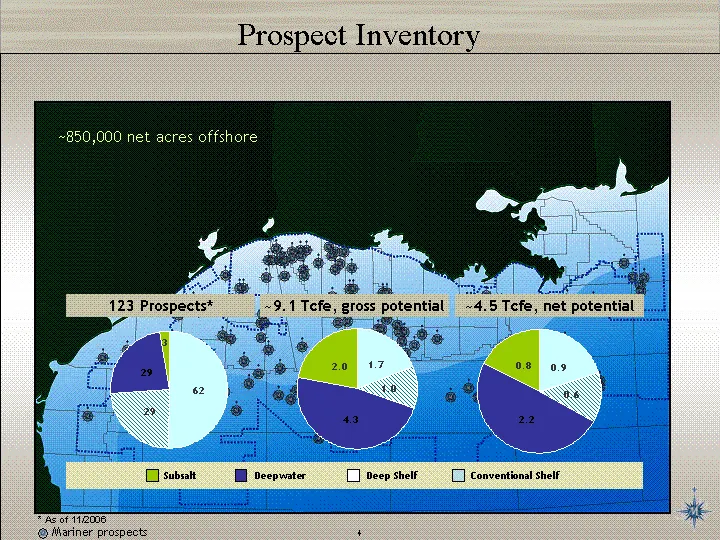
Prospect Inventory Conventional Shelf Deep Shelf Deepwater Sub-Salt Type 1.726 1.024 4.33 1.991 ~850,000 net acres offshore Deep Shelf Deepwater Subsalt Conventional Shelf 123 Prospects* ~9.1 Tcfe, gross potential ~4.5 Tcfe, net potential Mariner prospects Conventional Shelf Deep Shelf Deepwater Sub
Slide 5: Prospect Inventory - Deep Shelf
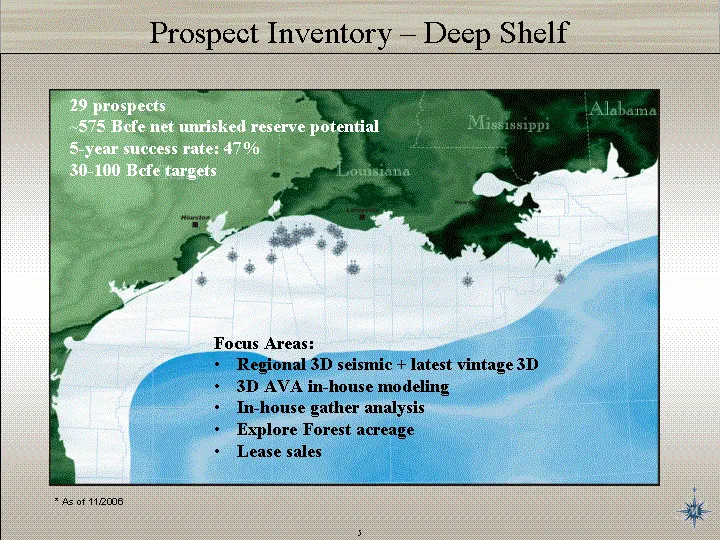
Prospect Inventory - Deep Shelf 29 prospects ~575 Bcfe net unrisked reserve potential 5-year success rate: 47% 30-100 Bcfe targets Focus Areas: Regional 3D seismic + latest vintage 3D 3D AVA in-house modeling In-house gather analysis Explore Forest acreage Lease sales * As of 11/2006
Slide 6: Prospect Inventory - Conventional Deepwater
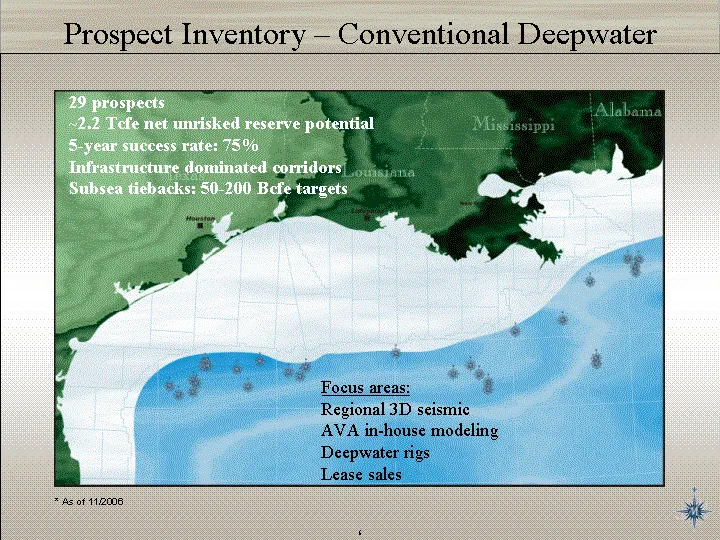
Prospect Inventory - Conventional Deepwater 29 prospects ~2.2 Tcfe net unrisked reserve potential 5-year success rate: 75% Infrastructure dominated corridors Subsea tiebacks: 50-200 Bcfe targets Focus areas: Regional 3D seismic AVA in-house modeling Deepwater rigs Lease sales * As of 11/2006
Slide 7: Prospect Inventory - Subsalt
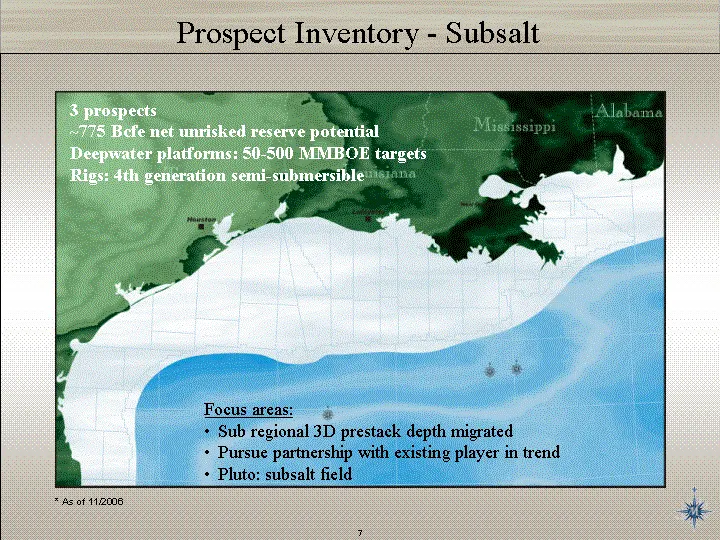
Prospect Inventory - Subsalt 3 prospects ~775 Bcfe net unrisked reserve potential Deepwater platforms: 50-500 MMBOE targets Rigs: 4th generation semi-submersible Focus areas: Sub regional 3D prestack depth migrated Pursue partnership with existing player in trend Pluto: subsalt field * As of 11/2006
Slide 8: Access to over 7,000 blocks recent vintage 3D seismic data
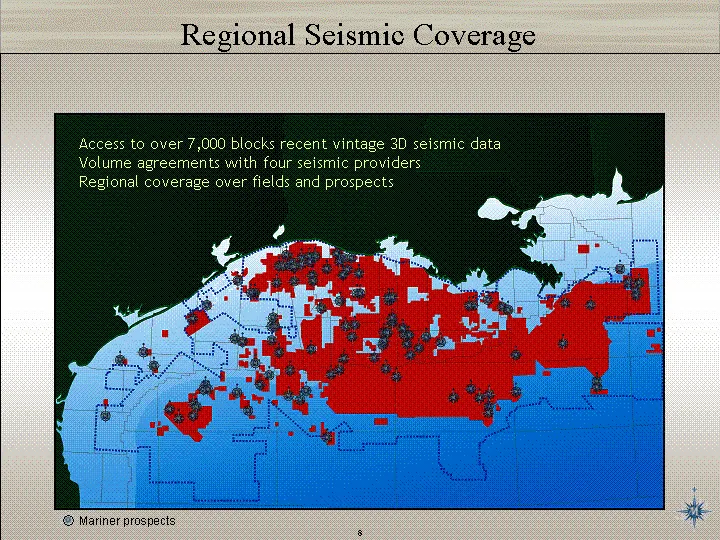
Access to over 7,000 blocks recent vintage 3D seismic data Volume agreements with four seismic providers Regional coverage over fields and prospects Mariner prospects Mariner prospects Regional Seismic Coverage
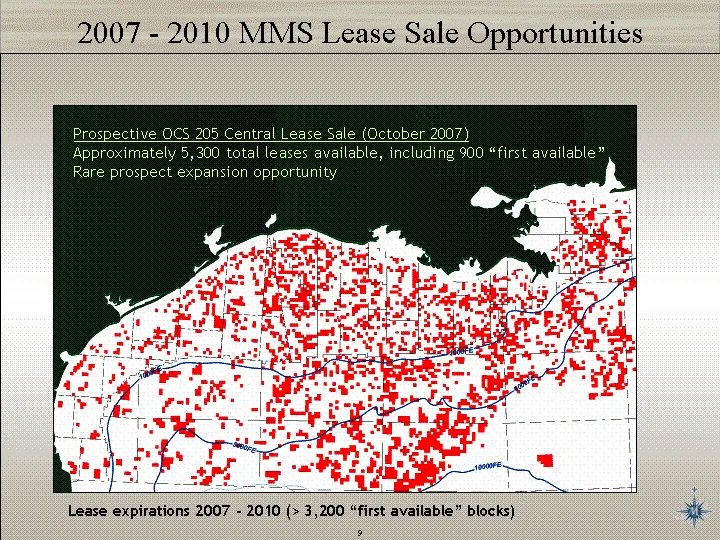
Slide 9: 2007 - 2010 MMS Lease Sale Opportunities
2007 - 2010 MMS Lease Sale Opportunities Lease expirations 2007 - 2010 (> 3,200 "first available" blocks) Lease expirations 2007 - 2010 (> 3,200 "first available" blocks) Prospective OCS 205 Central Lease Sale (October 2007) Approximately 5,300 total leases available, including 900 "first available"
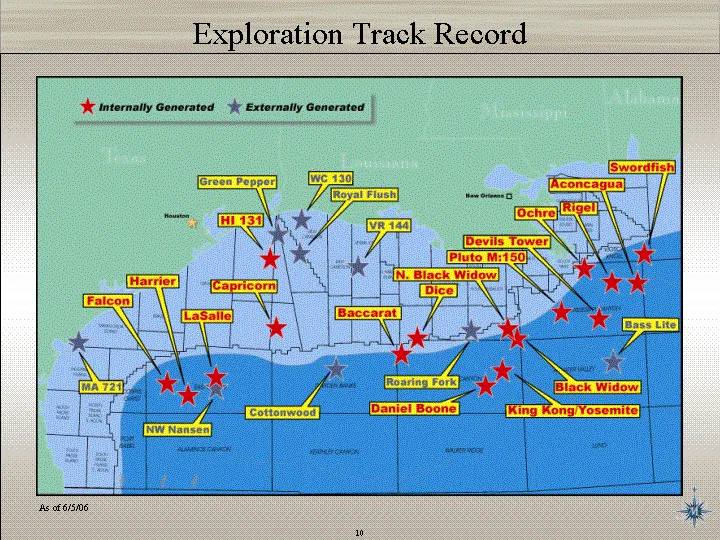
Slide 10: Exploration Track Record
Exploration Track Record Exploration Track Record As of 6/5/06
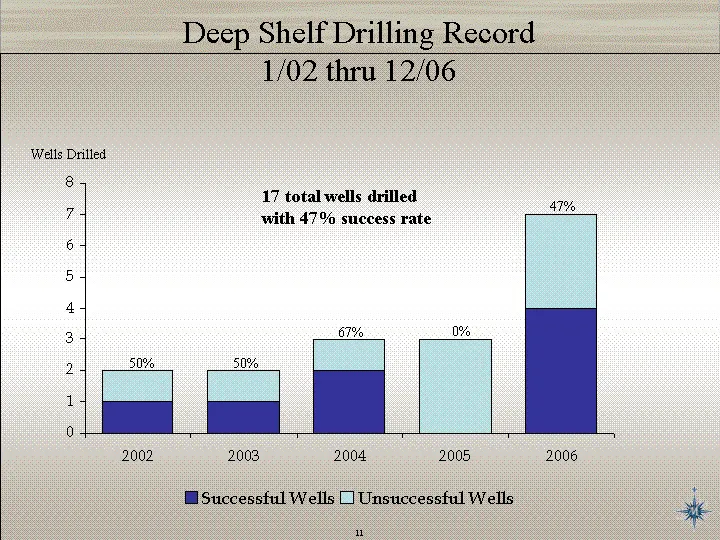
Slide 11: Deep Shelf Drilling Record
Deep Shelf Drilling Record 1/02 thru 12/06 2002 2003 2004 2005 2006 Successful Wells 1 1 2 0 4 Unsuccessful Wells 1 1 1 3 3 0% 50% 47% 50% 67% 17 total wells drilled with 47% success rate Wells Drilled
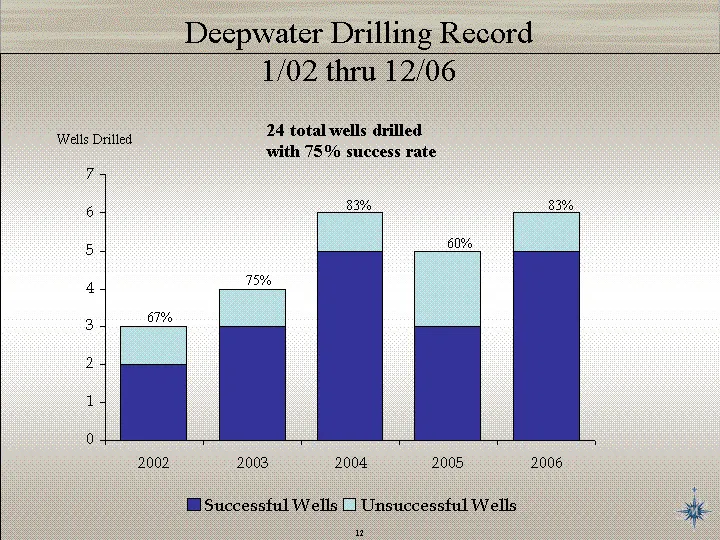
Slide 12: Deepwater Drilling Record
Deepwater Drilling Record 1/02 thru 12/06 2002 2003 2004 2005 2006 Successful Wells 2 3 5 3 5 Unsuccessful Wells 1 1 1 2 1 83% 60% 83% 75% 67% 24 total wells drilled with 75% success rate Wells Drilled
Slide 13: Gulf of Mexico - Total Net Acreage
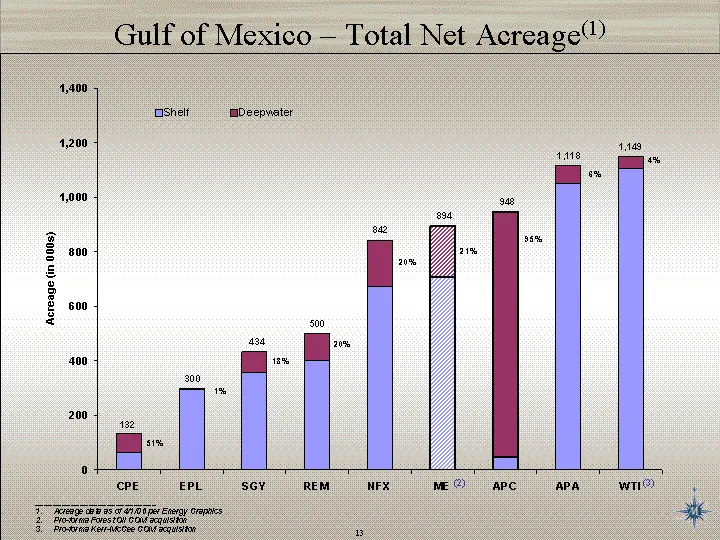
Gulf of Mexico - Total Net Acreage(1) Gulf of Mexico - Total Net Acreage(1) ___________________________ Acreage data as of 4/1/06 per Energy Graphics Pro-forma Forest Oil GOM acquisition Pro-forma Kerr-McGee GOM acquisition (2) (3)
Slide 14: Mariner Asset Base Map with D/W Salt Outline
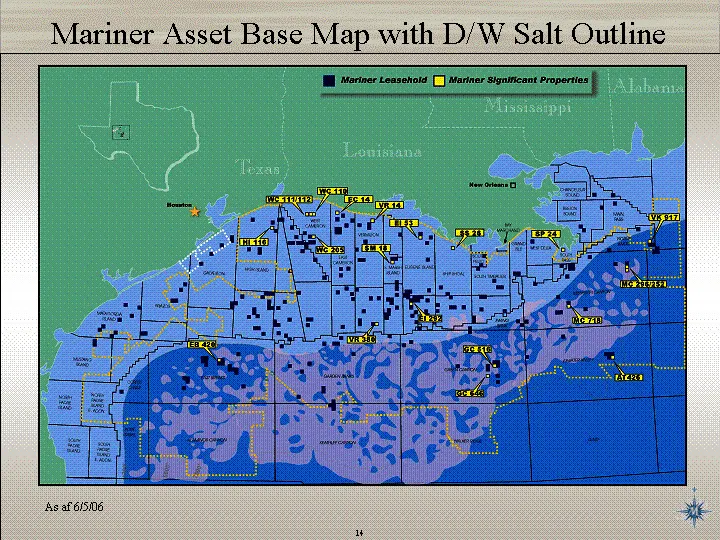
Mariner Asset Base Map with D/W Salt Outline Mariner Asset Base Map with D/W Salt Outline As af 6/5/06
Slide 15: Major Deepwater Fields (Conventional Amplitude)
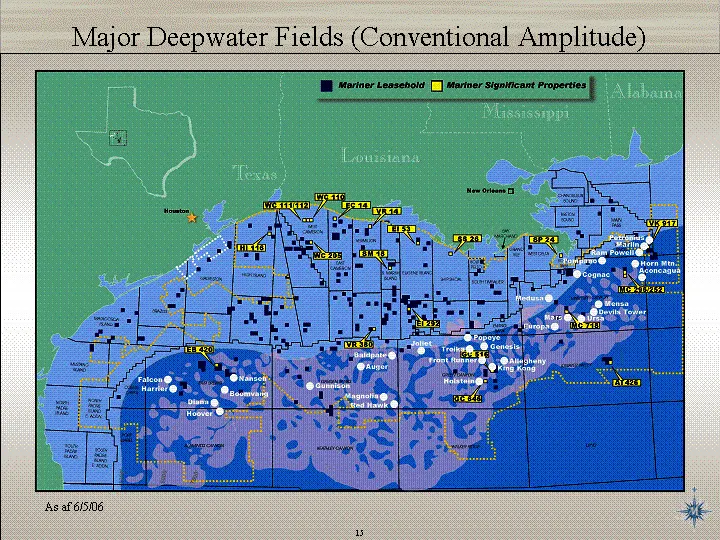
Major Deepwater Fields (Conventional Amplitude) Major Deepwater Fields (Conventional Amplitude) As af 6/5/06
Slide 16: Marine Seismic Acquisition
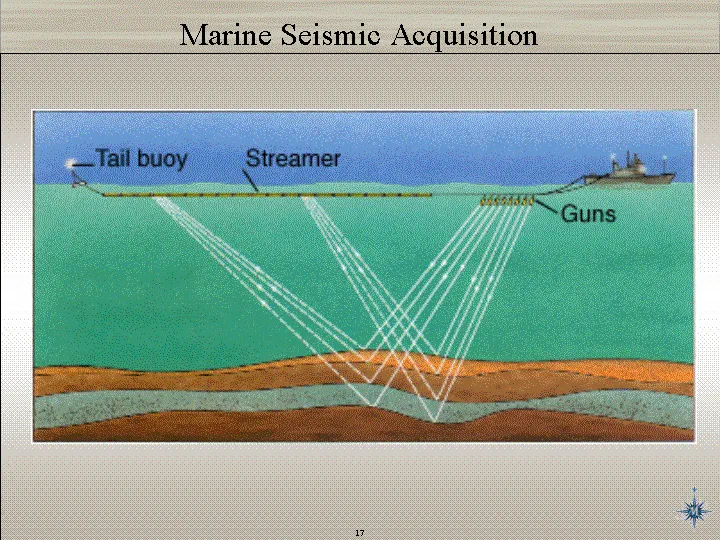
Marine Seismic Acquisition Marine Seismic Acquisition
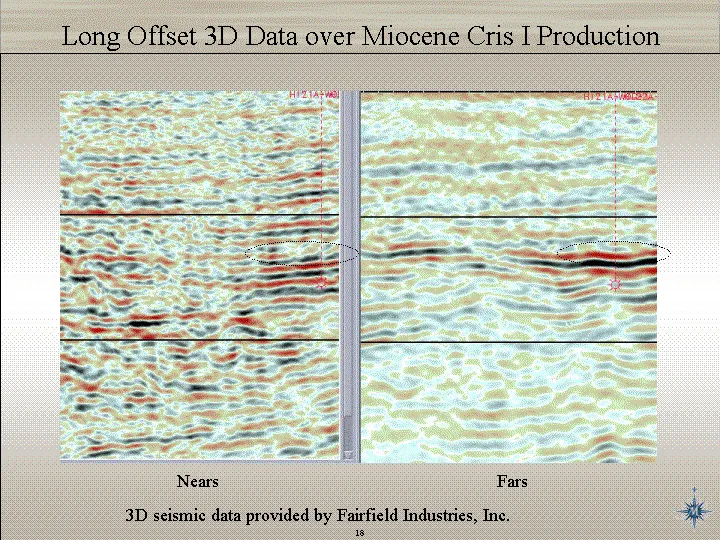
Slide 17: Long Offset 3D Data over Miocene Cris I
Long Offset 3D Data over Miocene Cris I Production Nears Fars 3D seismic data provided by Fairfield Industries, Inc.
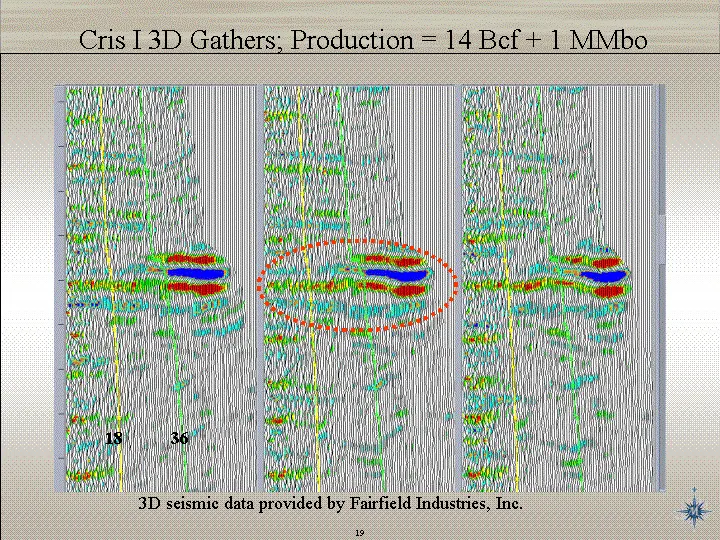
Slide 18: Cris I 3D Gathers
Cris I 3D Gathers; Production = 14 Bcf + 1 MMbo 18 36 3D seismic data provided by Fairfield Industries, Inc.
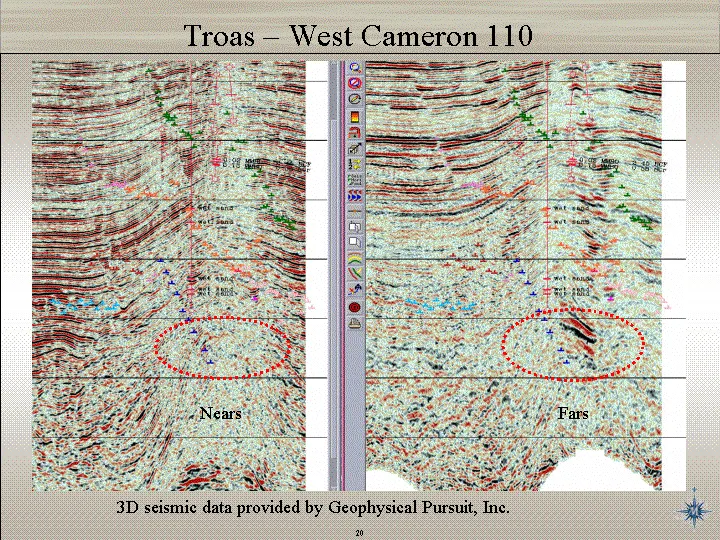
Slide 19: Troas - West Cameron 110
3D seismic data provided by Geophysical Pursuit, Inc. Nears Fars Troas - West Cameron 110
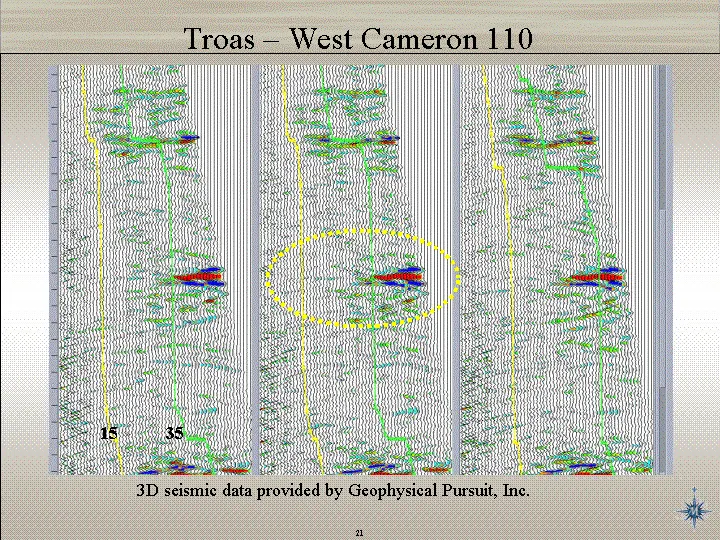
Slide 20: Troas - West Cameron
Troas - West Cameron 110 3D seismic data provided by Geophysical Pursuit, Inc. 15 35
Slide 21: Exploration Focus
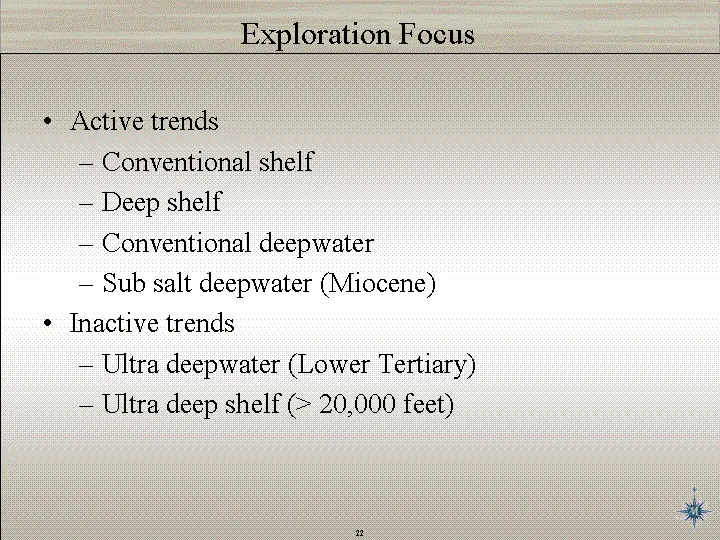
Exploration Focus Active trends Conventional shelf Deep shelf Conventional deepwater Sub salt deepwater (Miocene) Inactive trends Ultra deepwater (Lower Tertiary) Ultra deep shelf (> 20,000 feet)
Slide 22: Reserve potential estimates and notes
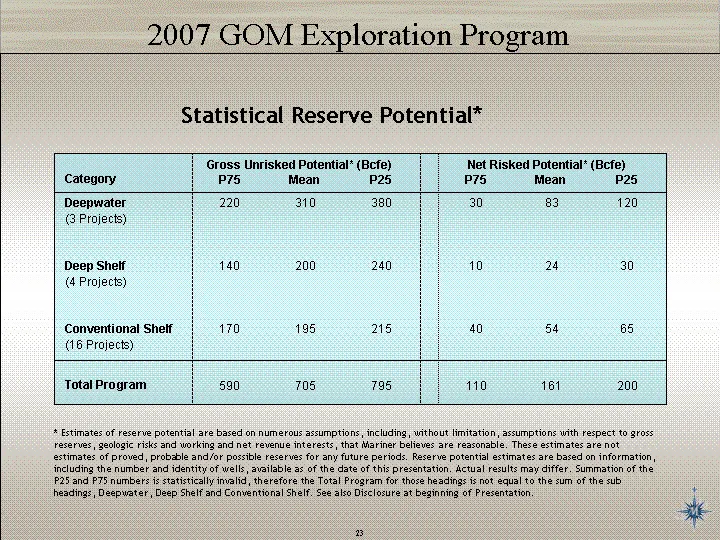
* Estimates of reserve potential are based on numerous assumptions, including, without limitation, assumptions with respect to gross reserves, geologic risks and working and net revenue interests, that Mariner believes are reasonable. These estimates are not estimates of proved, probable and/or poss
Slide 23: Deep Shelf - Red Lion - Sabine Pass
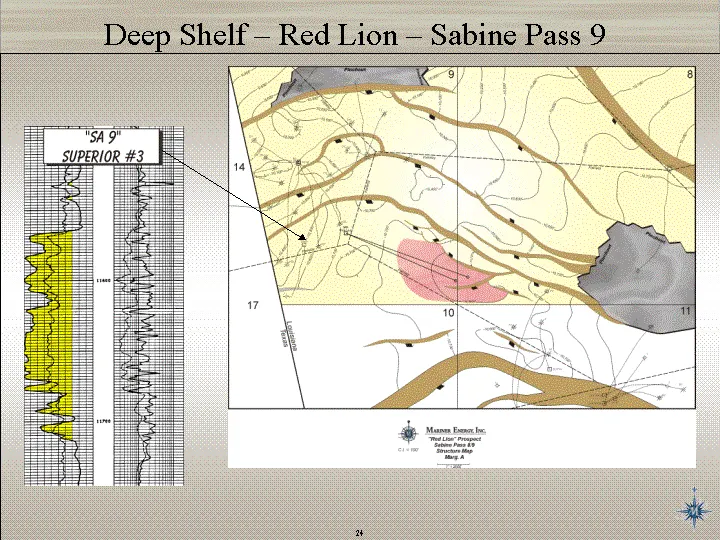
Deep Shelf - Red Lion - Sabine Pass 9
Slide 24: Deepwater - Magellan - East Breaks
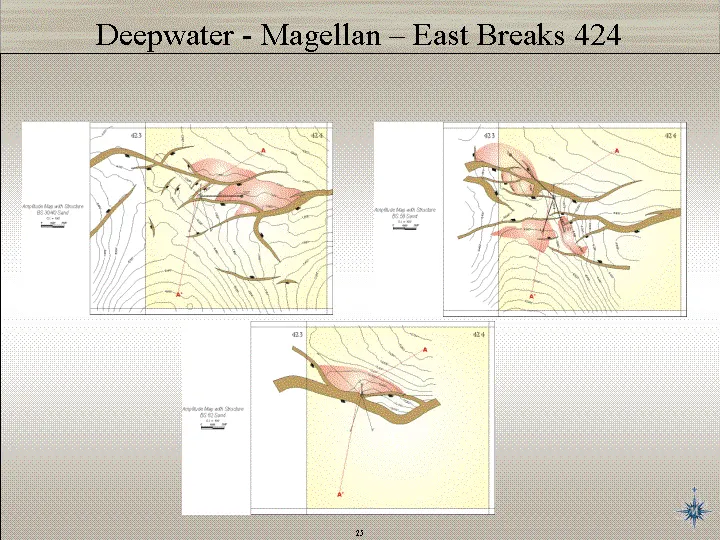
Deepwater - Magellan - East Breaks 424
Slide 25: Subsalt - King Kong Deep - GC 472/473
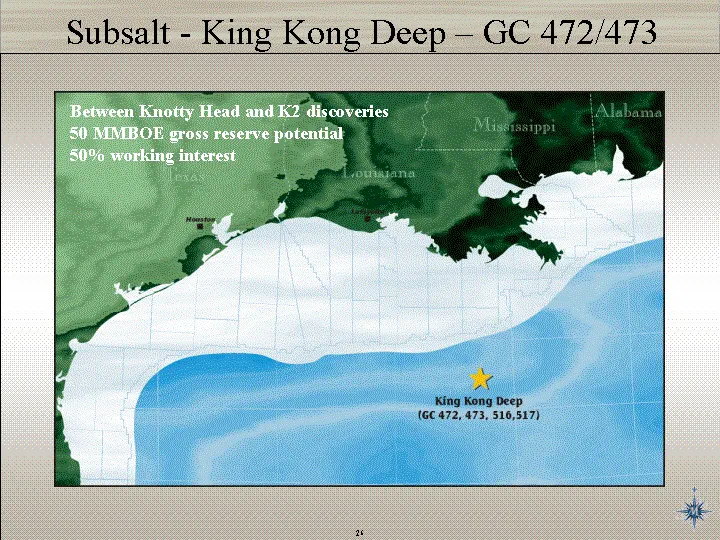
Subsalt - King Kong Deep - GC 472/473 Between Knotty Head and K2 discoveries 50 MMBOE gross reserve potential 50% working interest
Slide 26: Phases of a Deepwater Project
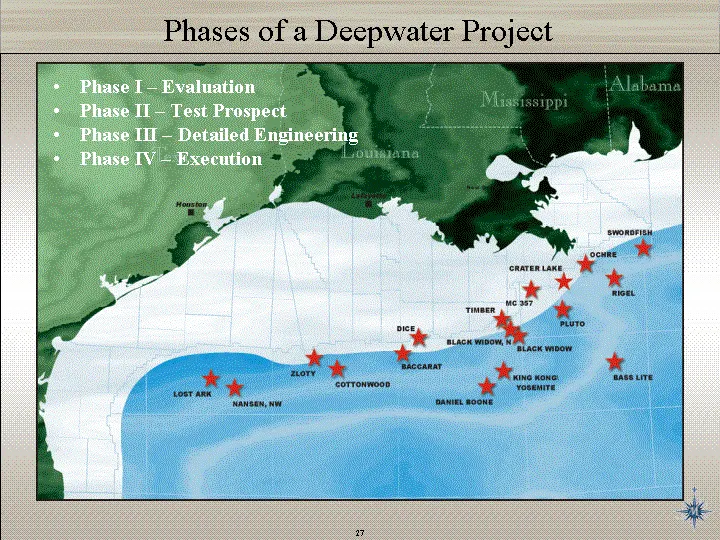
Phases of a Deepwater Project Phase I - Evaluation Phase II - Test Prospect Phase III - Detailed Engineering Phase IV - Execution
Slide 27: Phase I - Swordfish
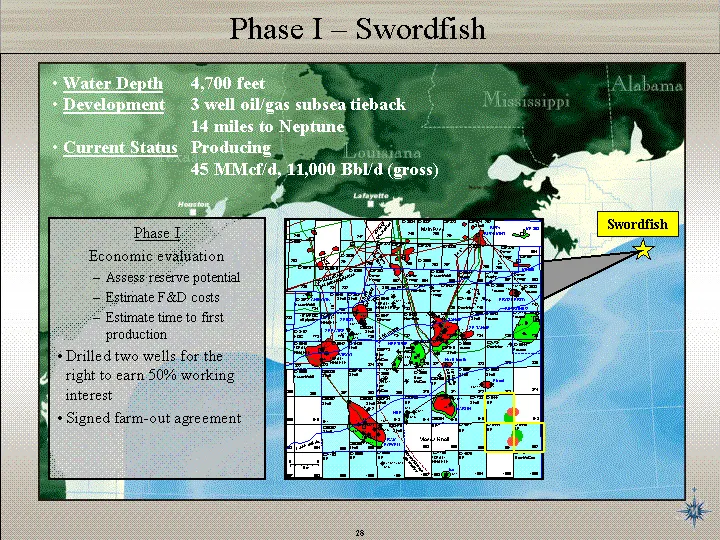
Phase I - Swordfish Water Depth 4,700 feet Development 3 well oil/gas subsea tieback 14 miles to Neptune Current Status Producing 45 MMcf/d, 11,000 Bbl/d (gross) Swordfish Phase I Economic evaluation Assess reserve potential Estimate F&D costs Estimate time to first production Drilled two wells for
Slide 28: Phase II - Swordfish
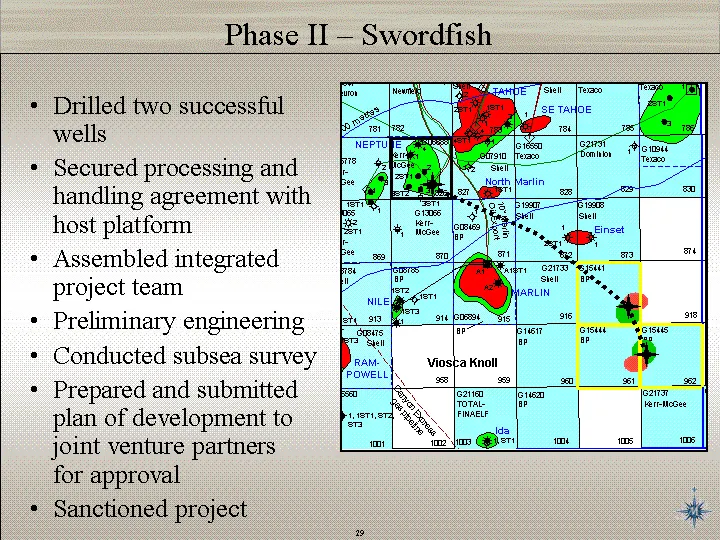
Phase II - Swordfish Drilled two successful wells Secured processing and handling agreement with host platform Assembled integrated project team Preliminary engineering Conducted subsea survey Prepared and submitted plan of development to joint venture partners for approval Sanctioned project Sancti
Slide 29: Phase III
Phase III Establish design basis Finalize integrated project team Engage in detailed engineering Bid all major services and equipment Vendor and contractor selection process Prepare detailed costs and schedule
Slide 30: Swordfish Project Development
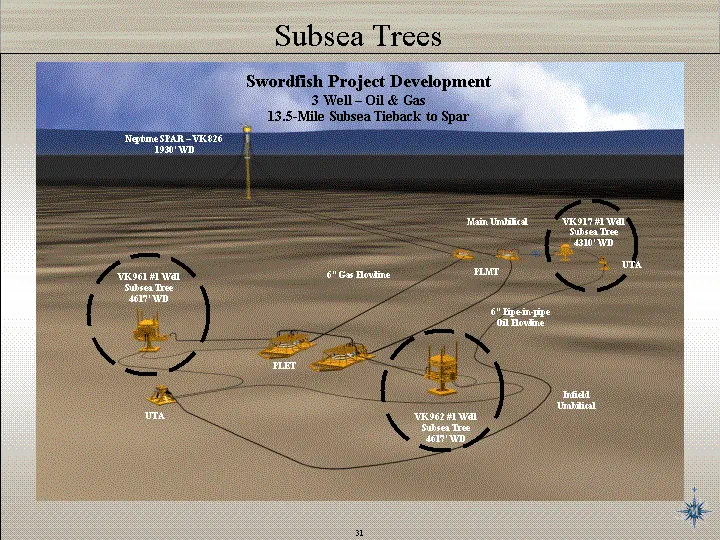
Neptune SPAR - VK 826 1930' WD Infield Umbilical Main Umbilical VK 961 #1 Well Subsea Tree 4617' WD VK 962 #1 Well Subsea Tree 4617' WD 6" Pipe-in-pipe Oil Flowline 6" Gas Flowline PLMT PLET UTA Swordfish Project Development 3 Well - Oil & Gas 13.5-Mile Subsea Tieback to Spar Subsea Trees UTA VK 917
Slide 31: Northwest Nansen - East Breaks 602/558
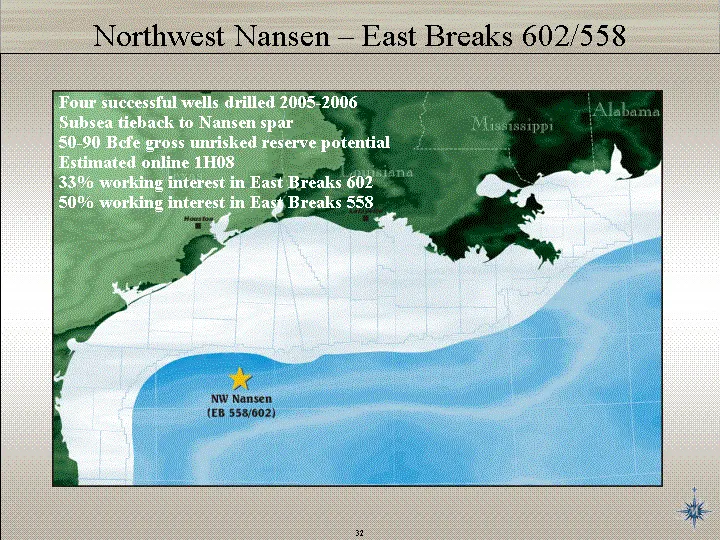
Northwest Nansen - East Breaks 602/558 Four successful wells drilled 2005-2006 Subsea tieback to Nansen spar 50-90 Bcfe gross unrisked reserve potential Estimated online 1H08 33% working interest in East Breaks 602 50% working interest in East Breaks 558
Slide 32: NW Nansen (EB 602) Map and Well Log
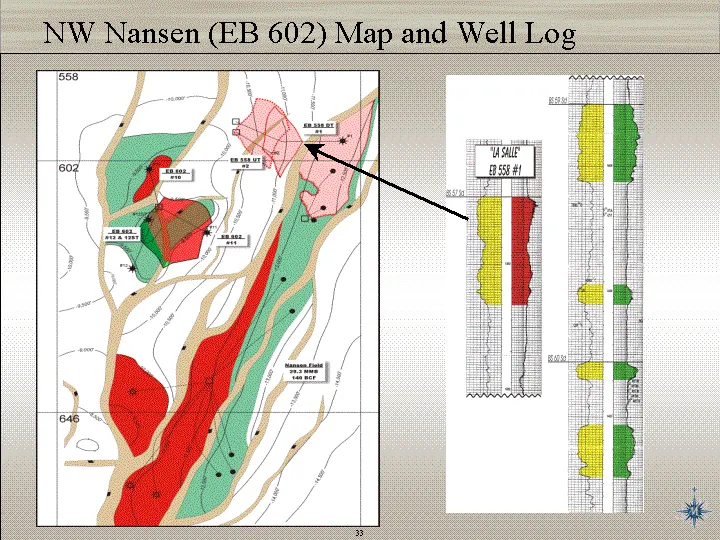
NW Nansen (EB 602) Map and Well Log
Slide 33: Bass Lite
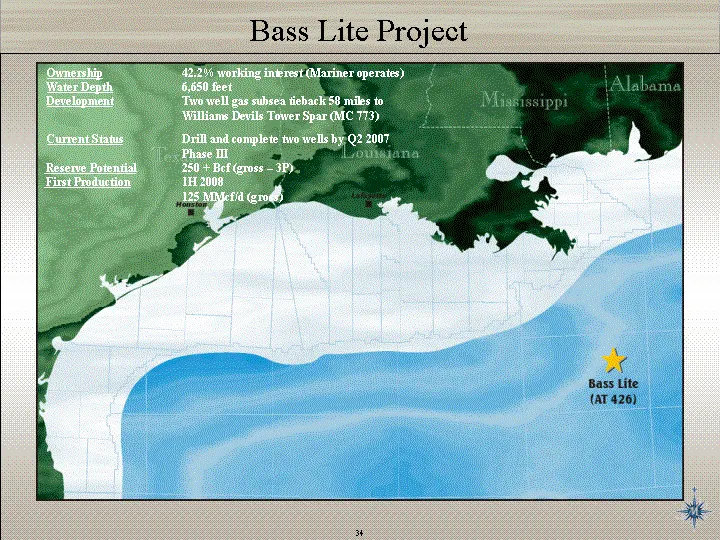
Bass Lite Project Ownership 42.2% working interest (Mariner operates) Water Depth 6,650 feet Development Two well gas subsea tieback 58 miles to Williams Devils Tower Spar (MC 773) Current Status Drill and complete two wells by Q2 2007 Phase III Reserve Potential 250 + Bcf (gross - 3P) First Product
Slide 34: Bass Lite - Structure Map and Well Log
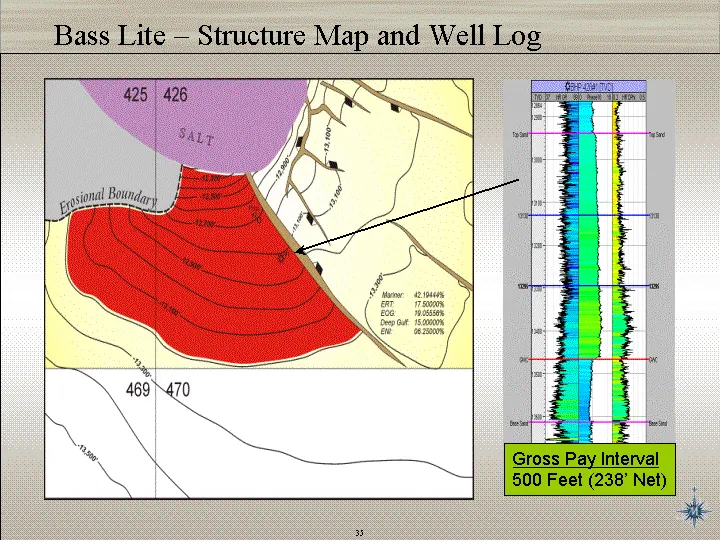
Bass Lite - Structure Map and Well Log Gross Pay Interval 500 Feet (238' Net)
Source: SEC EDGAR · 8-K filed Apr 20, 2007
More decks from Mariner Energy Inc
 Merger or Acquisition (July 2010)27 slides · Jul 27, 2010
 Merger or Acquisition (April 2010)23 slides · Apr 27, 2010
 IPAA Oil & Gas Investment Symposium April 8, 200852 slides · Apr 7, 2008
 Raymond James 29th Annual Institutional Investors Conference (March 2008)34 slides · Mar 5, 2008
 Pritchard Capital Energize 2008 Conference30 slides · Jan 8, 2008
 Investor Presentation (November 2007)30 slides · Nov 14, 2007