Kingfisher PLC · LSE:KGF
Kingfisher — FY2010/11 Earnings Presentation
59 slides from Kingfisher's earnings presentation, March 2011

Slide 1: Full year results 2010/11 & 'Delivering Value'
Full year results 2010/11 & ‘Delivering Value’ Slides will be available at www.kingfisher.com
Slide 2: Disclaimer
Disclaimer The following presentation is being made only to, and is only directed at, persons to whom such presentation may lawfully be communicated (“relevant persons”). Any person who is not a relevant person should not act or rely on this presentation or any of its contents. This presentation doe
Slide 3: Ian Cheshire, Group Chief Executive
Ian Cheshire Group Chief Executive
Slide 4: Agenda
Agenda Introduction Ian Cheshire Group CEO Financial Review Kevin O’Byrne Group CFO „Delivering Value‟ update Ian Cheshire and next phase Group CEO Questions
Slide 5: 2010/11 Summary
2010/11 Summary • Self-help driving strong results in challenging markets – Sales broadly flat, adjusted PBT +23% – ROC now 9.6%, up 130 basis points – Dividend +29% • „Delivering Value‟ remains on track, Kingfisher is now a stronger business • Ground work underway for the next phase
Slide 6: 2011/12 – 'stepping up a gear'
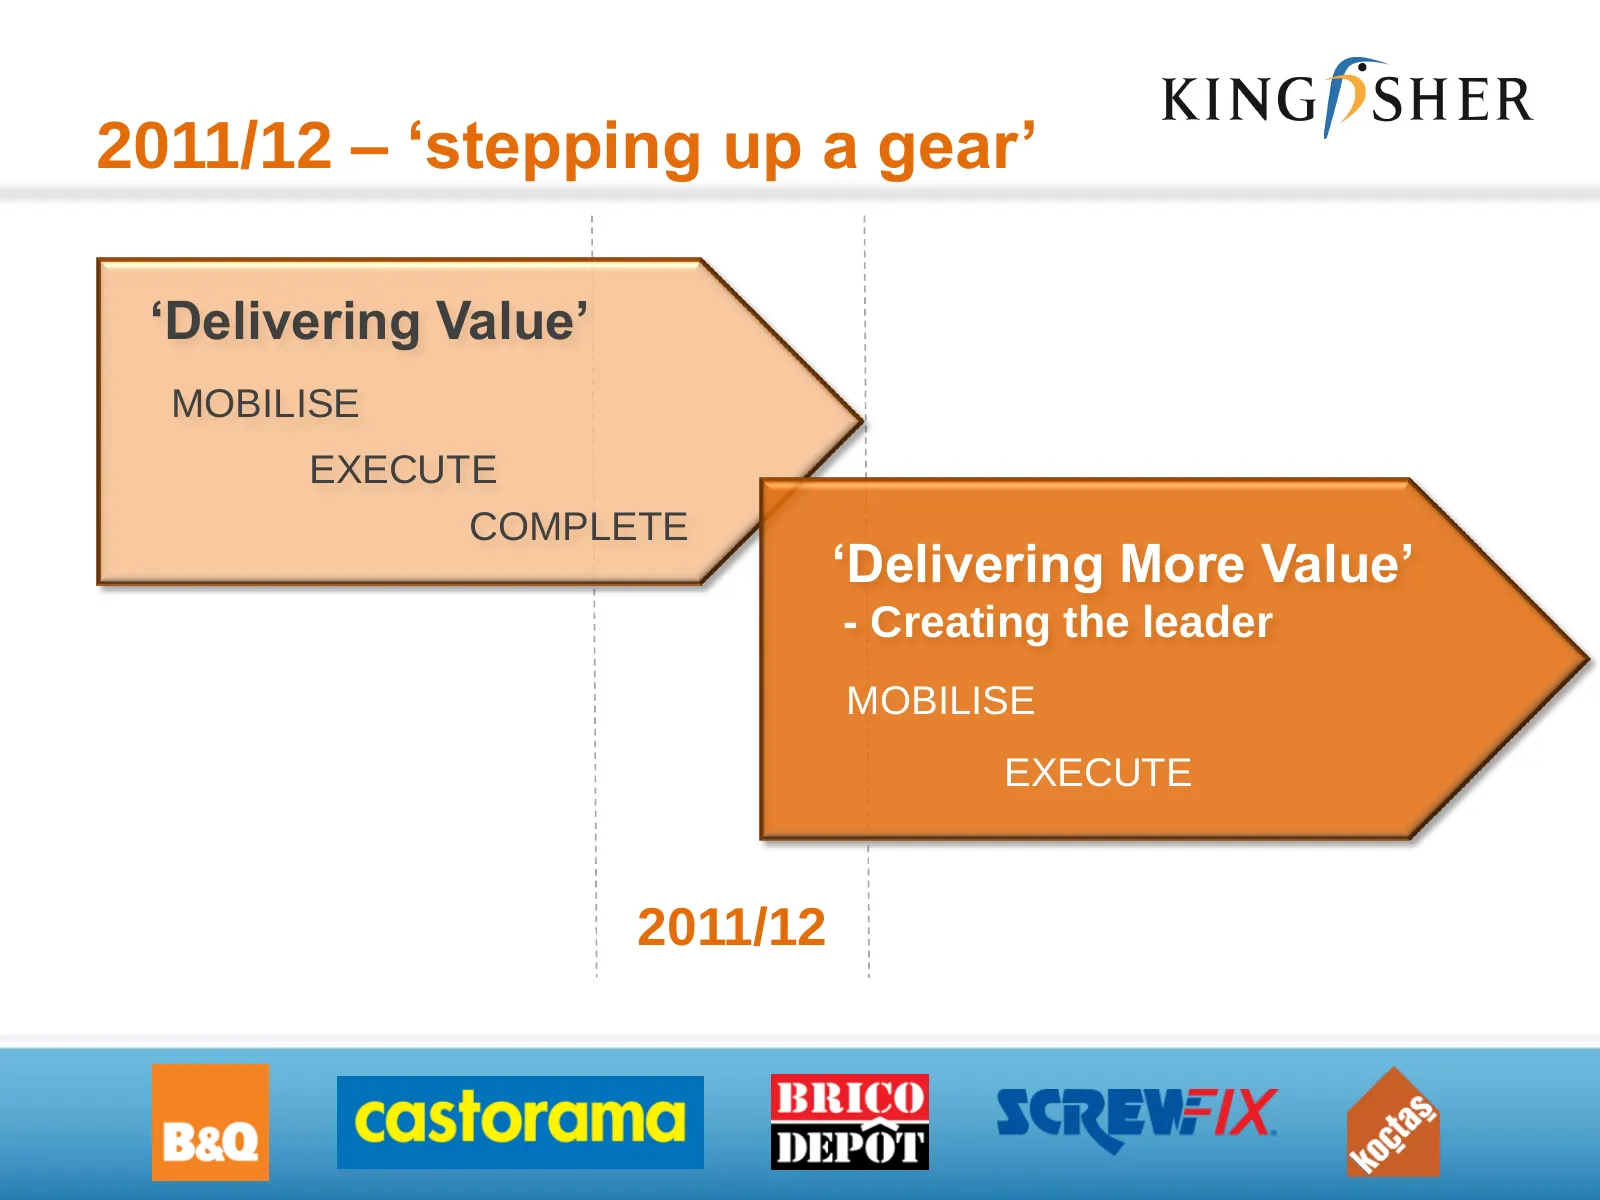
2011/12 – ‘stepping up a gear’ ‘Delivering Value’ MOBILISE EXECUTE COMPLETE ‘Delivering More Value’ - Creating the leader MOBILISE EXECUTE 2011/12
Slide 7: Kevin O'Byrne, Group Finance Director
Kevin O’Byrne Group Finance Director
Slide 8: Financial highlights
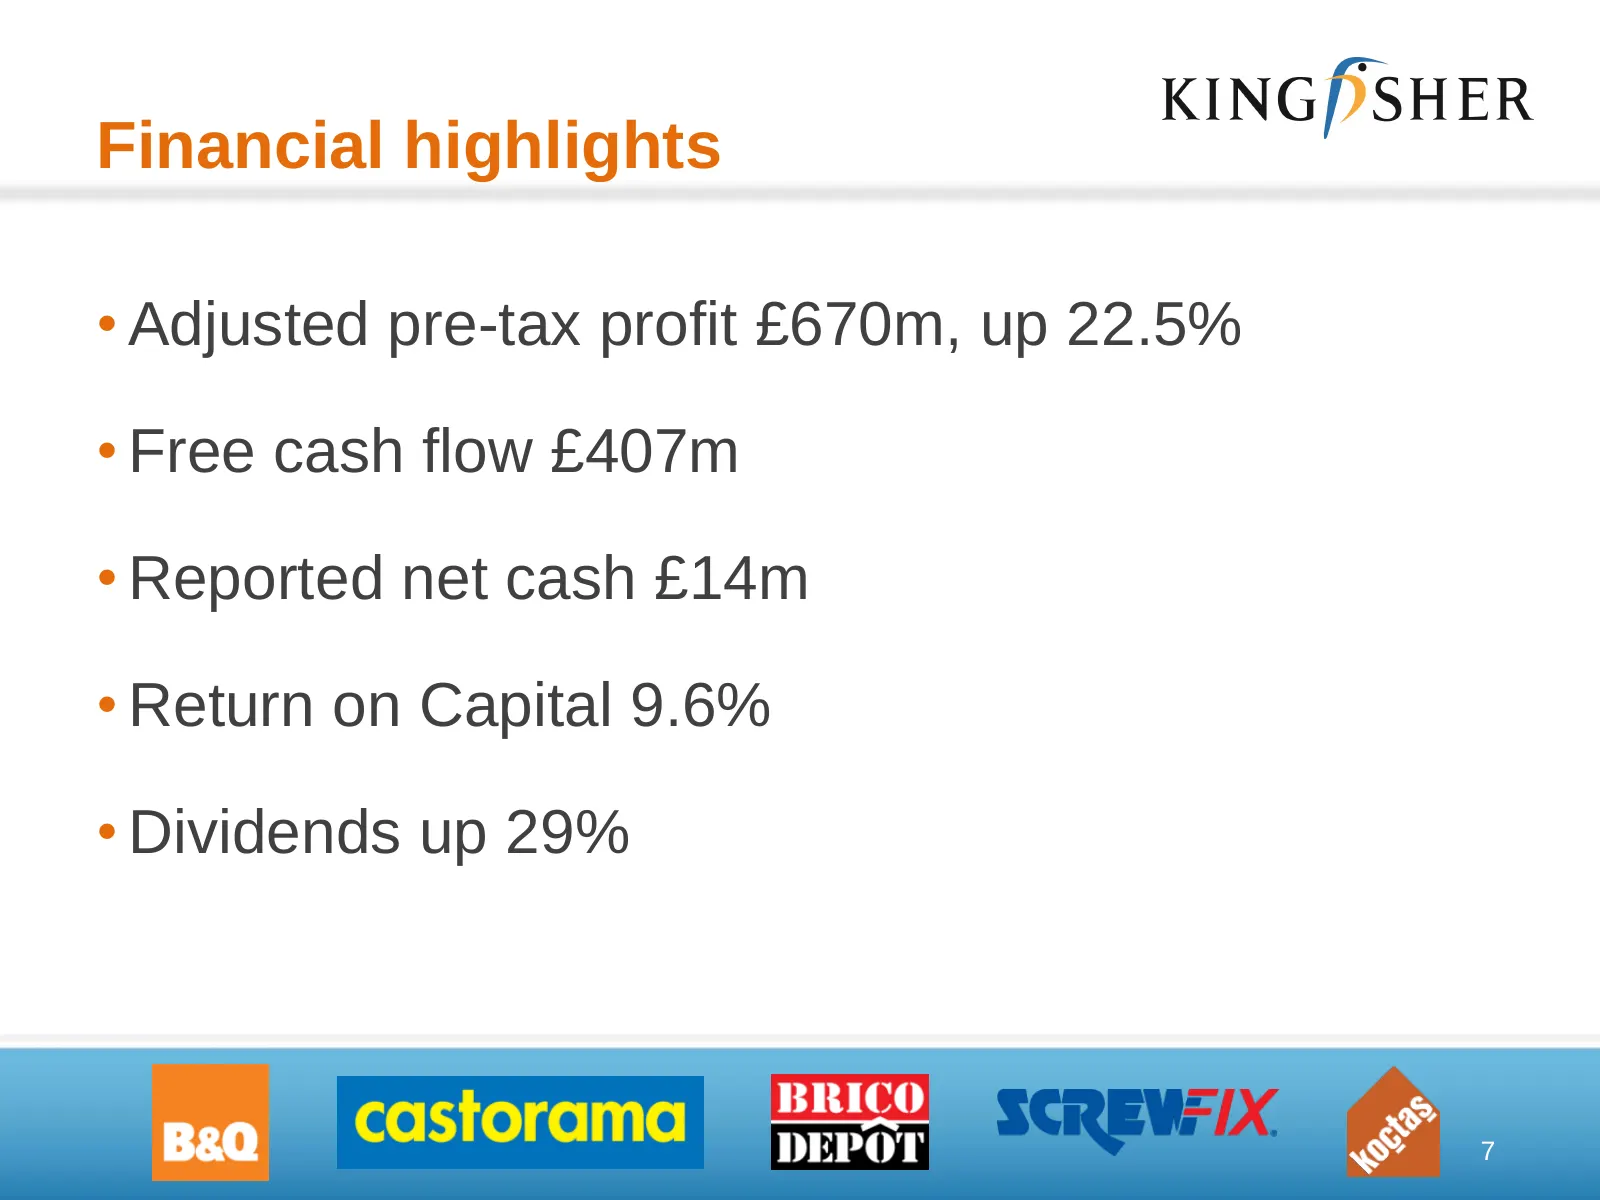
Financial highlights • Adjusted pre-tax profit £670m, up 22.5% • Free cash flow £407m • Reported net cash £14m • Return on Capital 9.6% • Dividends up 29% 7
Slide 9: Group sales up 0.5%
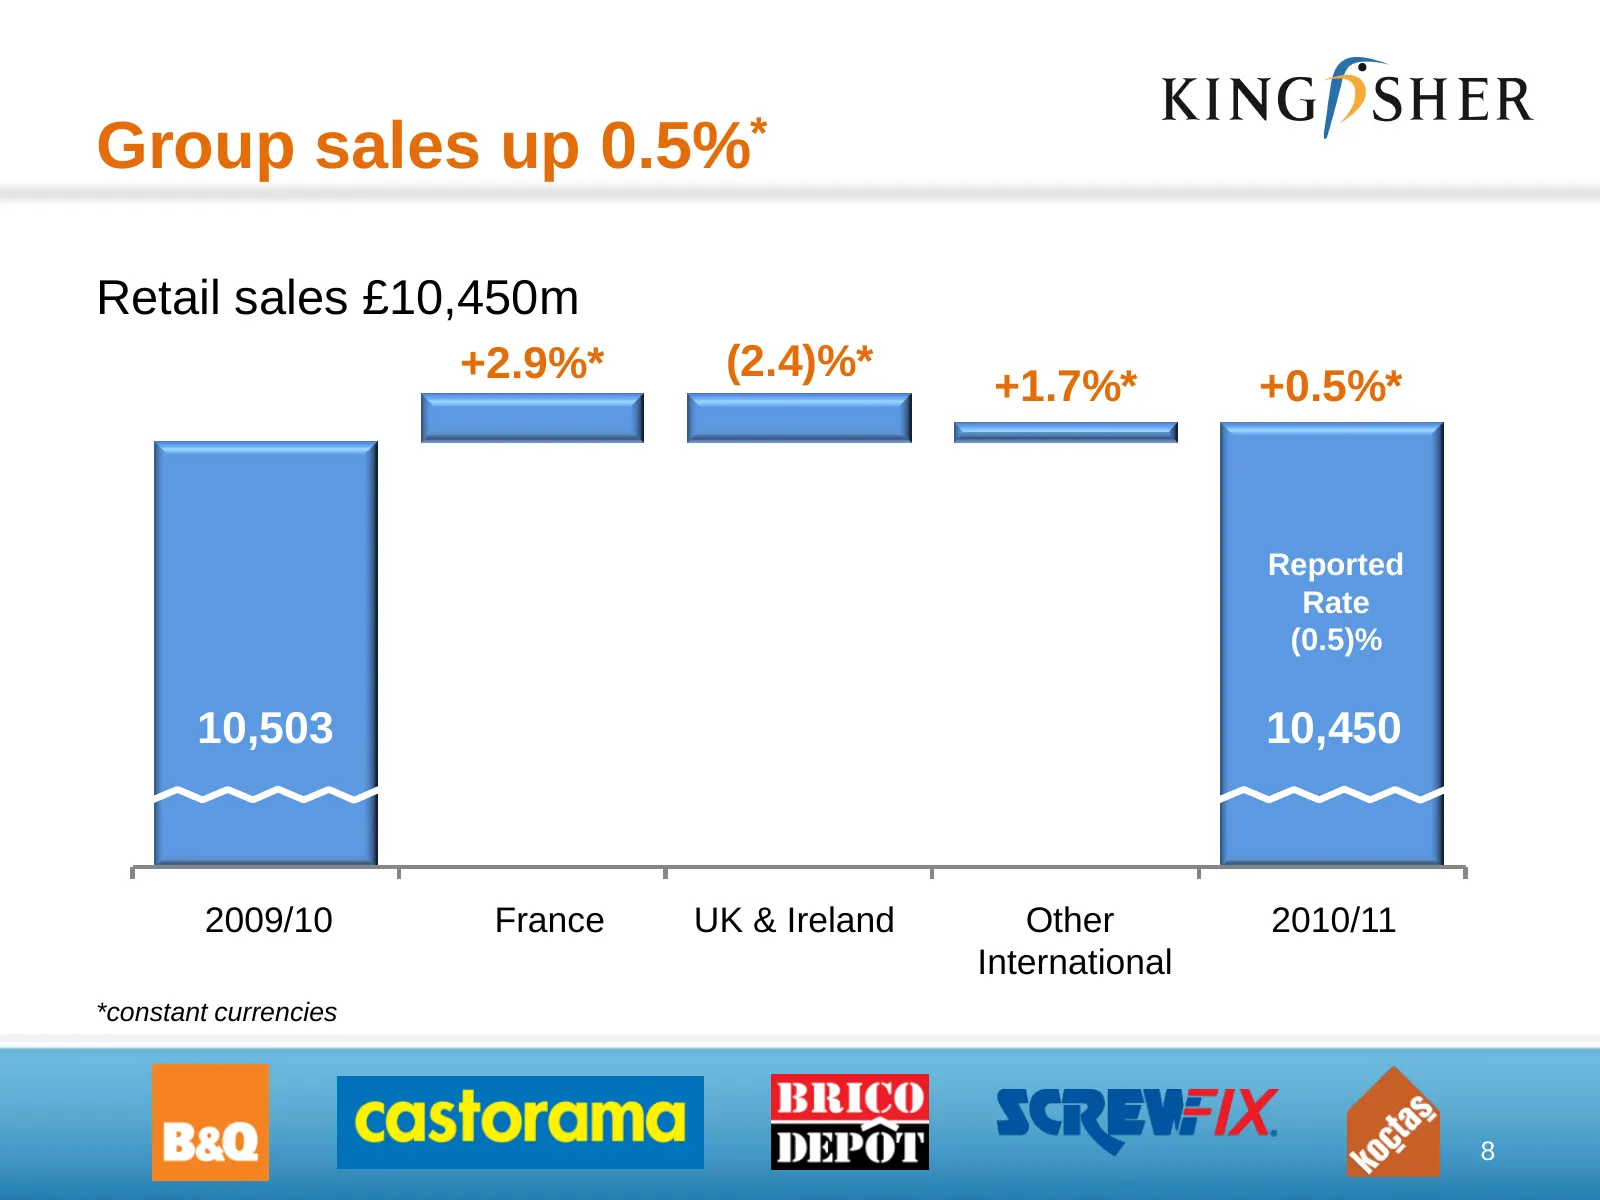
Group sales up 0.5%* Retail sales £10,450m +2.9%* (2.4)%* +1.7%* +0.5%* Reported Rate (0.5)% 10,503 10,450 2009/10 France UK & Ireland Other 2010/11 International *constant currencies 8
Slide 10: Group retail profit up 16.3%
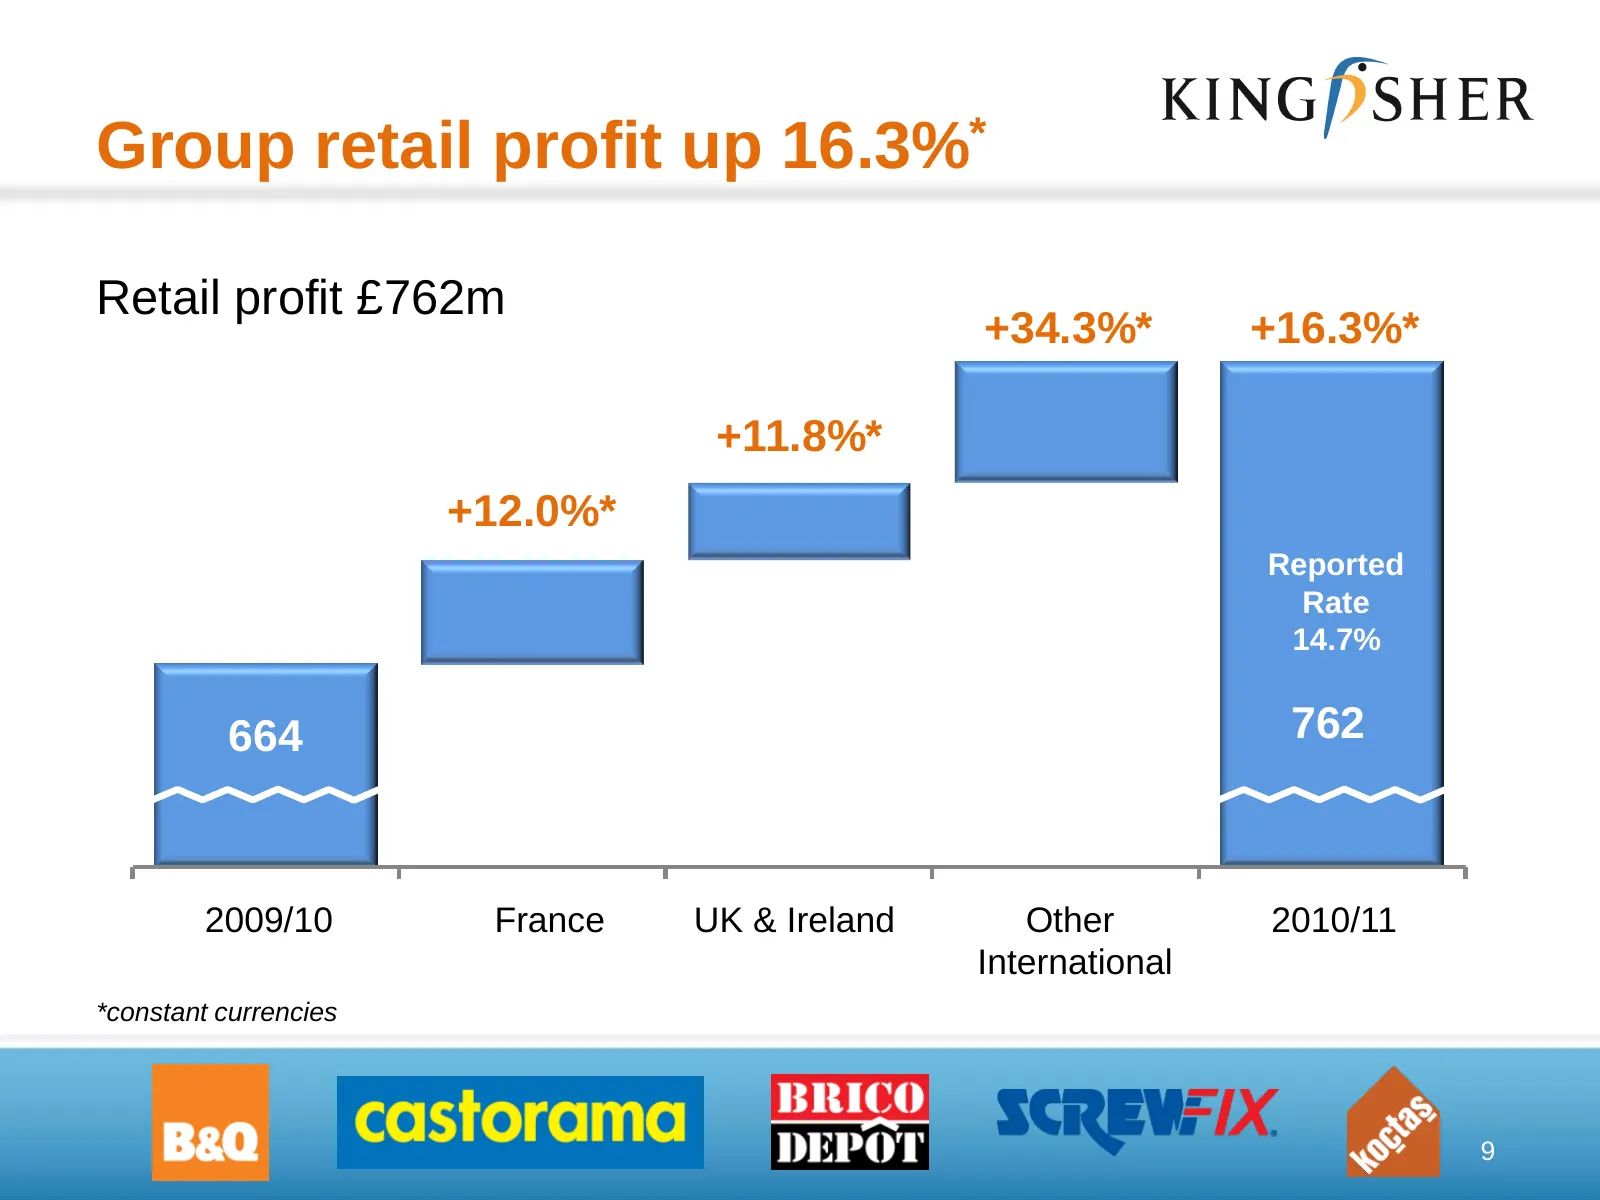
Group retail profit up 16.3%* Retail profit £762m +34.3%* +16.3%* +11.8%* +12.0%* Reported Rate 14.7% 664 762 2009/10 France UK & Ireland Other 2010/11 International *constant currencies 9
Slide 11: Financial highlights
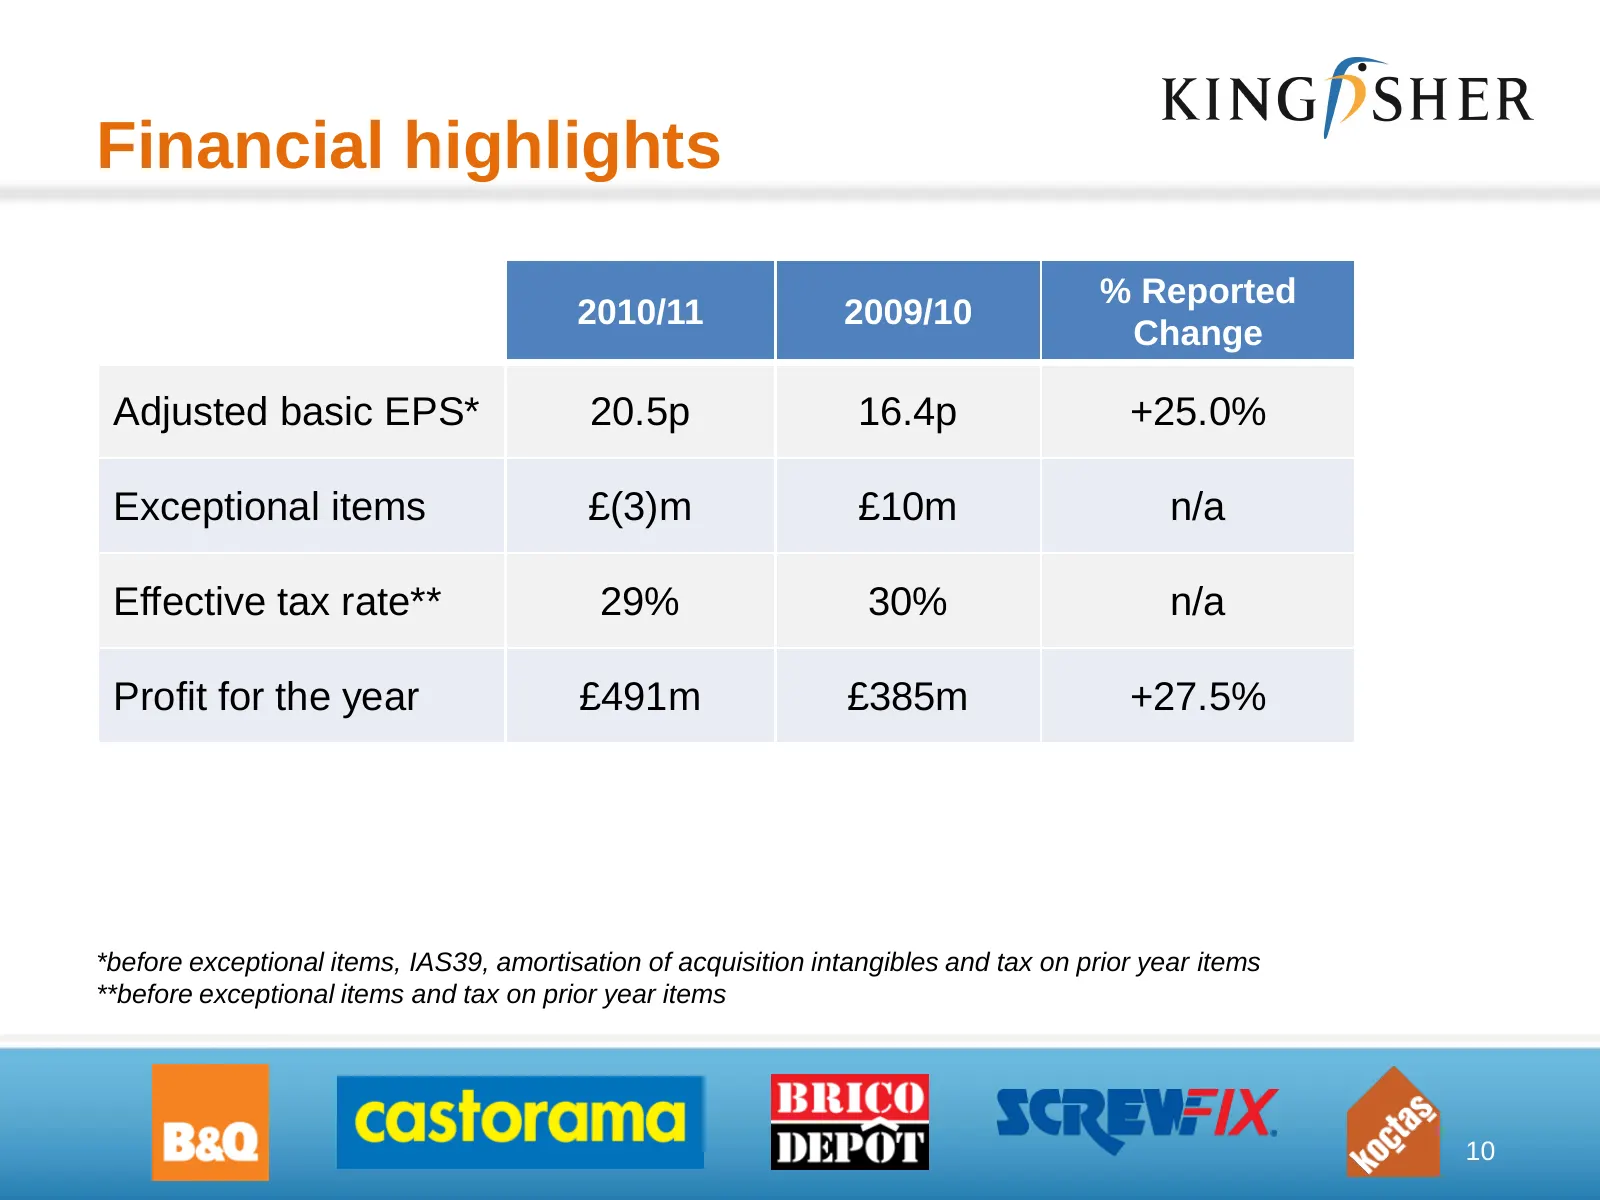
Financial highlights % Reported 2010/11 2009/10 Change Adjusted basic EPS* 20.5p 16.4p +25.0% Exceptional items £(3)m £10m n/a Effective tax rate** 29% 30% n/a Profit for the year £491m £385m +27.5% *before exceptional items, IAS39, amortisation of acquisition intangibles and tax on prior year items
Slide 12: Free cash flow
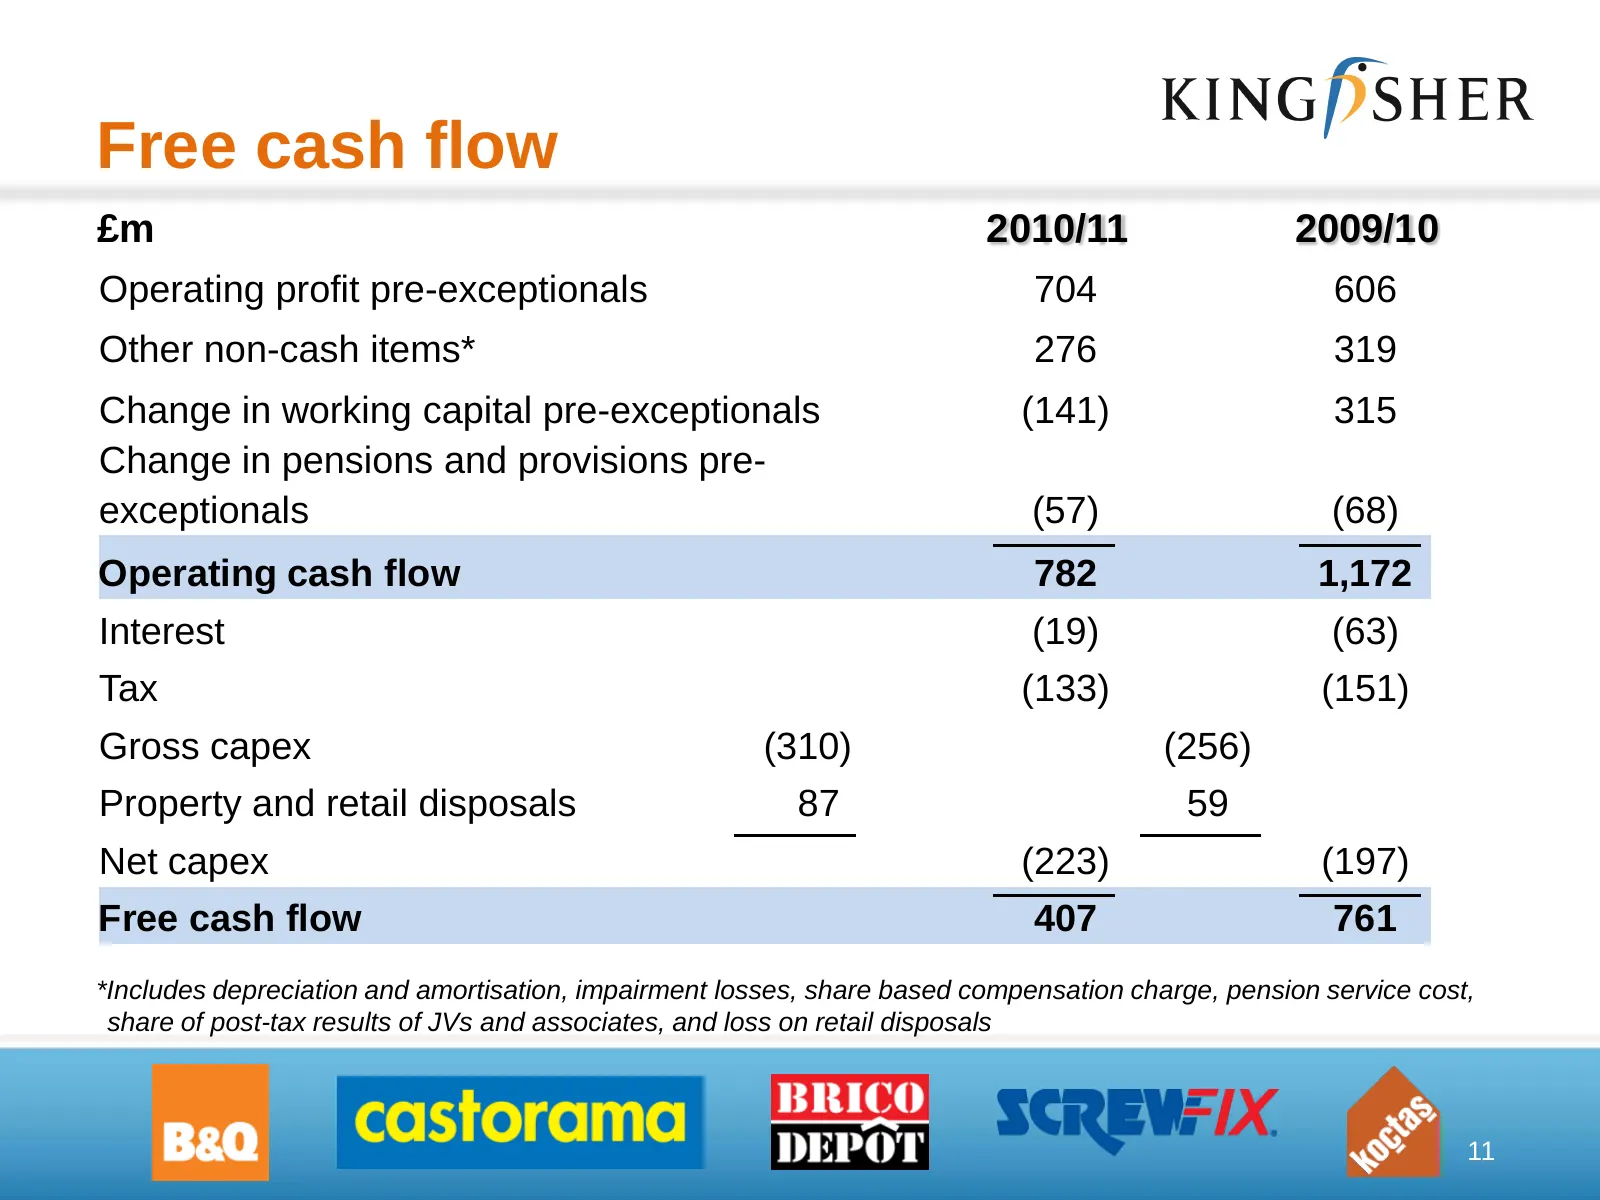
Free cash flow £m 2010/11 2009/10 Operating profit pre-exceptionals 704 606 Other non-cash items* 276 319 Change in working capital pre-exceptionals (141) 315 Change in pensions and provisions pre- exceptionals (57) (68) Operating cash flow 782 1,172 Interest (19) (63) Tax (133) (151) Gross capex (3
Slide 13: Use of free cashflow
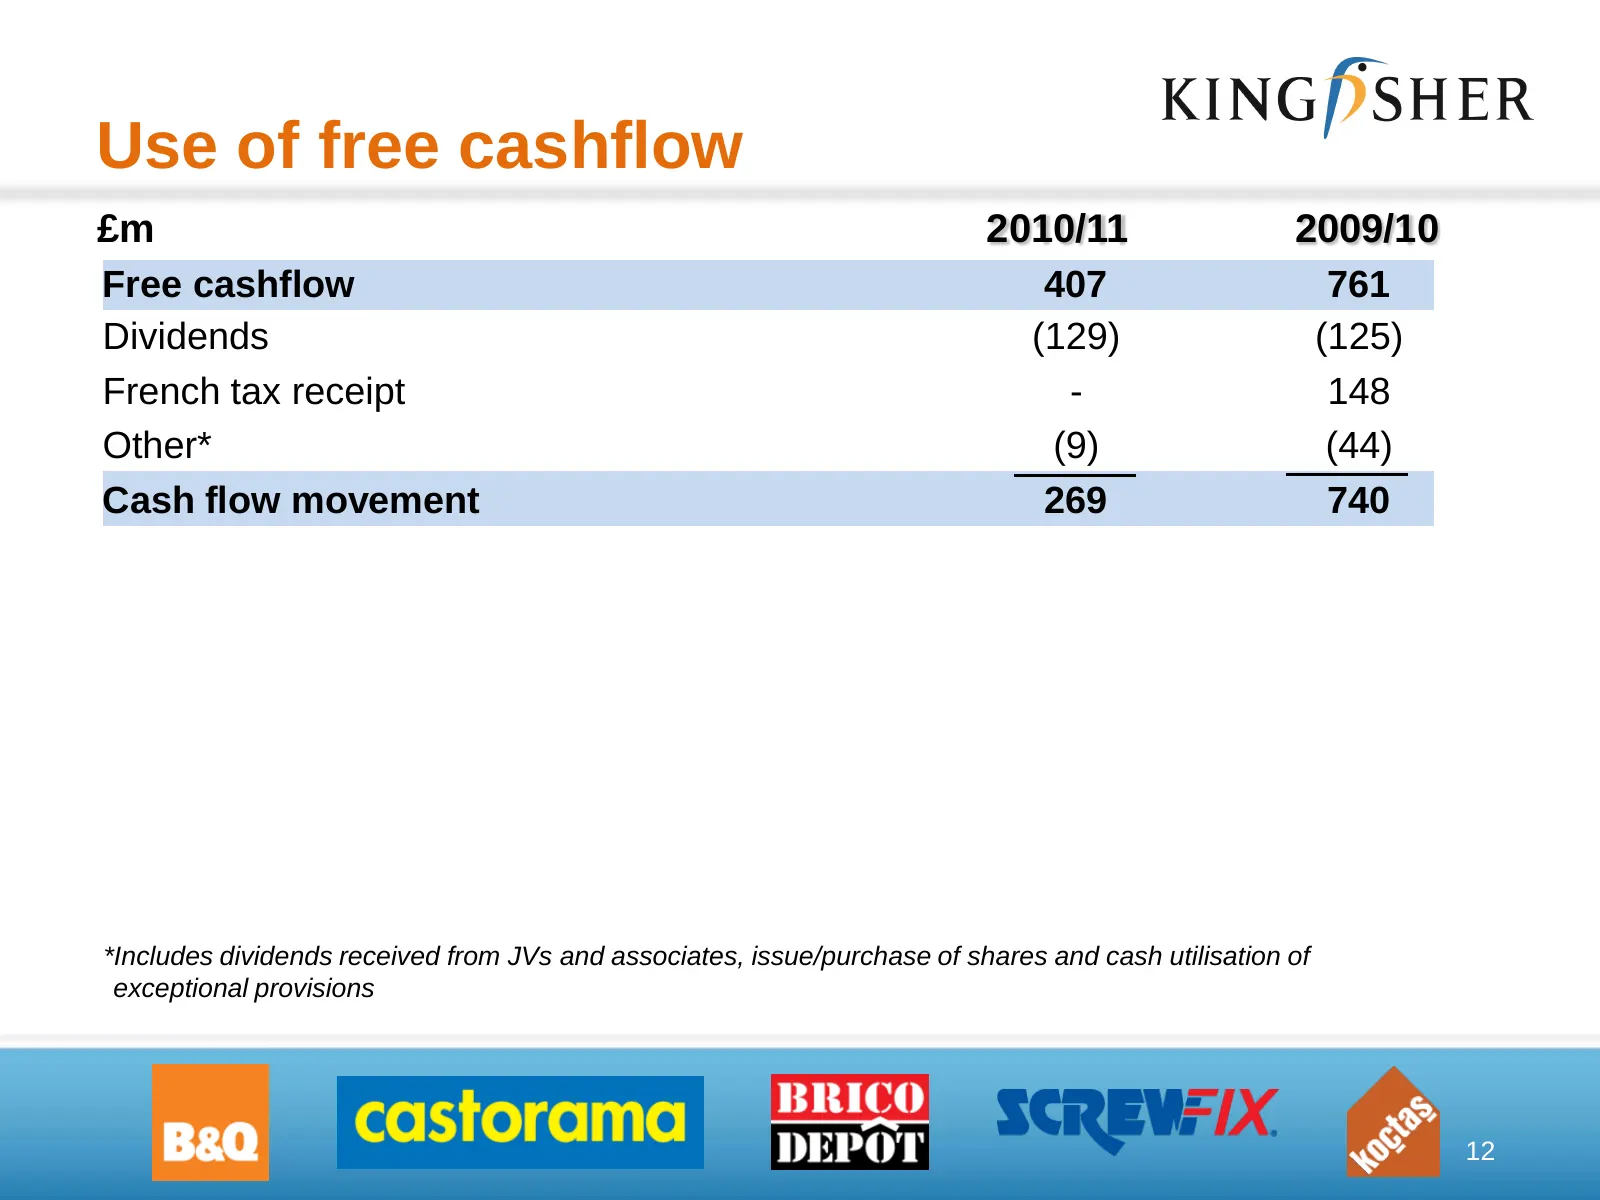
Use of free cashflow £m 2010/11 2009/10 Free cashflow 407 761 Dividends (129) (125) French tax receipt - 148 Other* (9) (44) Cash flow movement 269 740 *Includes dividends received from JVs and associates, issue/purchase of shares and cash utilisation of exceptional provisions 12
Slide 14: Dividend up 29%
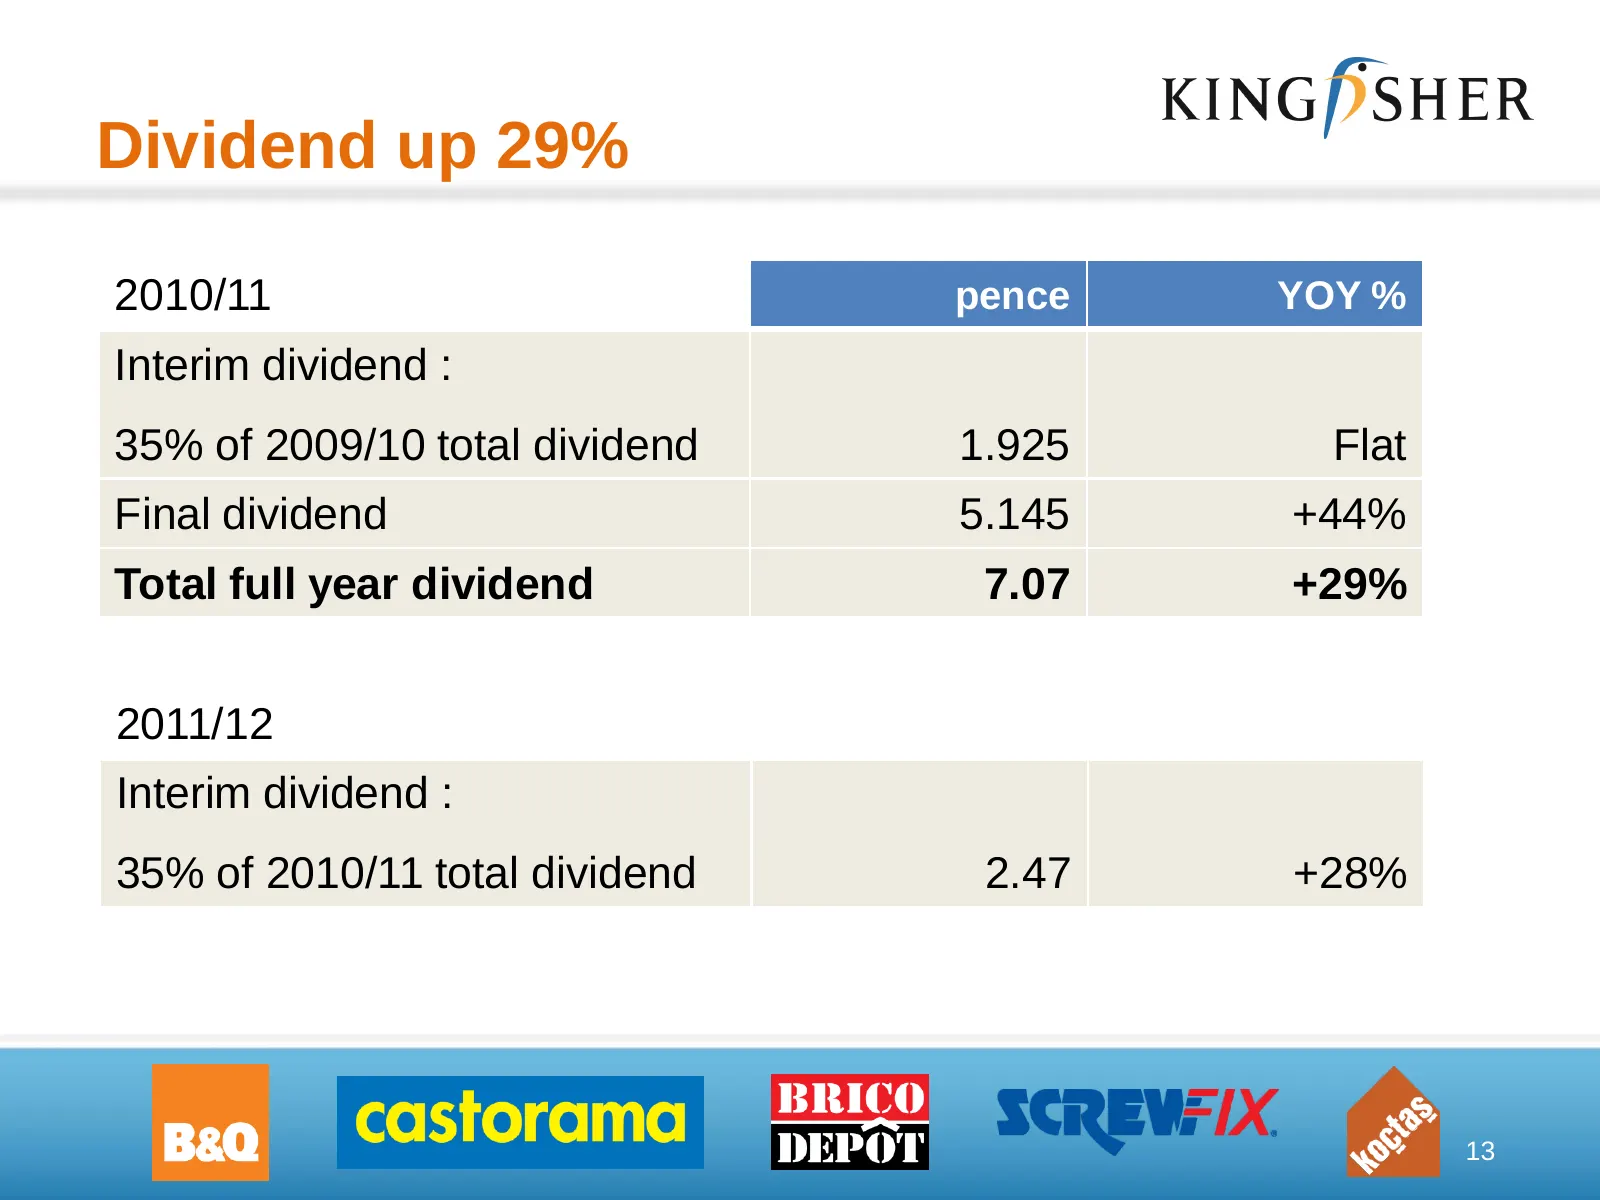
Dividend up 29% 2010/11 pence YOY % Interim dividend : 35% of 2009/10 total dividend 1.925 Flat Final dividend 5.145 +44% Total full year dividend 7.07 +29% 2011/12 Interim dividend : 35% of 2010/11 total dividend 2.47 +28% 13
Slide 15: £1.4 billion gross debt repaid
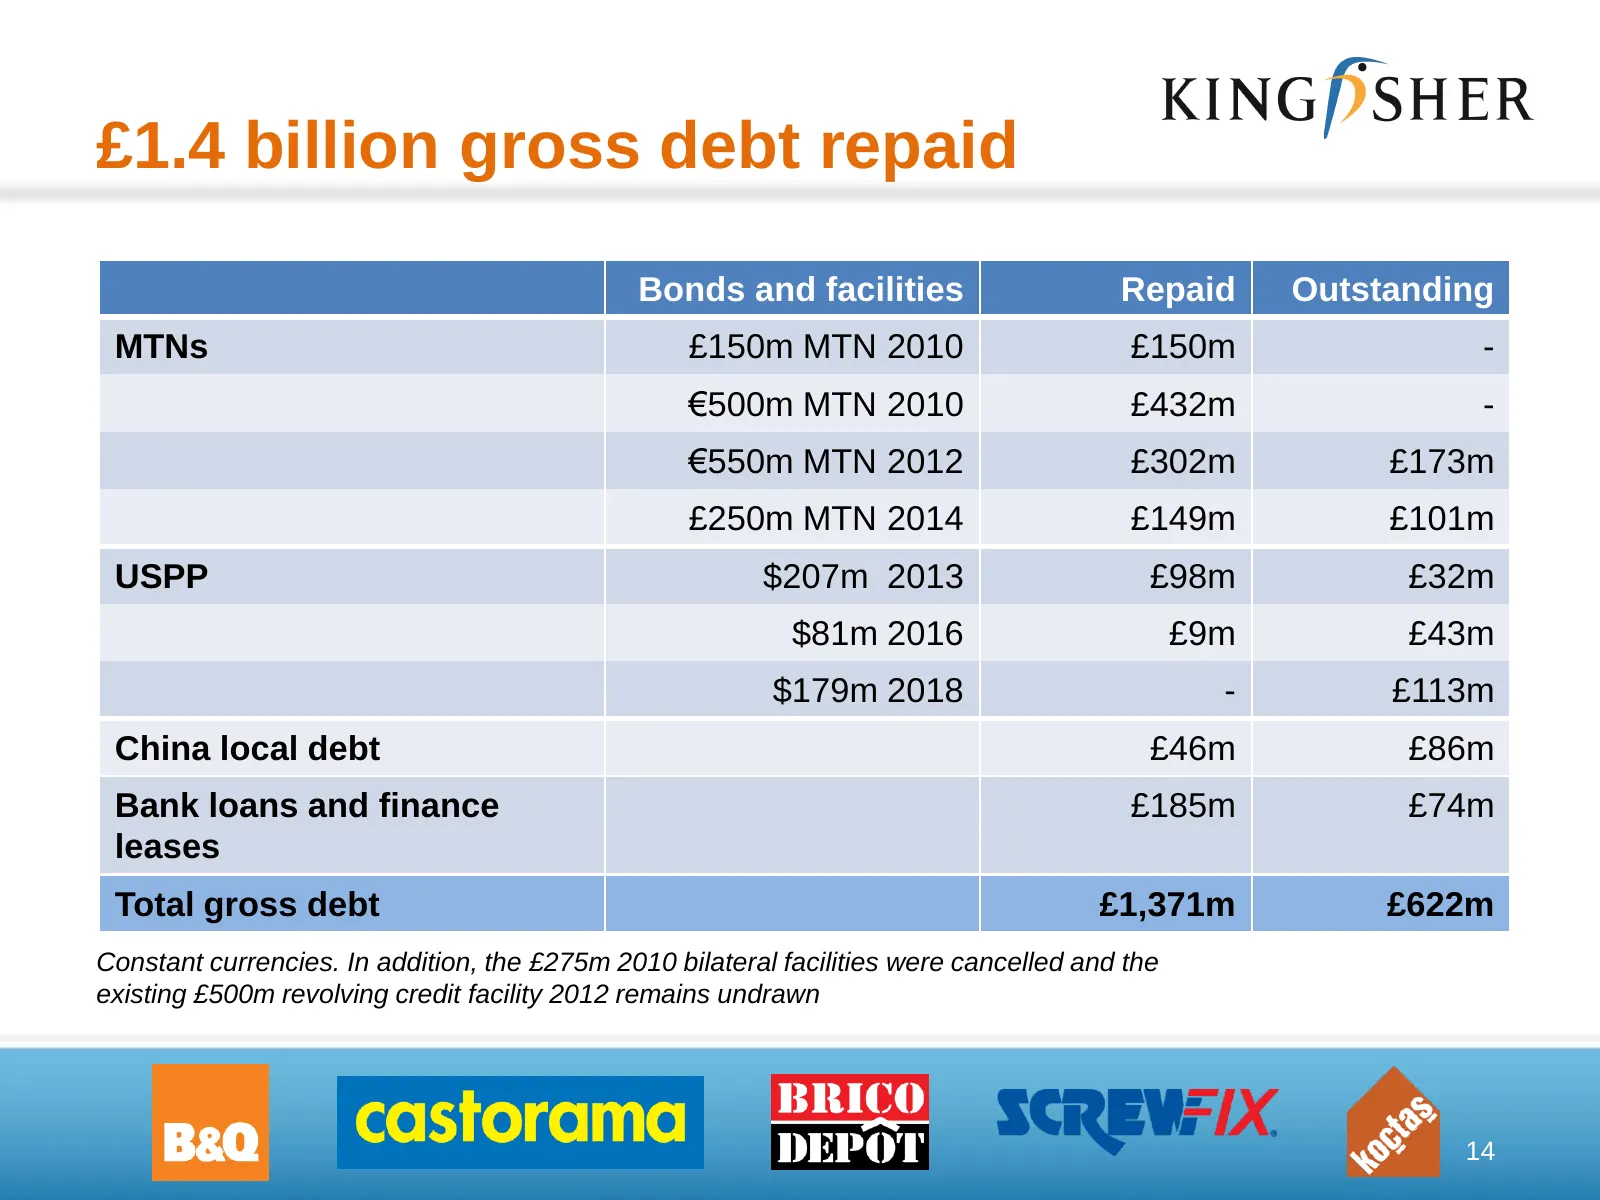
£1.4 billion gross debt repaid Bonds and facilities Repaid Outstanding MTNs £150m MTN 2010 £150m - €500m MTN 2010 £432m - €550m MTN 2012 £302m £173m £250m MTN 2014 £149m £101m USPP $207m 2013 £98m £32m $81m 2016 £9m £43m $179m 2018 - £113m China local debt £46m £86m Bank loans and finance £185m £74m
Slide 16: Capital structure
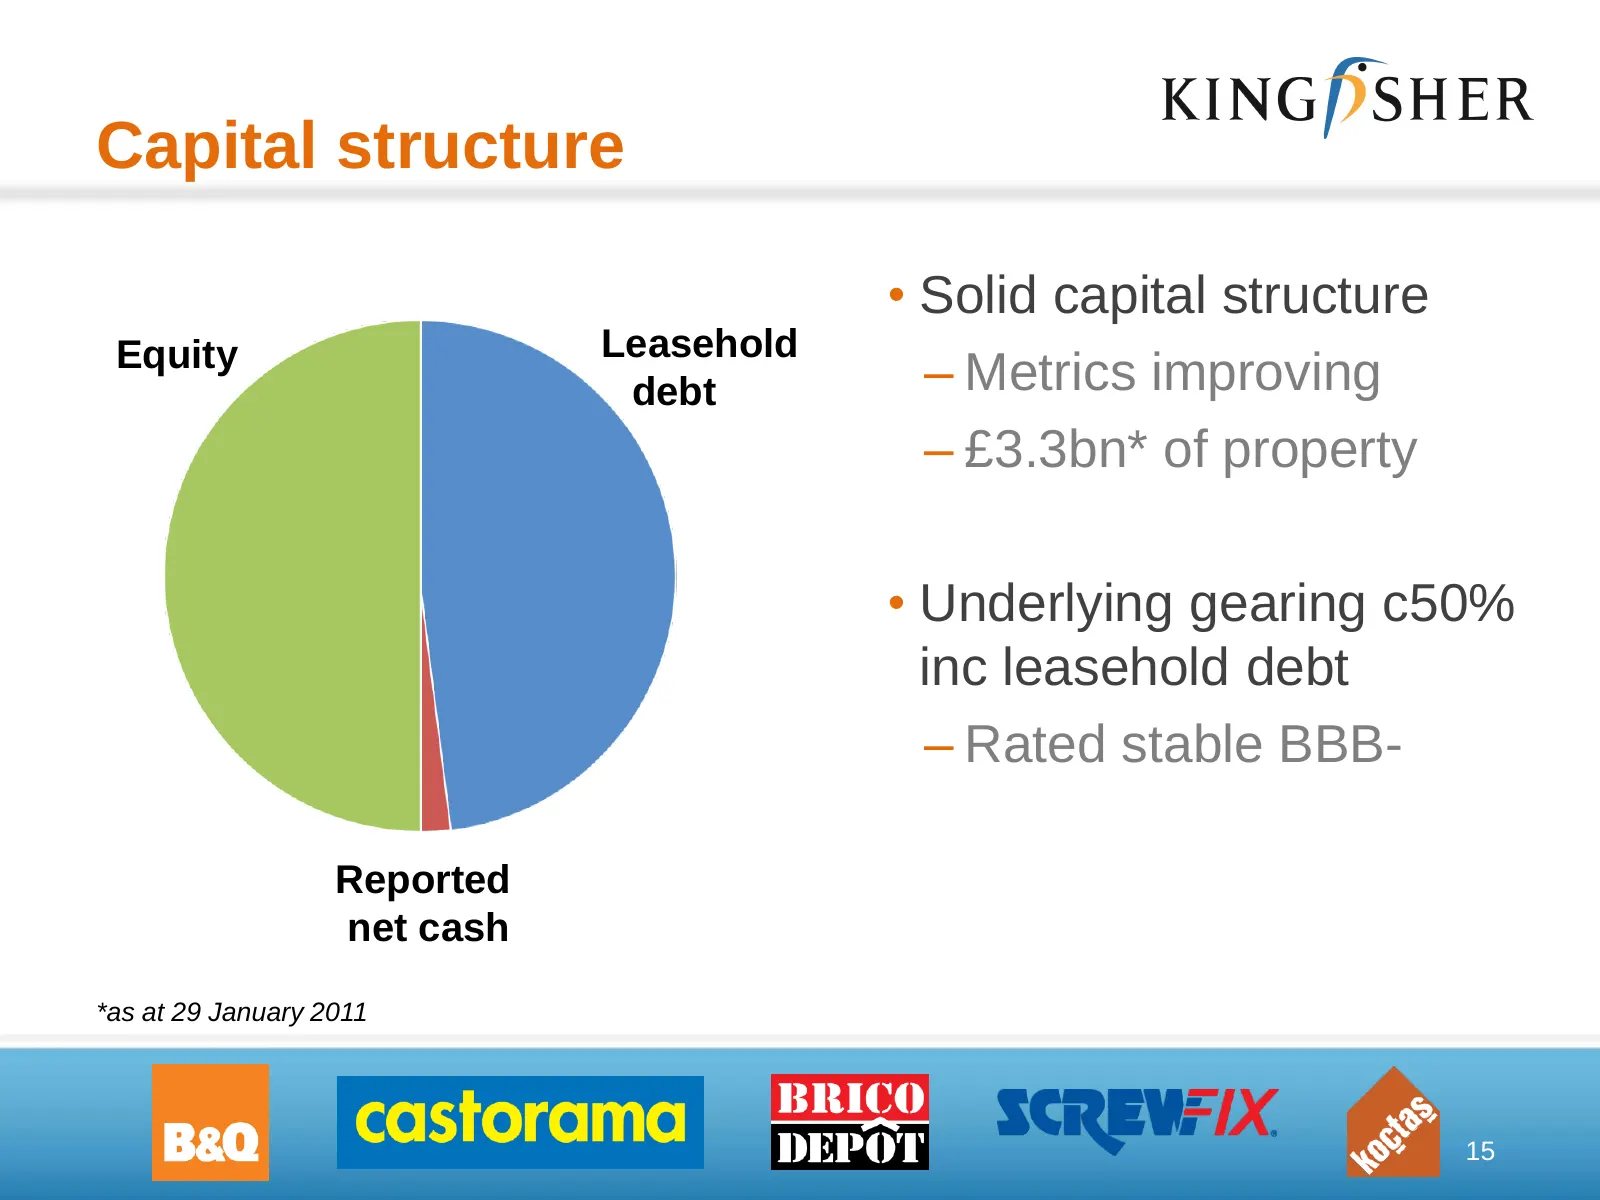
Capital structure • Solid capital structure Equity Leasehold debt – Metrics improving – £3.3bn* of property • Underlying gearing c50% inc leasehold debt – Rated stable BBB- Reported net cash *as at 29 January 2011 15
Slide 17: Higher growth investment…
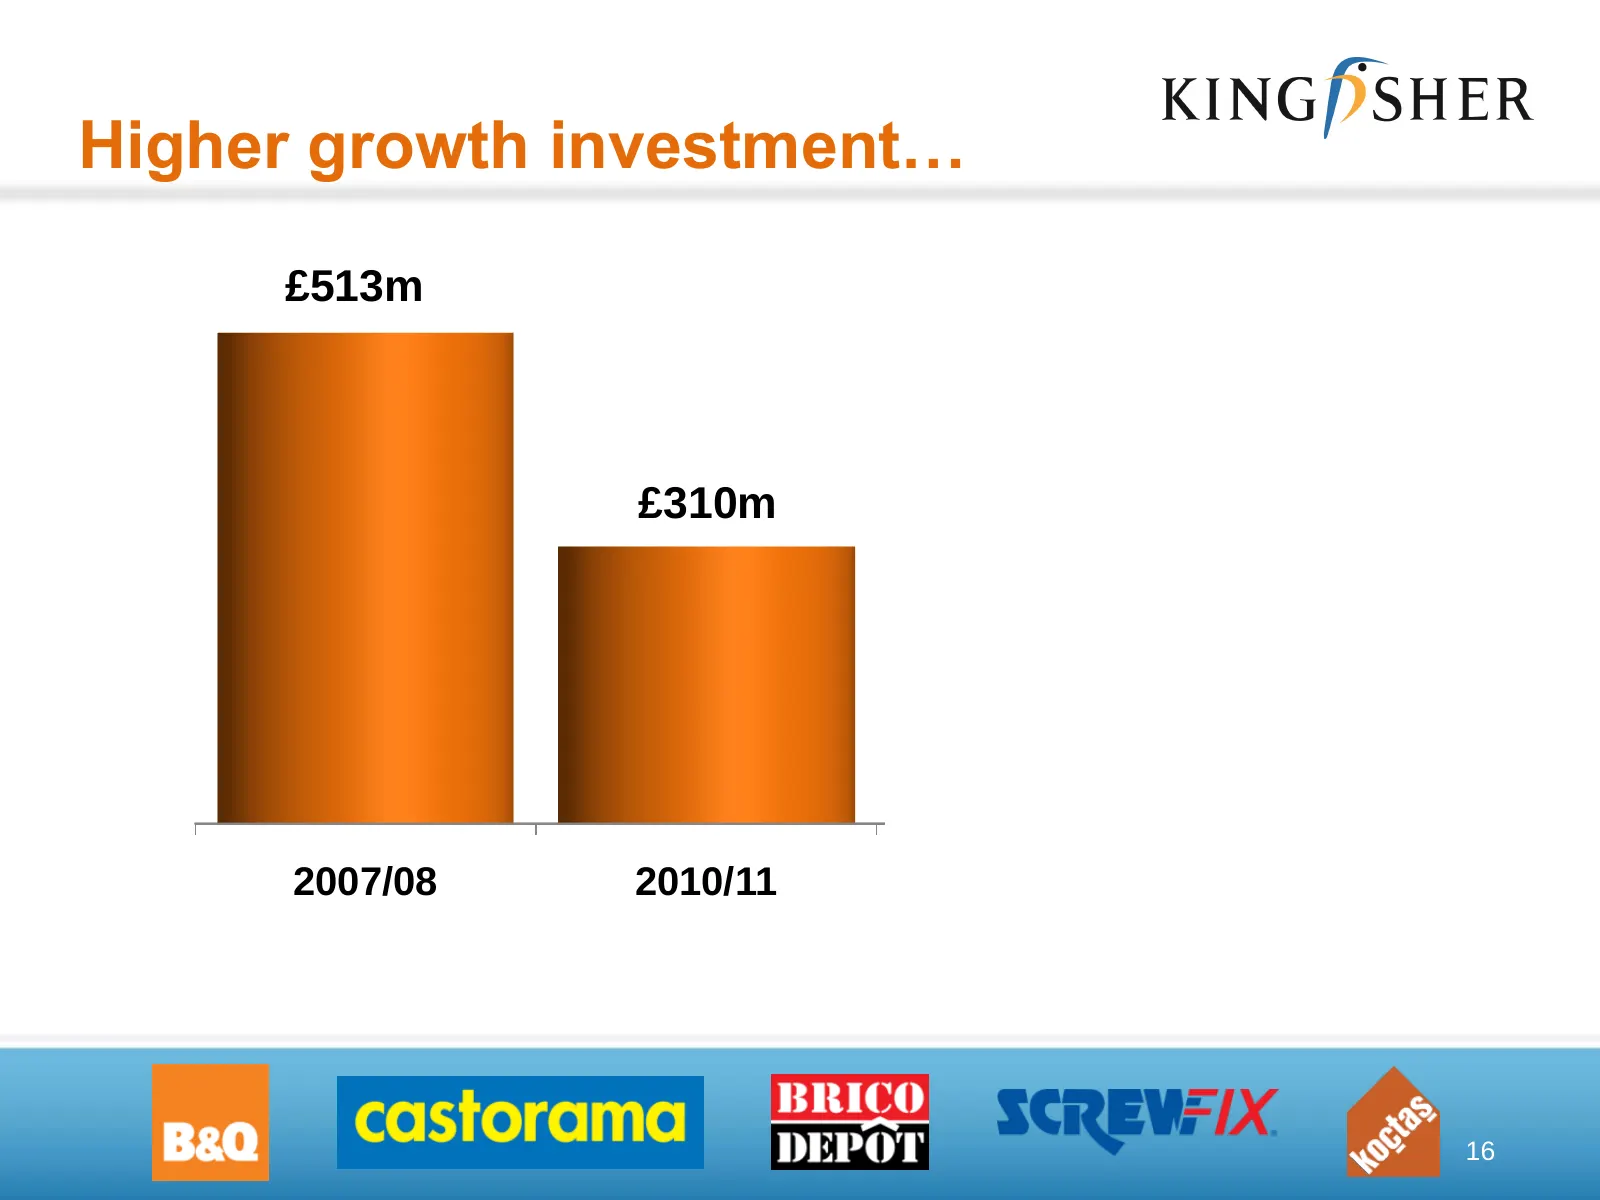
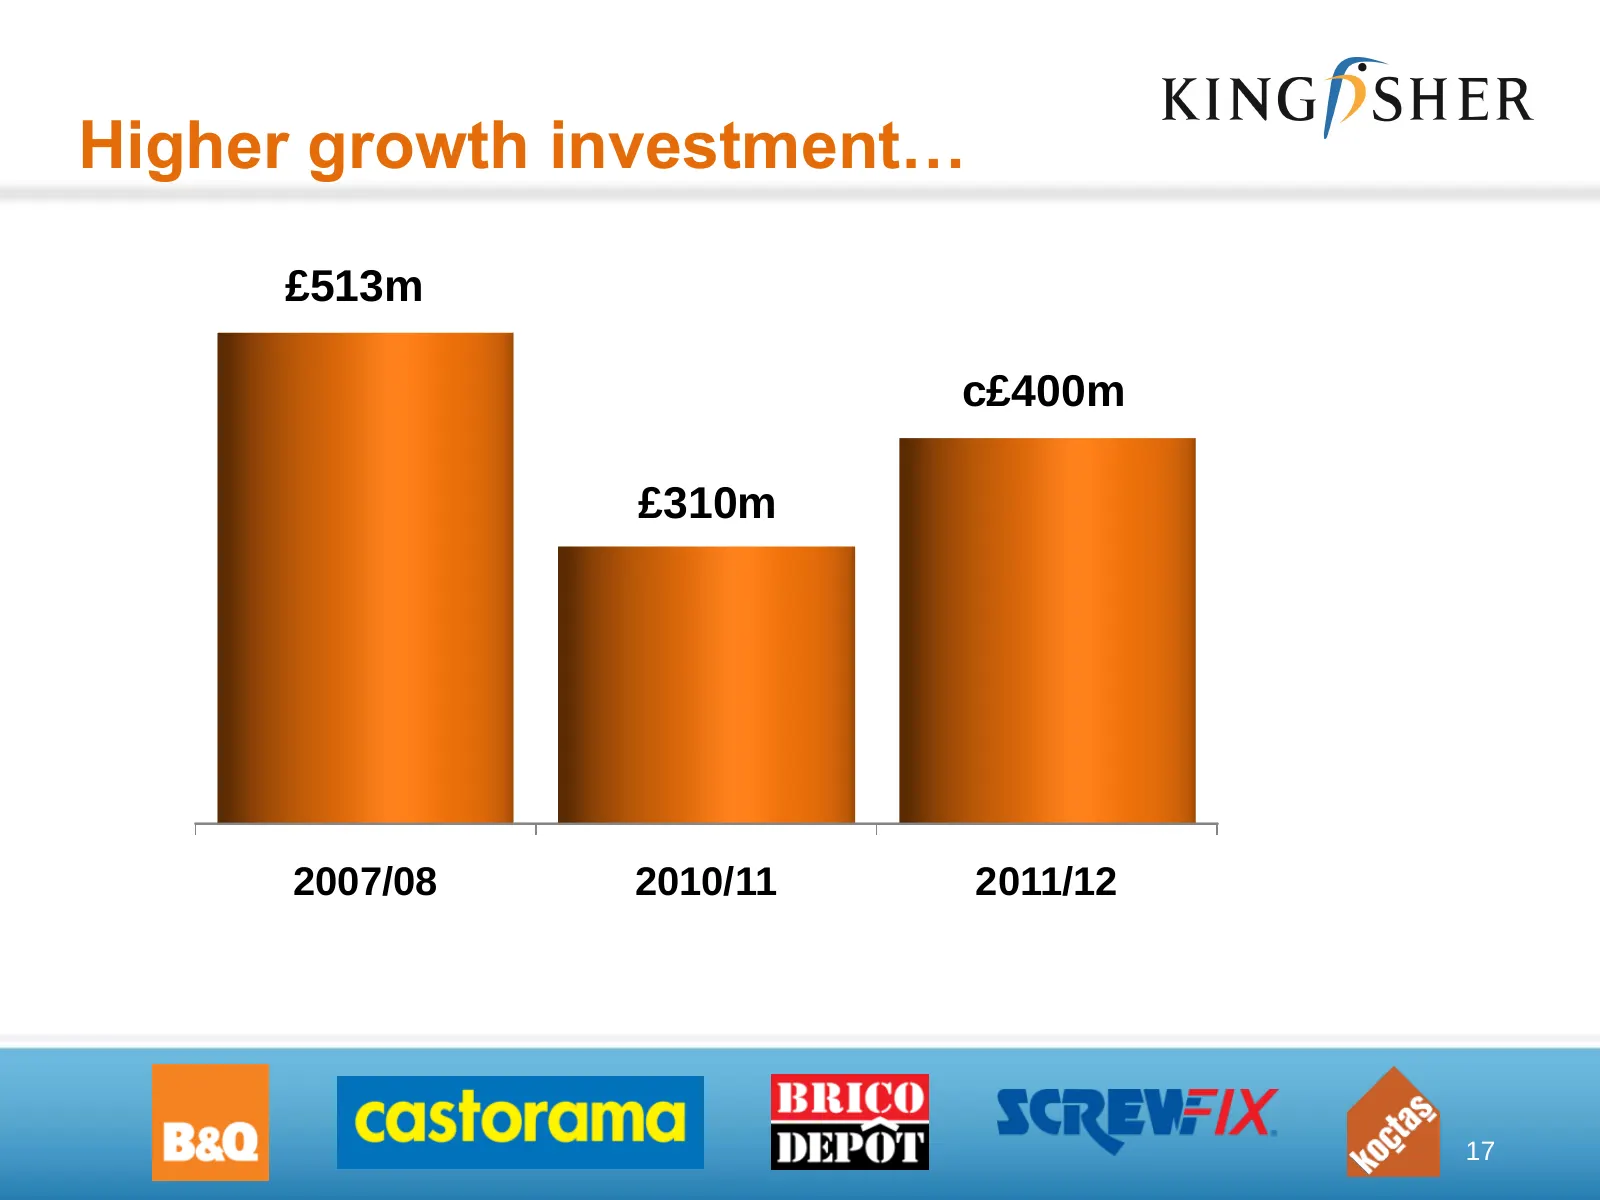
Higher growth investment… £513m £310m 2007/08 2010/11 2011/12 16
Slide 18: Higher growth investment…
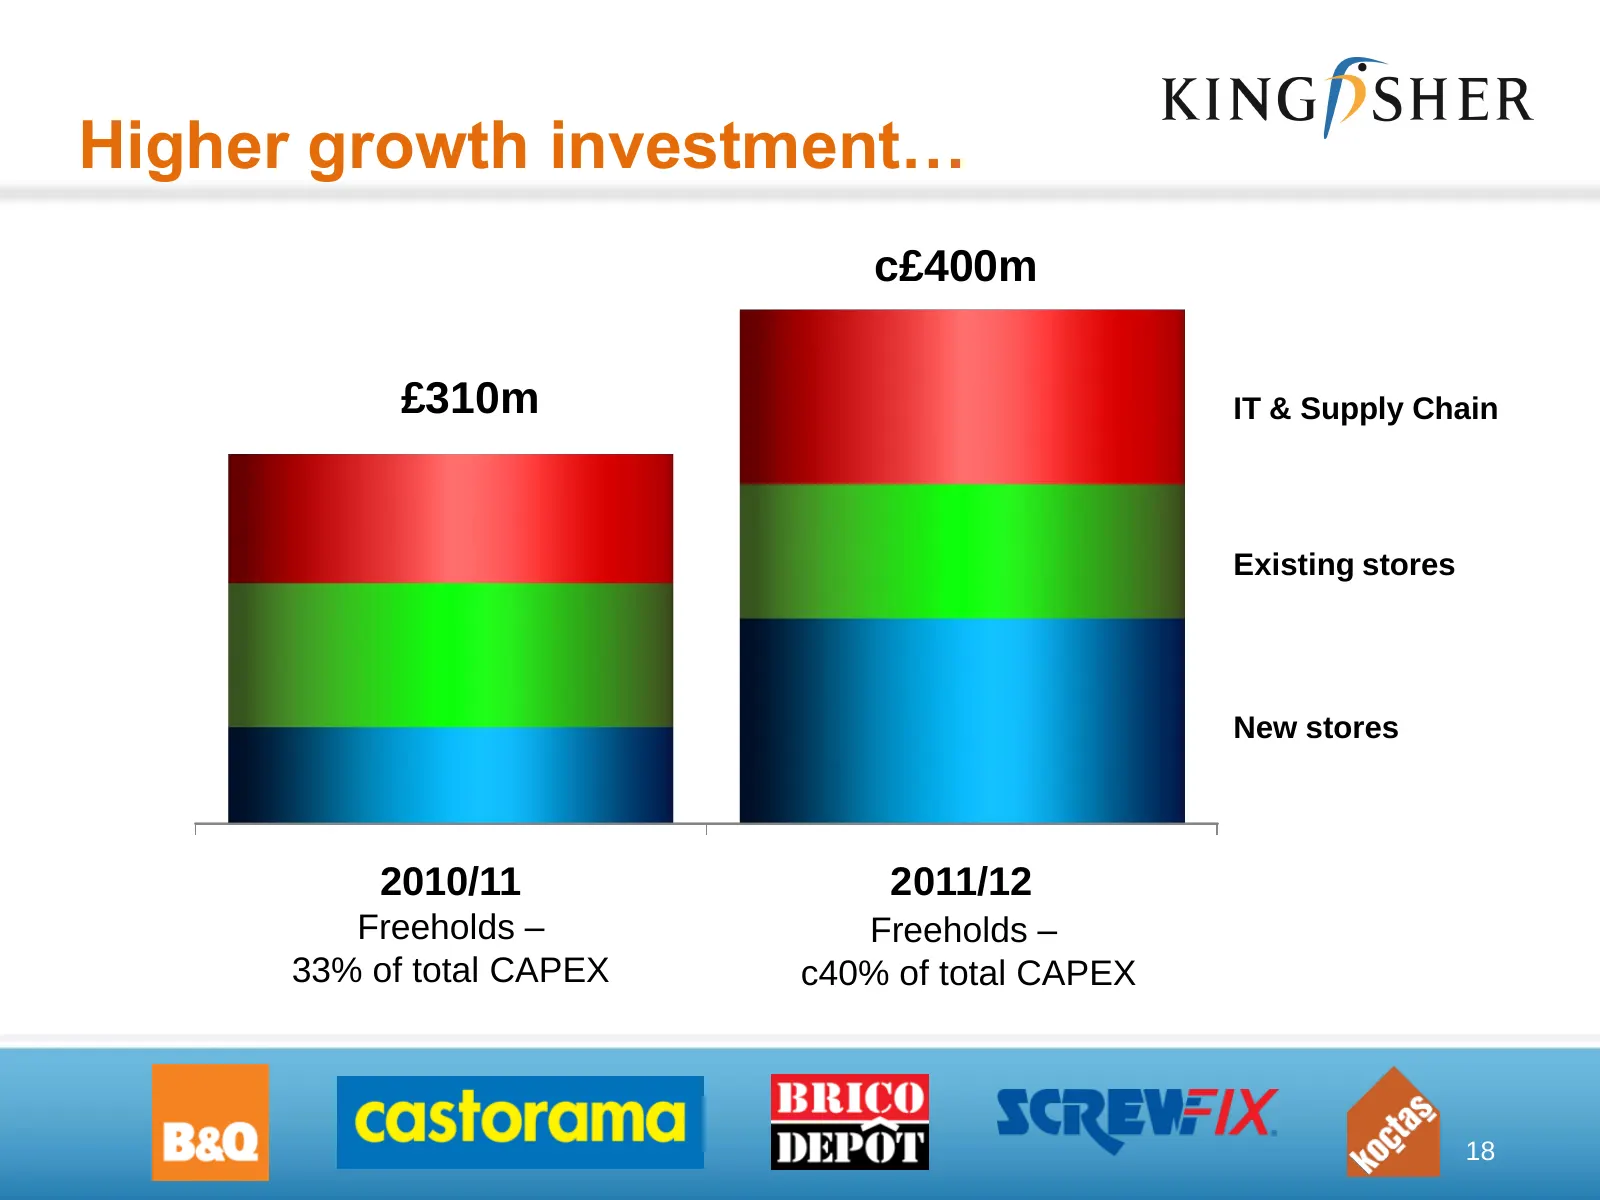
Higher growth investment… £513m c£400m £310m 2007/08 2010/11 2011/12 17
Slide 19: Higher growth investment…
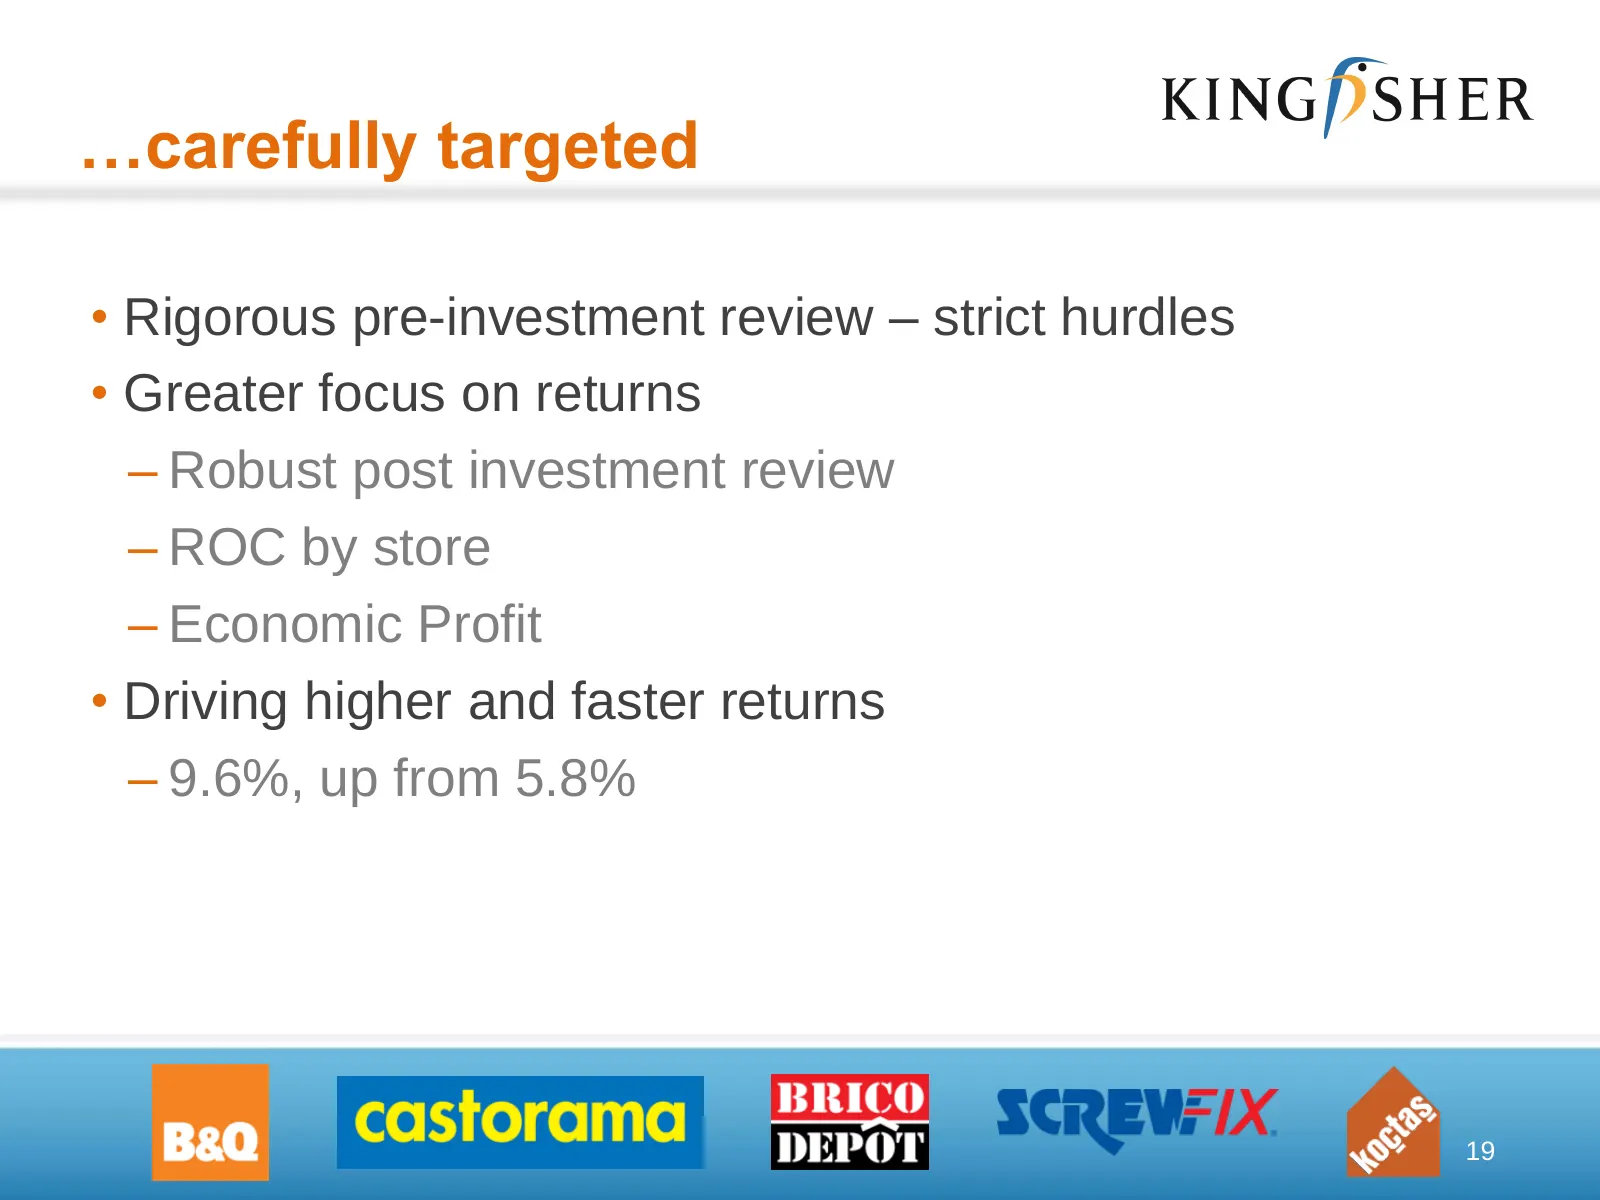
Higher growth investment… c£400m £310m IT & Supply Chain Existing stores New stores 2010/11 2011/12 Freeholds – Freeholds – 33% of total CAPEX c40% of total CAPEX 18
Slide 20: …carefully targeted
…carefully targeted • Rigorous pre-investment review – strict hurdles • Greater focus on returns – Robust post investment review – ROC by store – Economic Profit • Driving higher and faster returns – 9.6%, up from 5.8% 19
Slide 21: Space growth
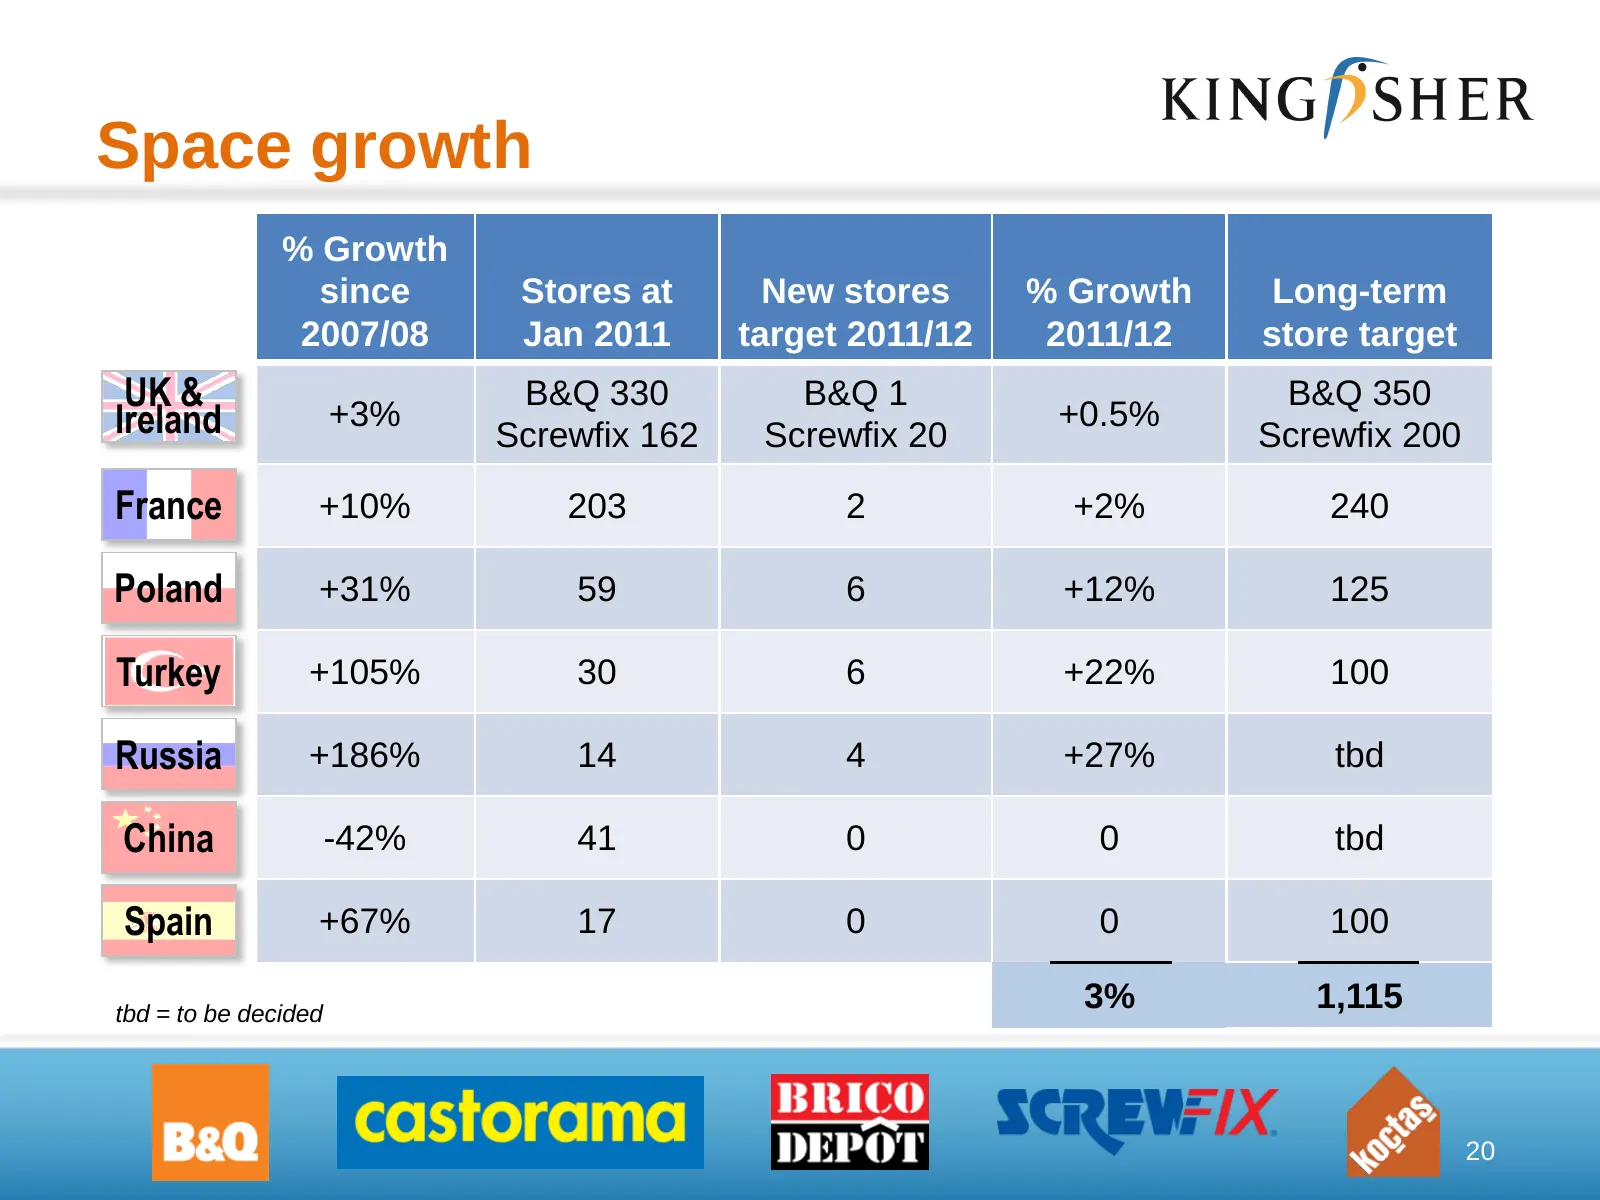
Space growth % Growth since Stores at New stores % Growth Long-term 2007/08 Jan 2011 target 2011/12 2011/12 store target UK & B&Q 330 B&Q 1 B&Q 350 Ireland +3% Screwfix 162 Screwfix 20 +0.5% Screwfix 200 France +10% 203 2 +2% 240 Poland +31% 59 6 +12% 125 Turkey +105% 30 6 +22% 100 Russia +186% 14 4
Slide 22: Summary
Summary • Delivering value in all divisions • Adjusted basic EPS up 25% • Excellent free cash flow & ROC improvement • Dividend growth • Increased capex to support growth 21
Slide 23: Ian Cheshire, Group Chief Executive
Ian Cheshire Group Chief Executive 22
Slide 24: Agenda
Agenda 1 Delivering Value - a success powerful base for growth 2 Attractive markets more growth to unlock 3 Delivering More Value creating the leader 23
Slide 25: Agenda
Agenda 1 Delivering Value - a success powerful base for growth 2 Attractive markets more growth to unlock 3 Delivering More Value creating the leader 24
Slide 26: 2008 – a new approach...
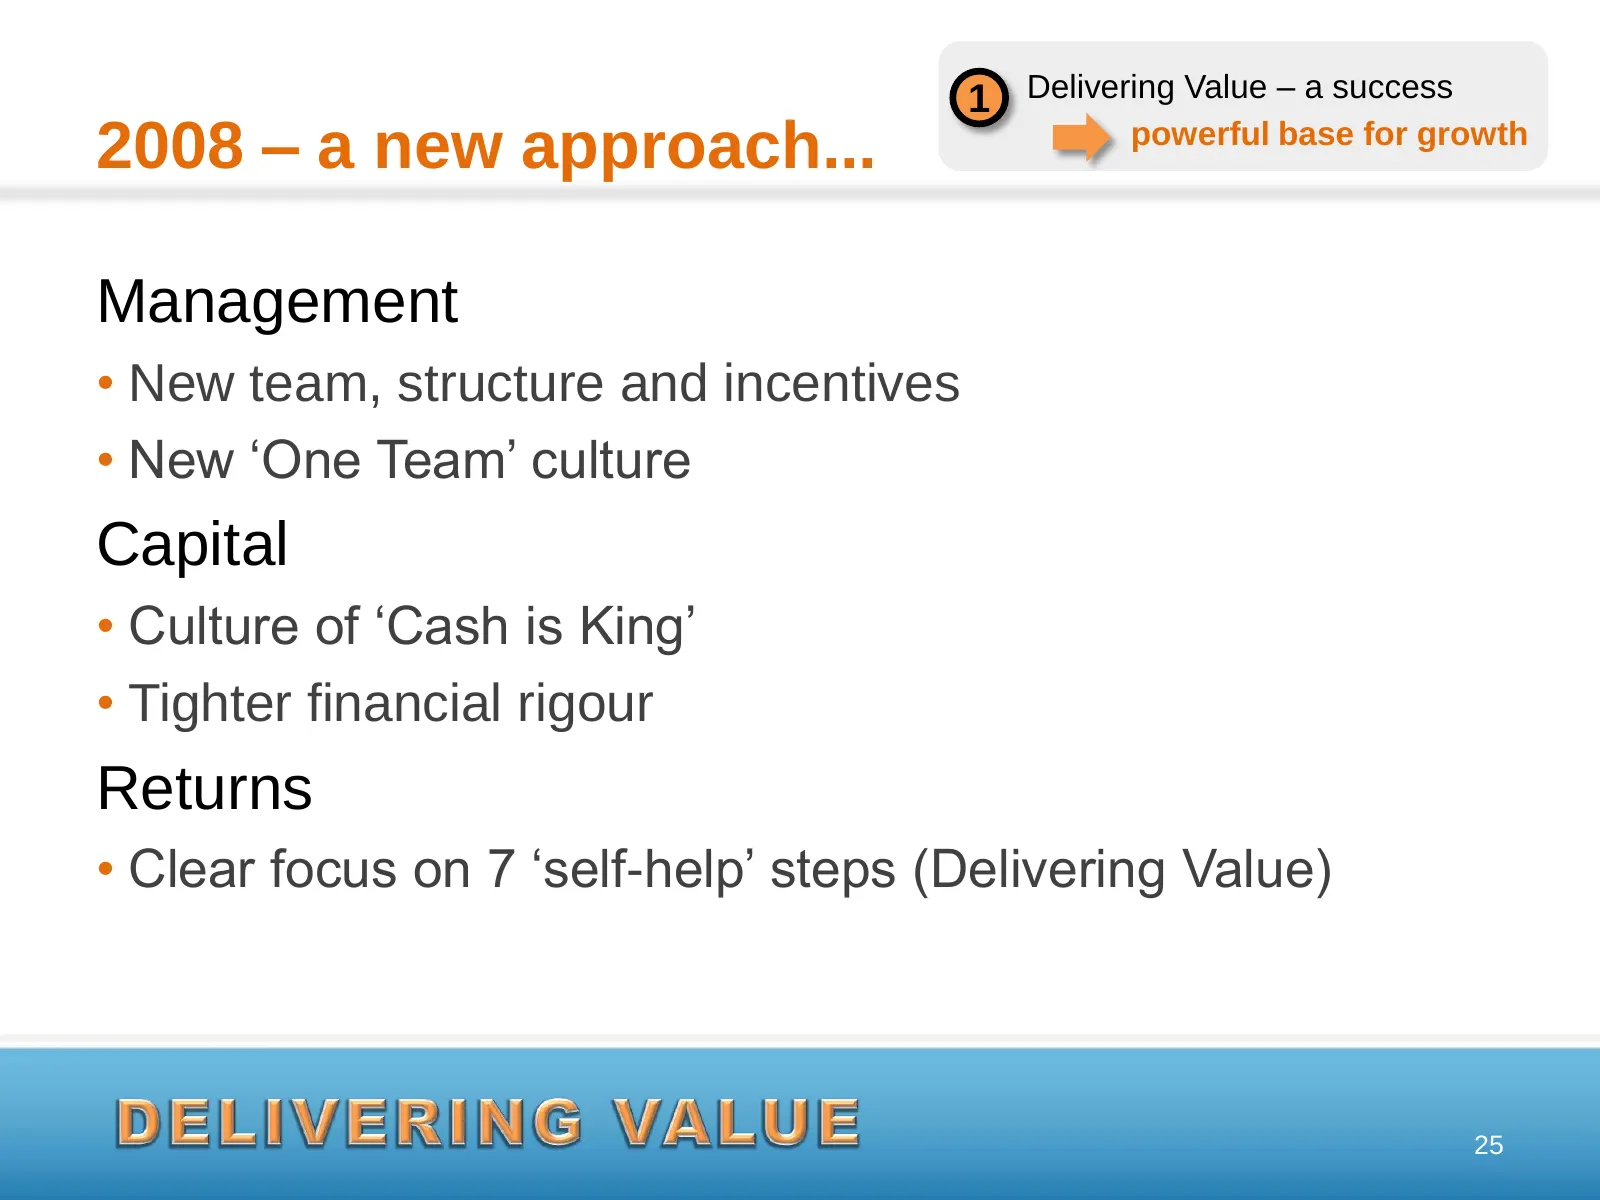
1 Delivering Value – a success 2008 – a new approach... powerful base for growth Management • New team, structure and incentives • New „One Team‟ culture Capital • Culture of „Cash is King‟ • Tighter financial rigour Returns • Clear focus on 7 „self-help‟ steps (Delivering Value) 25
Slide 27: Delivering in the business
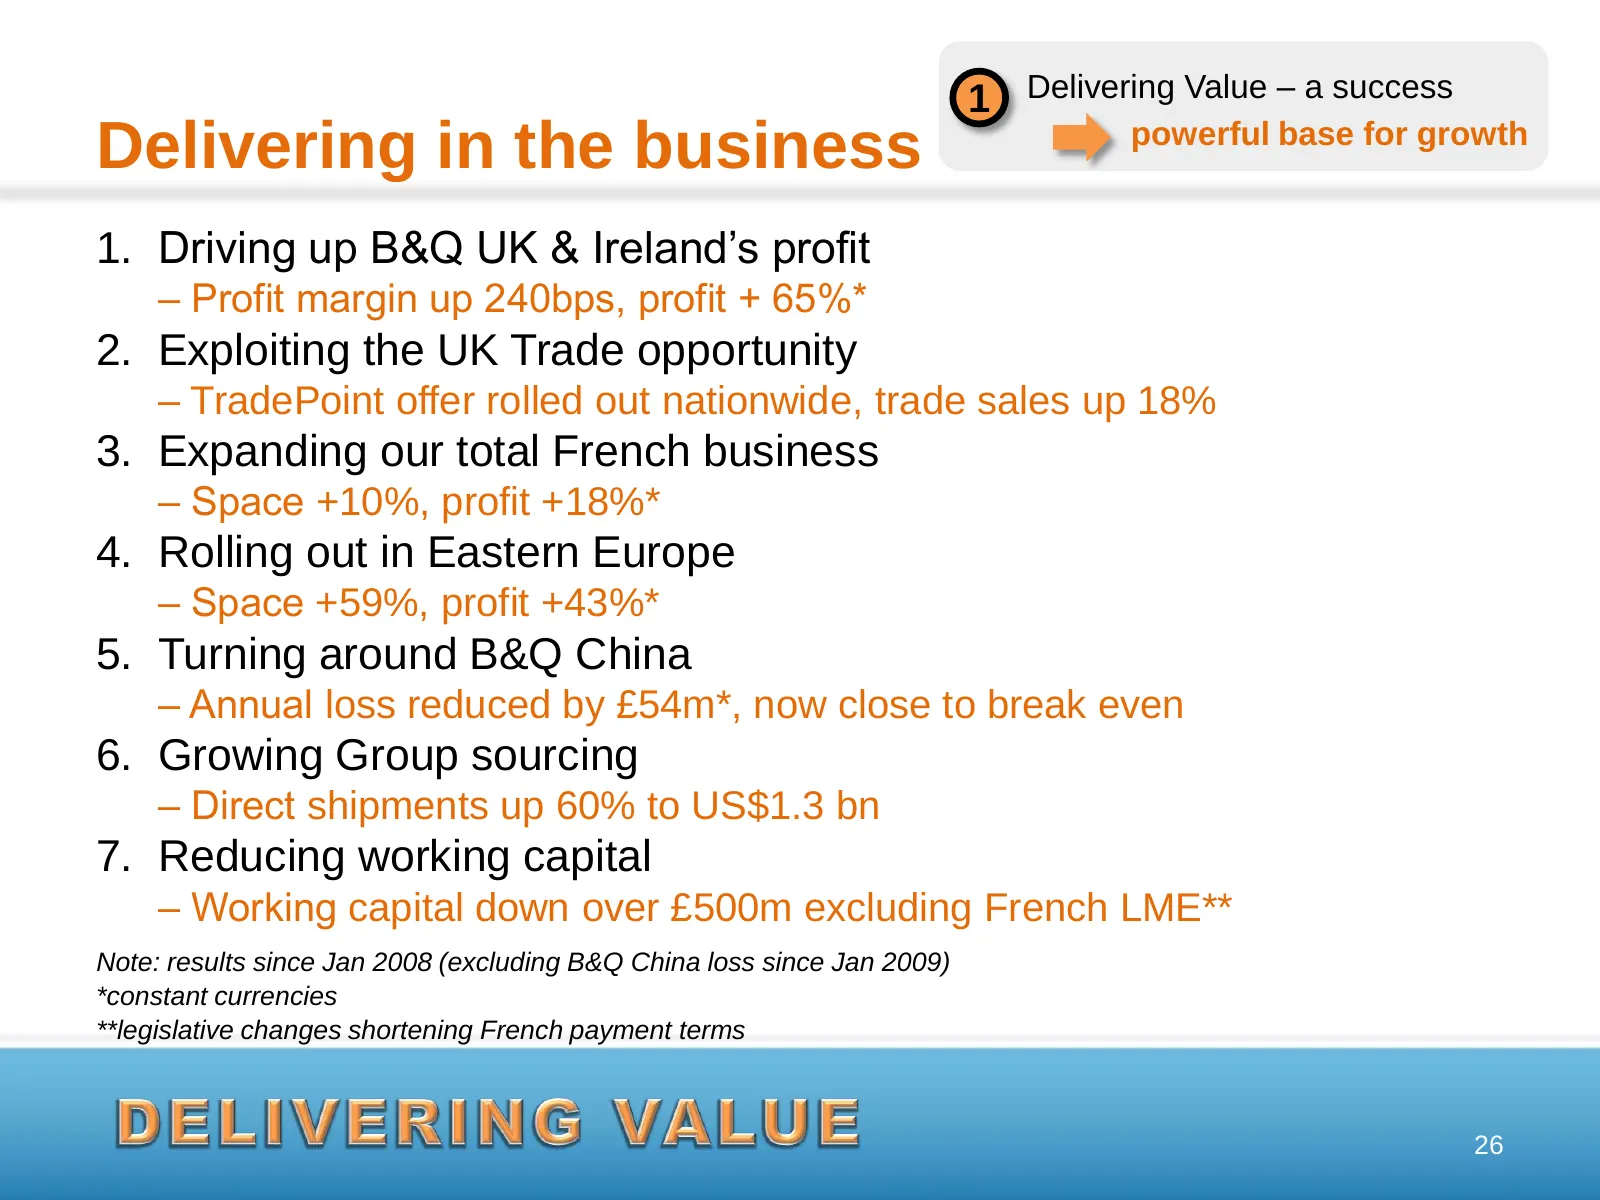
1 Delivering Value – a success Delivering in the business powerful base for growth 1. Driving up B&Q UK & Ireland‟s profit ‒ Profit margin up 240bps, profit + 65%* 2. Exploiting the UK Trade opportunity ‒ TradePoint offer rolled out nationwide, trade sales up 18% 3. Expanding our total French busine
Slide 28: Delivering for shareholders
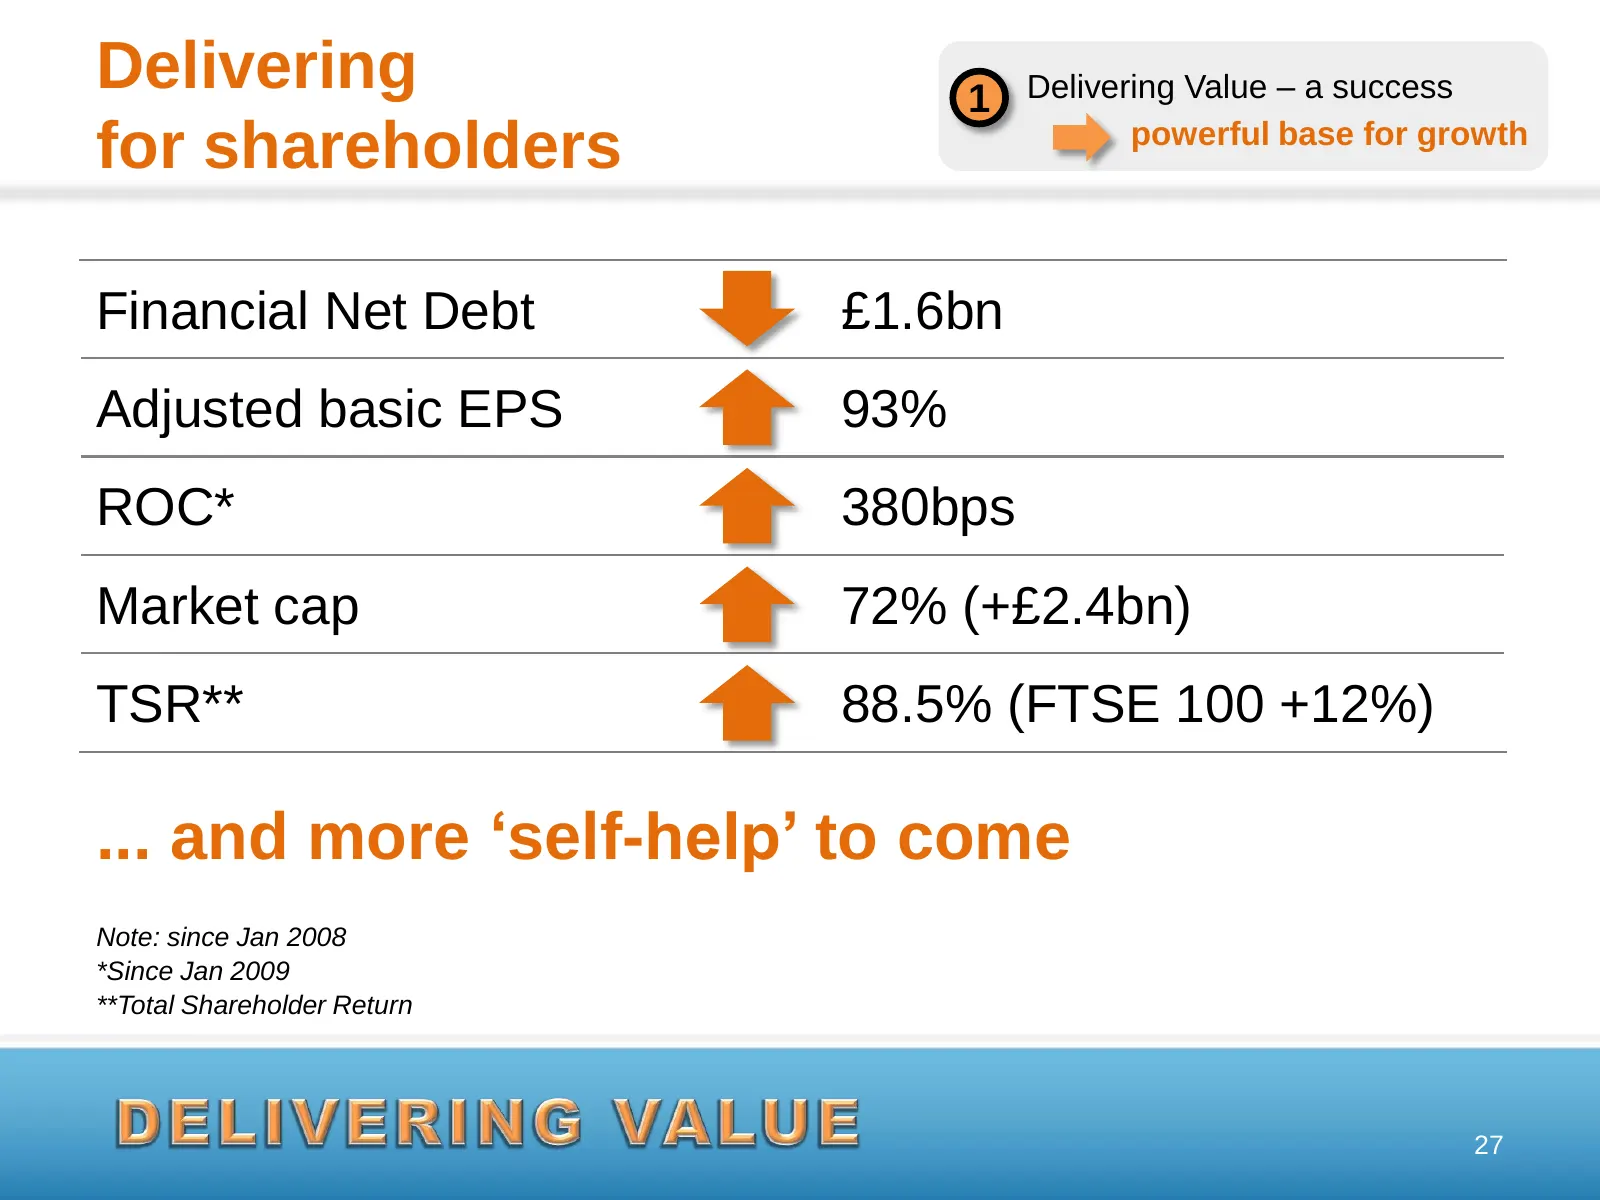
Delivering 1 Delivering Value – a success for shareholders powerful base for growth Financial Net Debt £1.6bn Adjusted basic EPS 93% ROC* 380bps Market cap 72% (+£2.4bn) TSR** 88.5% (FTSE 100 +12%) ... and more ‘self-help’ to come Note: since Jan 2008 *Since Jan 2009 **Total Shareholder Return 27
Slide 29: A stronger business
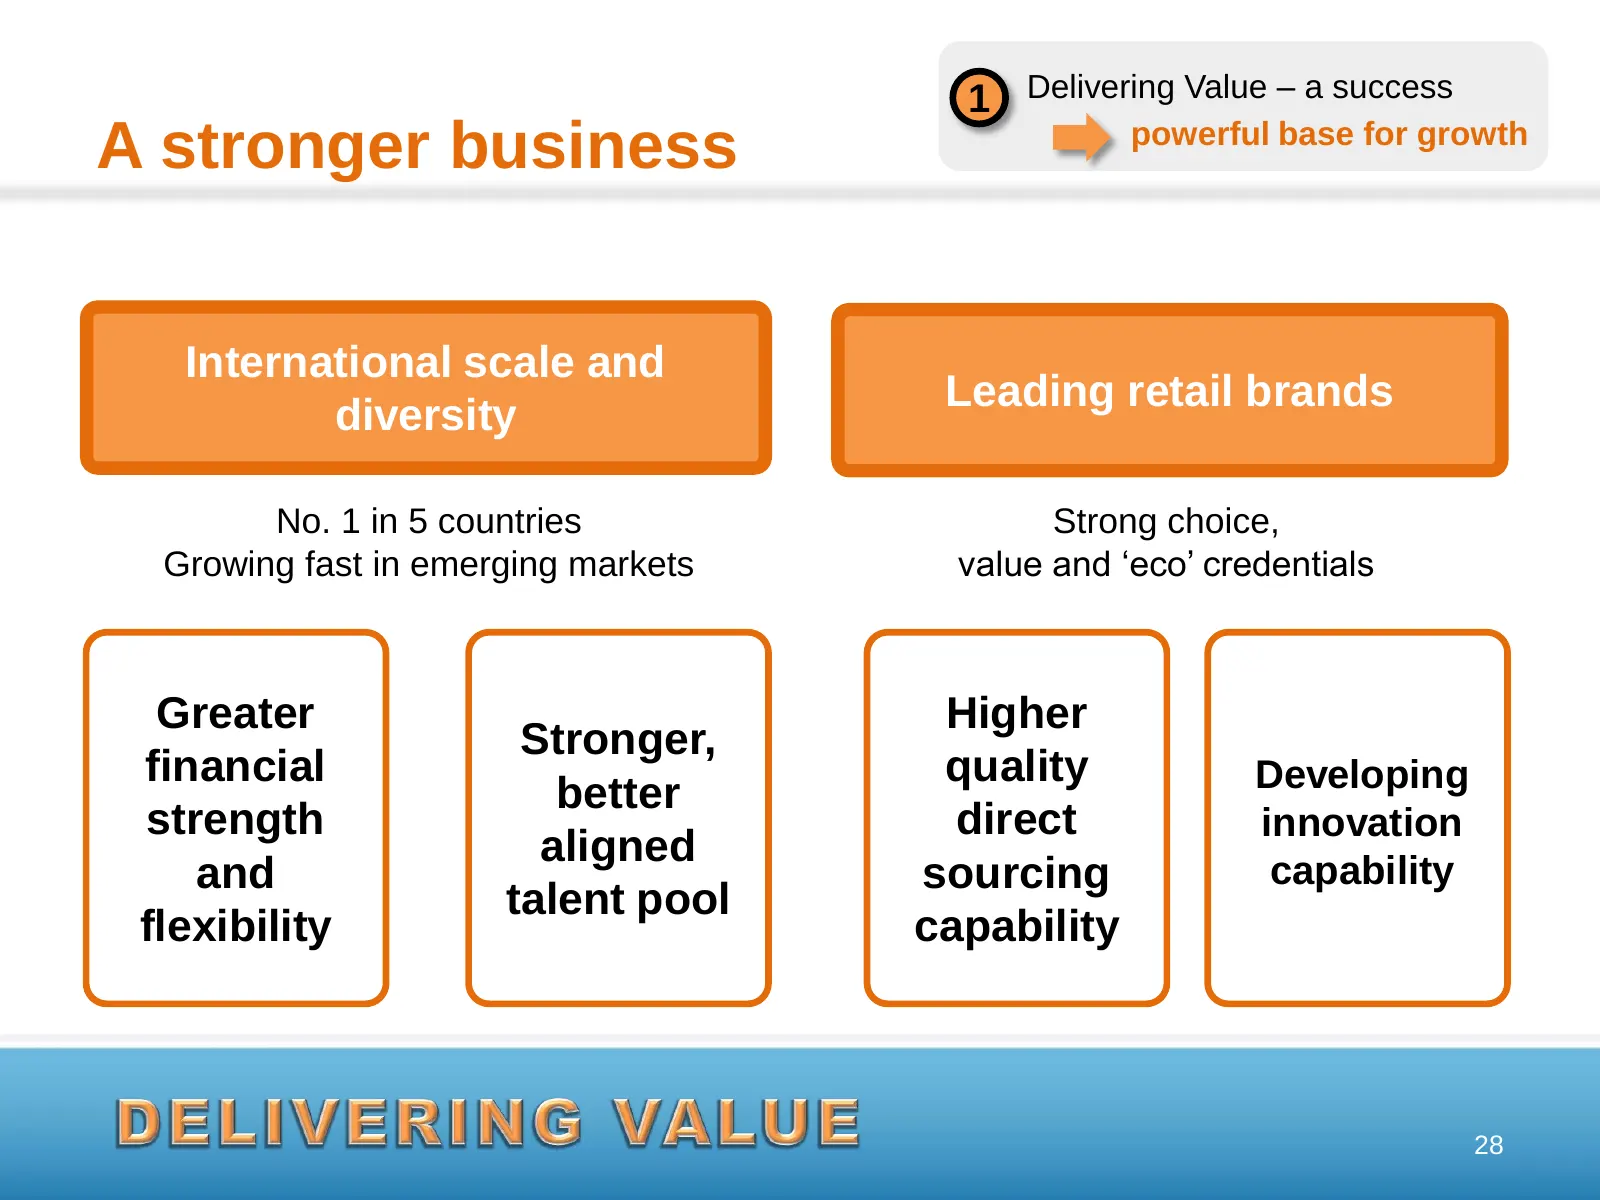
1 Delivering Value – a success A stronger business powerful base for growth International scale and Leading retail brands diversity No. 1 in 5 countries Strong choice, Growing fast in emerging markets value and „eco‟ credentials Greater Higher Stronger, financial quality Developing better strength d
Slide 30: Agenda
Agenda 1 Delivering Value - a success powerful base for growth 2 Attractive markets more growth to unlock 3 Delivering More Value creating the leader 29
Slide 31: Attractive market
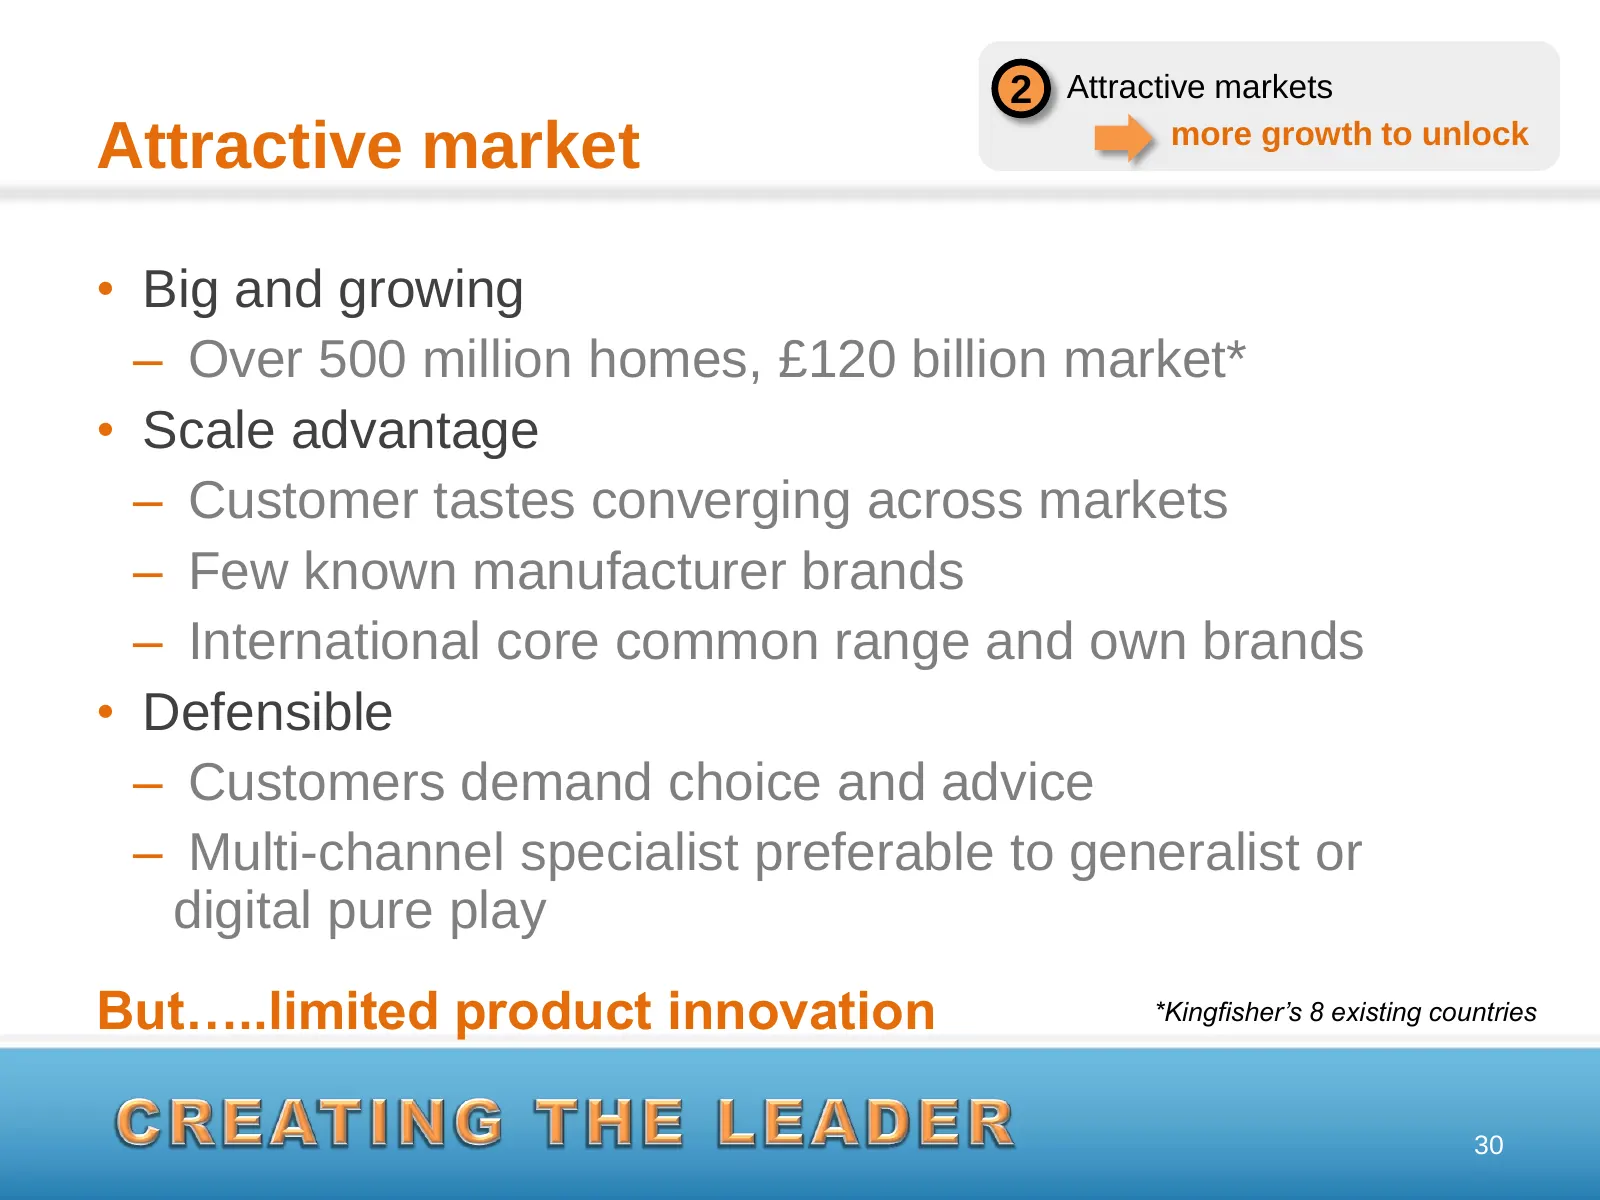
2 Attractive markets Attractive market more growth to unlock • Big and growing – Over 500 million homes, £120 billion market* • Scale advantage – Customer tastes converging across markets – Few known manufacturer brands – International core common range and own brands • Defensible – Customers demand
Slide 32: Developed markets - growth opportunity
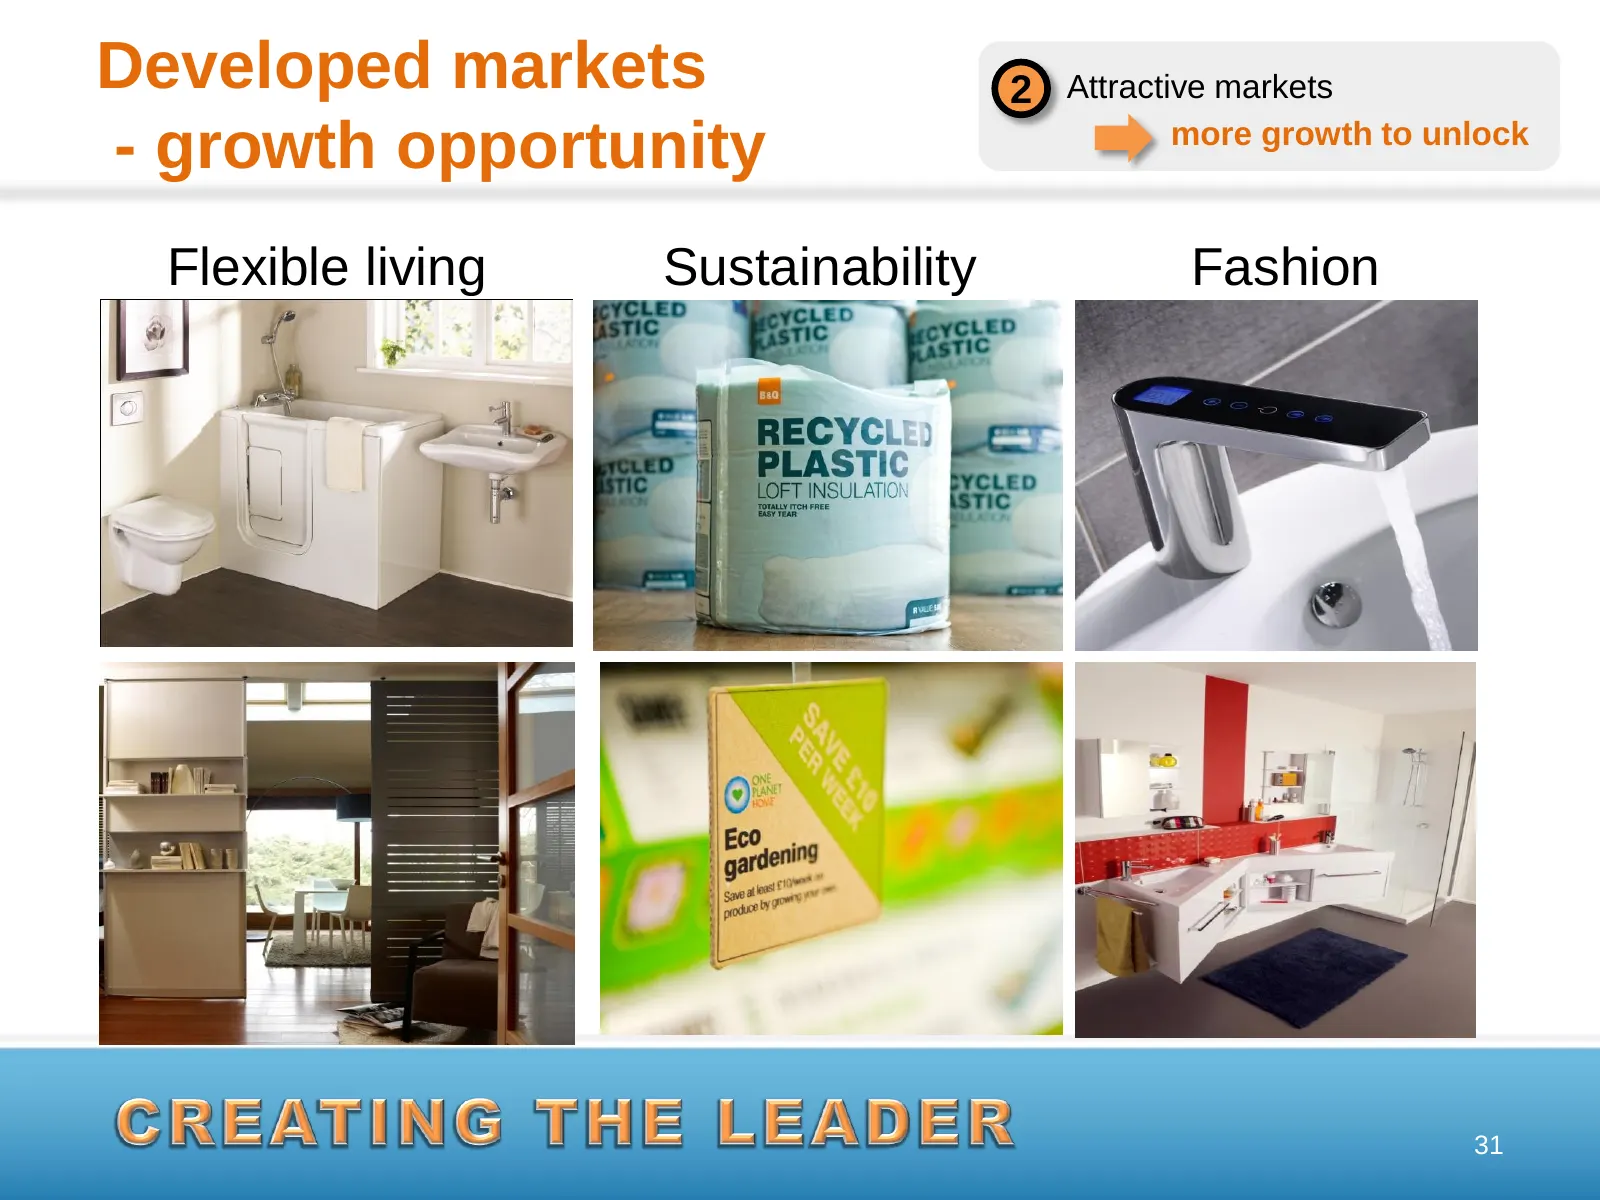
Developed markets 2 Attractive markets - growth opportunity more growth to unlock Flexible living Sustainability Fashion 31
Slide 33: Developed markets – more growth to unlock
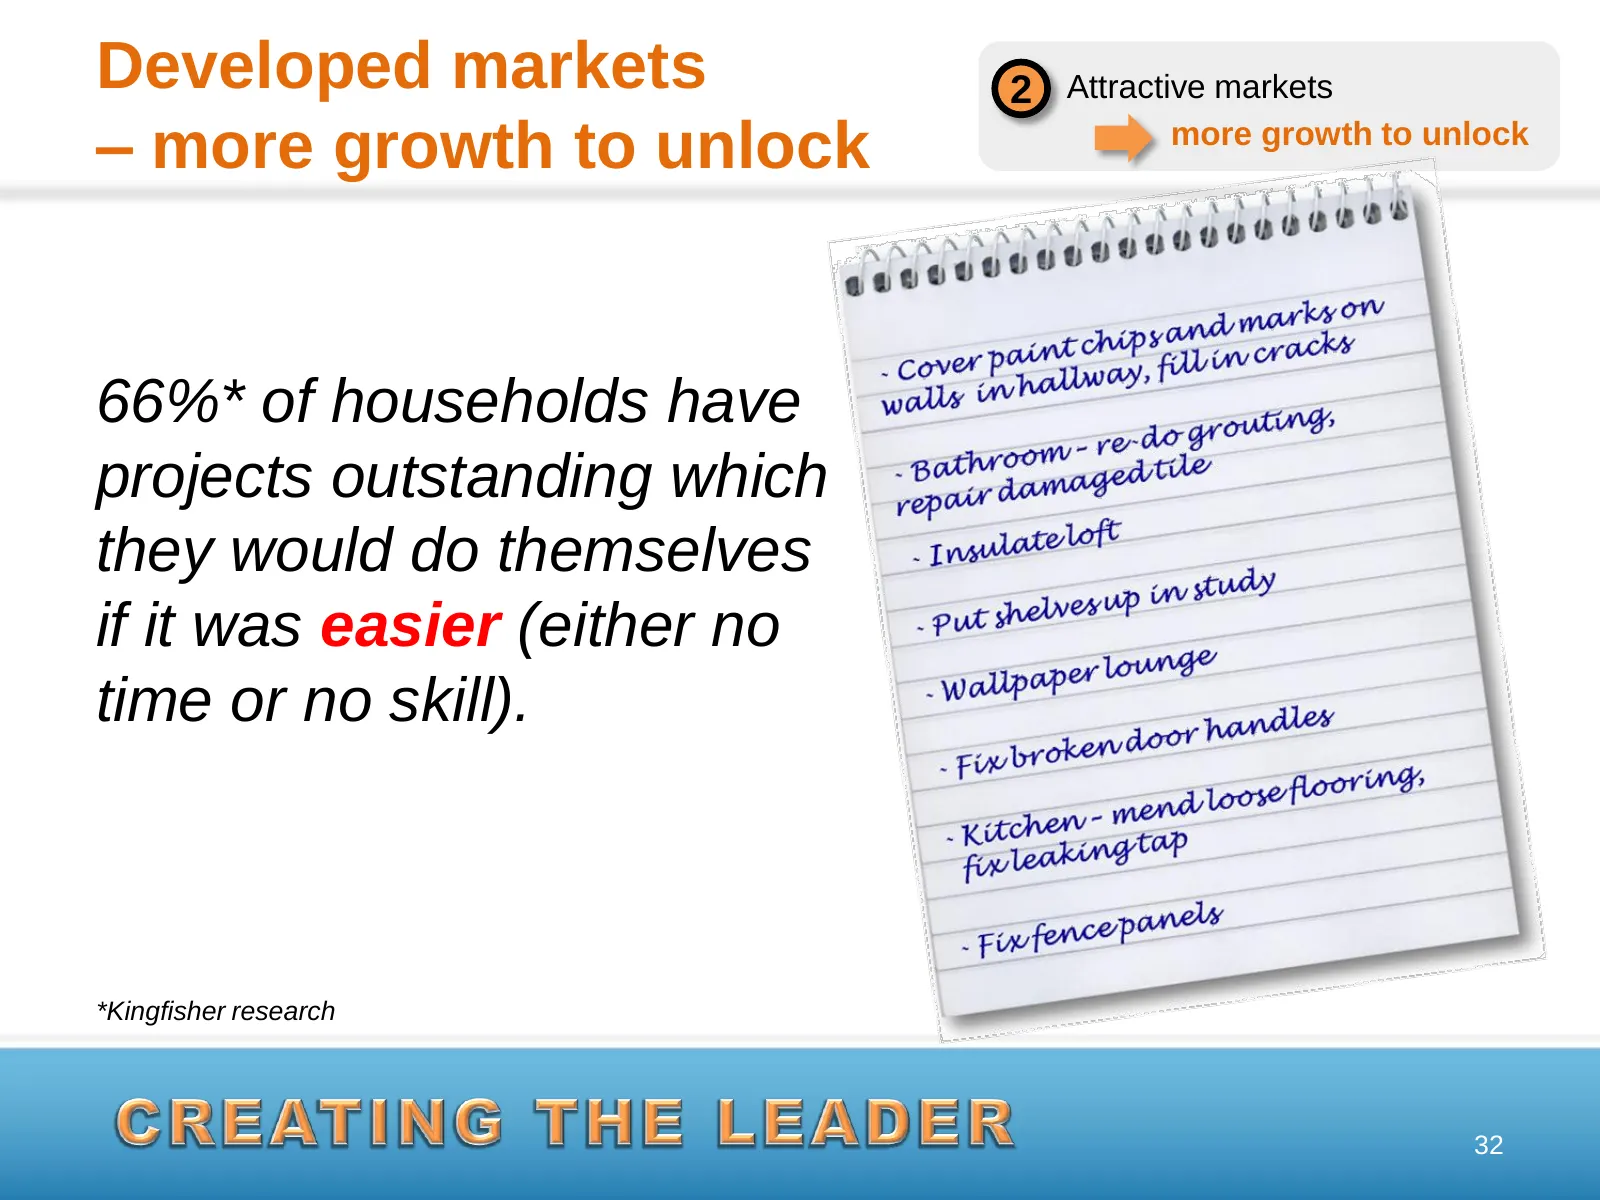
Developed markets 2 Attractive markets – more growth to unlock more growth to unlock 66%* of households have projects outstanding which they would do themselves if it was easier (either no time or no skill). *Kingfisher research 32
Slide 34: Emerging markets – ongoing strong demand
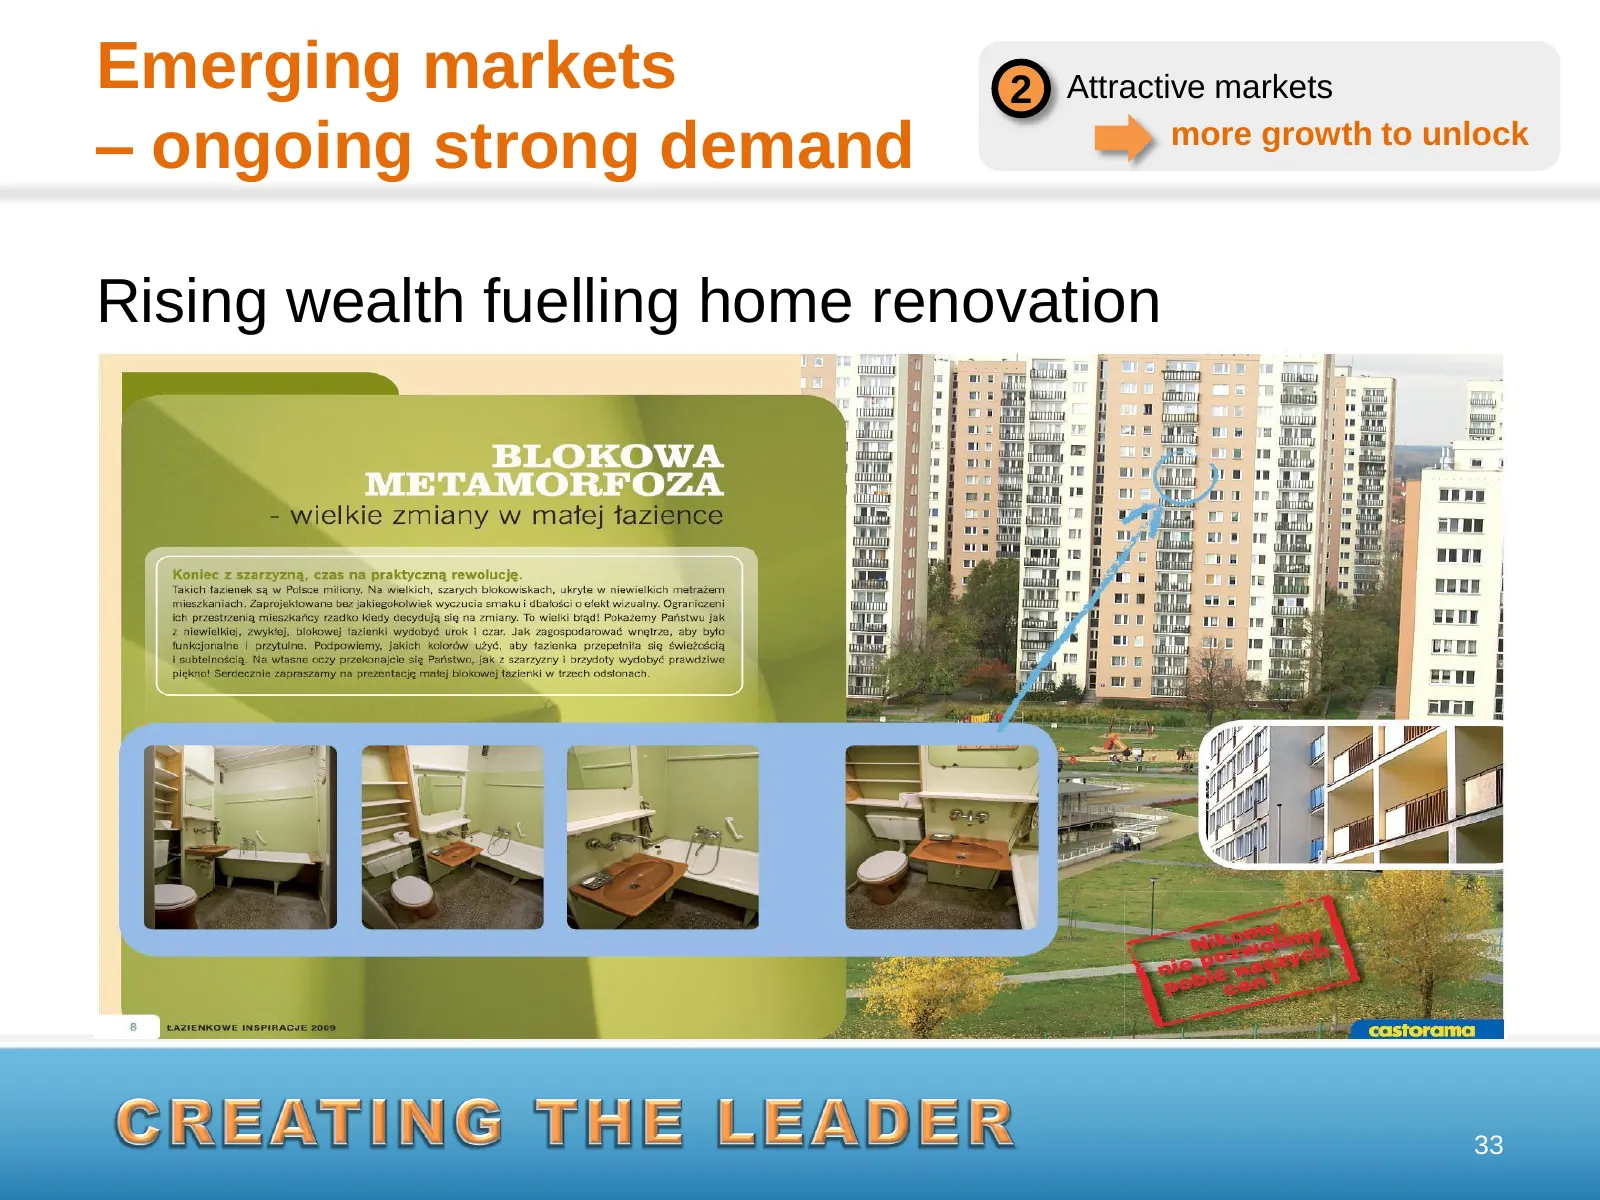
Emerging markets 2 Attractive markets – ongoing strong demand more growth to unlock Rising wealth fuelling home renovation 33
Slide 35: Agenda
Agenda 1 Delivering Value - a success powerful base for growth 2 Attractive markets more growth to unlock 3 Delivering More Value creating the leader 34
Slide 36: A new ambition for the next years
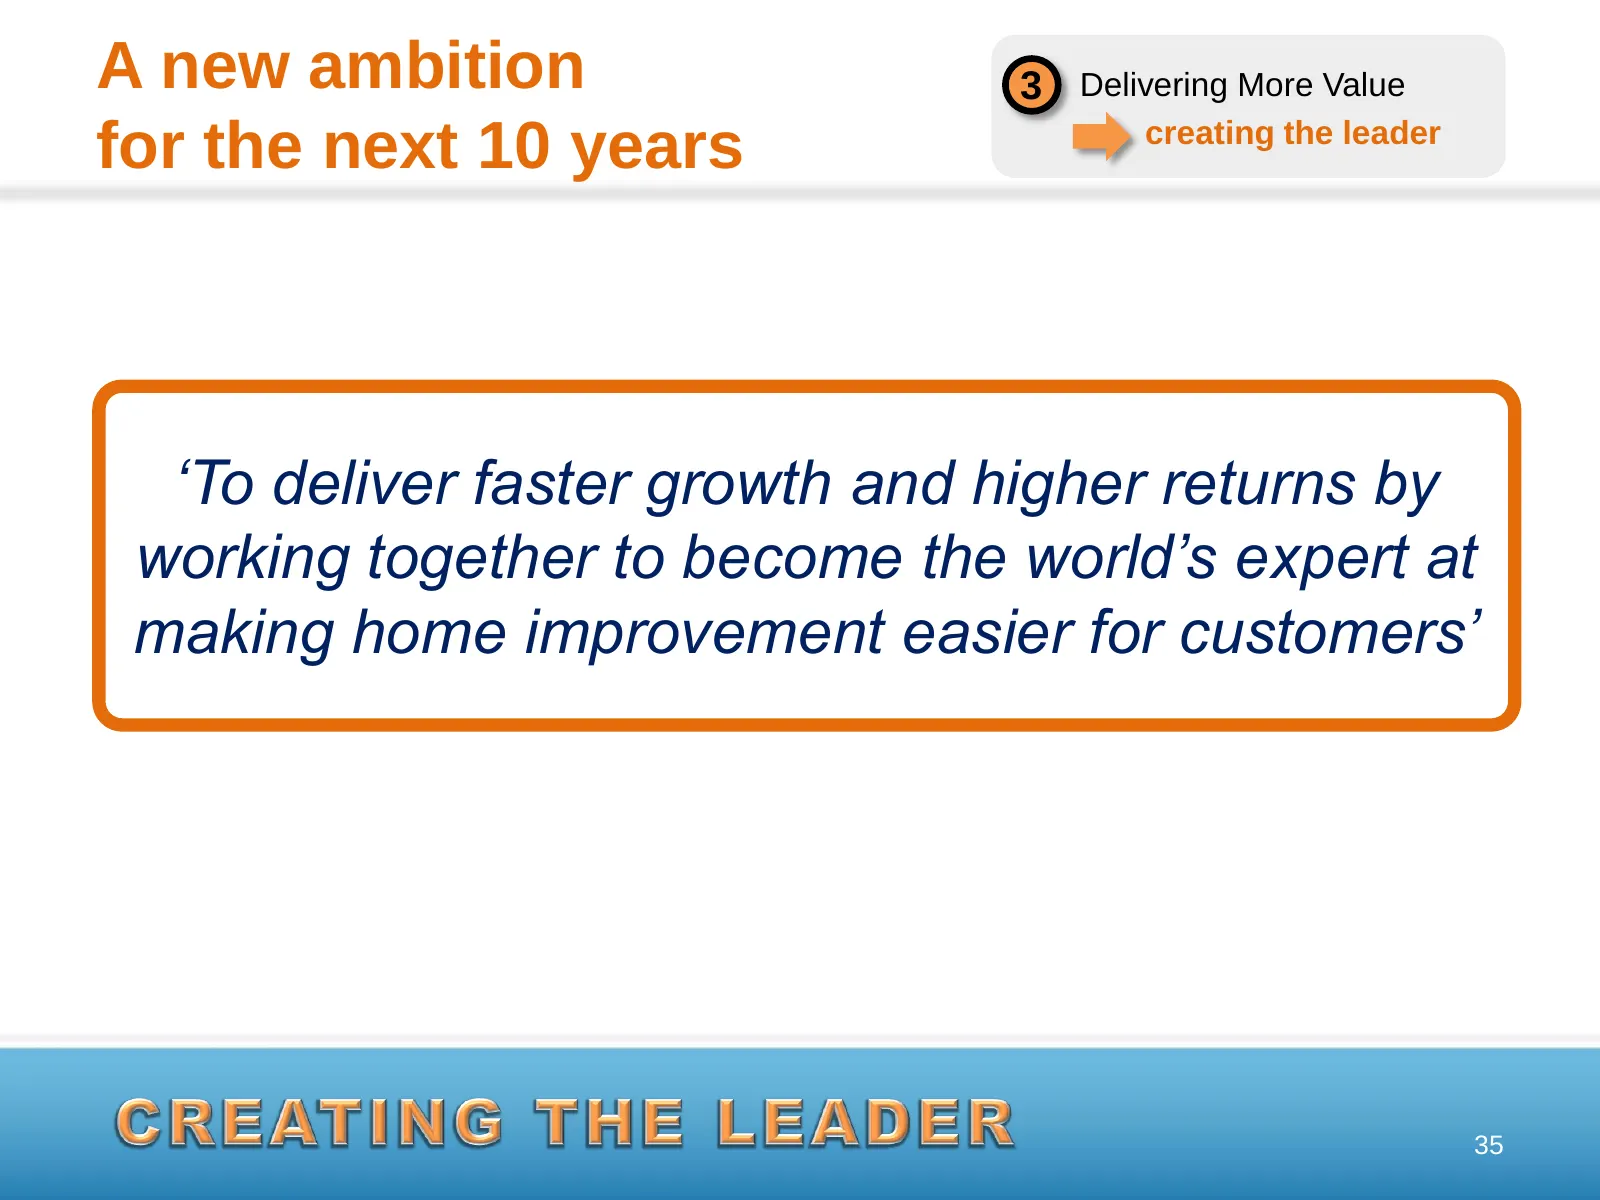
A new ambition 3 Delivering More Value creating the leader for the next 10 years ‘To deliver faster growth and higher returns by working together to become the world’s expert at making home improvement easier for customers’ 35
Slide 37: Faster growth & higher returns
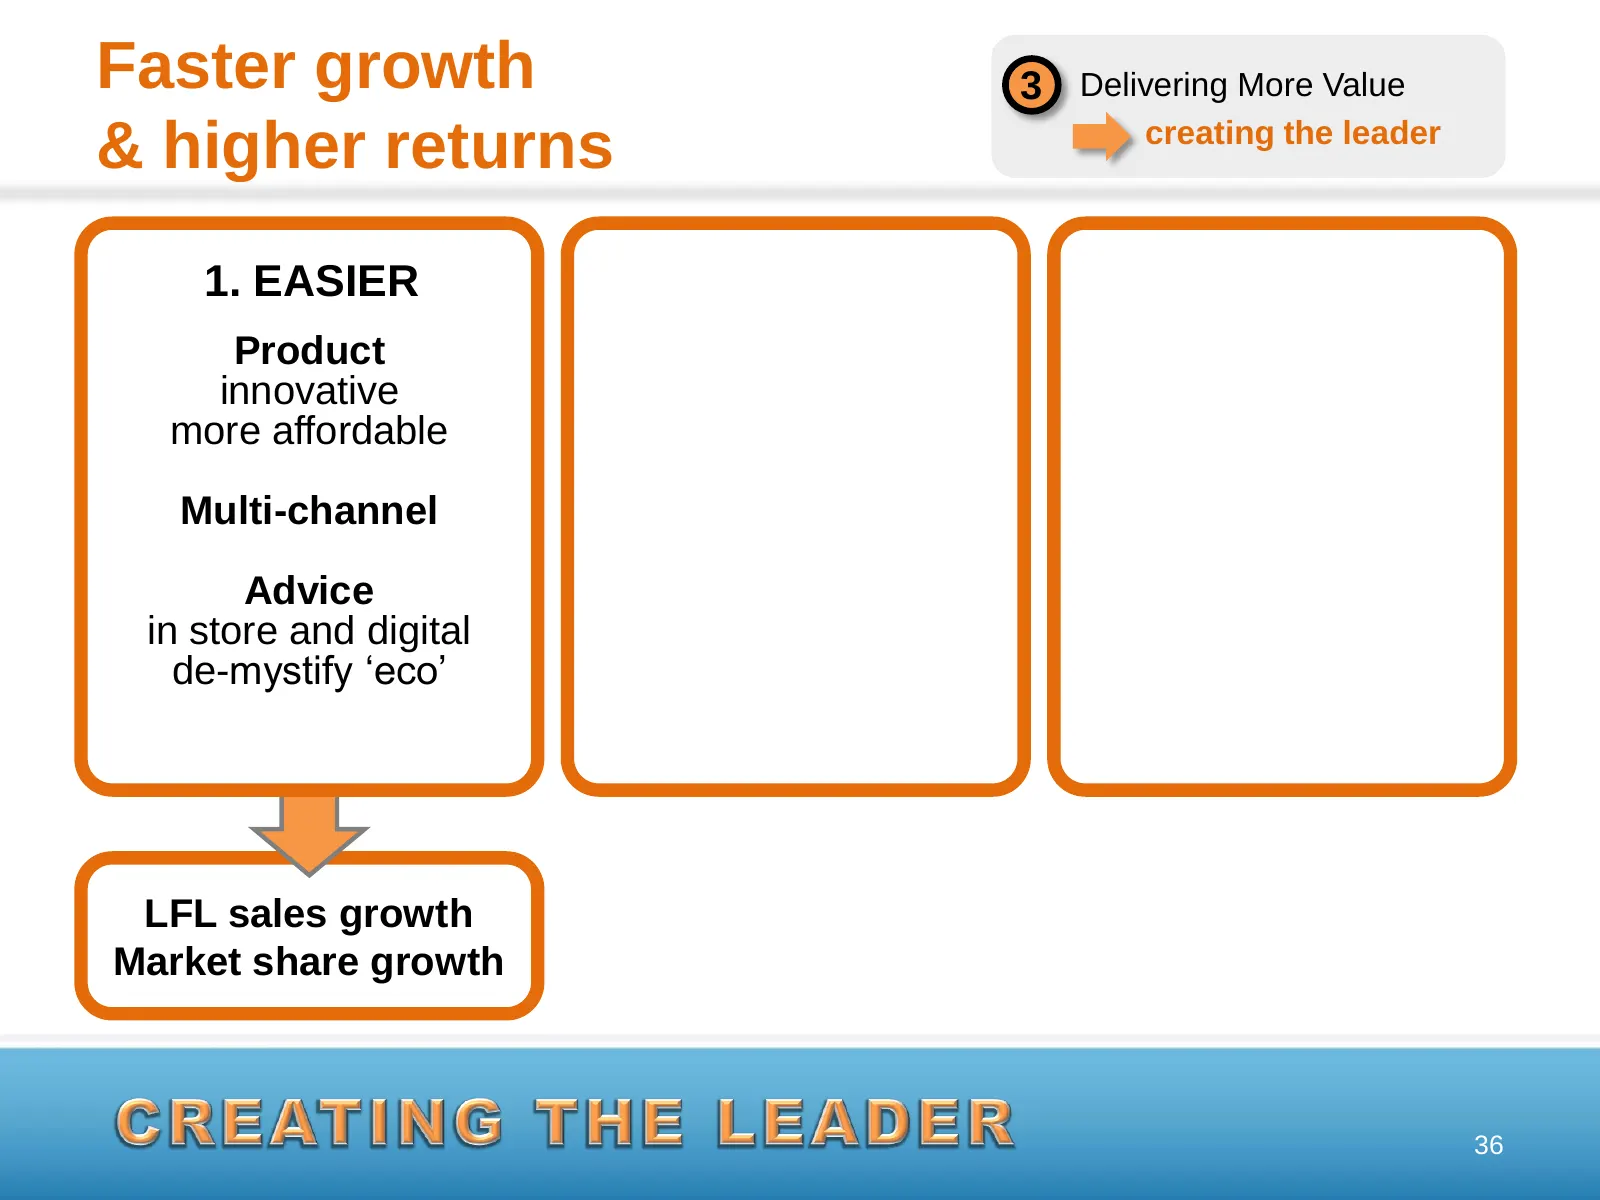
Faster growth 3 Delivering More Value creating the leader & higher returns 1. EASIER Product innovative more affordable Multi-channel Advice in store and digital de-mystify „eco‟ LFL sales growth Market share growth 36

Slide 38: Self-help opportunity – 'make it easier'
Self-help opportunity 3 Delivering More Value – ‘make it easier’ creating the leader 37

Slide 39: Self-help opportunity – 'make it easier'
Self-help opportunity 3 Delivering More Value – ‘make it easier’ creating the leader 38

Slide 40: Castorama 'making it easier' video
Castorama „making it easier‟ video 39

Slide 41: B&Q 'making it easier' video
B&Q „making it easier‟ video 40
Slide 42: Faster growth & higher returns
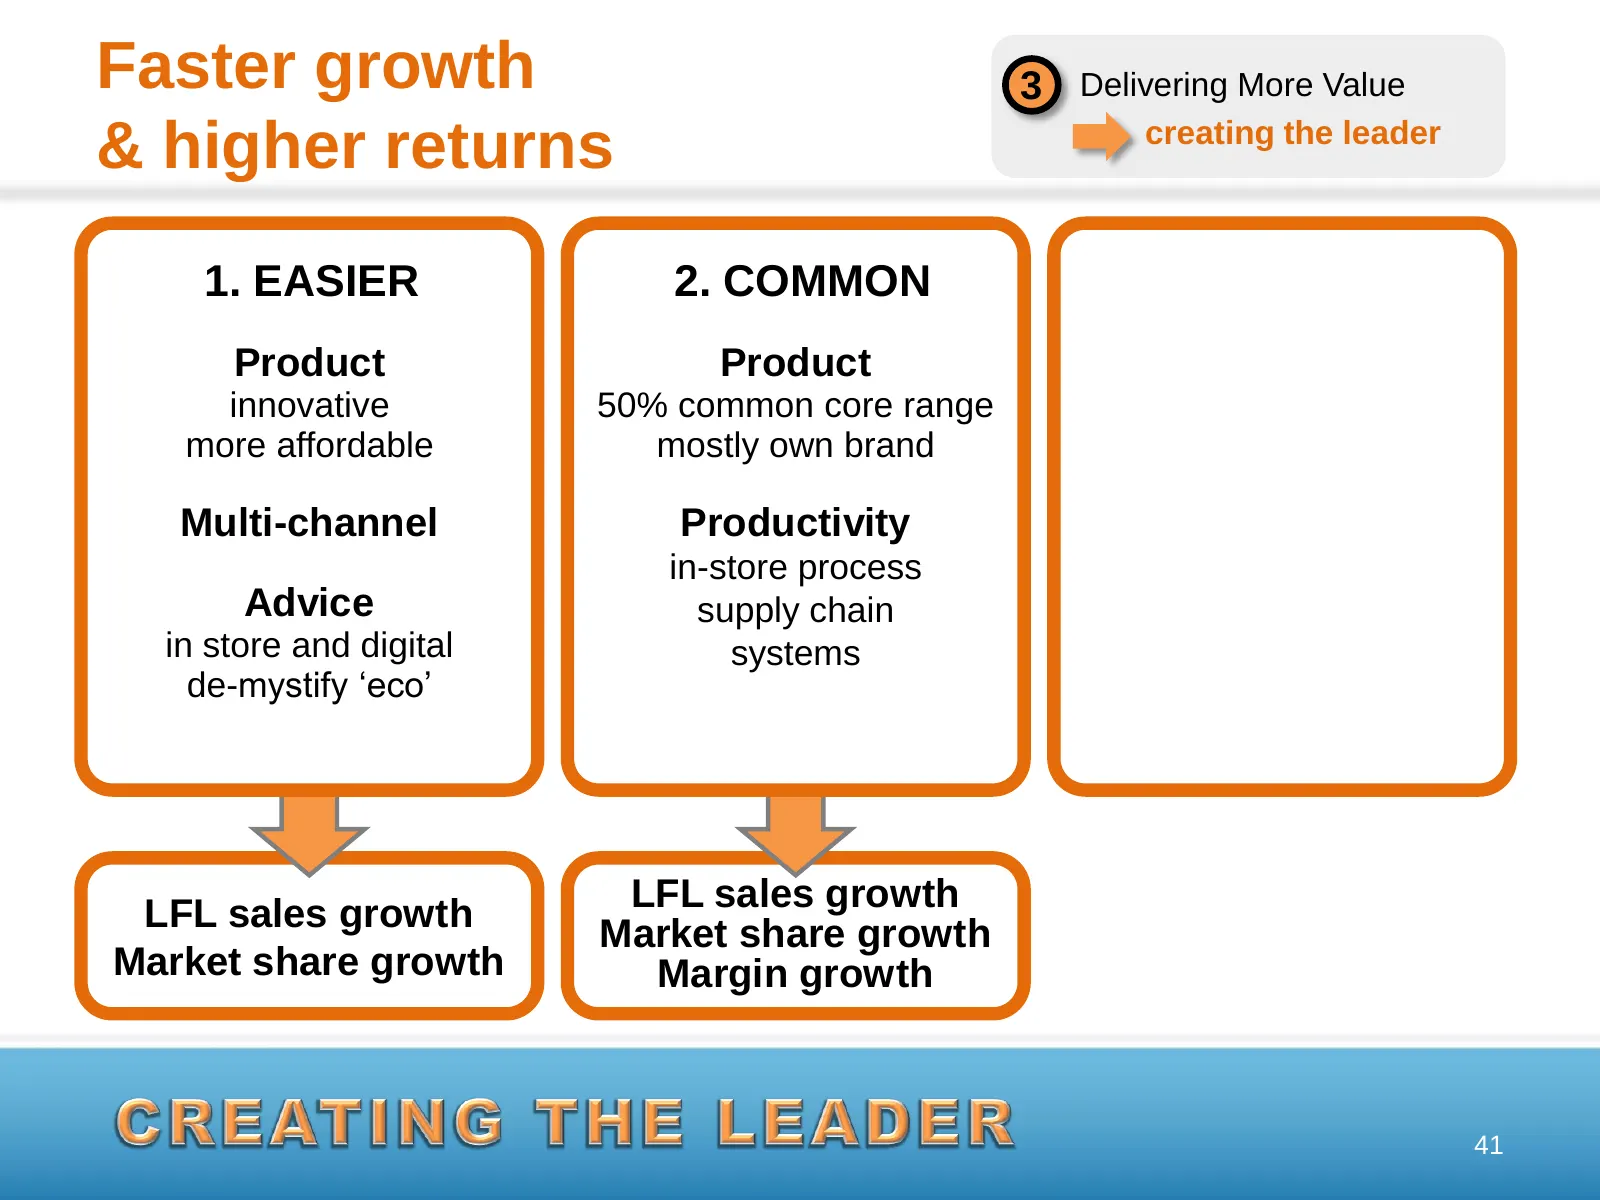
Faster growth 3 Delivering More Value creating the leader & higher returns 1. EASIER 2. COMMON Product Product innovative 50% common core range more affordable mostly own brand Multi-channel Productivity in-store process Advice supply chain in store and digital systems de-mystify „eco‟ LFL sales gro

Slide 43: Self-help opportunity – common
Self-help opportunity 3 Delivering More Value – common creating the leader 42
Slide 44: Faster growth & higher returns
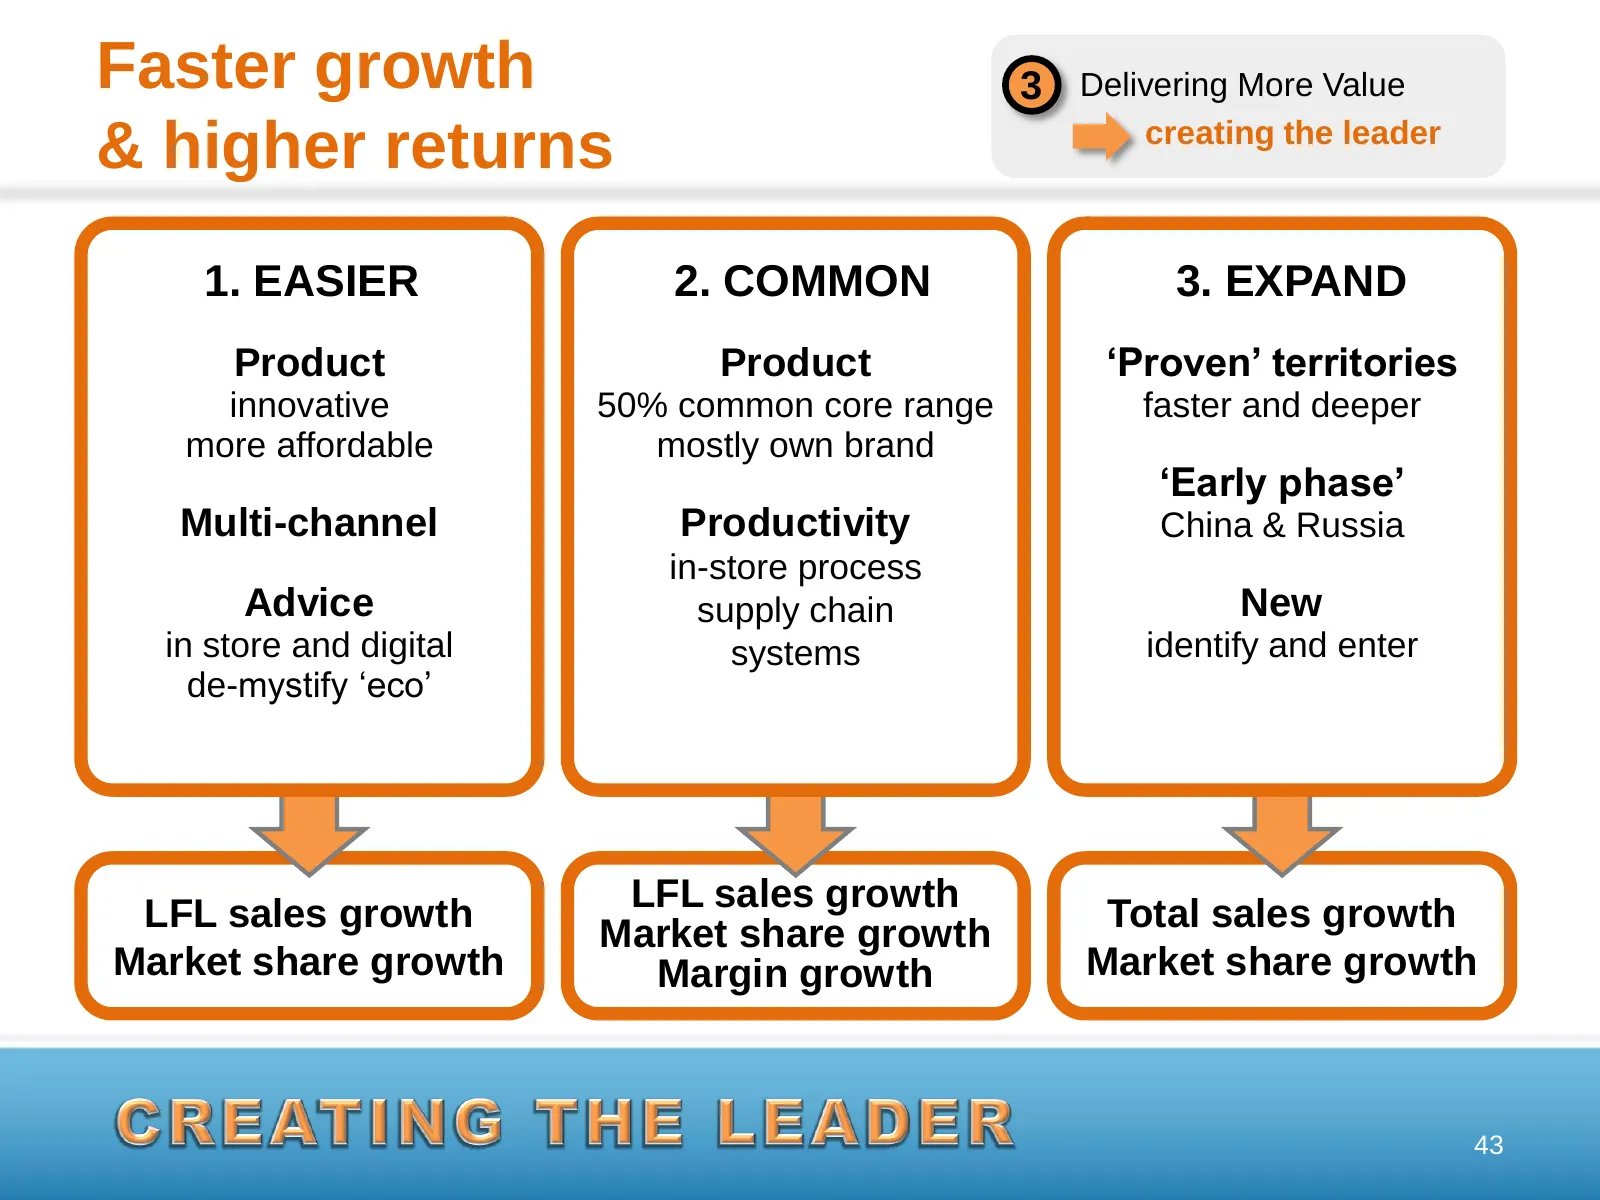
Faster growth 3 Delivering More Value creating the leader & higher returns 1. EASIER 2. COMMON 3. EXPAND Product Product ‘Proven’ territories innovative 50% common core range faster and deeper more affordable mostly own brand ‘Early phase’ Multi-channel Productivity China & Russia in-store process A
Slide 45: Self-help opportunity – expansion
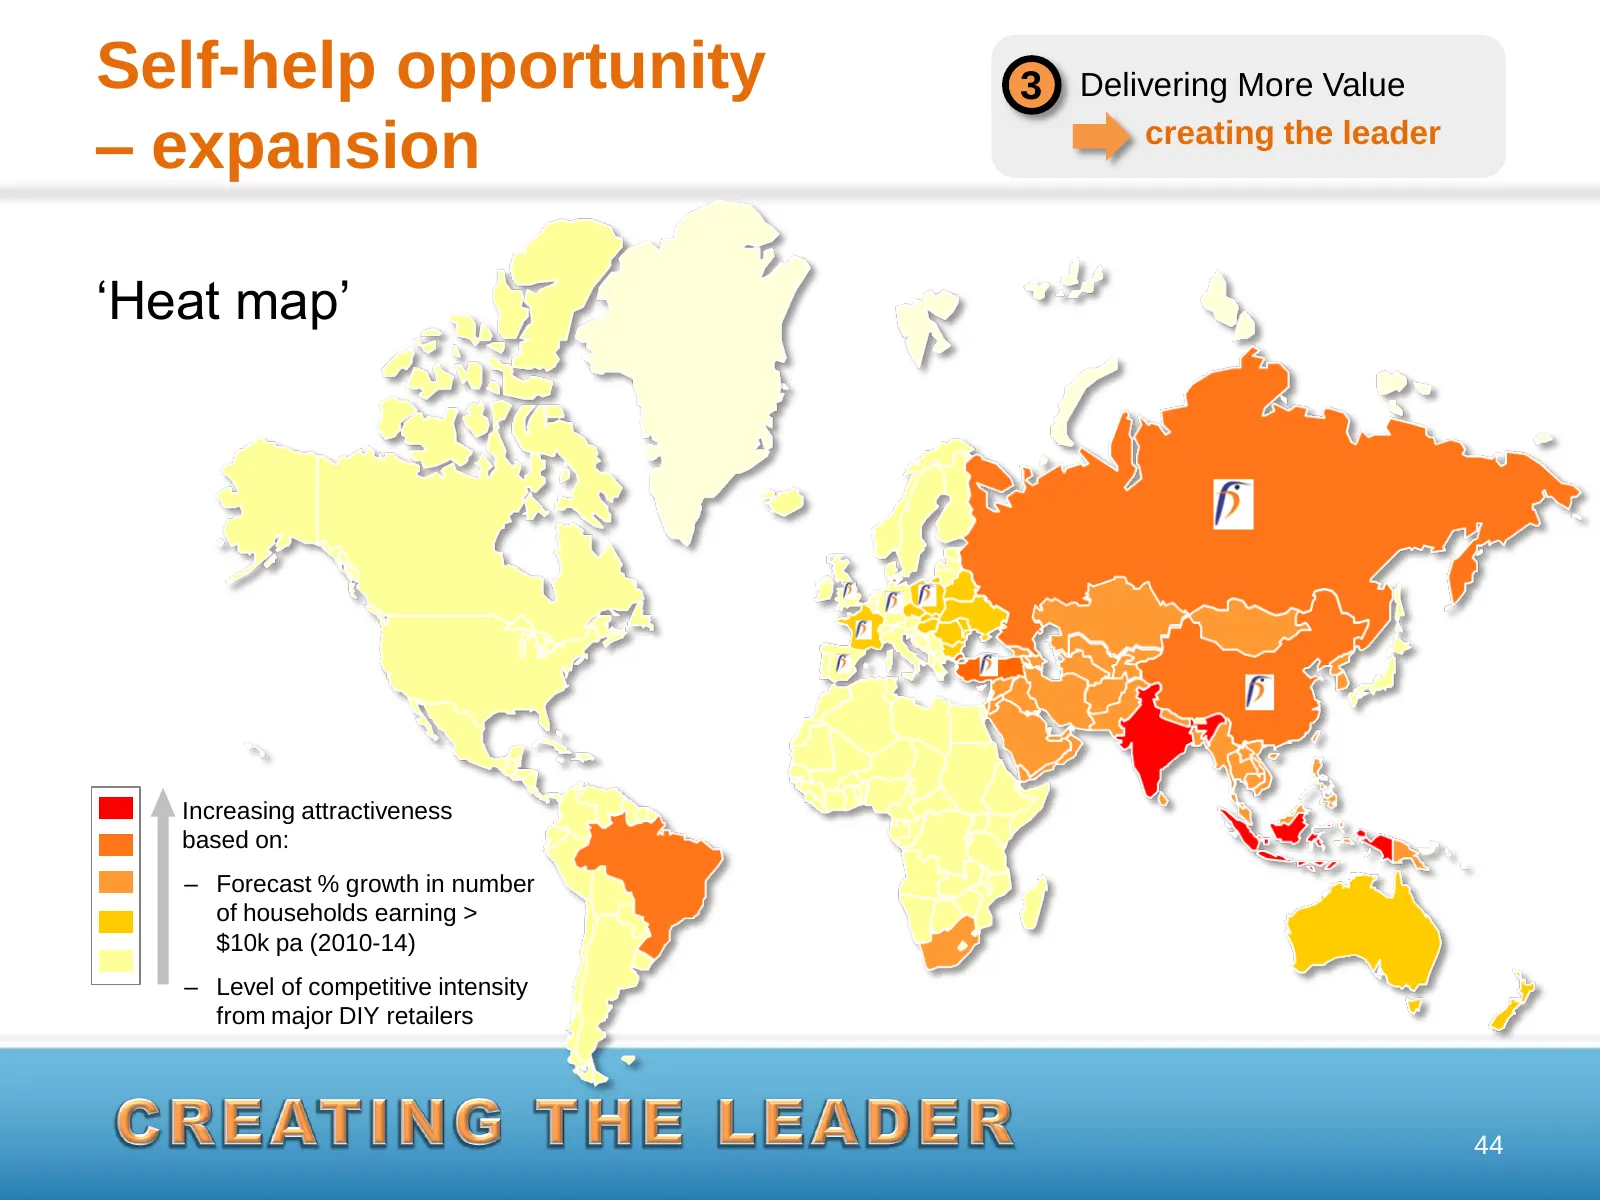
Self-help opportunity 3 Delivering More Value – expansion creating the leader „Heat map‟ Increasing attractiveness based on: – Forecast % growth in number of households earning > $10k pa (2010-14) – Level of competitive intensity from major DIY retailers 44
Slide 46: Capital discipline
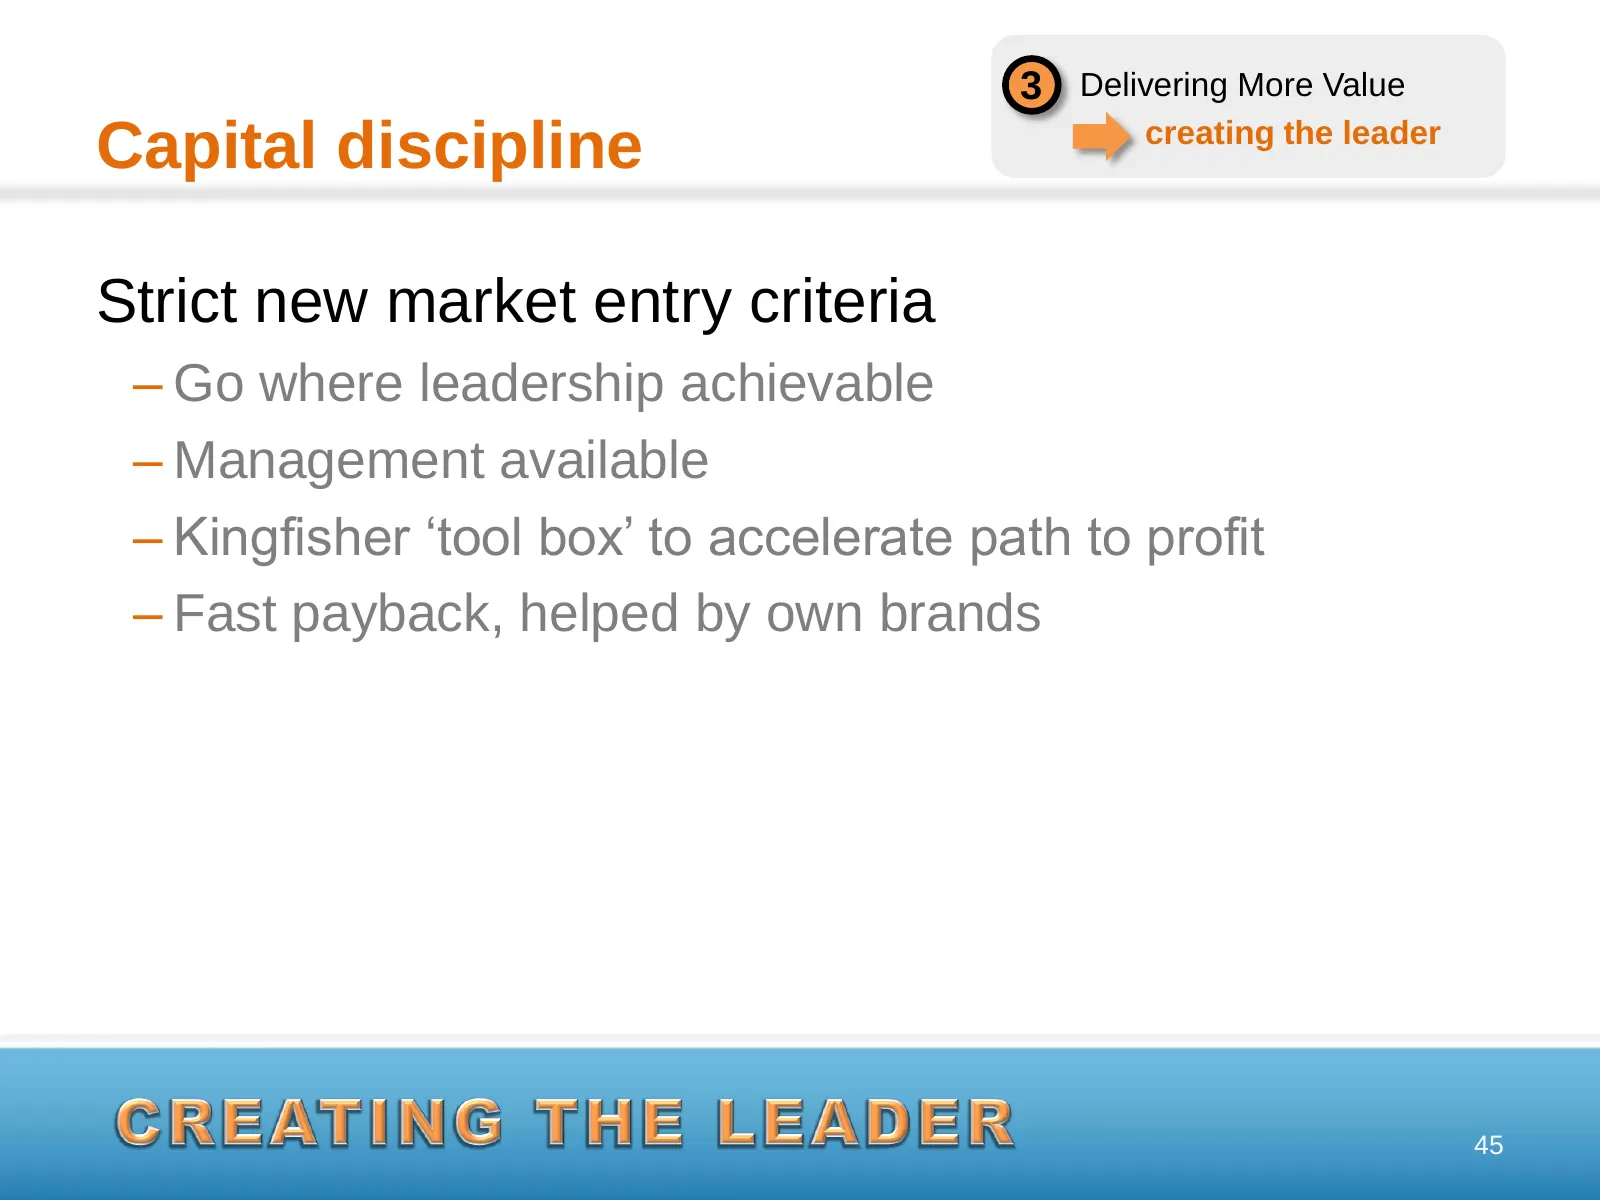
3 Delivering More Value creating the leader Capital discipline Strict new market entry criteria – Go where leadership achievable – Management available – Kingfisher „tool box‟ to accelerate path to profit – Fast payback, helped by own brands 45
Slide 47: Complete our journey…
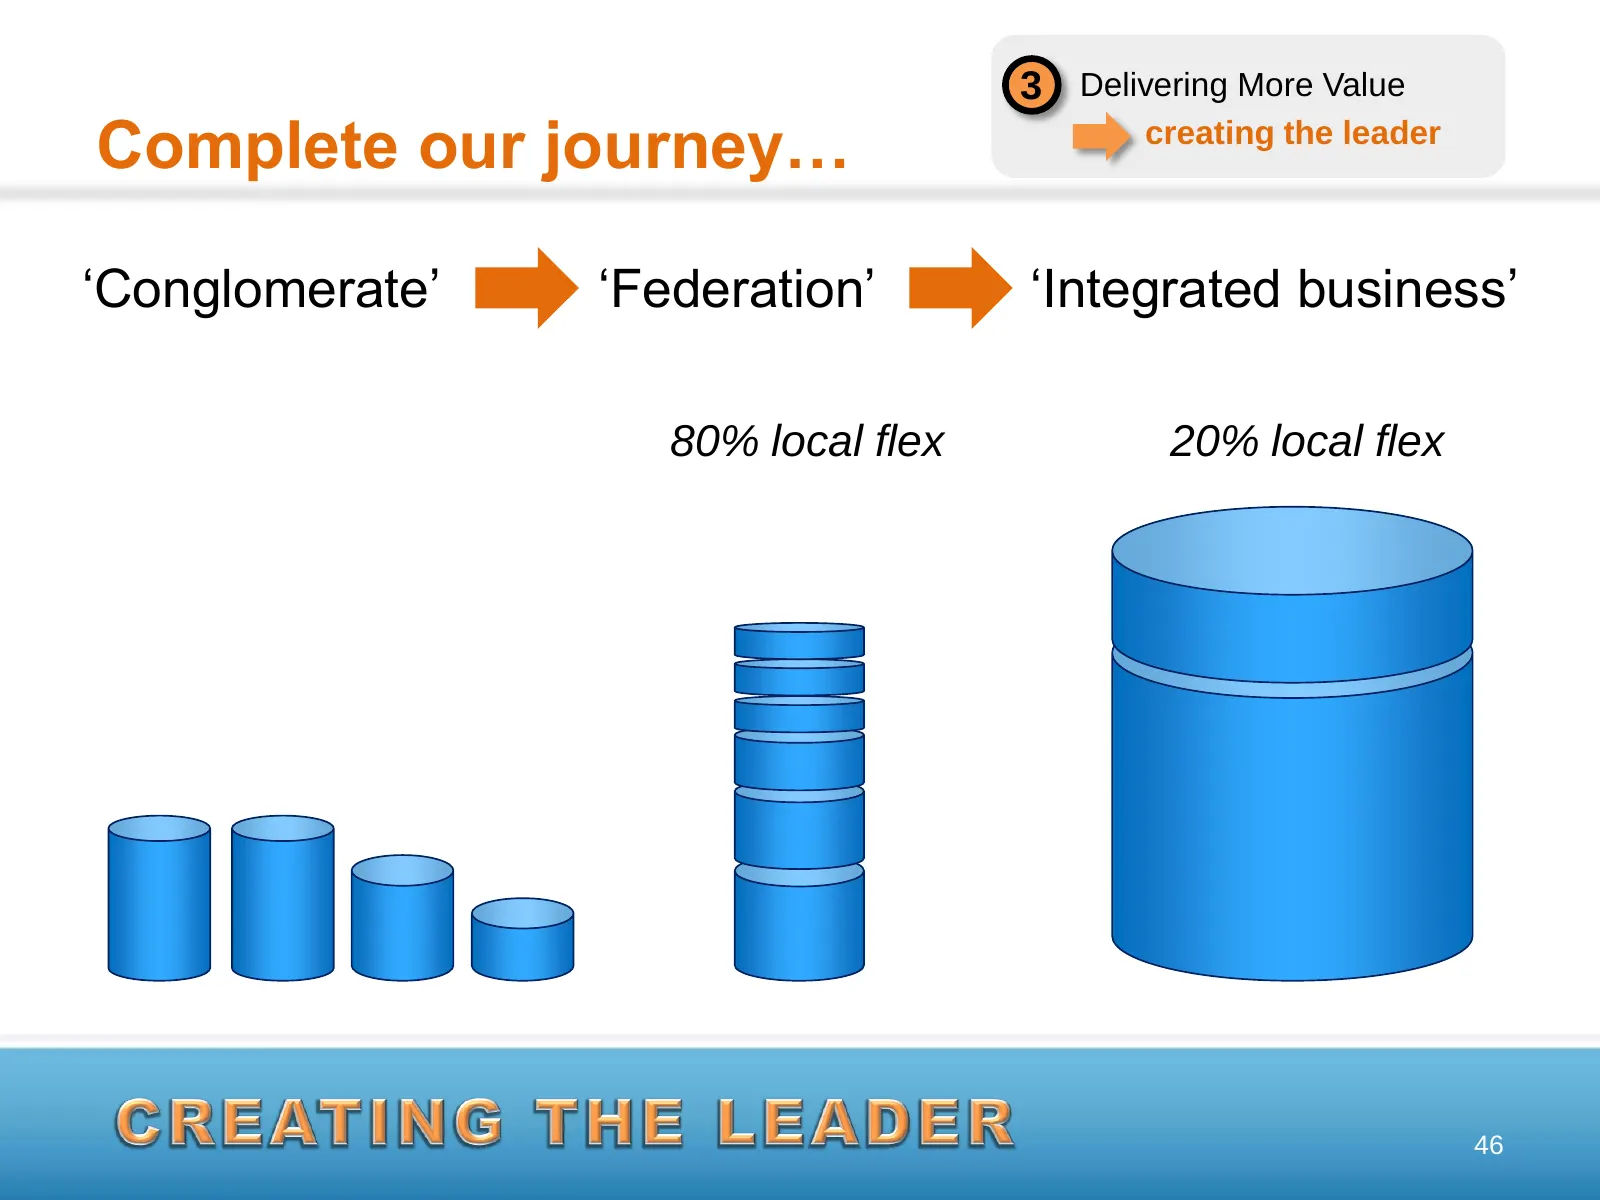
3 Delivering More Value Complete our journey… creating the leader „Conglomerate‟ „Federation‟ „Integrated business‟ 80% local flex 20% local flex 46

Slide 48: …to unlock our strength
3 Delivering More Value …to unlock our strength creating the leader „Centralised v decentralised‟ an out-dated debate „Intelligent network‟ 47
Slide 49: New commercial board
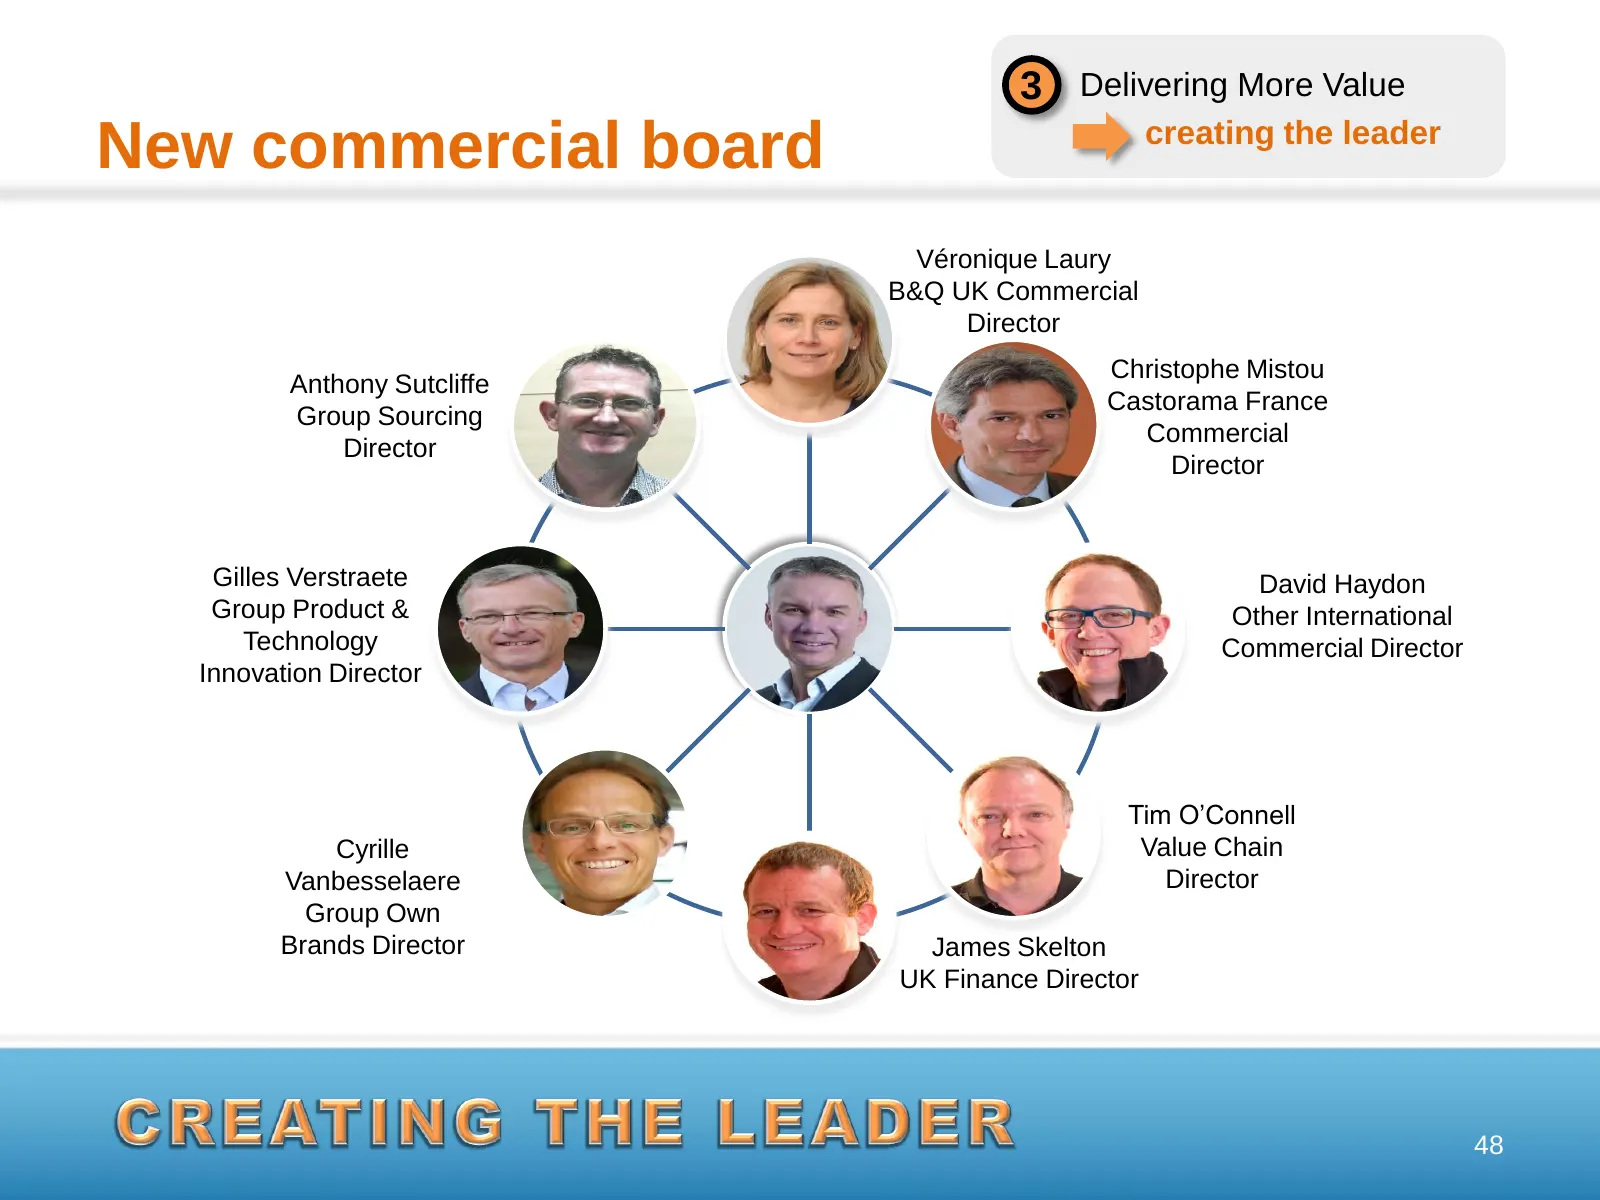
3 Delivering More Value creating the leader New commercial board Véronique Laury B&Q UK Commercial Director Christophe Mistou Anthony Sutcliffe Castorama France Group Sourcing Commercial Director Director Gilles Verstraete David Haydon Group Product & Other International Technology Commercial Direct
Slide 50: …to unlock our strength
3 Delivering More Value …to unlock our strength creating the leader • Harness our talent and our scale • Capitalise on our unique international diversity • Accelerate innovation • Accelerate speed to market 49
Slide 51: Faster growth & higher returns
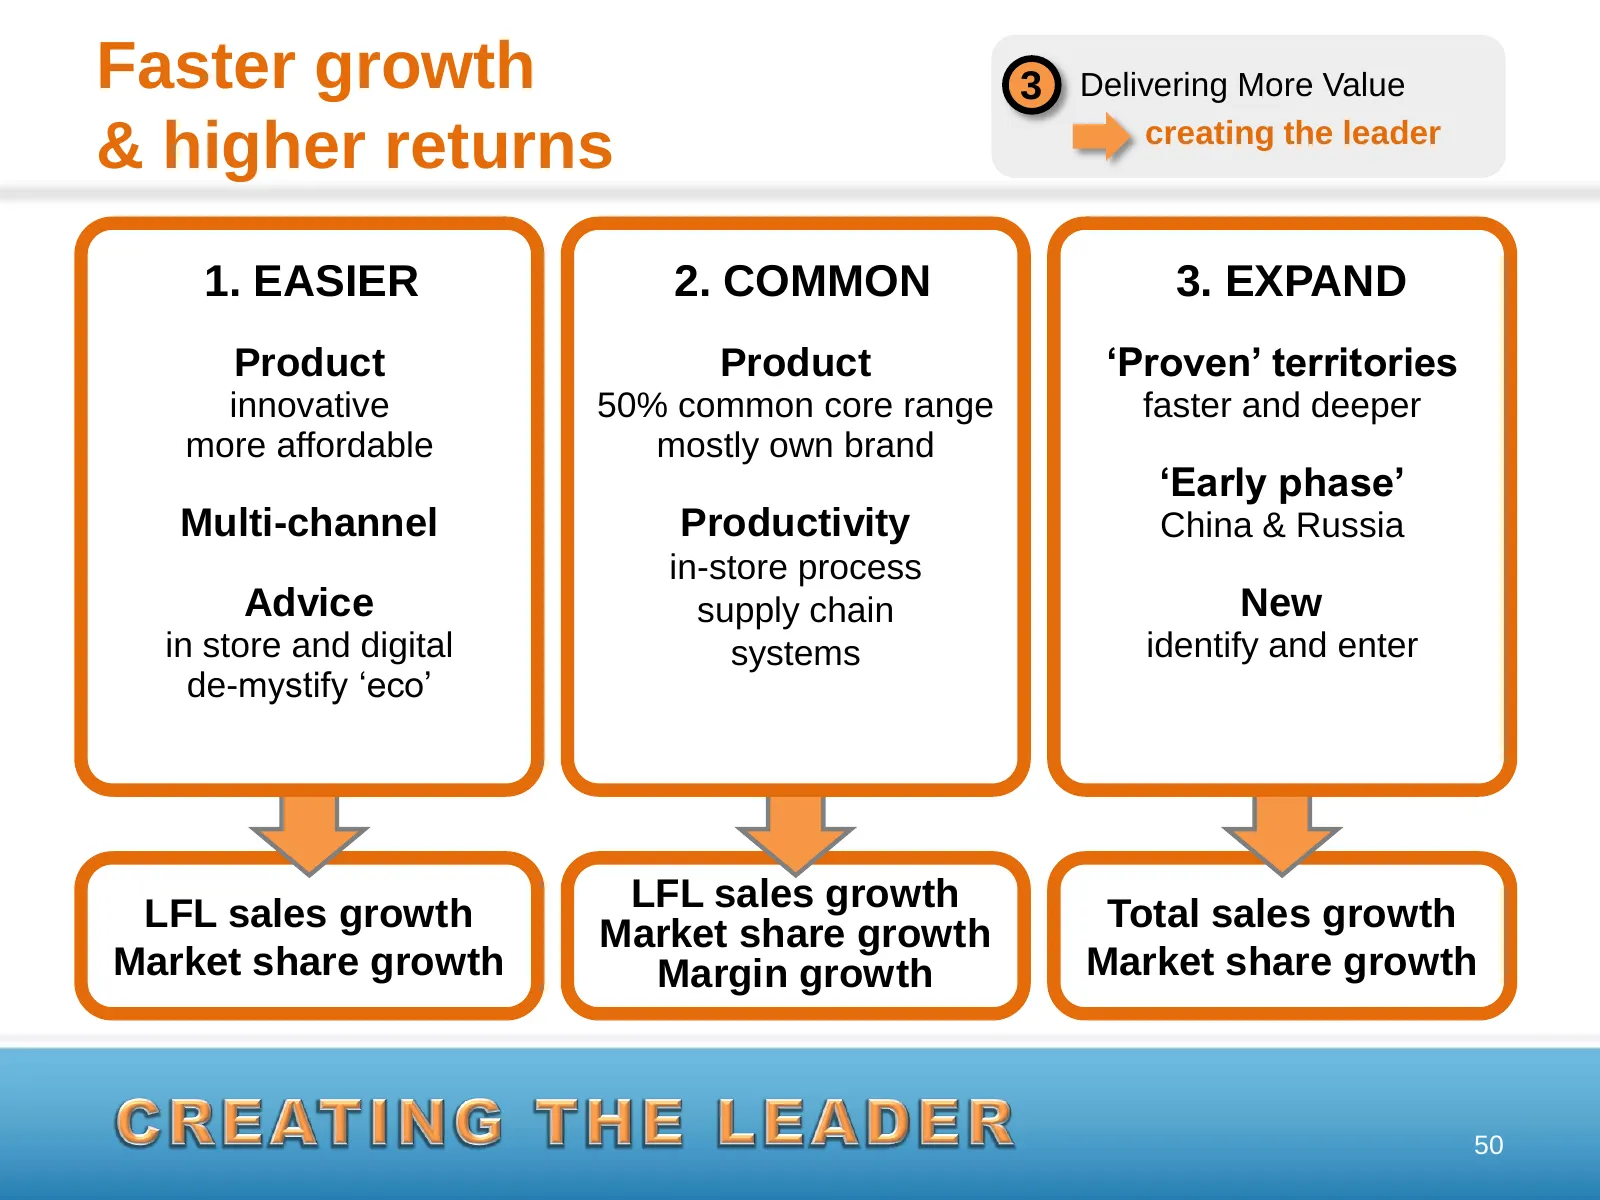
Faster growth 3 Delivering More Value creating the leader & higher returns 1. EASIER 2. COMMON 3. EXPAND Product Product ‘Proven’ territories innovative 50% common core range faster and deeper more affordable mostly own brand ‘Early phase’ Multi-channel Productivity China & Russia in-store process A
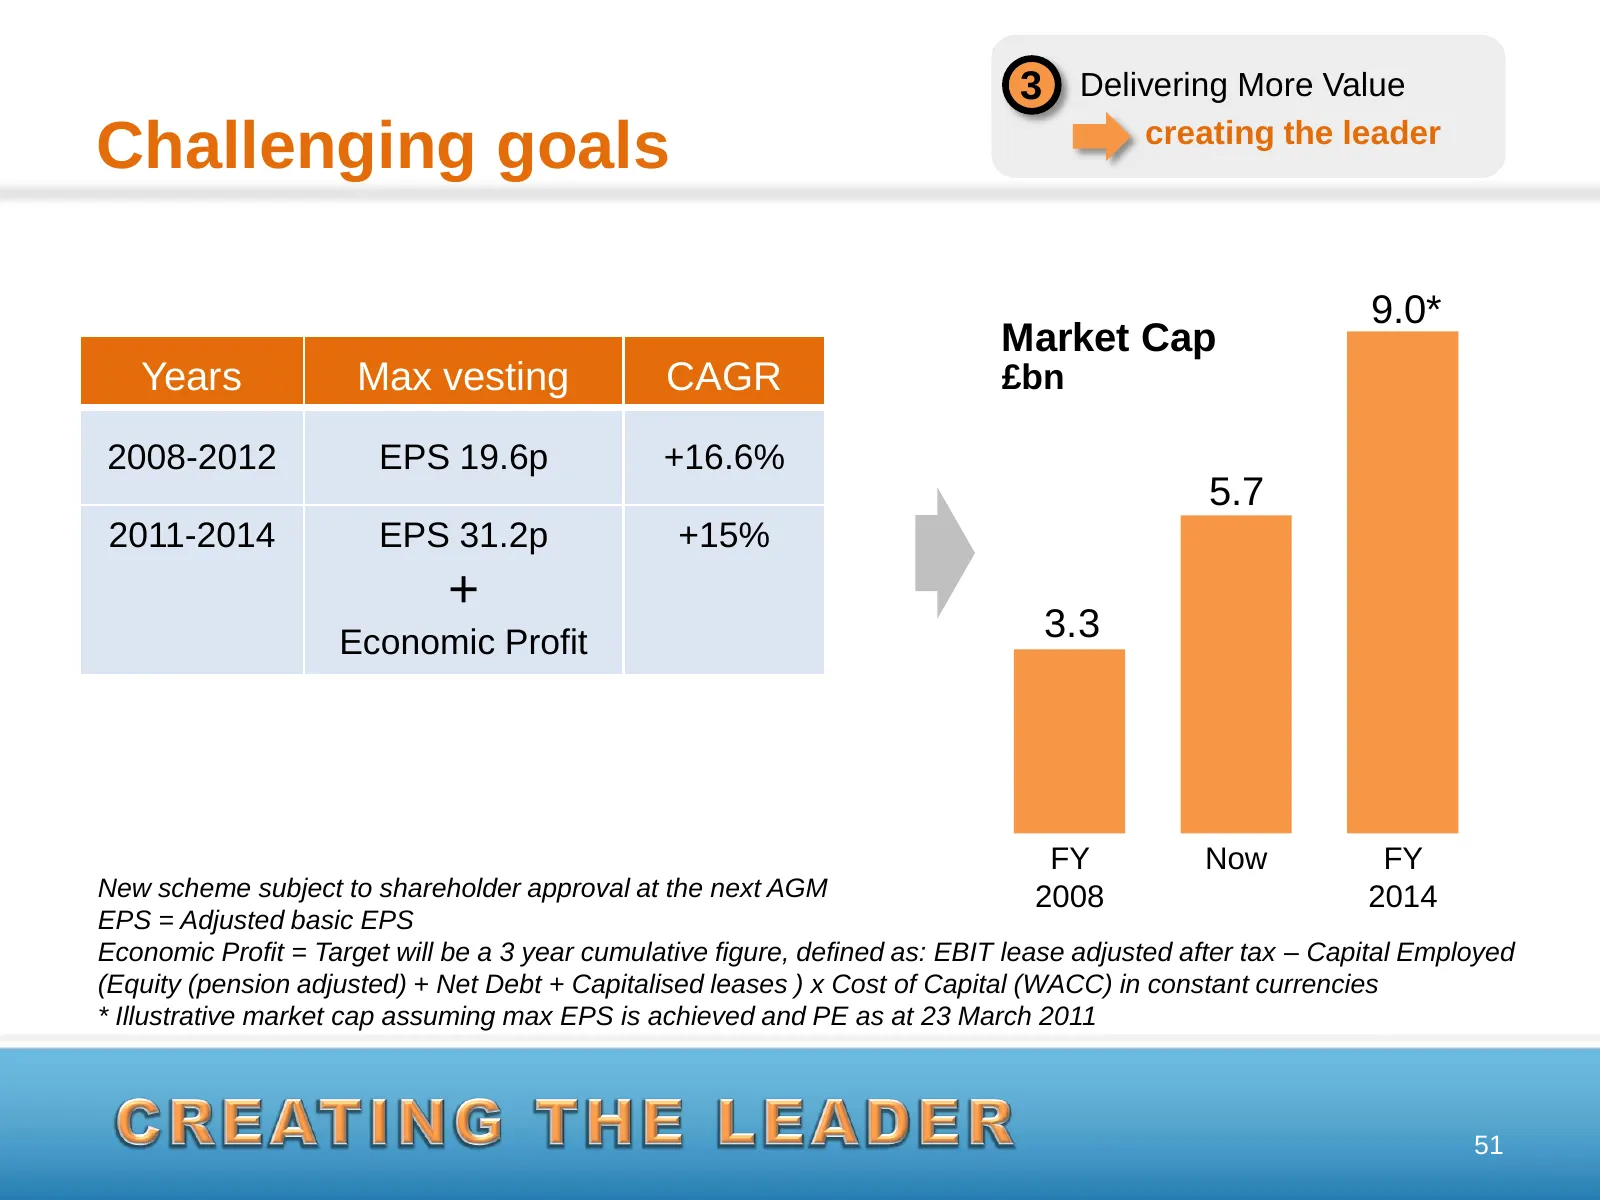
Slide 52: Challenging goals
3 Delivering More Value creating the leader Challenging goals 9.0* Market Cap Years Max vesting CAGR £bn 2008-2012 EPS 19.6p +16.6% 5.7 2011-2014 EPS 31.2p +15% + Economic Profit 3.3 FY Now FY New scheme subject to shareholder approval at the next AGM 2008 2014 EPS = Adjusted basic EPS Economic Prof
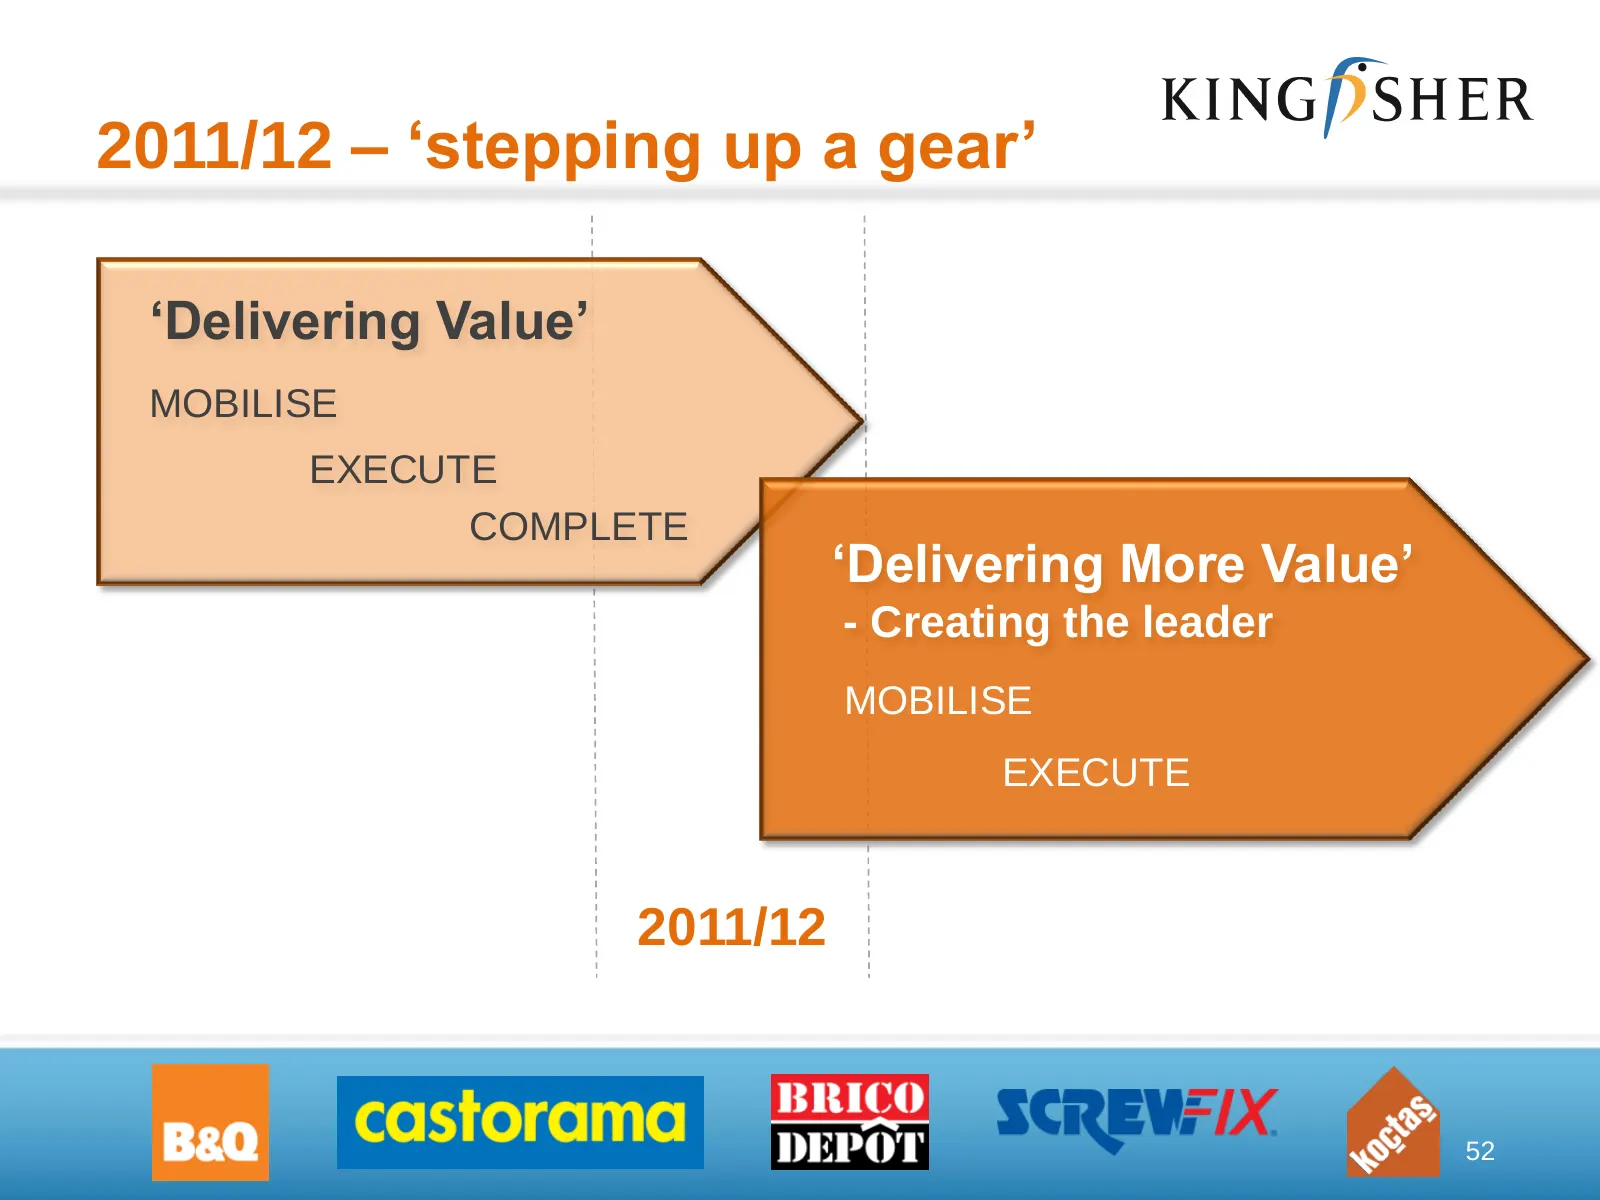
Slide 53: 2011/12 – 'stepping up a gear'
2011/12 – ‘stepping up a gear’ ‘Delivering Value’ MOBILISE EXECUTE COMPLETE ‘Delivering More Value’ - Creating the leader MOBILISE EXECUTE 2011/12 52
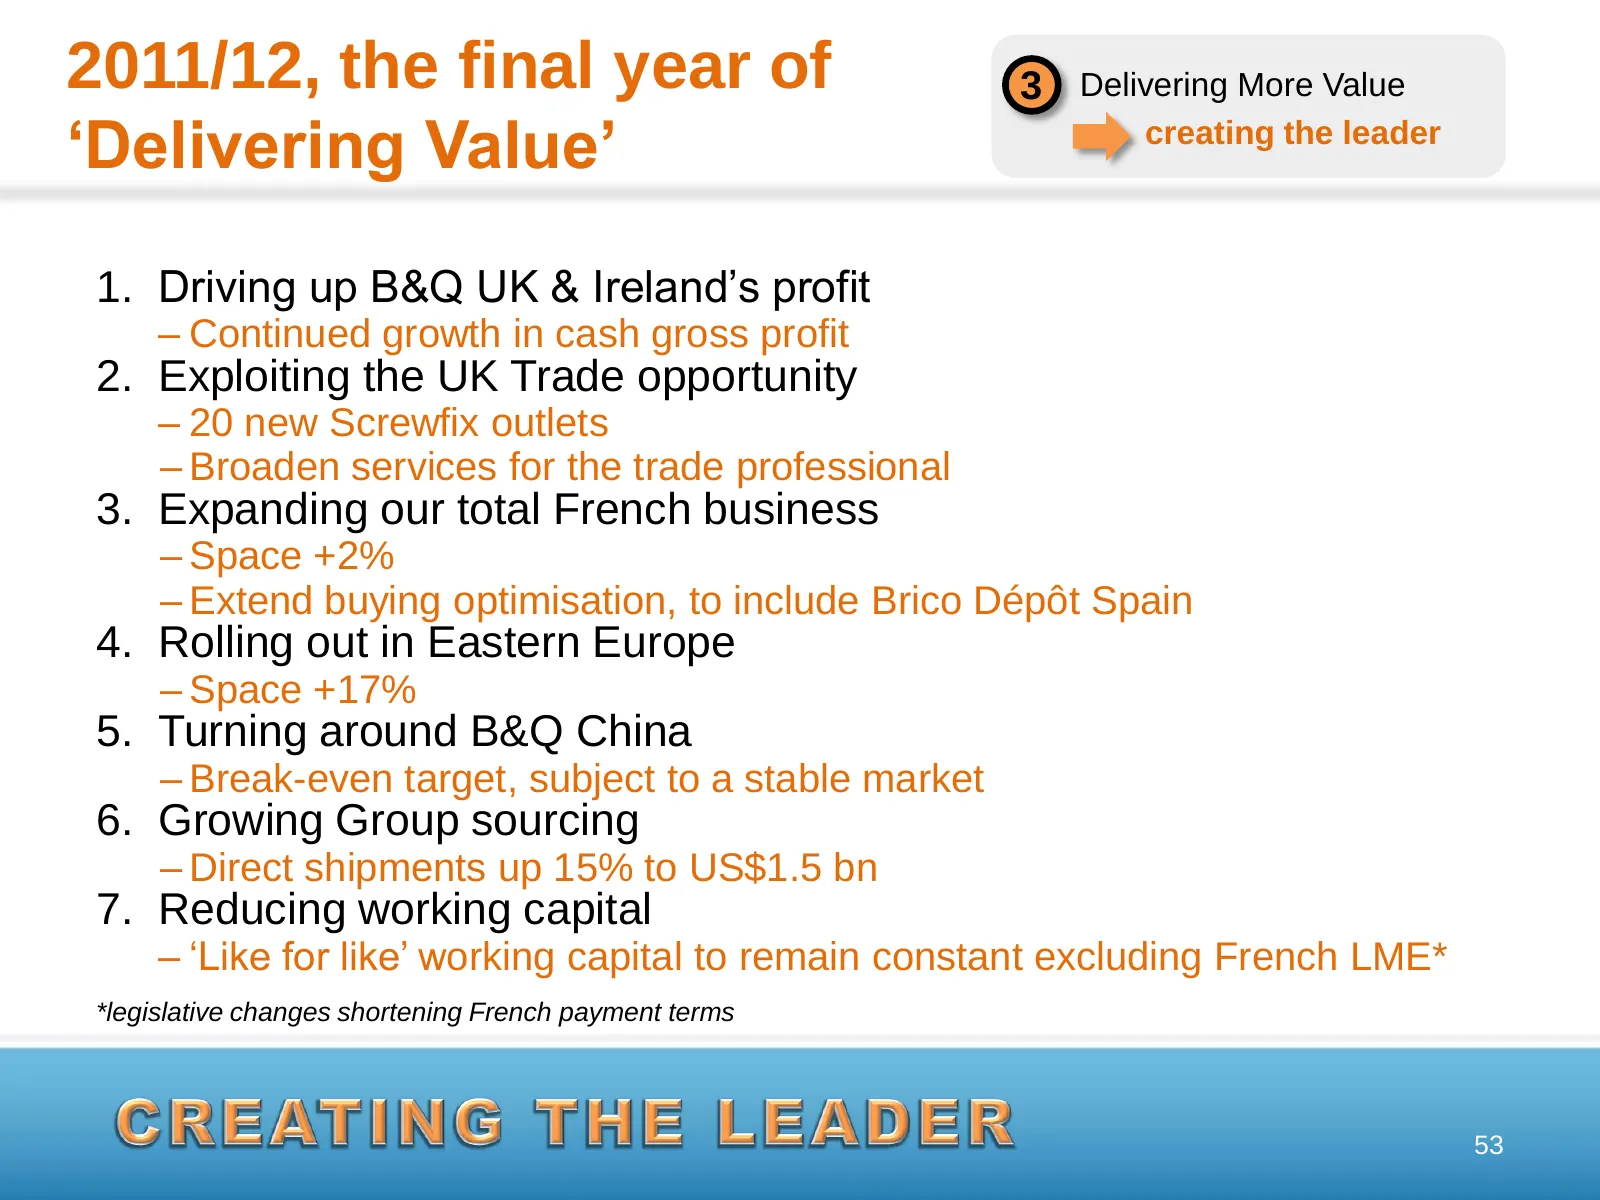
Slide 54: 2011/12, the final year of 'Delivering Value'
2011/12, the final year of 3 Delivering More Value ‘Delivering Value’ creating the leader 1. Driving up B&Q UK & Ireland‟s profit – Continued growth in cash gross profit 2. Exploiting the UK Trade opportunity – 20 new Screwfix outlets – Broaden services for the trade professional 3. Expanding our to
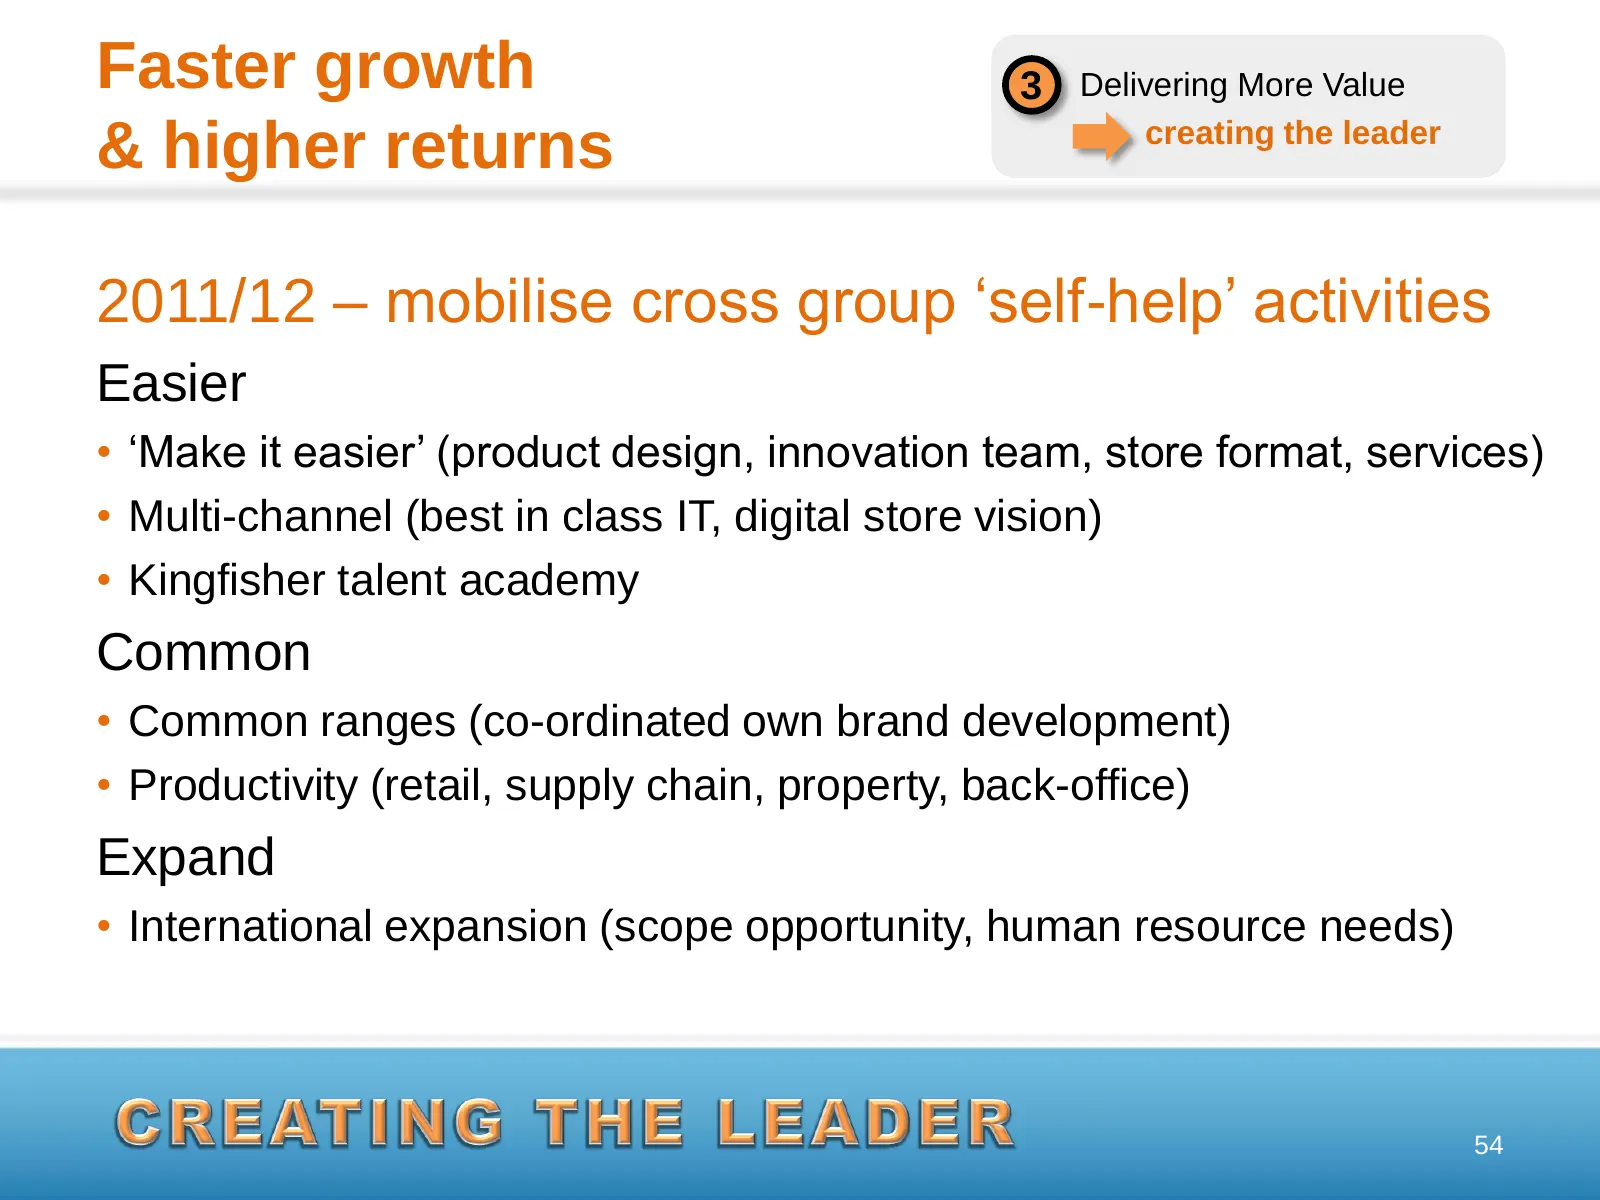
Slide 55: 2011/12 – mobilise cross group 'self-help' activities
Faster growth 3 Delivering More Value creating the leader & higher returns 2011/12 – mobilise cross group „self-help‟ activities Easier • „Make it easier‟ (product design, innovation team, store format, services) • Multi-channel (best in class IT, digital store vision) • Kingfisher talent academy Co
Slide 56: Kingfisher 2020: Will be the leader
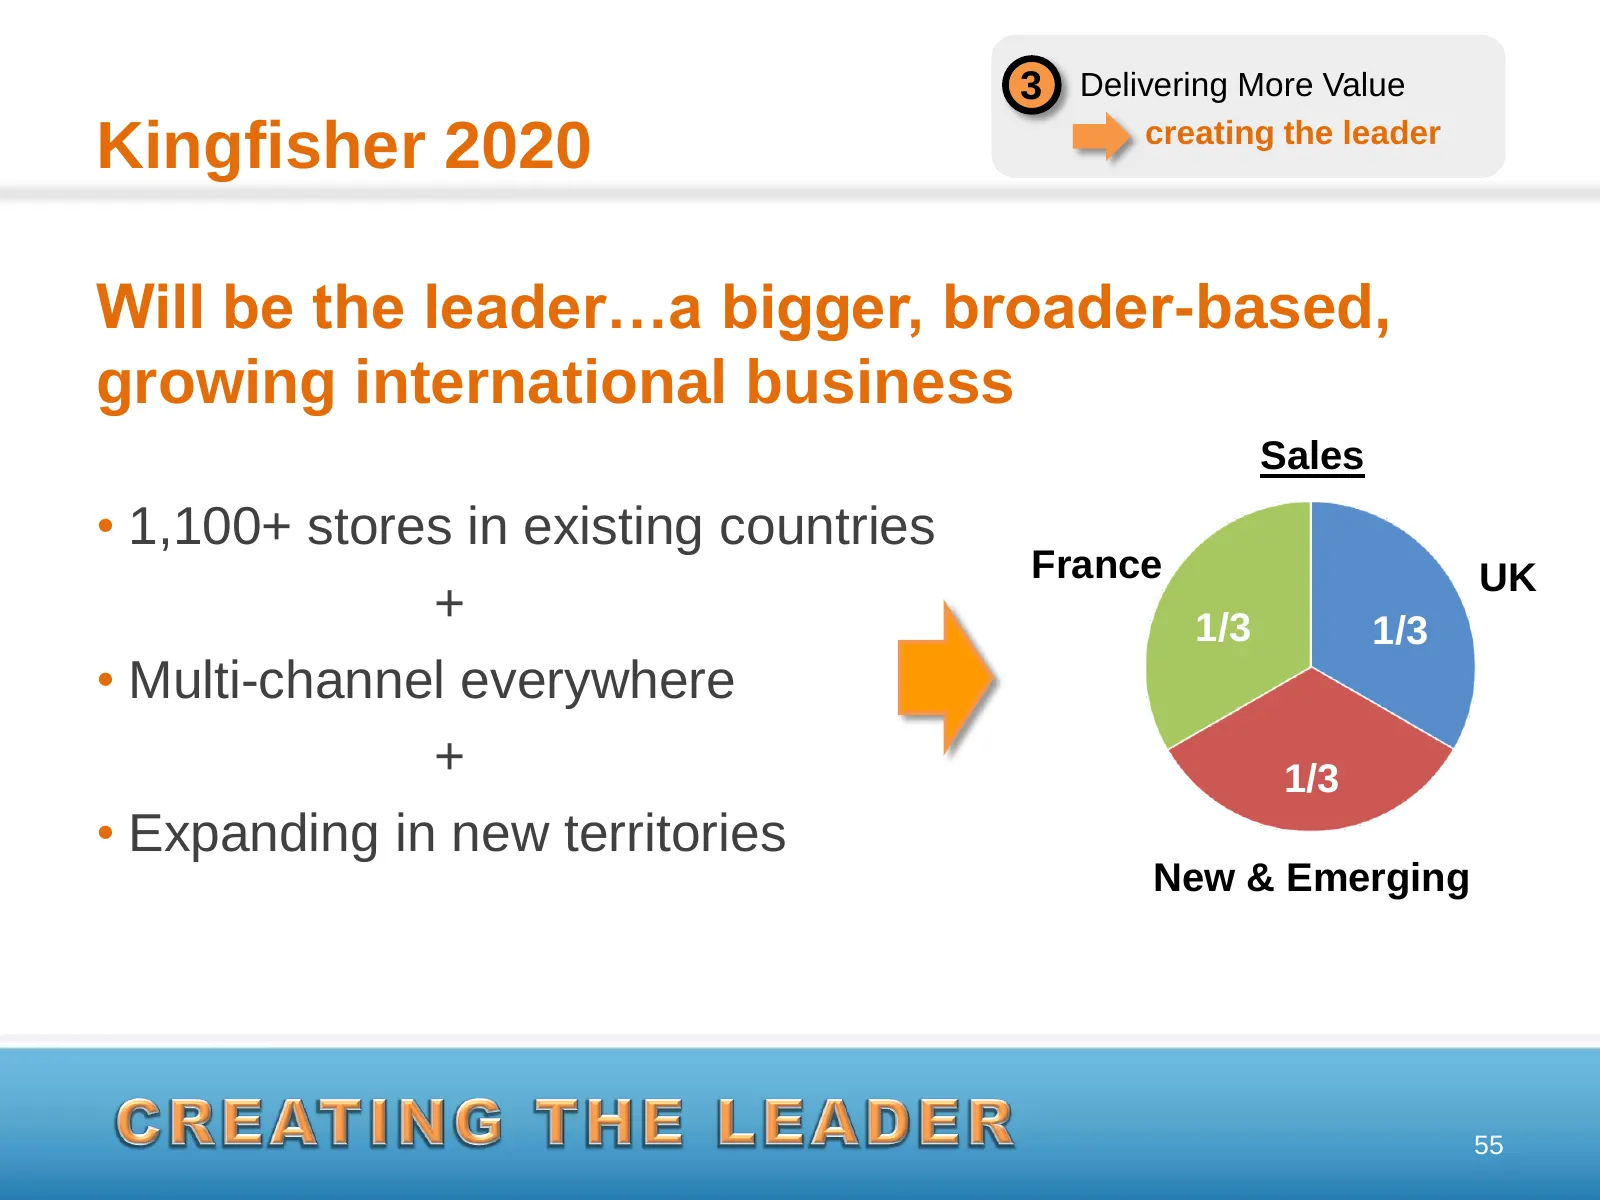
3 Delivering More Value creating the leader Kingfisher 2020 Will be the leader…a bigger, broader-based, growing international business Sales • 1,100+ stores in existing countries France UK + 1/3 1/3 • Multi-channel everywhere + 1/3 • Expanding in new territories New & Emerging 55
Slide 57: Kingfisher 2020: leader for customers, colleagues, communities
3 Delivering More Value creating the leader Kingfisher 2020 Will be the leader…for customers, colleagues, communities and shareholders • 50% core common ranges • High quality, unique and affordable own brands • The industry‟s innovator • Expert global sourcing • Envied for our people • Sustainable b
Slide 58: Kingfisher – strong growth prospects
Kingfisher – strong growth prospects 1 Delivering Value - a success powerful base for growth 2 Attractive markets more growth to unlock 3 Delivering More Value creating the leader 57
Slide 59: Questions
KING/)SHER Questions BRICO ——— DEPOT
Source: Internet Archive copy of kingfisher.com
More decks from Kingfisher PLC
 H1 2026/27 Earnings Presentation33 slides · Sep 22, 2026
 FY2025/26 Earnings Presentation39 slides · Mar 24, 2026
 H1 2025/26 Earnings Presentation38 slides · Sep 23, 2025
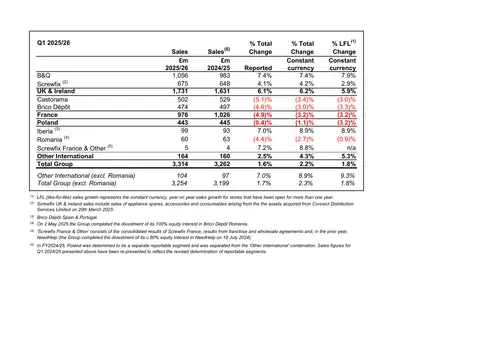 H1 2025/26 Earnings Presentation6 slides · September 2025
 FY2024/25 Earnings Presentation35 slides · Apr 8, 2025
 FY2024/25 Earnings Presentation40 slides · Mar 25, 2025