TTM Technologies, Inc. · NASDAQ:TTMI
TTM Technologies — 11th Annual Needham Growth Stock Conference (January 2009)
30 slides from TTM Technologies's conference presentation, Jan 8, 2009
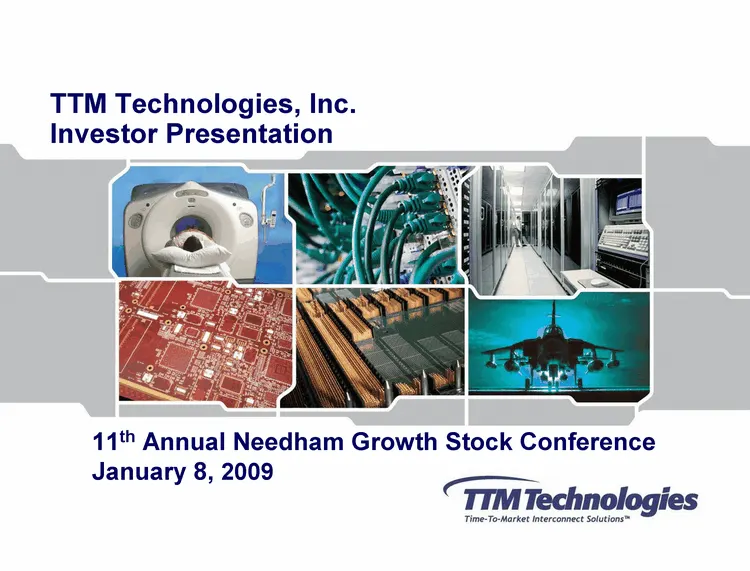
Slide 1: TTM Technologies Investor Presentation, Needham Growth Stock Conference
TTM Technologies, Inc. Investor Presentation 11th Annual Needham Growth Stock Conference January 8, 2009
Slide 2: TTM and Industry Overview
TTM and Industry Overview This presentation contains forward-looking statements that relate to future events or performance. These statements reflect the company's current expectations, and the company does not undertake to update or revise these forward-looking statements, even if experience or fut
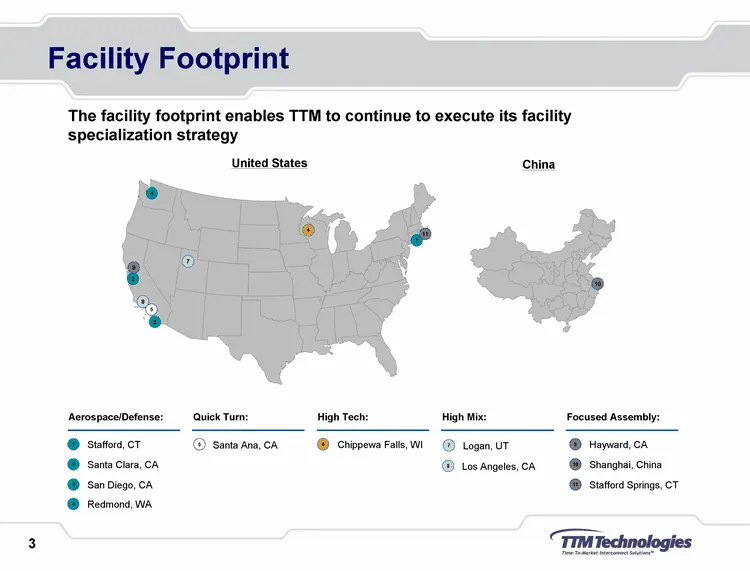
Slide 3: Facility Footprint
1 Stafford, CT 3 San Diego, CA Aerospace/Defense: Quick Turn: 5 Los Angeles, CA High Tech: 6 Chippewa Falls, WI High Mix: 2 Santa Clara, CA Santa Ana, CA 10 1 5 7 2 4 6 9 The facility footprint enables TTM to continue to execute its facility specialization strategy Facility Footprint Focused Assembl
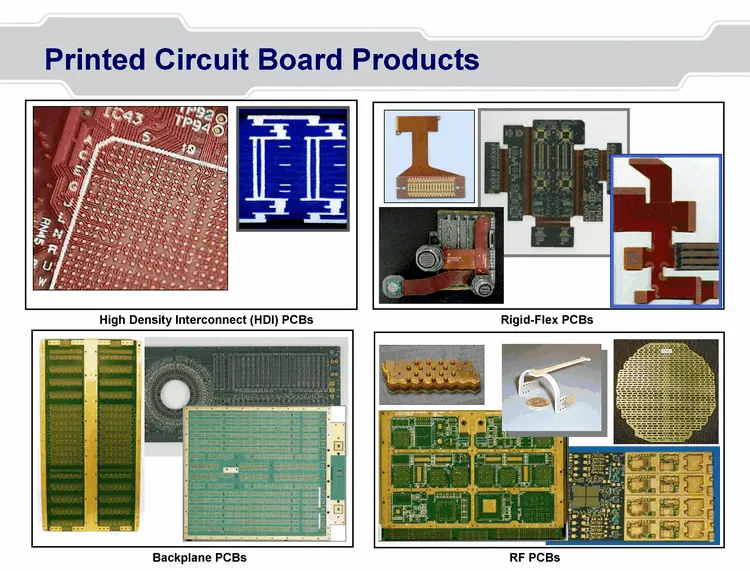
Slide 4: Printed Circuit Board Products
Printed Circuit Board Products Rigid-Flex PCBs High Density Interconnect (HDI) PCBs Backplane PCBs RF PCBs
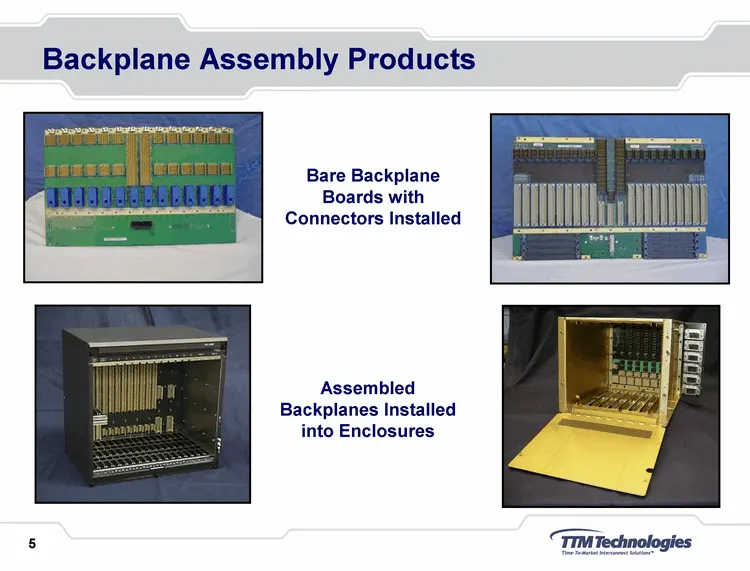
Slide 5: Backplane Assembly Products
Backplane Assembly Products Bare Backplane Boards with Connectors Installed Assembled Backplanes Installed into Enclosures
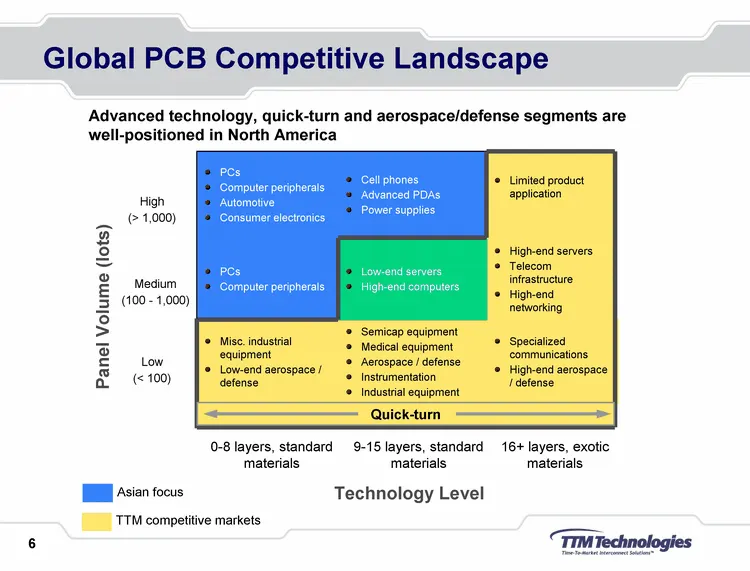
Slide 6: Global PCB Competitive Landscape
Low (< 100) Medium (100 - 1,000) High (> 1,000) Global PCB Competitive Landscape Technology Level Panel Volume (lots) 9-15 layers, standard materials 16+ layers, exotic materials Asian focus 0-8 layers, standard materials TTM competitive markets Specialized communications High-end aerospace / defens
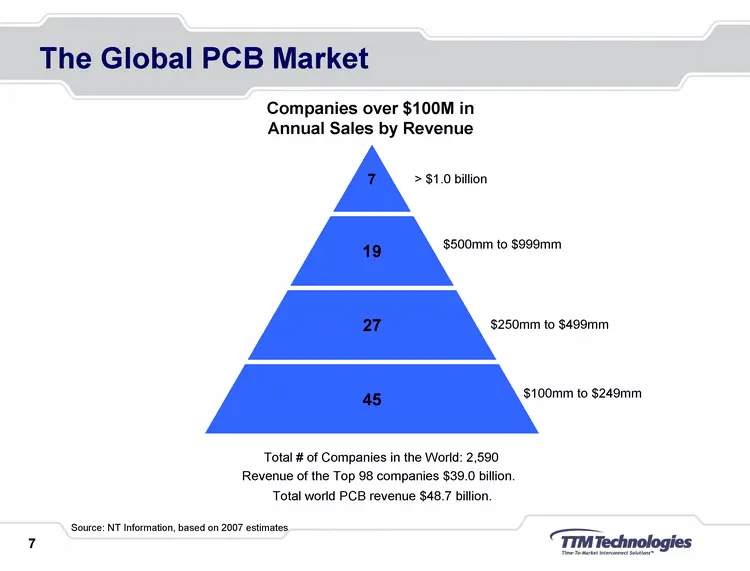
Slide 7: The Global PCB Market
The Global PCB Market Companies over $100M in Annual Sales by Revenue Source: NT Information, based on 2007 estimates Total # of Companies in the World: 2,590 Revenue of the Top 98 companies $39.0 billion. Total world PCB revenue $48.7 billion. $100mm to $249mm $250mm to $499mm
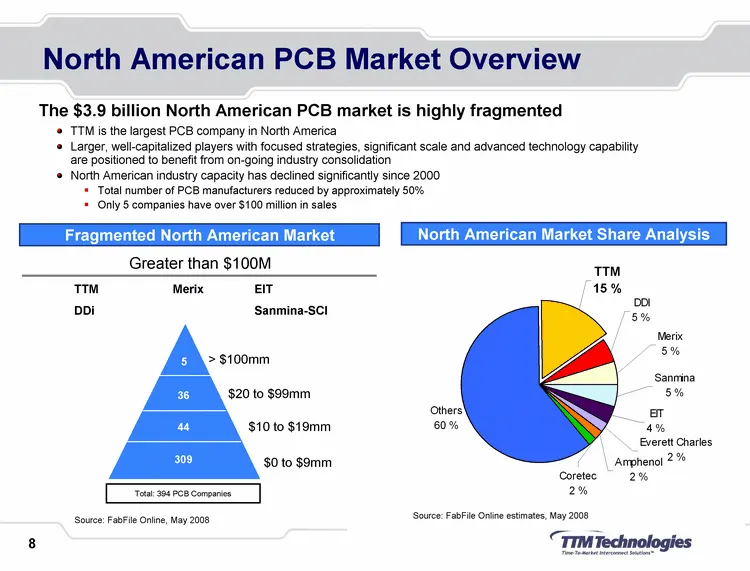
Slide 8: North American PCB Market Overview
North American PCB Market Overview The $3.9 billion North American PCB market is highly fragmented Fragmented North American Market North American Market Share Analysis Source: FabFile Online, May 2008 309 44 36 5 Total: 394 PCB Companies > $100mm $20 to $99mm $10 to $19mm $0 to $9mm TTM is the larg
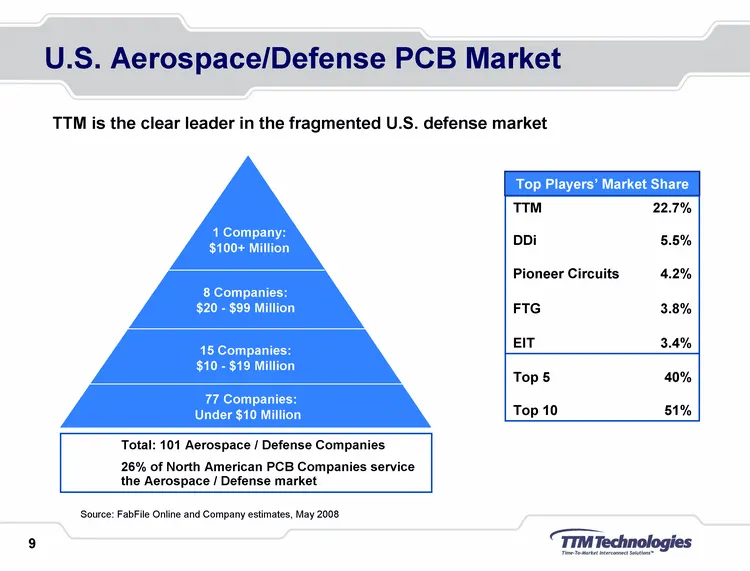
Slide 9: U.S. Aerospace/Defense PCB Market
U.S. Aerospace/Defense PCB Market Source: FabFile Online and Company estimates, May 2008 1 Company: $100+ Million 15 Companies: $10 - $19 Million Total: 101 Aerospace / Defense Companies 26% of North American PCB Companies service the Aerospace / Defense market 77 Companies: Under $10 Million 8 Comp
Slide 10: Customer & Market Overview
Customer & Market Overview
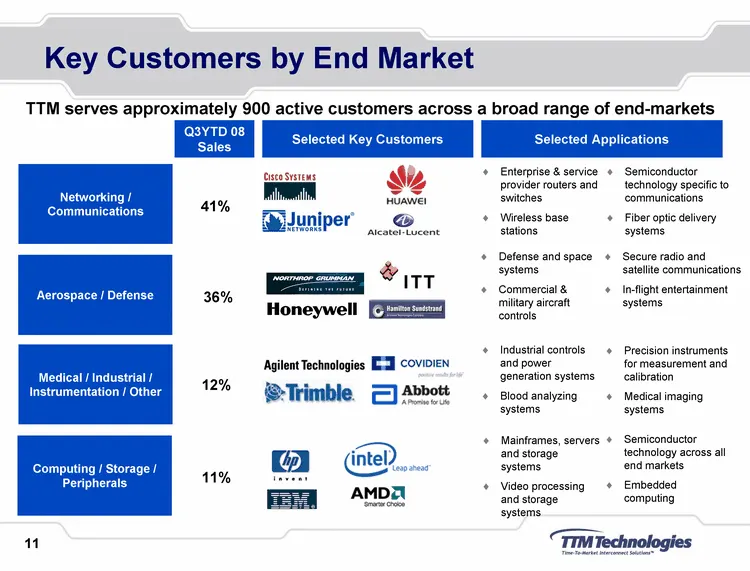
Slide 11: Key Customers by End Market
Key Customers by End Market TTM serves approximately 900 active customers across a broad range of end-markets Networking / Communications Medical / Industrial / Instrumentation / Other Enterprise & service provider routers and switches Wireless base stations Semiconductor technology specific to comm
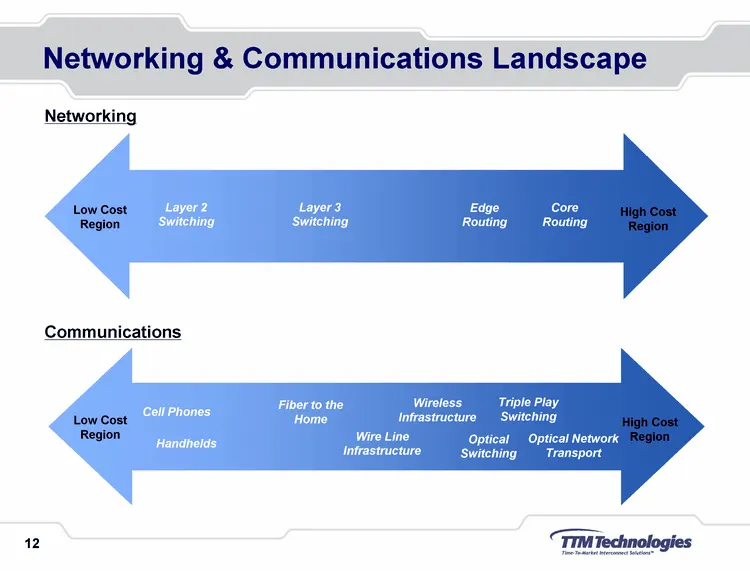
Slide 12: Networking & Communications Landscape
Networking & Communications Landscape Networking Low Cost Region High Cost Region Layer 2 Switching Layer 3 Switching Edge Routing Core Routing Communications Low Cost Region High Cost Region Cell Phones Handhelds Fiber to the Home Wire Line Infrastructure Optical Switching Triple Play Switching Wir
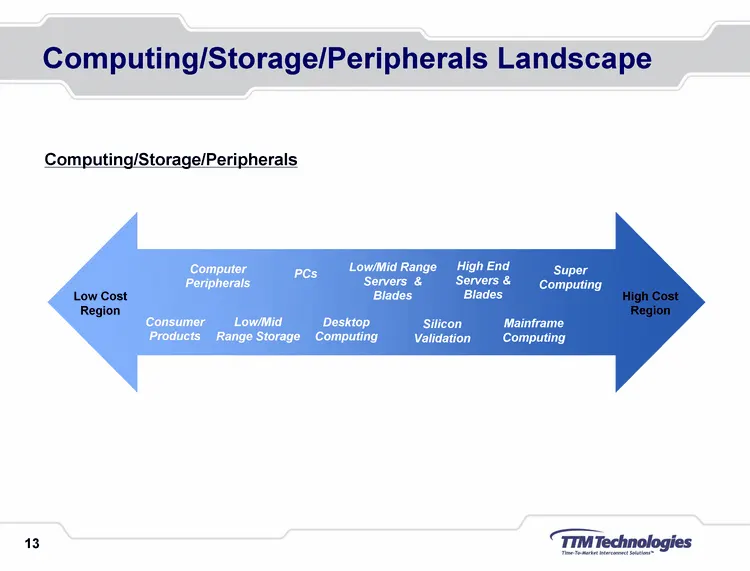
Slide 13: Computing/Storage/Peripherals Landscape
Computing/Storage/Peripherals Landscape Computing/Storage/Peripherals Low Cost Region High Cost Region Super Computing High End Servers & Blades Consumer Products Low/Mid Range Storage Mainframe Computing PCs Desktop Computing Low/Mid Range Servers & Blades Computer Peripherals Silicon Validation
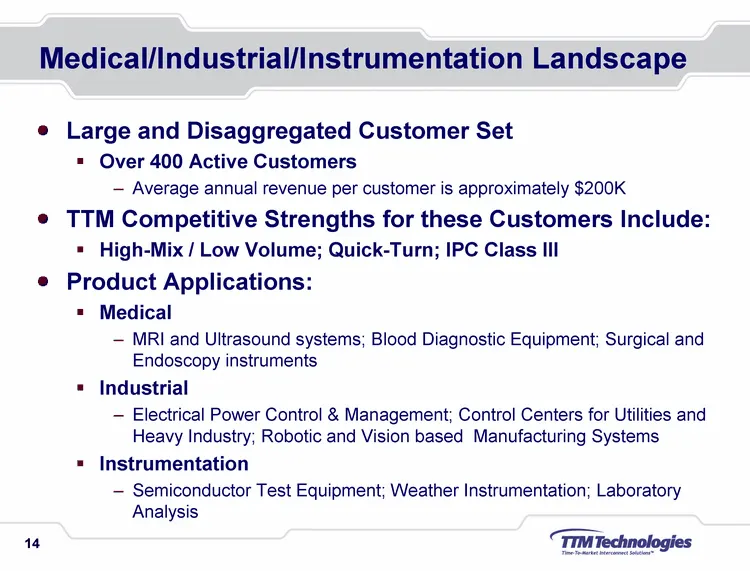
Slide 14: Medical/Industrial/Instrumentation Landscape
Medical/Industrial/Instrumentation Landscape Large and Disaggregated Customer Set Over 400 Active Customers Average annual revenue per customer is approximately $200K TTM Competitive Strengths for these Customers Include: High-Mix / Low Volume; Quick-Turn; IPC Class III Product Applications: Medical
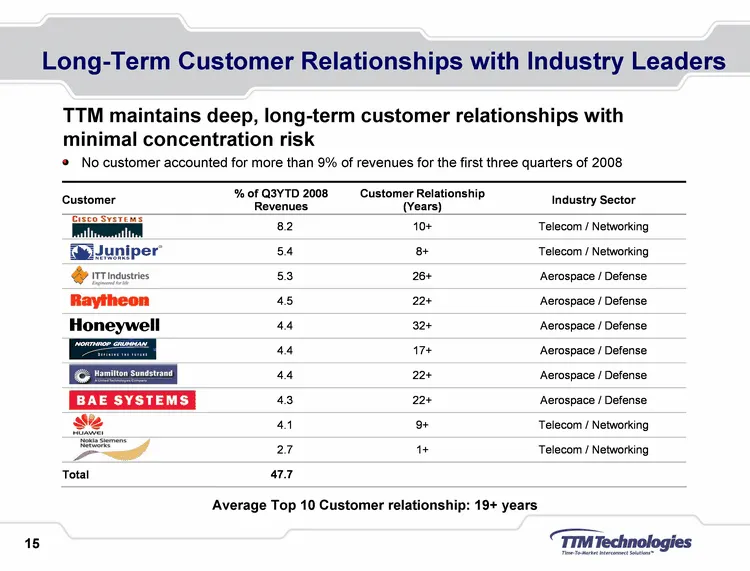
Slide 15: Long-Term Customer Relationships with Industry Leaders
Long-Term Customer Relationships with Industry Leaders TTM maintains deep, long-term customer relationships with minimal concentration risk No customer accounted for more than 9% of revenues for the first three quarters of 2008 Average Top 10 Customer relationship: 19+ years
Slide 16: Strategy and Financial Overview
Strategy and Financial Overview Kent Alder - Chief Executive Officer and President
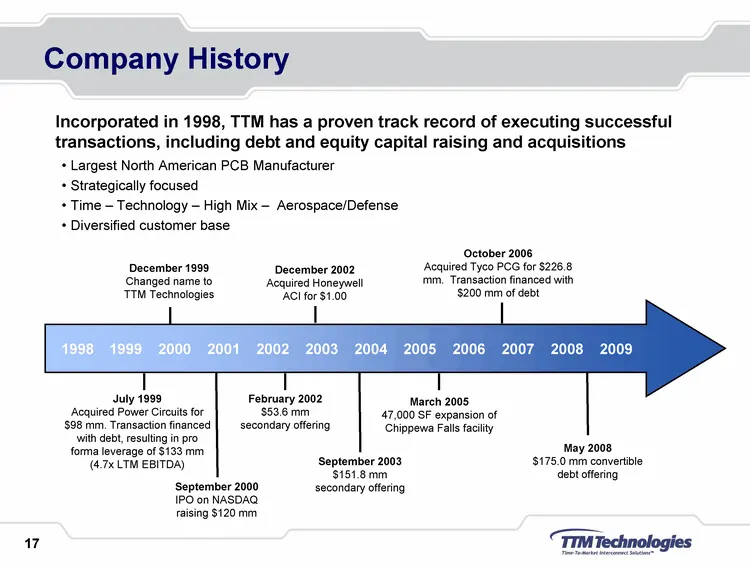
Slide 17: Company History
July 1999 Acquired Power Circuits for $98 mm. Transaction financed with debt, resulting in pro forma leverage of $133 mm (4.7x LTM EBITDA) December 1999 Changed name to TTM Technologies February 2002 $53.6 mm secondary offering December 2002 Acquired Honeywell ACI for $1.00 September 2003 $151.8 mm
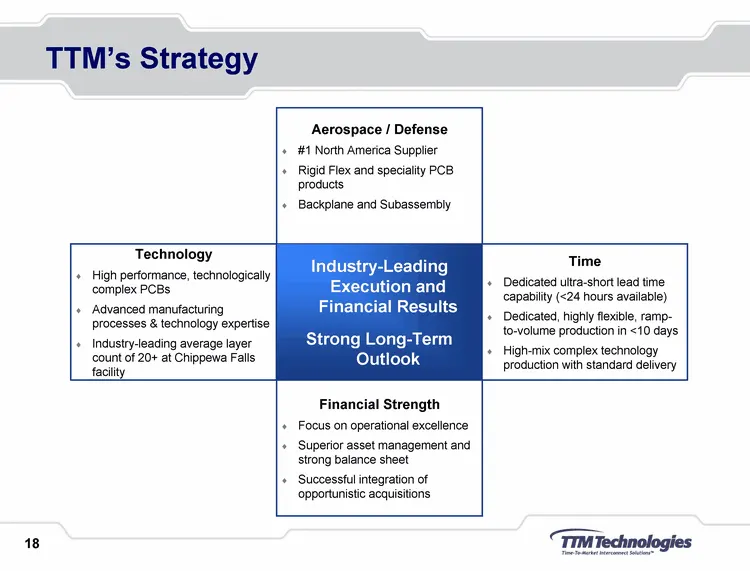
Slide 18: TTM's Strategy
TTM's Strategy Financial Strength Focus on operational excellence Superior asset management and strong balance sheet Successful integration of opportunistic acquisitions Aerospace / Defense #1 North America Supplier Rigid Flex and speciality PCB products Backplane and Subassembly Time Dedicated ultr
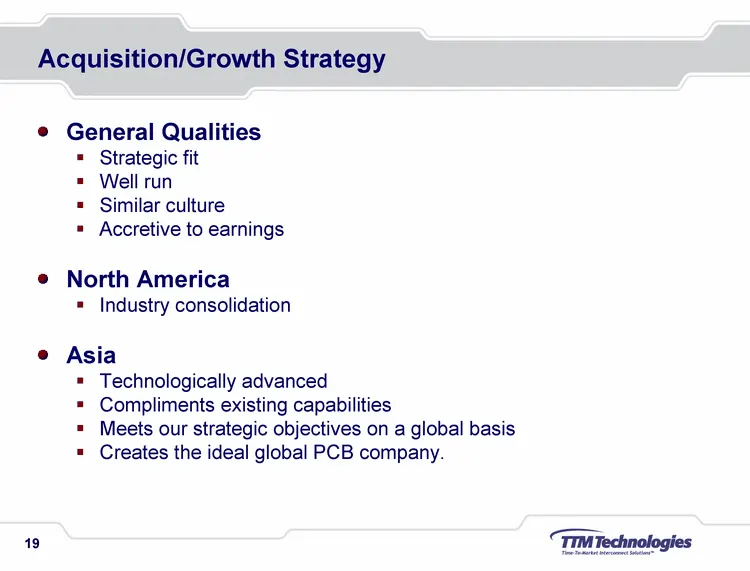
Slide 19: Acquisition/Growth Strategy
Acquisition/Growth Strategy General Qualities Strategic fit Well run Similar culture Accretive to earnings North America Industry consolidation Asia Technologically advanced Compliments existing capabilities Meets our strategic objectives on a global basis Creates the ideal global PCB company.
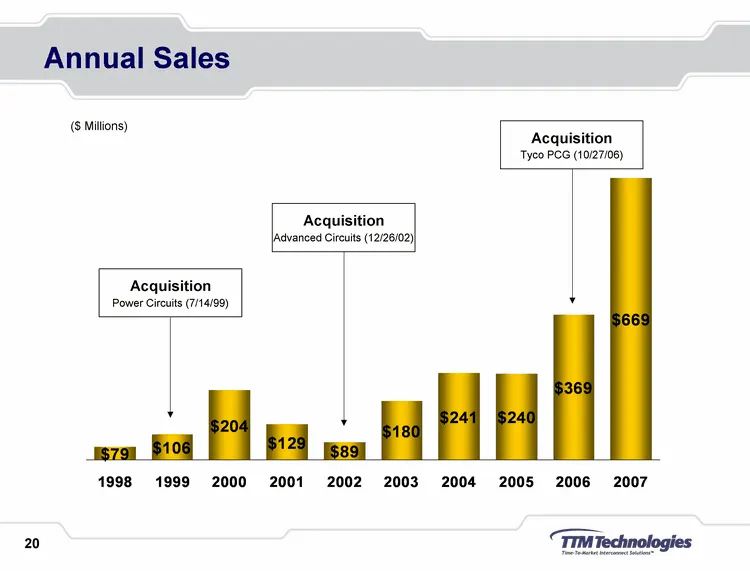
Slide 20: Annual Sales
Annual Sales 1998 1999 2000 2001 2002 2003 2004 2005 2006 2007 LTM 78.5 106.4 203.7 129 89 180.3 240.7 240.2 369.3 669.46 666.7 ($ Millions) Acquisition Advanced Circuits (12/26/02) Acquisition Power Circuits (7/14/99) Acquisition Tyco PCG (10/27/06)
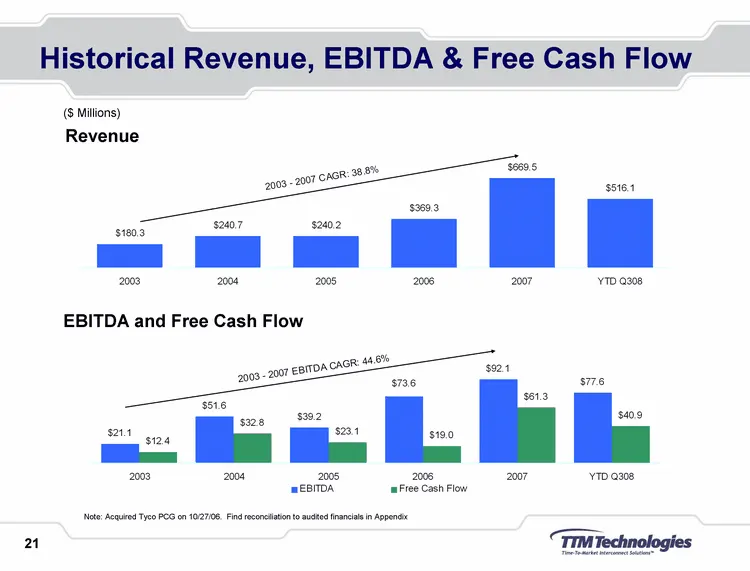
Slide 21: Historical Revenue, EBITDA & Free Cash Flow
Historical Revenue, EBITDA & Free Cash Flow ($ Millions) Note: Acquired Tyco PCG on 10/27/06. Find reconciliation to audited financials in Appendix Revenue EBITDA and Free Cash Flow
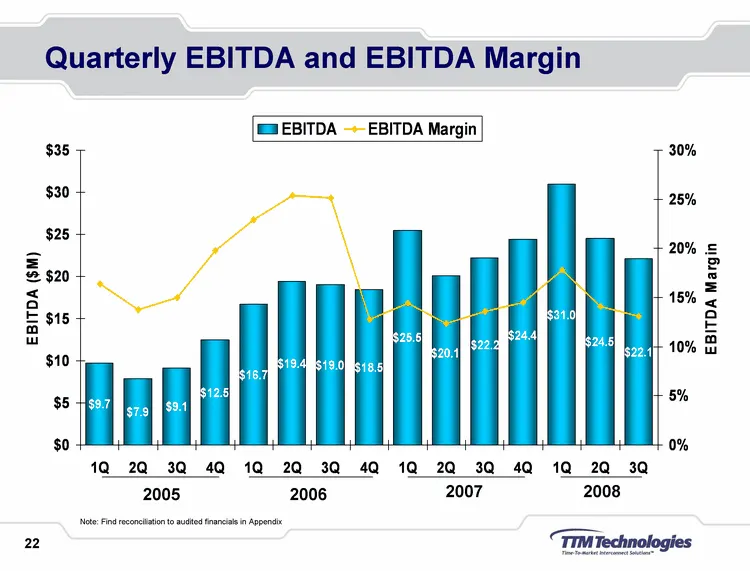
Slide 22: Quarterly EBITDA and EBITDA Margin
1Q 2Q 3Q 4Q 1Q 2Q 3Q 4Q 1Q 2Q 3Q 4Q 1Q 2Q 3Q EBITDA 9.7 7.9 9.1 12.5 16.7 19.4 19 18.5 25.5 20.1 22.2 24.4 31 24.5 22.1 EBITDA Margin 0.164 0.138 0.15 0.198 0.229 0.254 0.251 0.128 0.144 0.124 0.136 0.145 0.178 0.141 0.131 2005 2006 Quarterly EBITDA and EBITDA Margin 2007 2008 Note: Find reconciliat
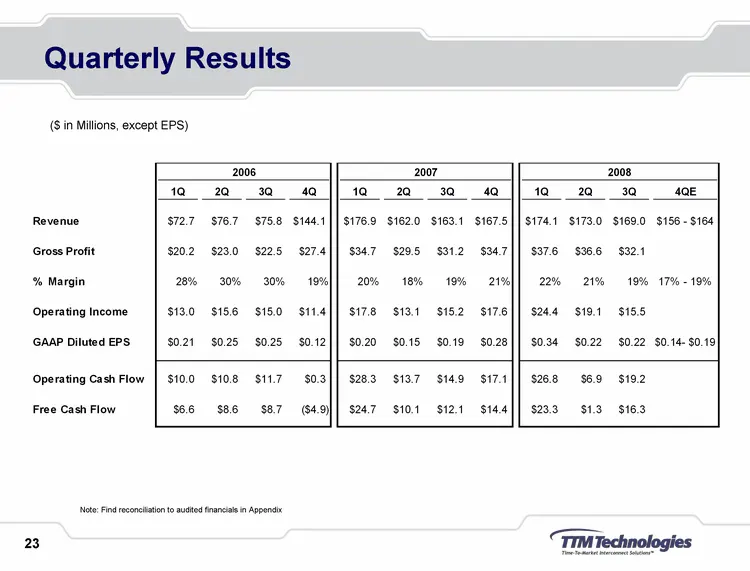
Slide 23: Quarterly Results
Quarterly Results ($ in Millions, except EPS) Note: Find reconciliation to audited financials in Appendix
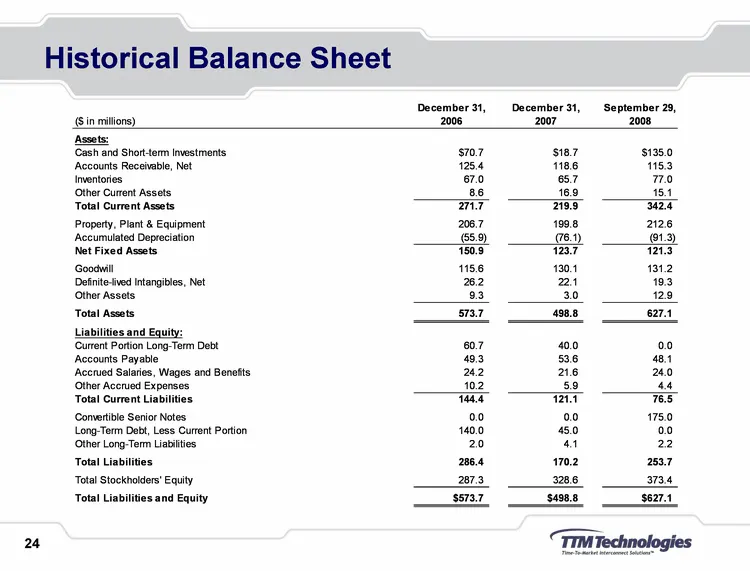
Slide 24: Historical Balance Sheet
24 Historical Balance Sheet December 31, December 31, September 29, {Sin milions) 2006 2007 2008 ‘Assets: ‘Cash and Short-term Investments $138.0 ‘Accounts Receivable, Net 153 Inventories 770 (ther Curent Assets 151 Total Current Assets uZ4 Property, Plant & Equipment 2128 ‘Accumulated Depreciation
Slide 25: Summary
Summary
Slide 26: Summary
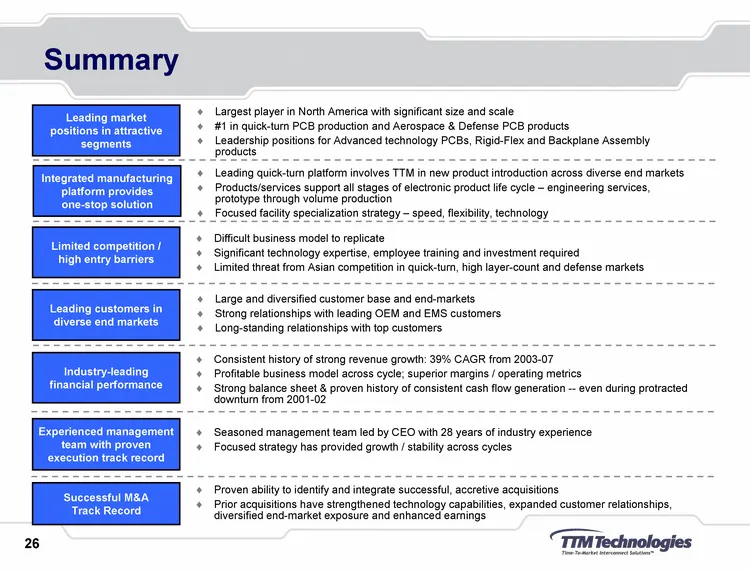
Summary Limited competition / high entry barriers Leading market positions in attractive segments Integrated manufacturing platform provides one-stop solution Largest player in North America with significant size and scale #1 in quick-turn PCB production and Aerospace & Defense PCB products Leadersh
Slide 27: Appendix: Non-GAAP supplemental information
Appendix Non-GAAP supplemental information
Slide 28: Annual EBITDA and FCF reconciliation
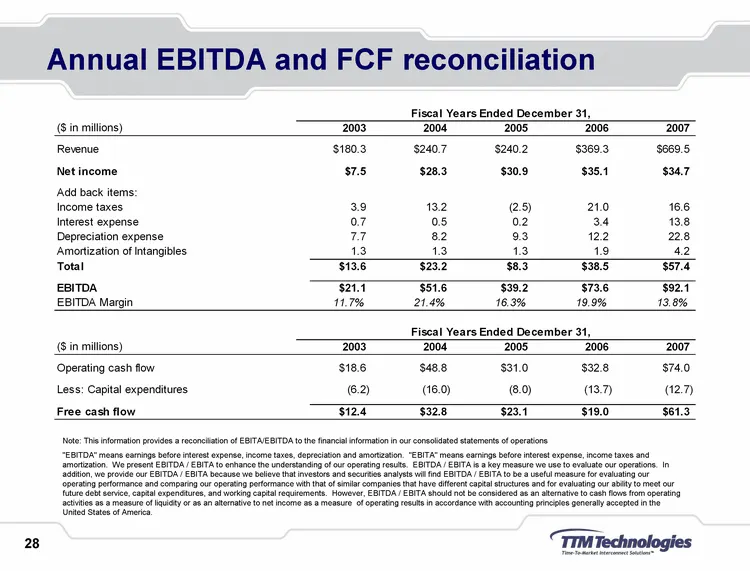
Annual EBITDA and FCF reconciliation Note: This information provides a reconciliation of EBITA/EBITDA to the financial information in our consolidated statements of operations "EBITDA" means earnings before interest expense, income taxes, depreciation and amortization. "EBITA" means earnings before
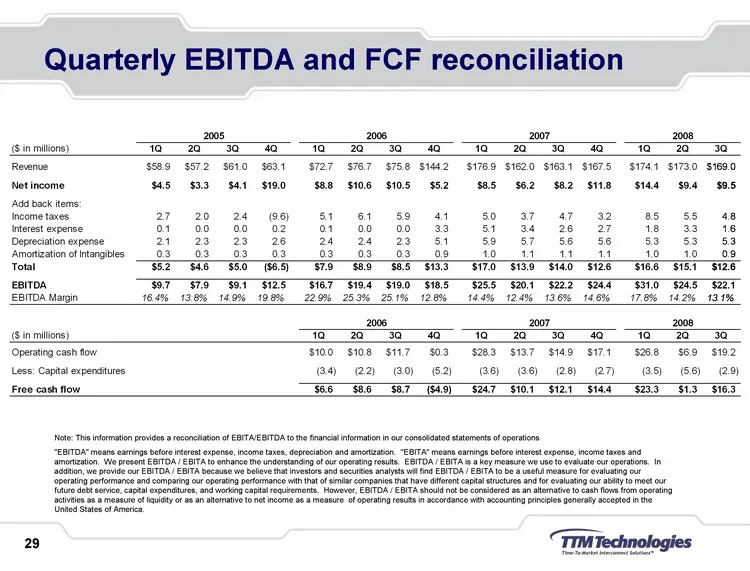
Slide 29: Quarterly EBITDA and FCF reconciliation
Quarterly EBITDA and FCF reconciliation Note: This information provides a reconciliation of EBITA/EBITDA to the financial information in our consolidated statements of operations "EBITDA" means earnings before interest expense, income taxes, depreciation and amortization. "EBITA" means earnings befo
Slide 30: TTM Technologies, Inc. Needham Growth Stock Conference
TTM Technologies, Inc. Investor Presentation 11th Annual Needham Growth Stock Conference January 8, 2009
Source: SEC EDGAR · 8-K filed Jan 8, 2009
More decks from TTM Technologies, Inc.
 Q3 2026 Earnings Presentation15 slides · Oct 22, 2026
 Investor Presentation (August 2026)9 slides · Aug 17, 2026
 Q2 2026 Earnings Presentation14 slides · Aug 5, 2026
 Investor Day (May 2026)70 slides · May 27, 2026
 Q1 2026 Earnings Presentation12 slides · Apr 29, 2026
 Q4 2025 Earnings Presentation14 slides · Feb 4, 2026