ENAV S.p.A. · MIL:ENAV
ENAV — Q1 2023 Earnings Presentation
12 slides from ENAV's earnings presentation, May 11, 2023

Slide 1: 1Q 2023 Financial Results
1Q 2023 Financial Results May 11, 2023
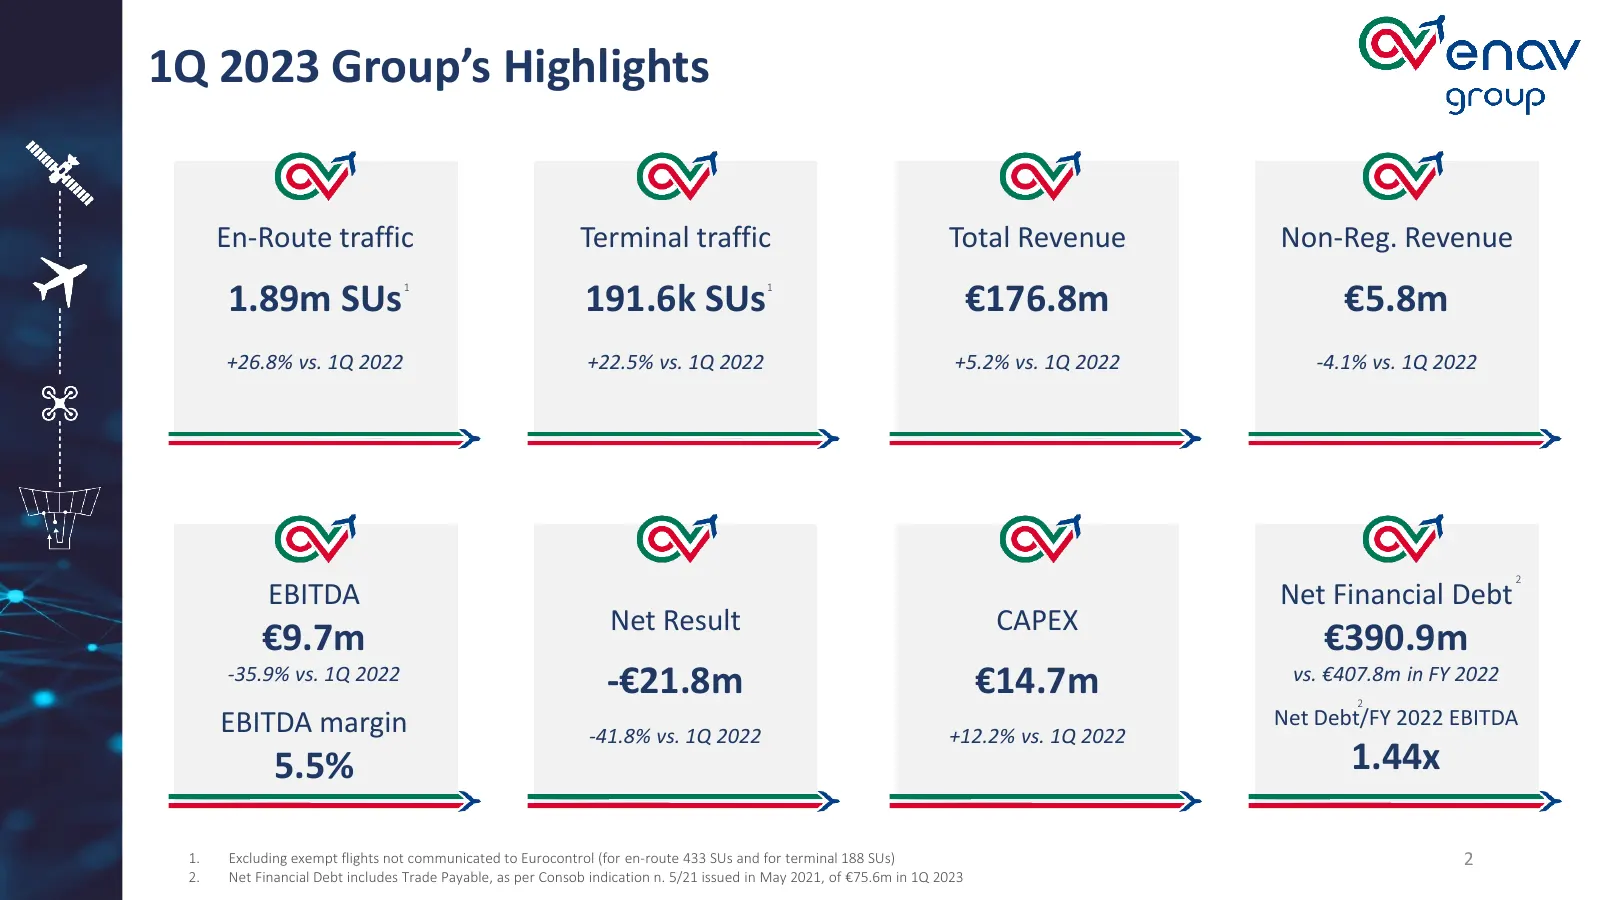
Slide 2: 1Q 2023 Group's Highlights
1Q 2023 Group’s Highlights En-Route traffic Terminal traffic Total Revenue Non-Reg. Revenue 1.89m SUs 1 191.6k SUs 1 €176.8m €5.8m +26.8% vs. 1Q 2022 +22.5% vs. 1Q 2022 +5.2% vs. 1Q 2022 -4.1% vs. 1Q 2022 2 EBITDA Net Financial Debt Net Result CAPEX €9.7m €390.9m -35.9% vs. 1Q 2022 -€21.8m €14.7m vs
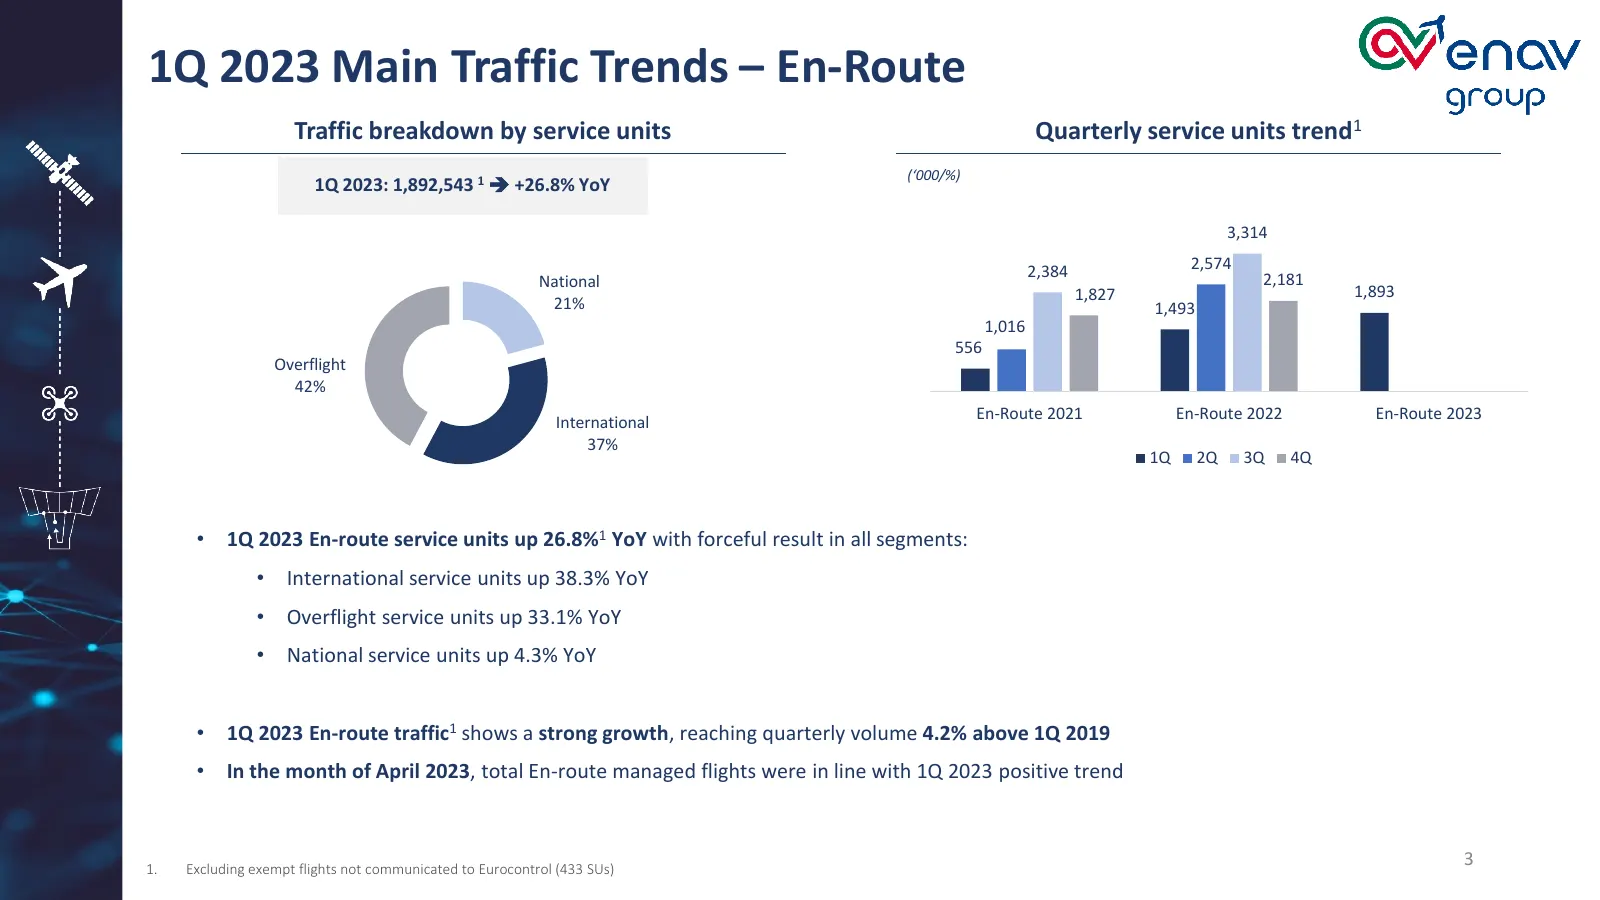
Slide 3: 1Q 2023 Main Traffic Trends – En-Route
1Q 2023 Main Traffic Trends – En-Route Traffic breakdown by service units Quarterly service units trend1 (‘000/%) 1Q 2023: 1,892,543 1 ➔ +26.8% YoY 3,314 2,384 2,574 National 2,181 1,827 1,893 21% 1,493 1,016 556 Overflight 42% International En-Route 2021 En-Route 2022 En-Route 2023 37% 1Q 2Q 3Q 4Q
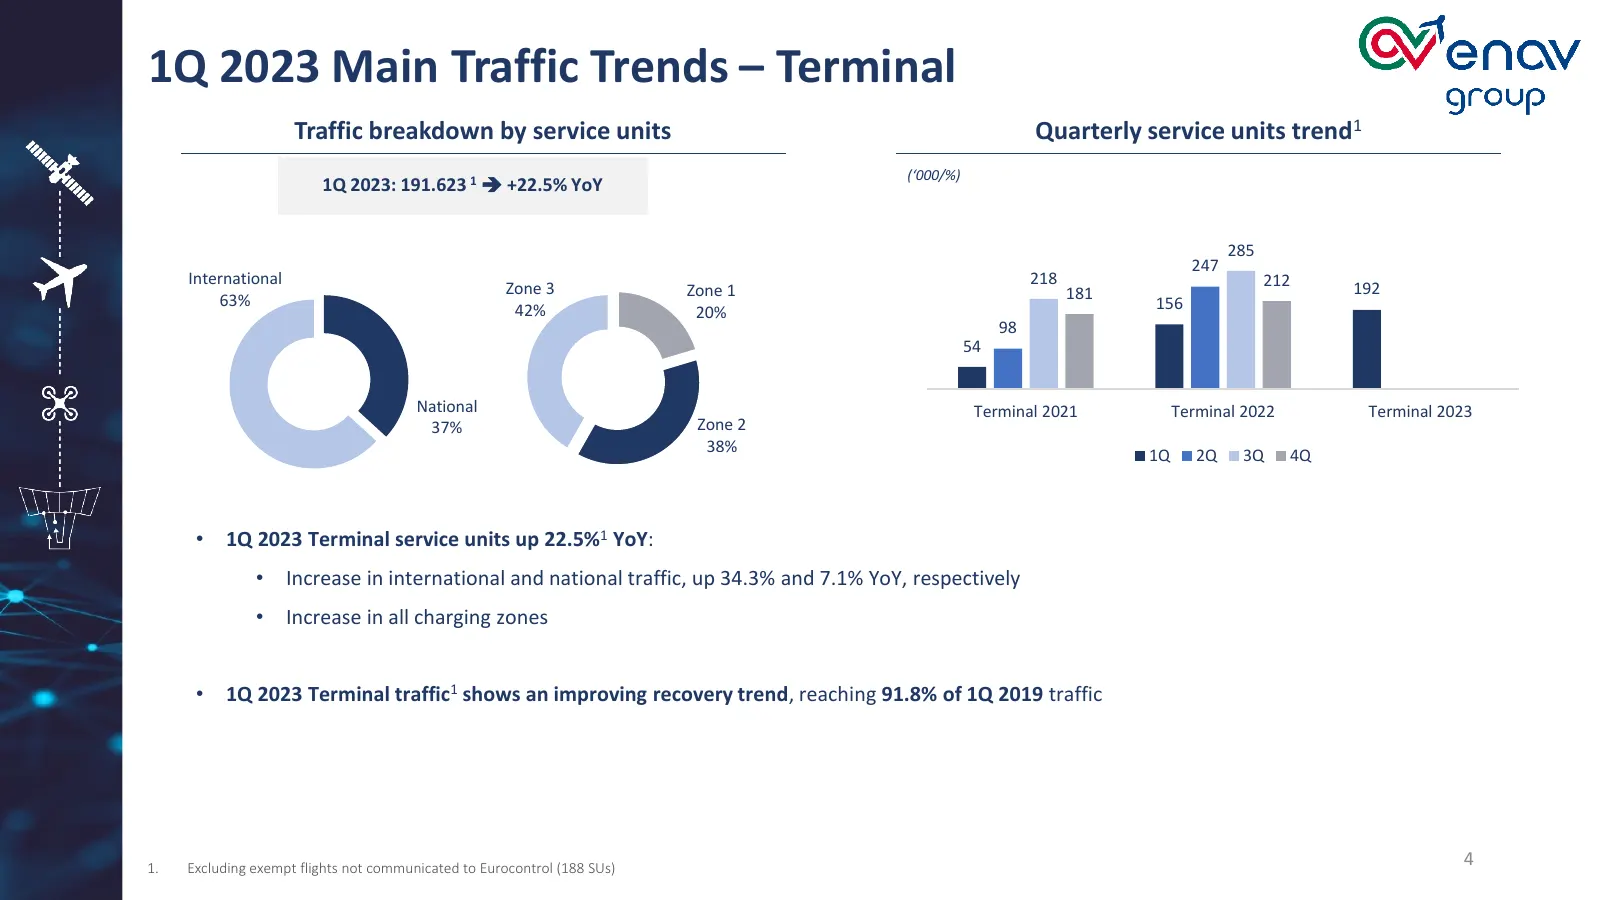
Slide 4: 1Q 2023 Main Traffic Trends – Terminal
1Q 2023 Main Traffic Trends – Terminal Traffic breakdown by service units Quarterly service units trend1 (‘000/%) 1Q 2023: 191.623 1 ➔ +22.5% YoY 285 247 International 218 212 Zone 3 Zone 1 181 192 63% 156 42% 20% 98 54 National Terminal 2021 Terminal 2022 Terminal 2023 37% Zone 2 38% 1Q 2Q 3Q 4Q •
Slide 5: Financial Overview
1Q 2023 Financial Overview
Slide 6: Total Revenue Performance
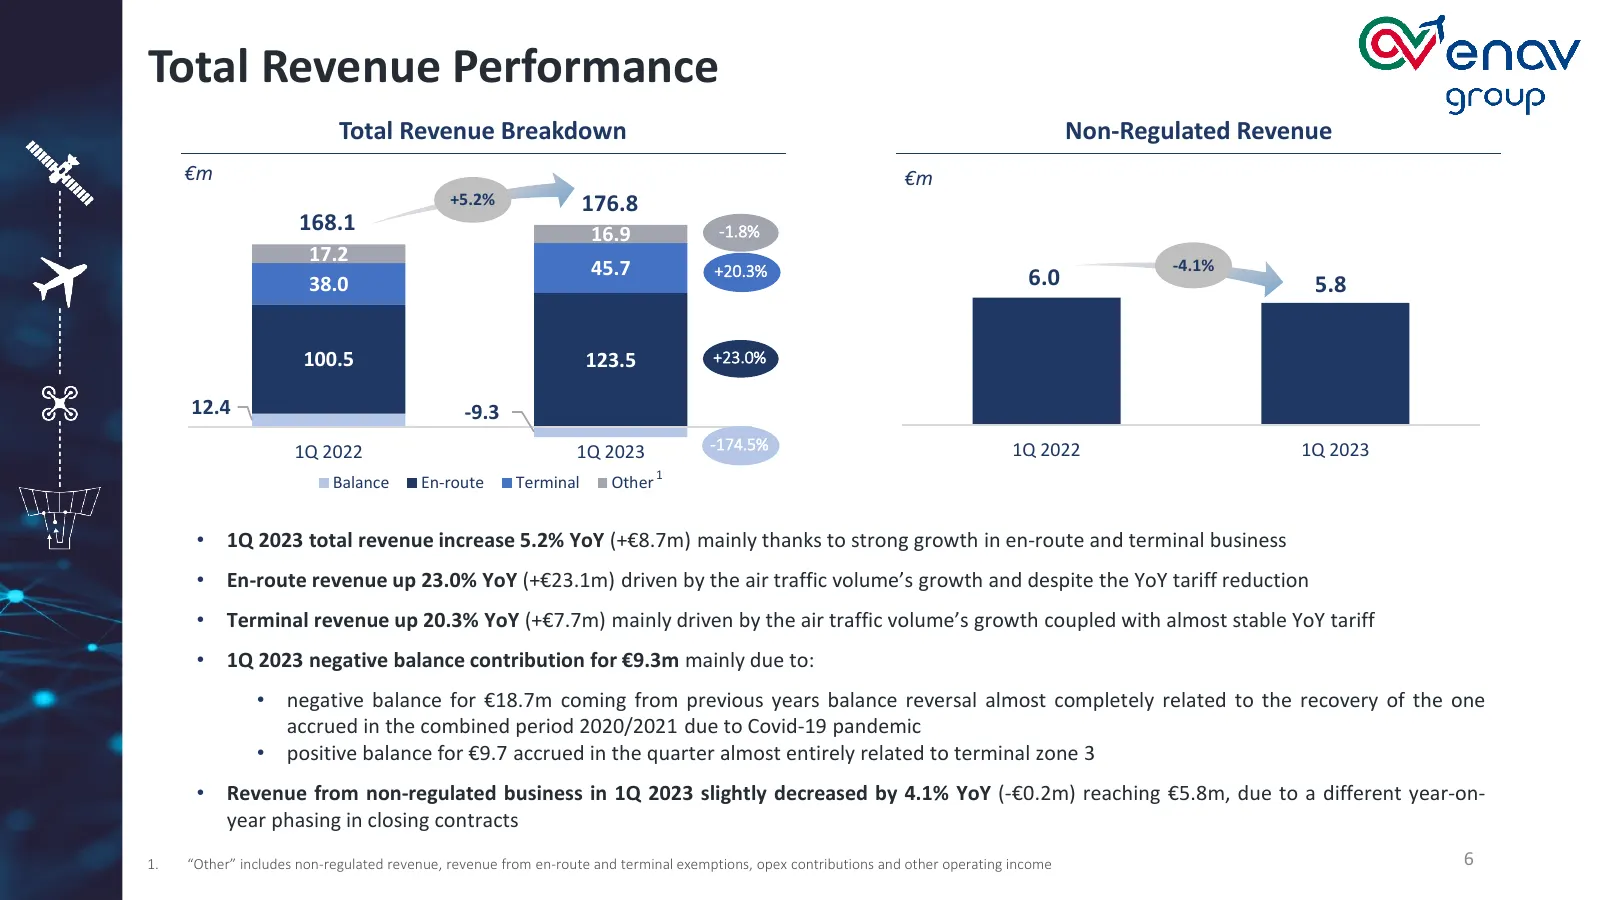
Total Revenue Performance Total Revenue Breakdown Non-Regulated Revenue €m €m +5.2% 176.8 168.1 16.9 -1.8% 17.2 -4.1% 45.7 +20.3% 6.0 38.0 5.8 100.5 123.5 +23.0% 12.4 -9.3 1Q 2022 1Q 2023 -174.5% 1Q 2022 1Q 2023 1 Balance En-route Terminal Other • 1Q 2023 total revenue increase 5.2% YoY (+€8.7m) mai
Slide 7: Cost Evolution
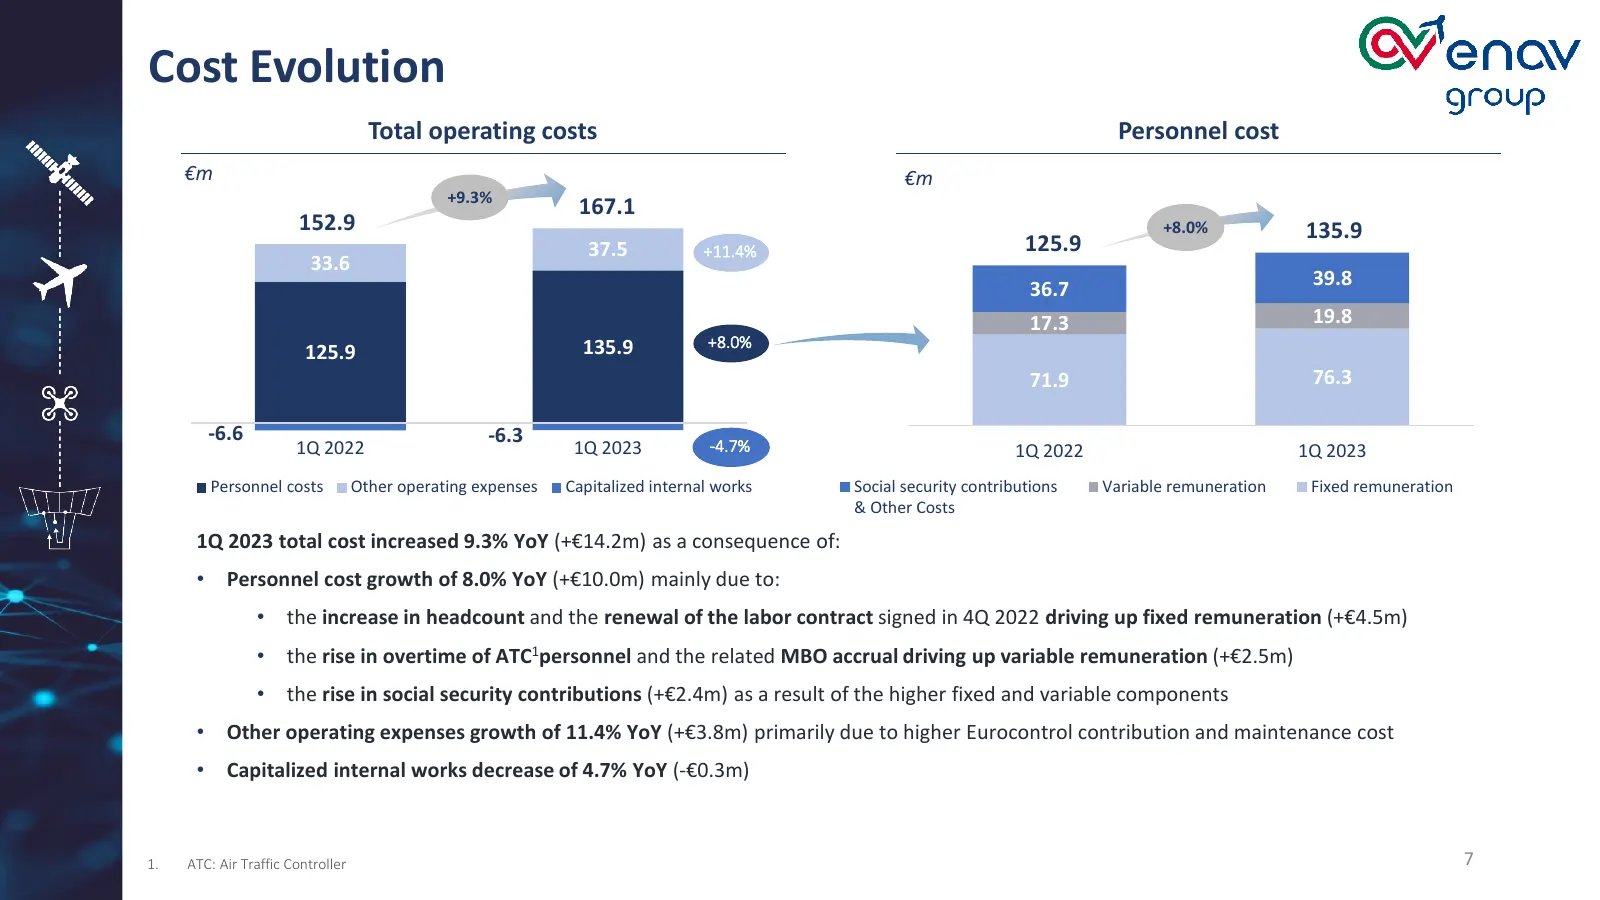
Cost Evolution Total operating costs Personnel cost €m €m +9.3% 167.1 152.9 +8.0% 135.9 37.5 +11.4% 125.9 33.6 36.7 39.8 17.3 19.8 135.9 +8.0% 125.9 71.9 76.3 -6.6 -6.3 -4.7% 1Q 2022 1Q 2023 1Q 2022 1Q 2023 Personnel costs Other operating expenses Capitalized internal works Social security contribut
Slide 8: Main Movements below EBITDA
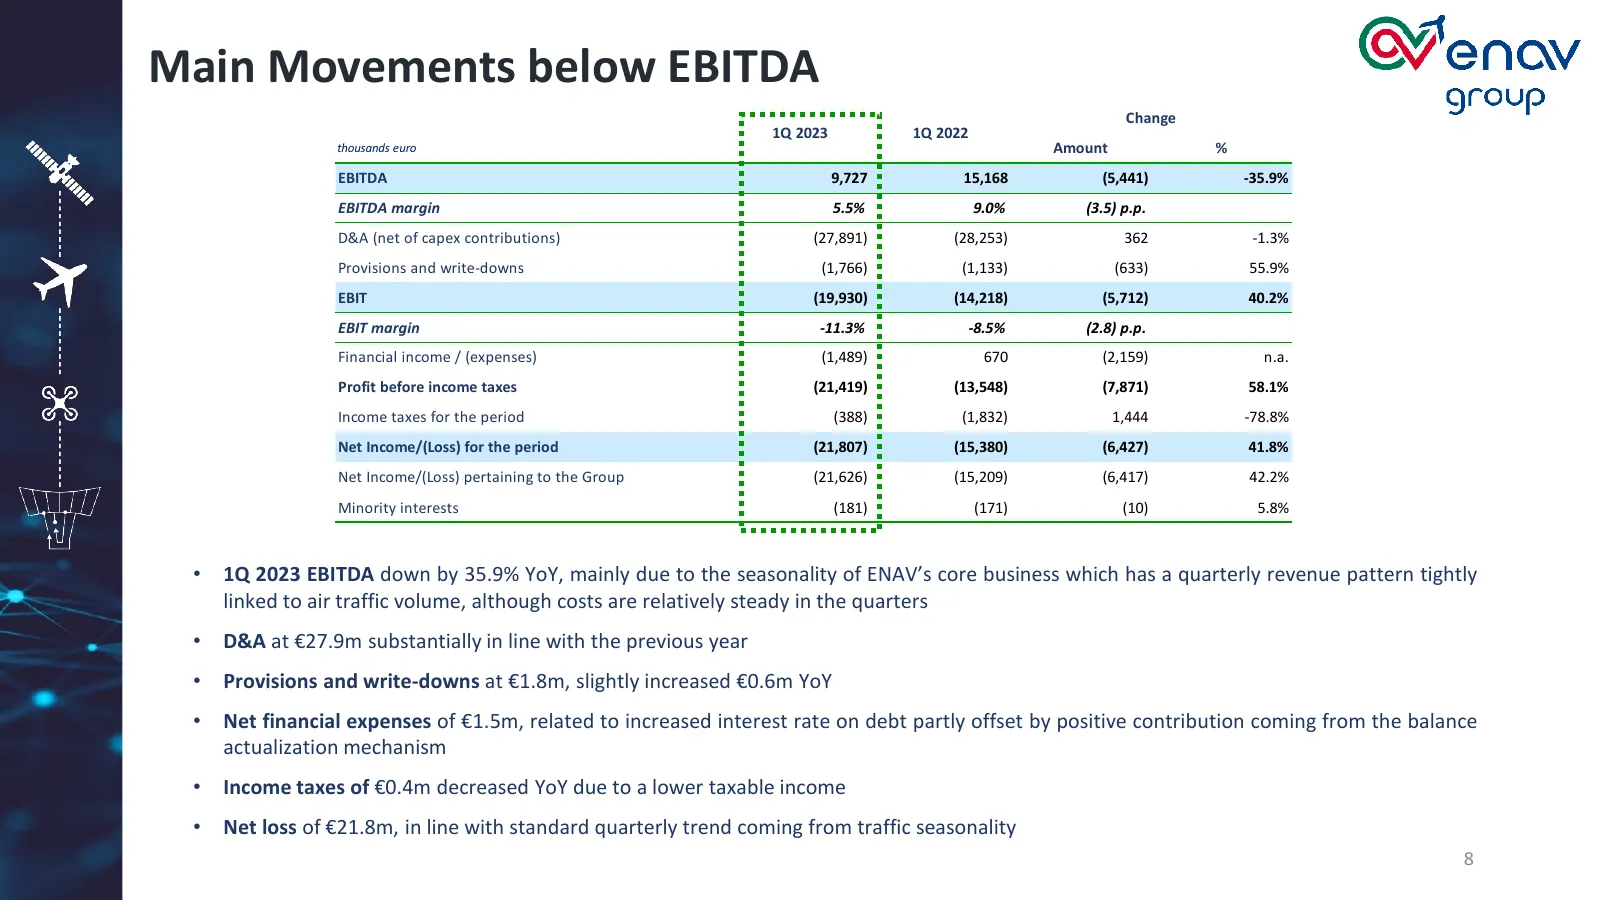
Main Movements below EBITDA Change 1Q 2023 1Q 2022 thousands euro Amount % EBITDA 9,727 15,168 (5,441) -35.9% EBITDA margin 5.5% 9.0% (3.5) p.p. D&A (net of capex contributions) (27,891) (28,253) 362 -1.3% Provisions and write-downs (1,766) (1,133) (633) 55.9% EBIT (19,930) (14,218) (5,712) 40.2% EB
Slide 9: Cash Flow and Capitalization
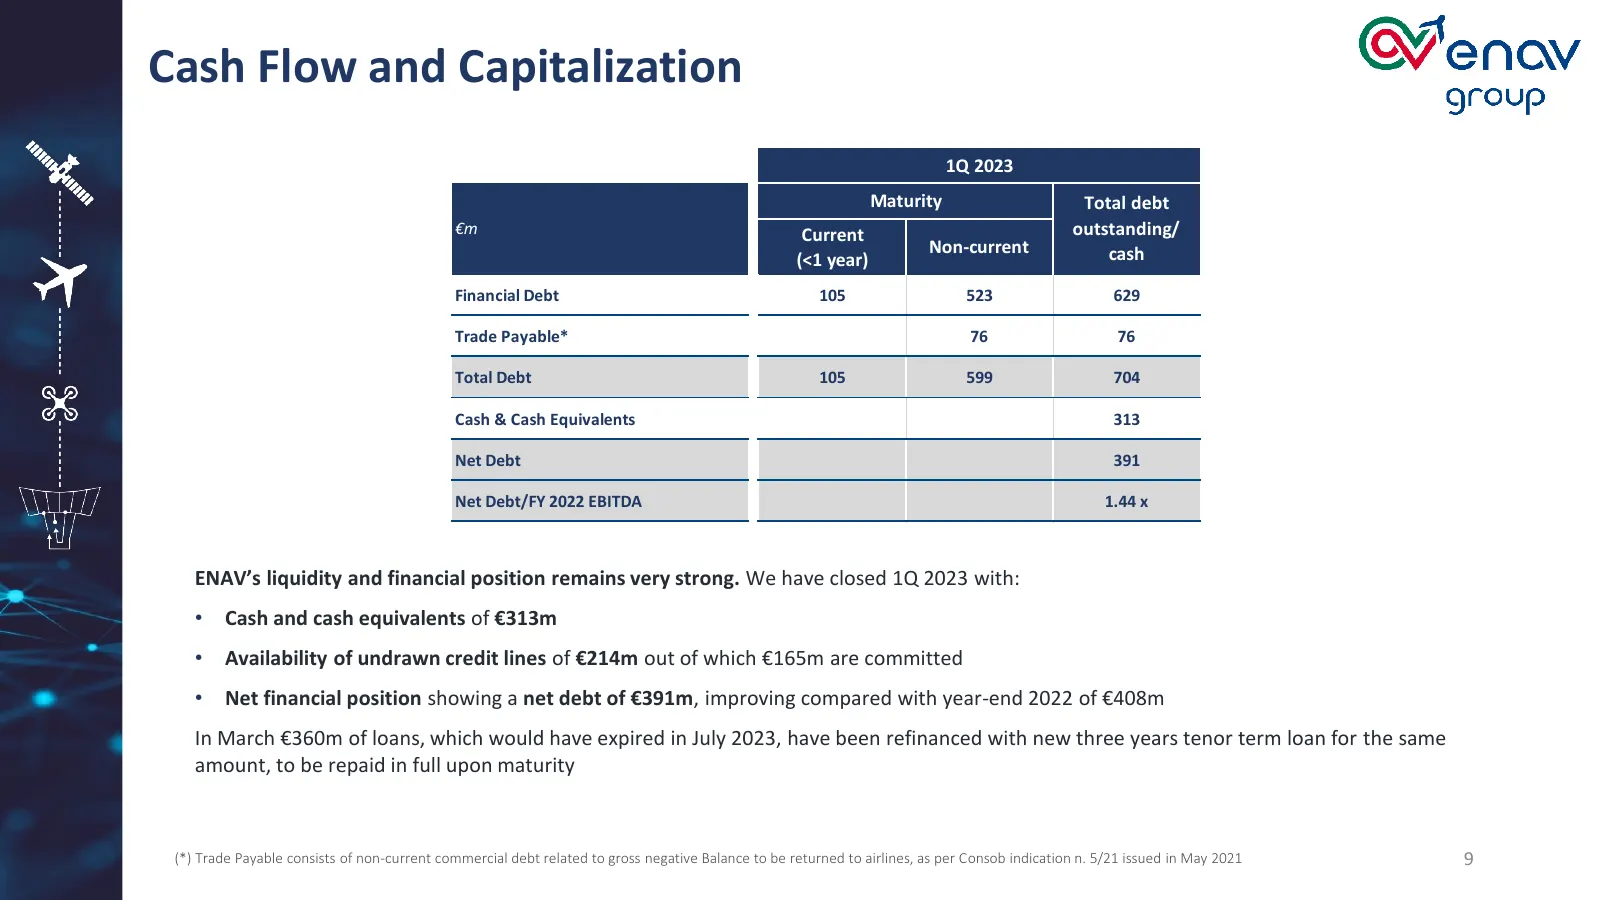
Cash Flow and Capitalization 1Q 2023 Maturity Total debt €m Current outstanding/ Non-current cash (<1 year) Financial Debt 105 523 629 Trade Payable* 76 76 Total Debt 105 599 704 Cash & Cash Equivalents 313 Net Debt 391 Net Debt/FY 2022 EBITDA 1.44 x ENAV’s liquidity and financial position remains v
Slide 10: 2023 Outlook update
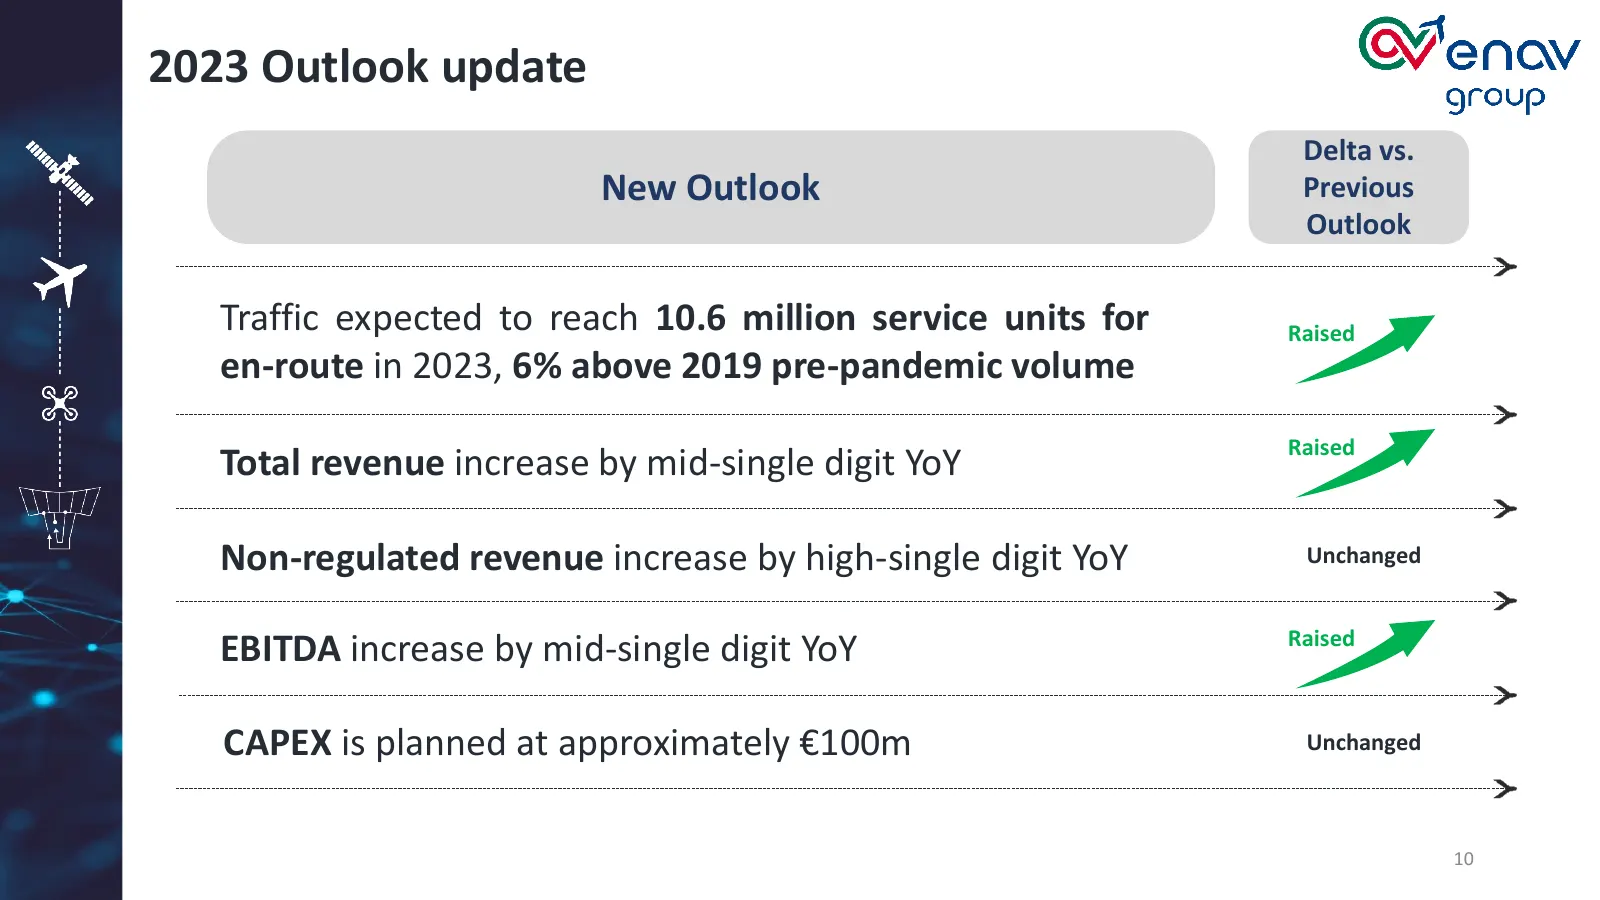
2023 Outlook update Delta vs. New Outlook Previous Outlook Traffic expected to reach 10.6 million service units for Raised en-route in 2023, 6% above 2019 pre-pandemic volume Raised Total revenue increase by mid-single digit YoY Non-regulated revenue increase by high-single digit YoY Unchanged Raise

Slide 11: Thanks for your attention
THANKS FOR YOUR ATTENTION Q&A SESSION enav.it
Slide 12: Disclaimer
Disclaimer This presentation contains certain forward-looking statements that reflect the Company’s management current views with respect to future events and the financial and operational performance of the Company and its subsidiaries. These forward-looking statements are based on ENAV S.p.A.’s cu
Source: Internet Archive copy of cdn-web.enav.it
More decks from ENAV S.p.A.
 H1 2026 Earnings Presentation13 slides · Aug 3, 2026
 Investor Presentation (August 2026)48 slides · August 2026
 Q1 2026 Earnings Presentation11 slides · May 12, 2026
 Q1 2026 Earnings Presentation48 slides · May 2026
 Investor Presentation (April 2026)54 slides · April 2026
 FY2025 Earnings Presentation17 slides · Mar 23, 2026