Boston Private Financial Holdings Inc
Boston Private Financial — Q4 2003 Earnings Presentation
21 slides from Boston Private Financial's earnings presentation, Jan 26, 2004
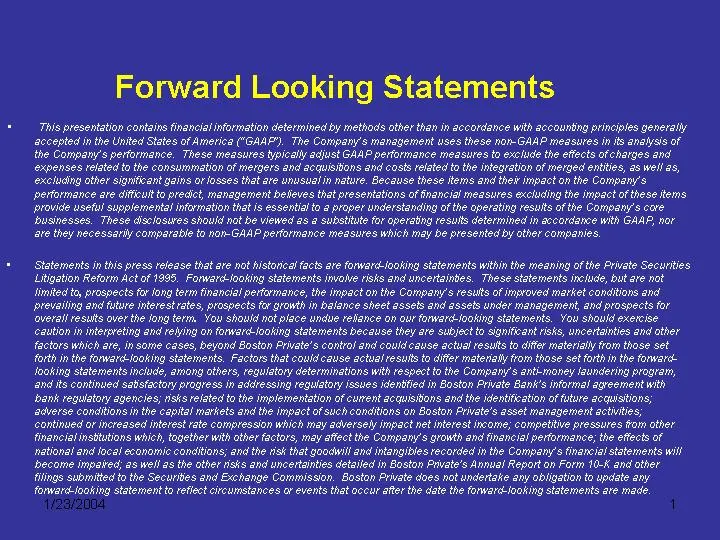
Slide 1: Forward Looking Statements
Forward Looking Statements This presentation contains financial information determined by methods otter than in accordance with accountng principles generally accepted in the United States of America ("GAAP"). The Company's management uses these non-GAAP measures in its analysts of the Company's per
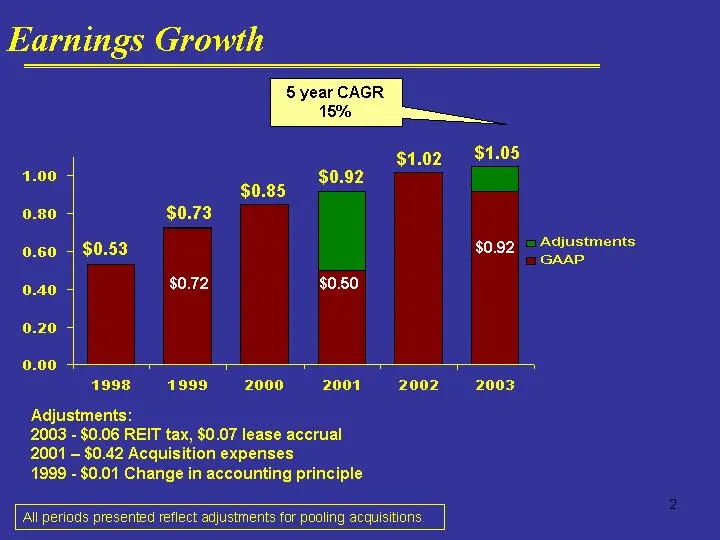
Slide 2: Earnings Growth
Earnings Growth 1998 1999, 2000 2001 2002 2003 Adjustments: 2003 - $0.06 REIT tax, $0.07 lease accrual 2001 — $0.42 Acquisition expenses 1999 - $0.01 Change in accounting principle All periods presented reflect adjustments for pooling acquisitions
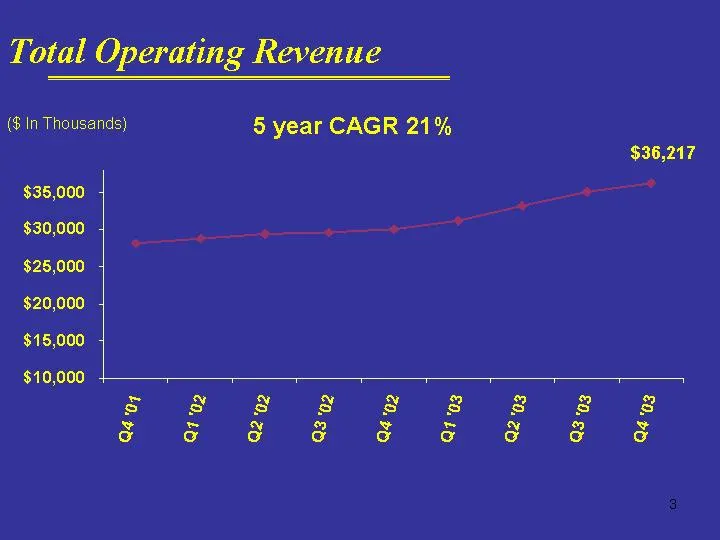
Slide 3: Total Operating Revenue
Total Operating Revenue (6 In Thousands) 5 year CAGR 21%
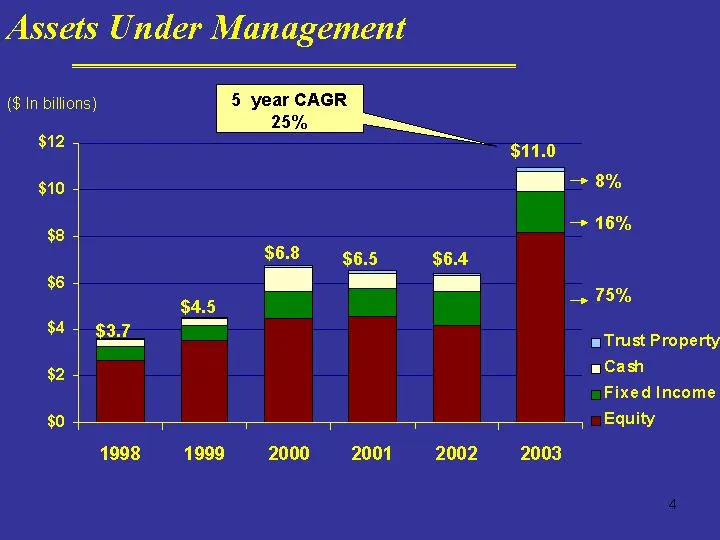
Slide 4: Assets Under Management
Assets Under Management $12 $10 > 15% a Trust Property Cash _ Fixed Income _ Equity 6 8 £ 8 6
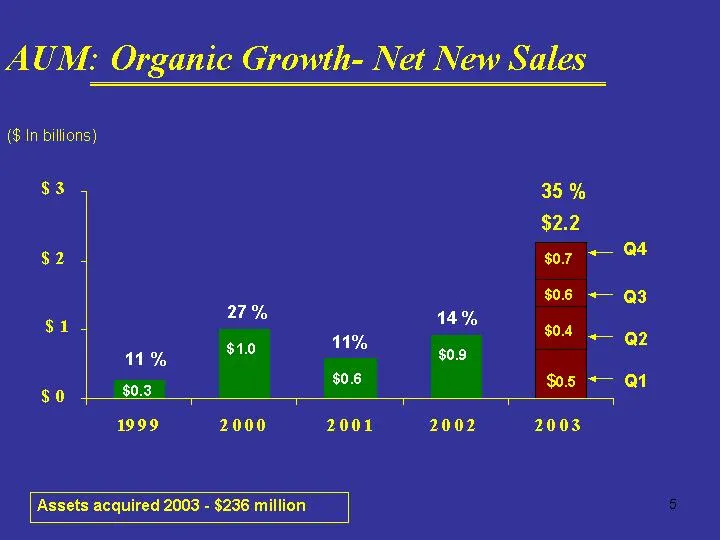
Slide 5: AUM: Organic Growth- Net New Sales
AUM: Organic Growth- Net New Sales ($ In billions) $3 35% $2.2 $2 279 9 Ax % 14% oo ~a i” % so | 903 1999 2000 2001 2002 2003 [Assets acquired 2003 - $236 million 2228 282
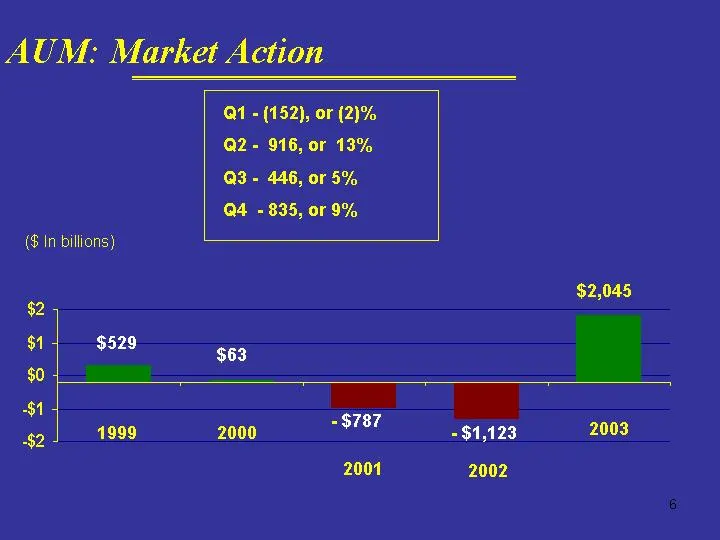
Slide 6: AUM: Market Action
AU™M: Market Action @H - (152), or (2)% Q2- 916, or 13% Q3- 446, or 5% Q4 - 835, or 9% (6 In billions) $2 $4 $529 Sea a 1 $2 1999 2000 peice = $1,123 2003
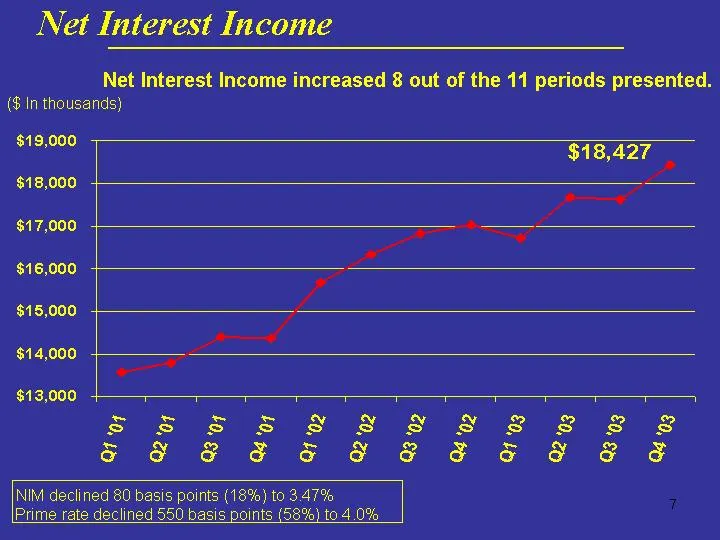
Slide 7: Net Interest Income
Net Interest Income Net Interest Income increased 8 out of the 11 periods presented. ($ In thousands) 18,427 lIM declined 80 basis points (18%) to 3.47% [Prime 5 ints (58%) to 4 |
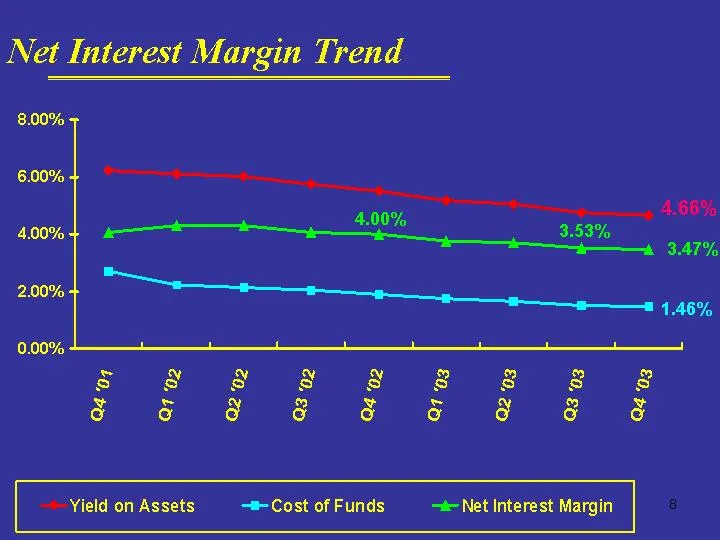
Slide 8: Net Interest Margin Trend
Net Interest Margin Trend Yield on Assets -® Cost of Funds =i Net Interest Margin 6
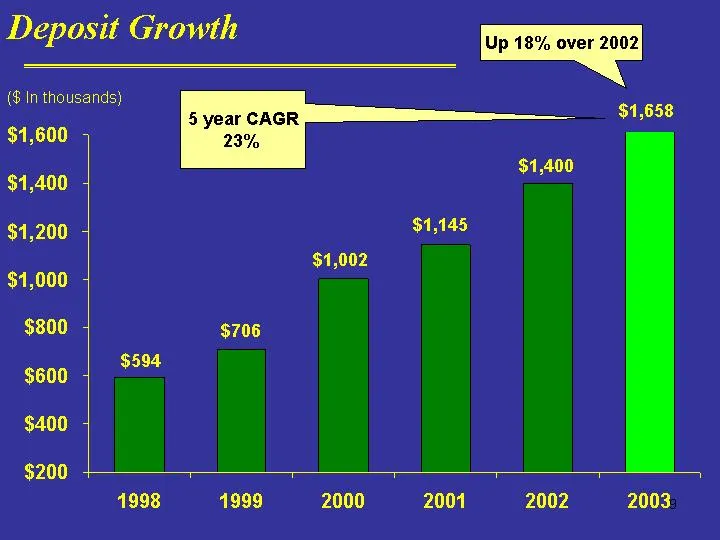
Slide 9: Deposit Growth
Deposit Growth cage {i ($ In thousands) =O $1,600 > $1,400 | ae $1,200 4 $1,145, $1,002 $1,000 7 $800 5 a i fT $200 + — 1999 2000 2001 2002 2003
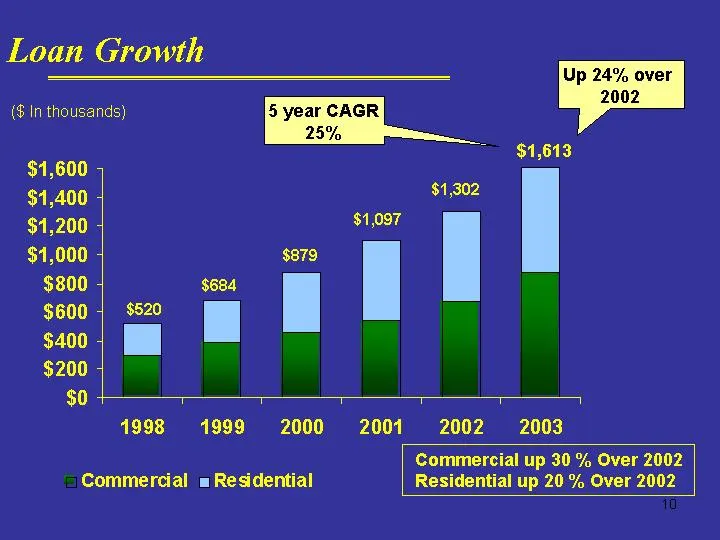
Slide 10: Loan Growth
Loan Growth zeaaill 1998 1999 2000 2001 2002 2003 Commercial up 30 % Over 2002 Commercial = Residential Residential up 20 % Over 2002 10
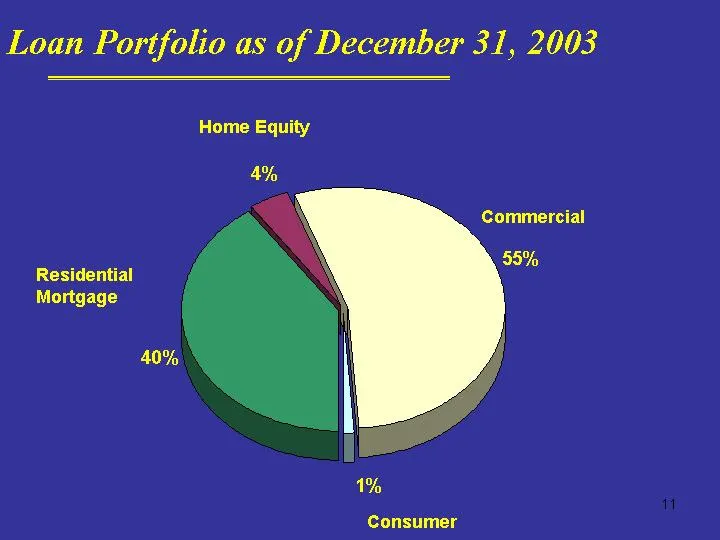
Slide 11: Loan Portfolio as of December 31, 2003
Loan Portfolio as of December 31, 2003 1
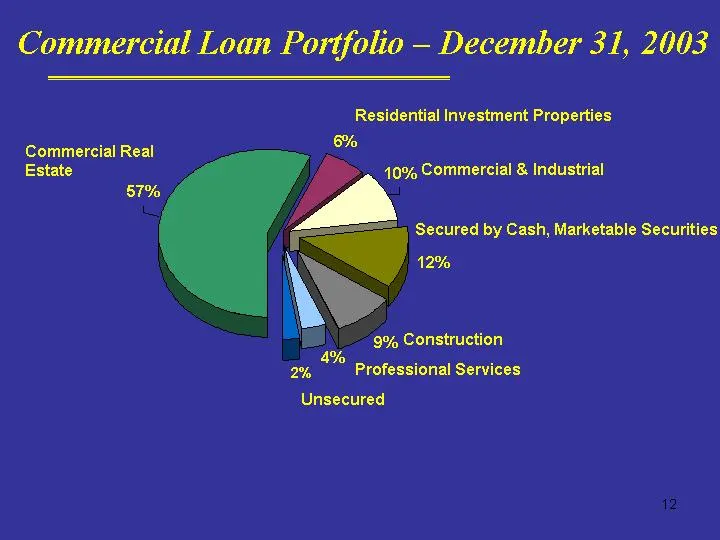
Slide 12: Commercial Loan Portfolio — December 31, 2003
Commercial Loan Portfolio — December 31, 2003 12
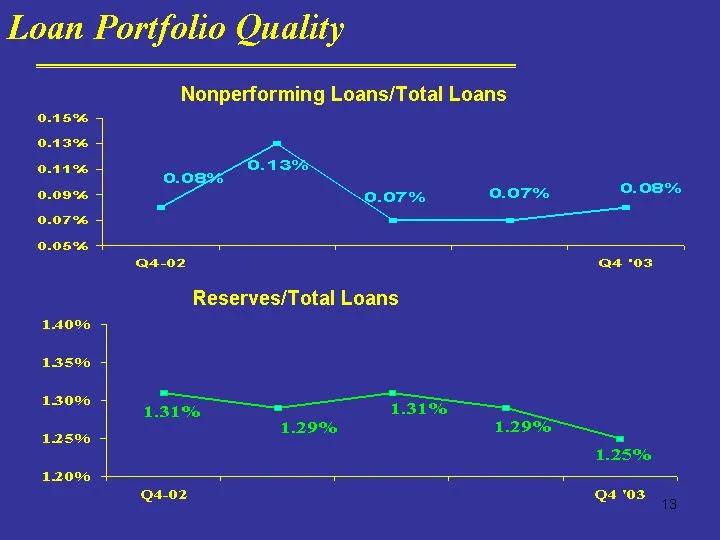
Slide 13: Loan Portfolio Quality
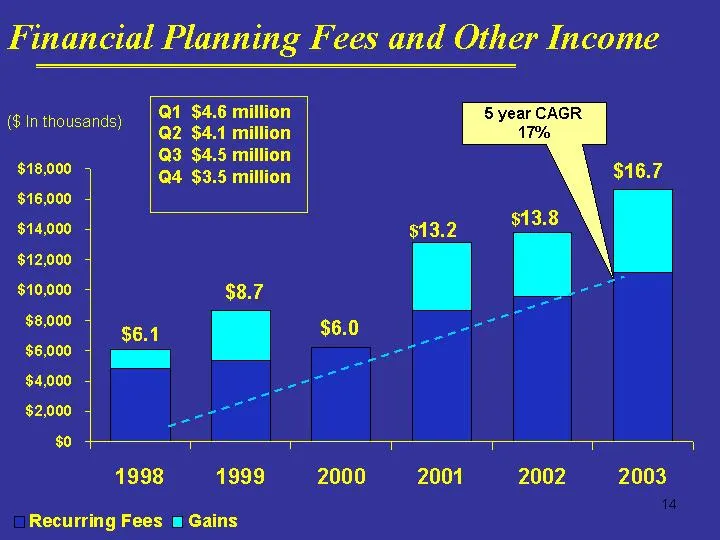
Slide 14: Financial Planning Fees and Other Income
Financial Planning Fees and Other Income
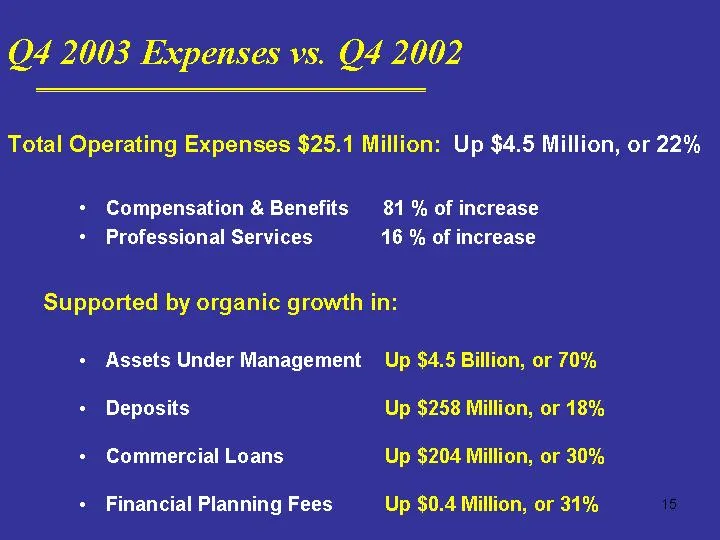
Slide 15: Q4 2003 Expenses vs. Q4 2002
Q4 2003 Expenses vs. Q4 2002 Total Operating Expenses $25.1 Million: Up $4.5 Million, or 22% + Compensation & Benefits 81 % of increase + Professional Services 16 % of increase Supported by organic growth in: + Assets Under Management Up $4.5 Billion, or 70% + Deposits Up $258 Million, or 18% + Comm
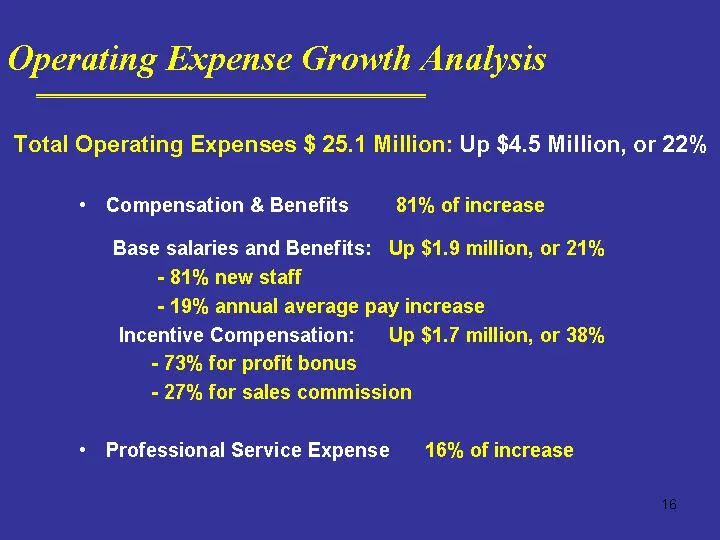
Slide 16: Operating Expense Growth Analysis
Operating Expense Growth Analysis Total Operating Expenses $ 25.1 Million: Up $4.5 Million, or 22% + Compensation & Benefits 81% of increase Base salaries and Benefits: Up $1.9 million, or 21% - 81% new staff - 19% annual average pay increase Incentive Compensation: Up $1.7 million, or 38% - 73% for
Slide 17: Capital Raise Overview
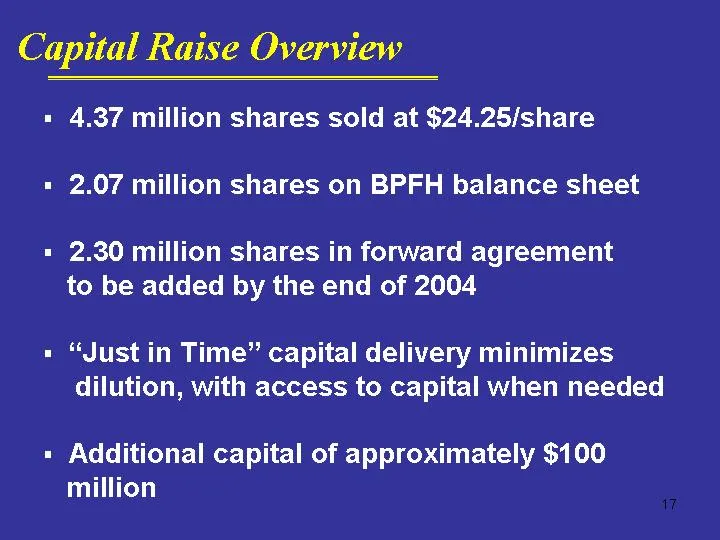
Capital Raise Overview 4.37 million shares sold at $24.25/share 2.07 million shares on BPFH balance sheet 2.30 million shares in forward agreement to be added by the end of 2004 “Just in Time” capital delivery minimizes dilution, with access to capital when needed Additional capital of approximately
Slide 18: Financial Impact of Acquisitions
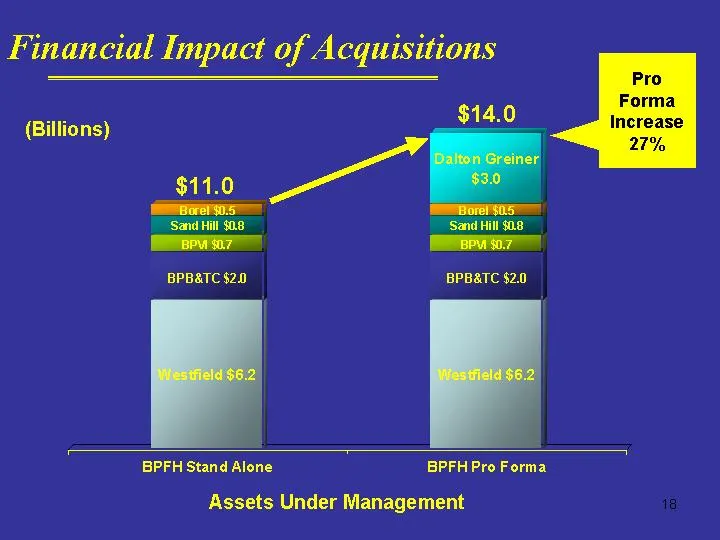
Financial Impact of Acquisitions $11.0 | =a - BPFH Stand Alone BPFH Pro Forma
Slide 19: Financial Impact of Acquisitions
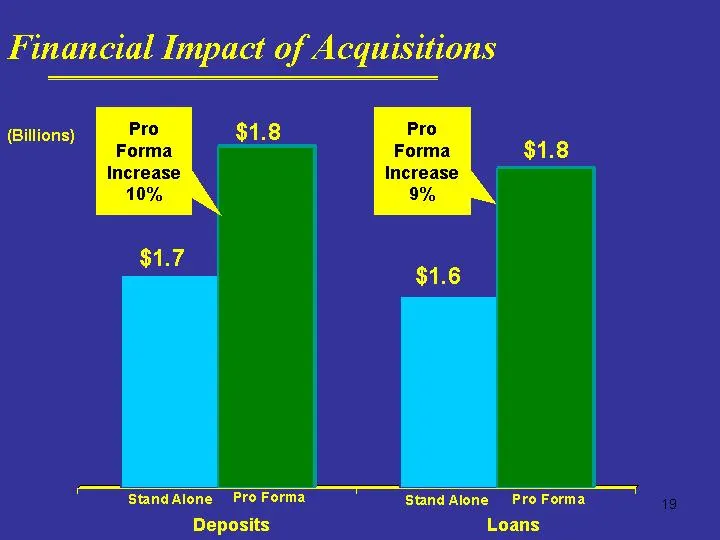
Financial Impact of Acquisitions Stand Alone Pro Forma Deposits Loans
Slide 20: Financial Impact of Acquisitions
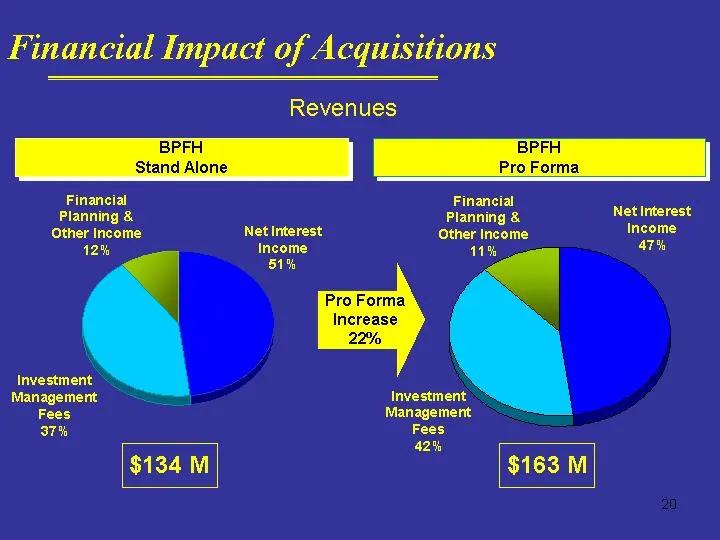
Financial Impact of Acquisitions 20
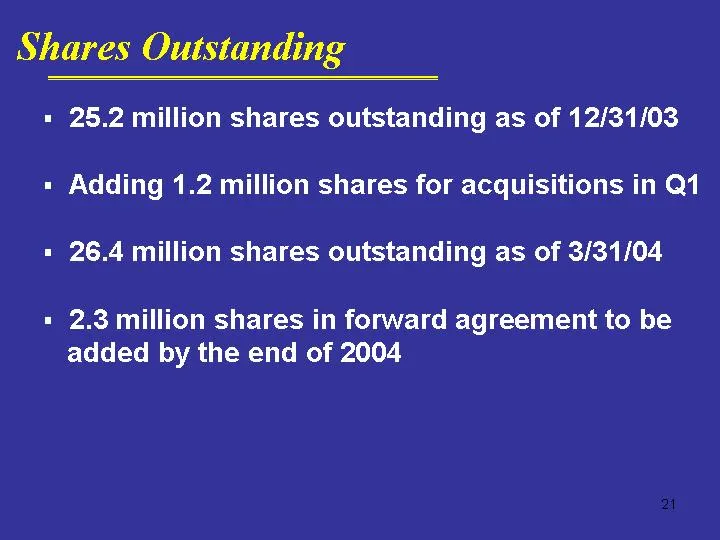
Slide 21: Searchable text section of graphics
Searchable text section of graphics shown above Exhibit 99.2 For ward Looking Statements • This presentation contains financial information determined by methods other than in accordance with accounting principles generally accepted in the United States of America (“GAAP”). The Company’s management
Source: SEC EDGAR · 8-K filed Jan 26, 2004
More decks from Boston Private Financial Holdings Inc
 Proxy Contest (April 2021)28 slides · Apr 9, 2021
 Merger or Acquisition (April 2021)24 slides · Apr 7, 2021
 Proxy Contest (March 2021)50 slides · Mar 30, 2021
 Proxy Contest (February 2021)67 slides · Feb 2, 2021
 Merger or Acquisition (January 2021)15 slides · Jan 4, 2021
 Investor Day (May 2019)52 slides · May 6, 2019