MMA Capital — Municipal Mortgage & Equity — Q1 2005 Earnings Presentation
20 slides from MMA Capital's earnings presentation, May 11, 2005
Slide 1: Supplemental Financial Information First Quarter 2005
Supplemental Financial Information First Quarter 2005
Slide 2: Table of Contents
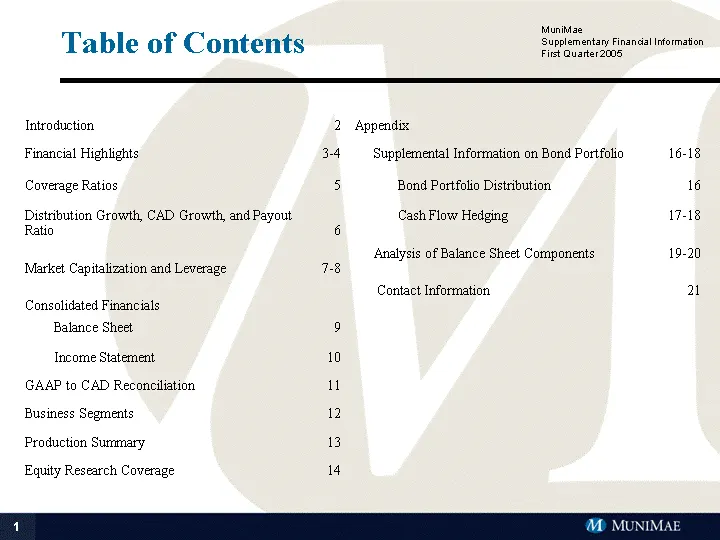
Table of Contents Introduction 2 Appendix Financial Highlights 3-4 Supplemental Information on Bond Portfolio 16-18 Coverage Ratios 5 Bond Portfolio Distribution 16 Distribution Growth, CAD Growth, and Payout Ratio 6 Cash Flow Hedging 17-18 Market Capitalization and Leverage 7-8 Analysis of Balance
Slide 3: Introduction
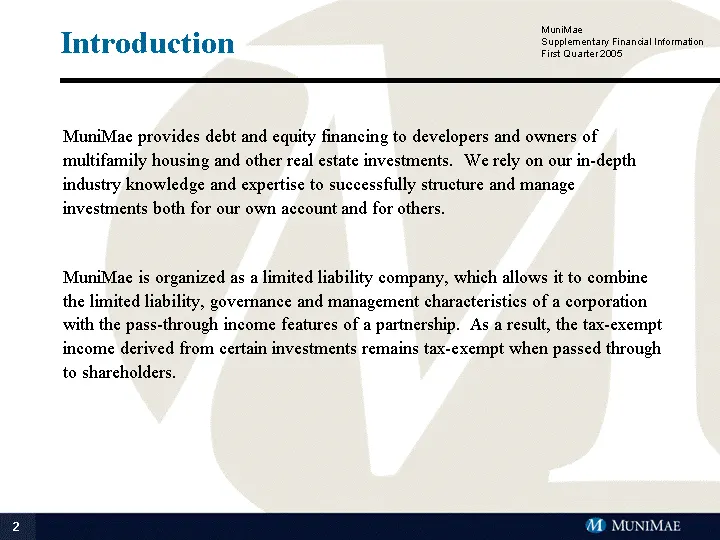
Introduction MuniMae provides debt and equity financing to developers and owners of multifamily housing and other real estate investments. We rely on our in-depth industry knowledge and expertise to successfully structure and manage investments both for our own account and for others. MuniMae is org
Slide 4: Financial Highlights
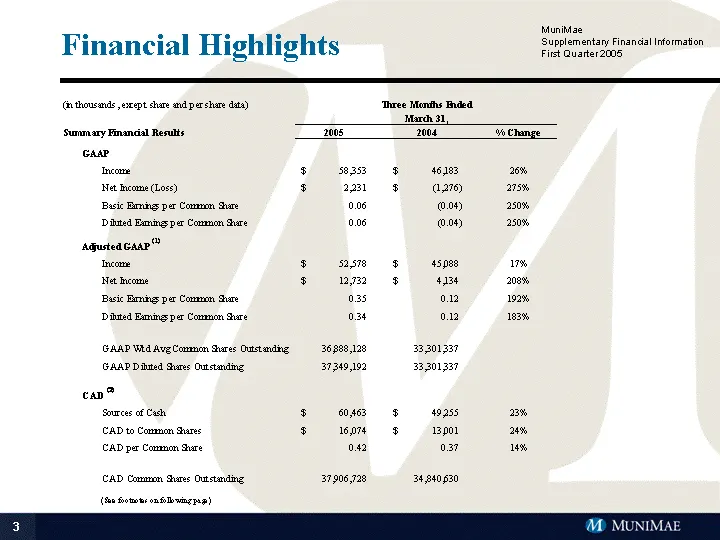
Financial Highlights (See footnotes on following page)
Slide 5: Financial Highlights Notes
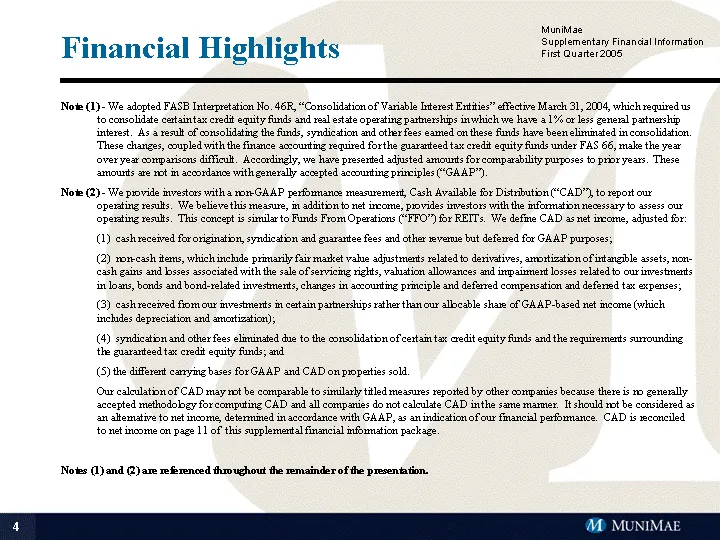
Financial Highlights Note (1) - We adopted FASB Interpretation No. 46R, "Consolidation of Variable Interest Entities" effective March 31, 2004, which required us to consolidate certain tax credit equity funds and real estate operating partnerships in which we have a 1% or less general partnership in
Slide 6: Coverage Ratios
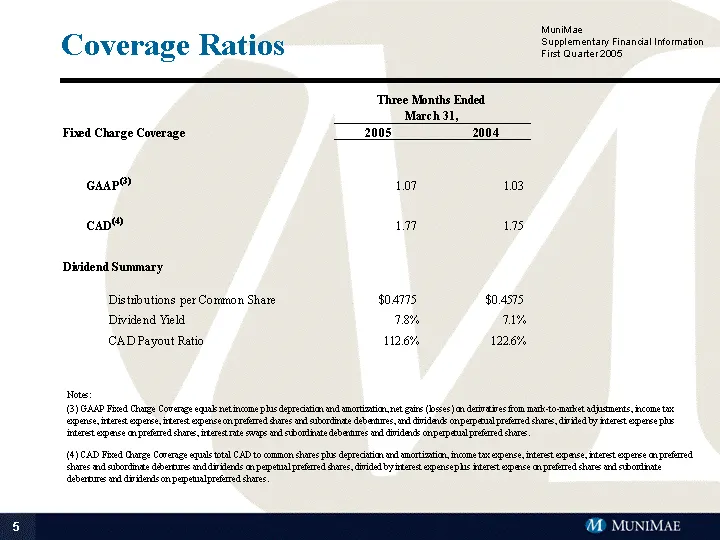
Coverage Ratios Notes: (3) GAAP Fixed Charge Coverage equals net income plus depreciation and amortization, net gains (losses) on derivatives from mark-to-market adjustments, income tax expense, interest expense, interest expense on preferred shares and subordinate debentures, and dividends on perpe
Slide 7: Distribution Growth, CAD Growth, and Payout Ratio
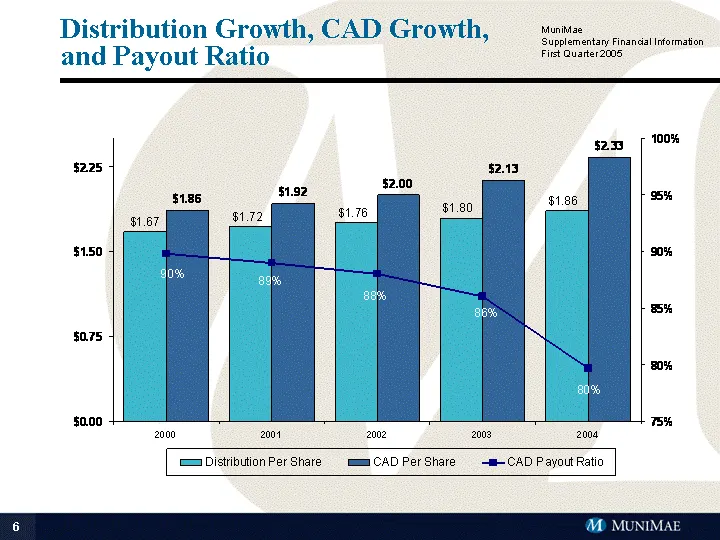
Distribution Growth, CAD Growth, and Payout Ratio * analyst consensus for 2004 CAD. Distribution Per Share Gross Margin % CAD Payout Ratio CAD Per Share 2000 1.6725 0.558 0.898 1.86 2001 1.715 0.566 0.89 1.92 2002 1.755 0.56 0.88 2 2003 1.795 0.554 0.86 2.13 2004 1.86 0.797 2.33
Slide 8: Market Capitalization and Leverage
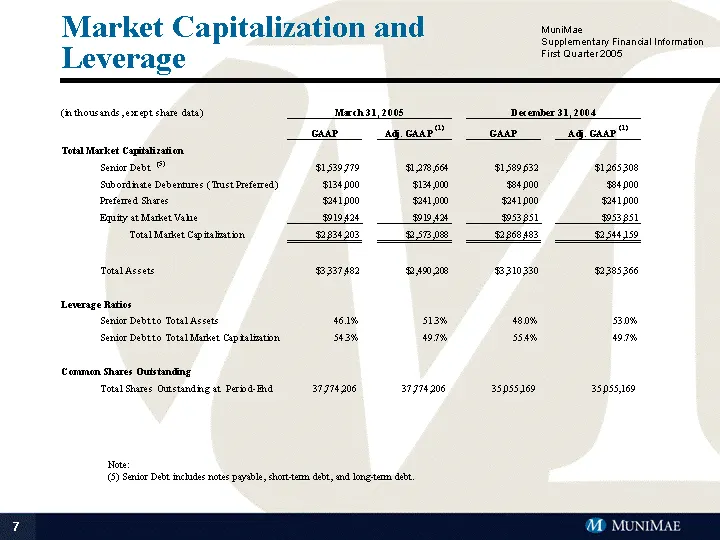
Market Capitalization and Leverage Note: (5) Senior Debt includes notes payable, short-term debt, and long-term debt. (5)
Slide 9: Market Capitalization
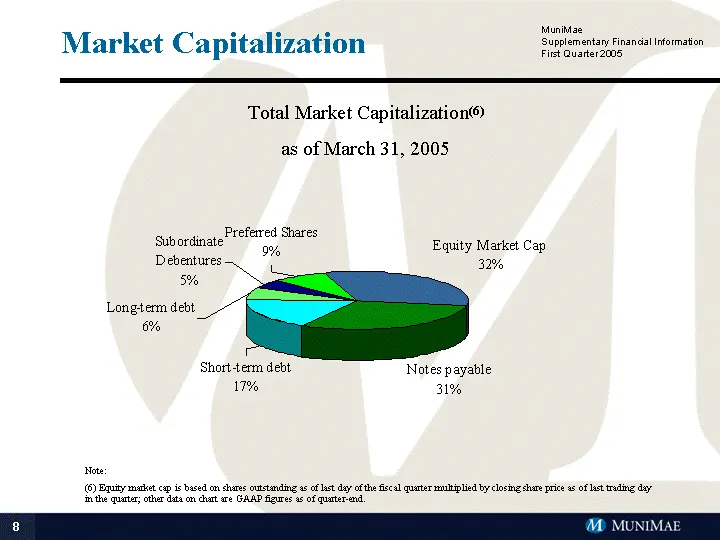
Market Capitalization Total Market Capitalization(6) as of March 31, 2005 Note: (6) Equity market cap is based on shares outstanding as of last day of the fiscal quarter multiplied by closing share price as of last trading day in the quarter; other data on chart are GAAP figures as of quarter-end.
Slide 10: Consolidated Balance Sheets
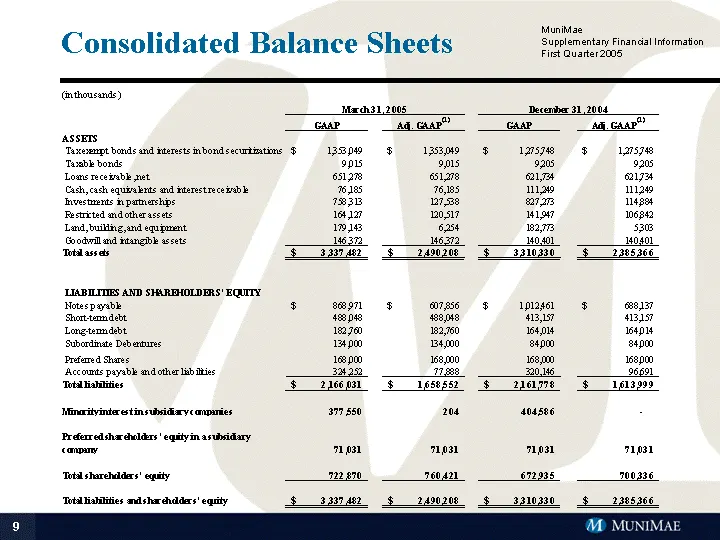
Consolidated Balance Sheets
Slide 11: Net Income to CAD Reconciliation
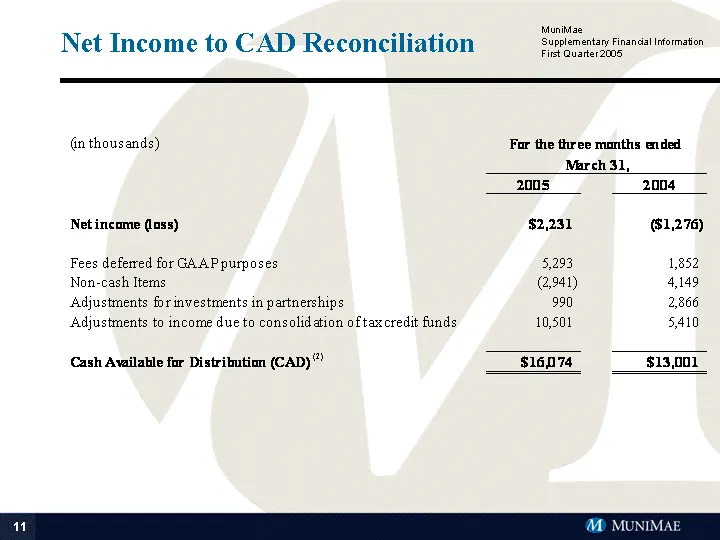
Net Income to CAD Reconciliation (2)
Slide 12: Business Segments
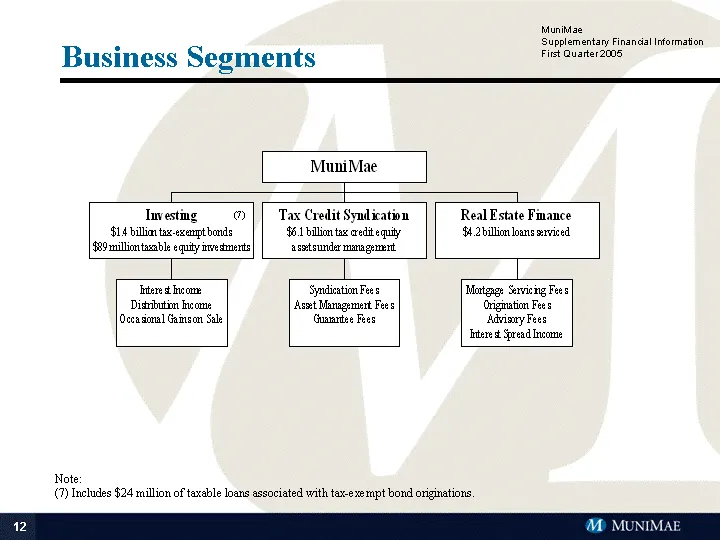
Business Segments Note: (7) Includes $24 million of taxable loans associated with tax-exempt bond originations. (7)
Slide 13: Production Summary
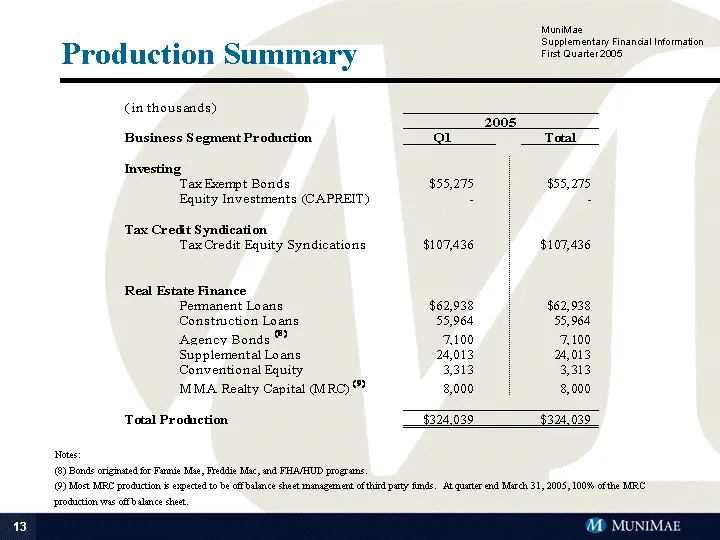
Production Summary Notes: (8) Bonds originated for Fannie Mae, Freddie Mac, and FHA/HUD programs. (9) Most MRC production is expected to be off balance sheet management of third party funds. At quarter end March 31, 2005, 100% of the MRC production was off balance sheet.
Slide 14: Equity Research Coverage
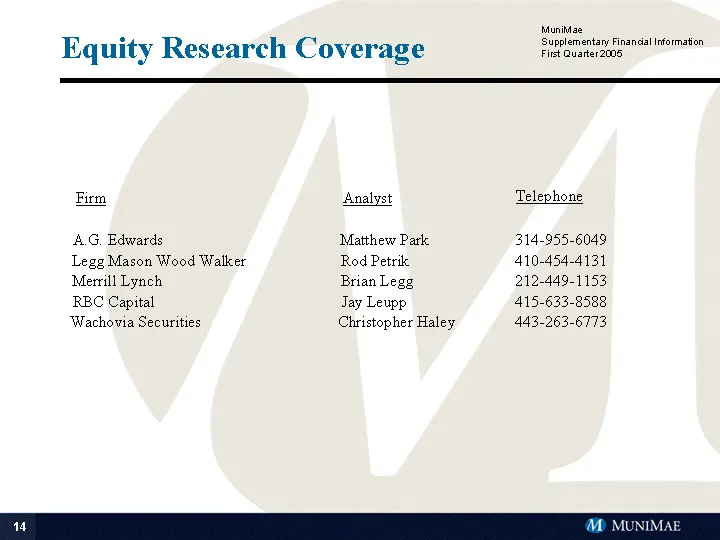
Equity Research Coverage Firm Analyst Telephone A.G. Edwards Matthew Park 314-955-6049 Legg Mason Wood Walker Rod Petrik 410-454-4131 Merrill Lynch Brian Legg 212-449-1153 RBC Capital Jay Leupp 415-633-8588 Wachovia Securities Christopher Haley 443-263-6773
Slide 15: Appendix
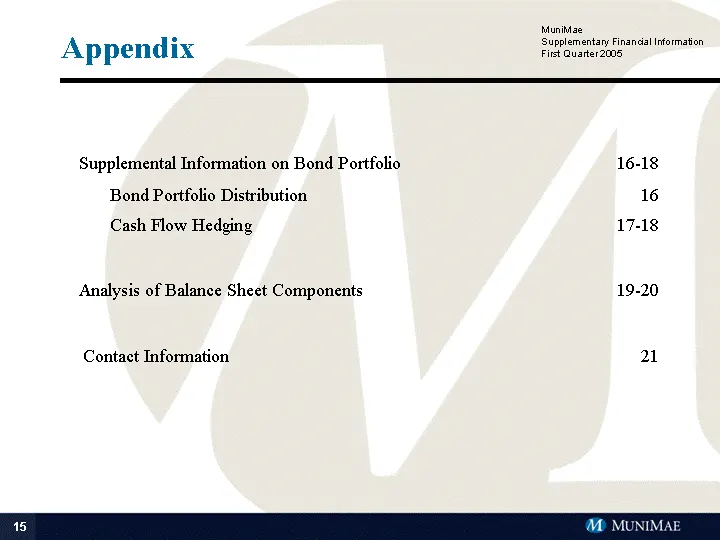
Appendix Supplemental Information on Bond Portfolio 16-18 Bond Portfolio Distribution 16 Cash Flow Hedging 17-18 Analysis of Balance Sheet Components 19-20 Contact Information 21
Slide 16: Bond Portfolio Distribution
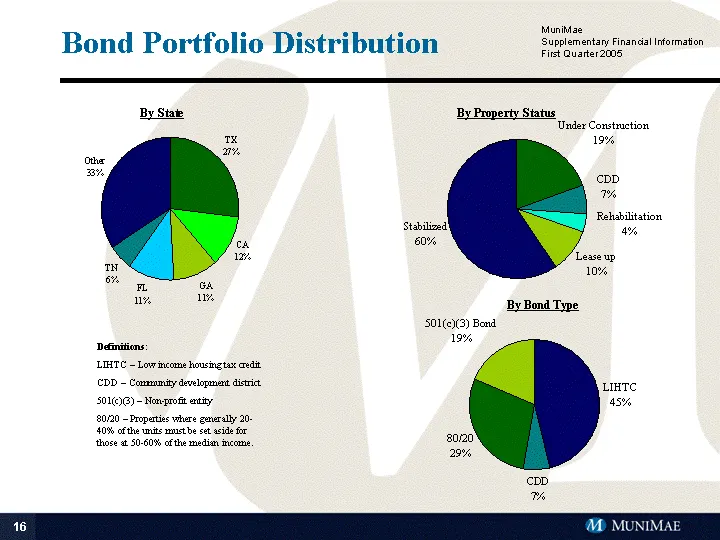
Bond Portfolio Distribution Definitions: LIHTC - Low income housing tax credit CDD - Community development district 501(c)(3) - Non-profit entity 80/20 - Properties where generally 20- 40% of the units must be set aside for those at 50-60% of the median income. By State By Property Status
Slide 17: Cash Flow Hedging
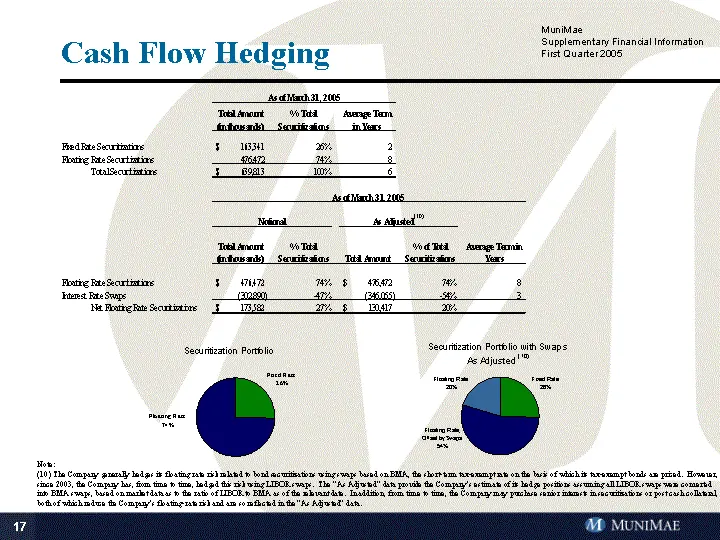
Cash Flow Hedging MuniMae Supplementary Financial Information First Quarter 2005 - -------------------------------------------------------------------------------- As of March 31, 2005 Total Amount % Total Average Term (in thousands) Securitizations in Years Fixed Rate Securitizations $ 163,341 26 %
Slide 18: Cash Flow Hedging (Weighted Average Swap Rate of 3.17%)
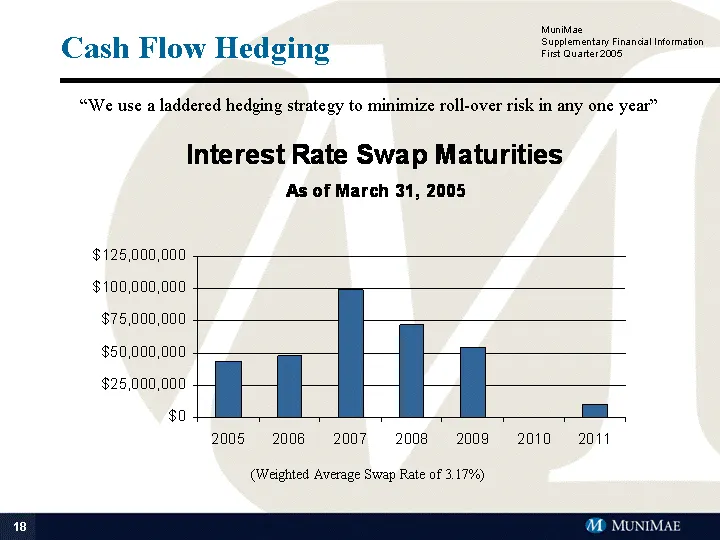
Cash Flow Hedging (Weighted Average Swap Rate of 3.17%) "We use a laddered hedging strategy to minimize roll-over risk in any one year" Analysis of GAAP Balance Sheet Components MuniMae Supplementary Financial Information First Quarter 2005 Consolidated Bond CAPREIT Preferred Balance Sheet Off Balan
Slide 19: Analysis of GAAP Balance Sheet Components
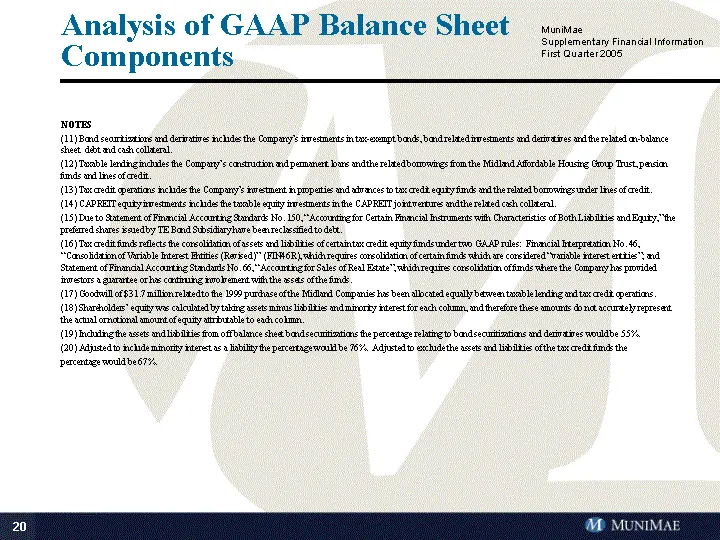
Analysis of GAAP Balance Sheet Components MuniMae Supplementary Financial Information First Quarter 2005 - -------------------------------------------------------------------------------- NOTES (11) Bond securitizations and derivatives includes the Company's investments in tax-exempt bonds, bond rel
Slide 20: Contact Information
Contact Information MuniMae 621 East Pratt Street, Suite 300 Baltimore, Maryland 21202-3140 Phone: 877-461-4895 Fax: 410-727-5387 Investor Contacts: Mike Rulf Principal, Investor Relations 443-263-2921 Angela Richardson Investor Relations Representative 888-788-3863
Source: SEC EDGAR · 8-K/A filed May 11, 2005
More decks from MMA Capital Holdings Inc
 Q1 2021 Earnings Presentation20 slides · May 18, 2021
 Investor Presentation (April 2021)21 slides · Apr 5, 2021
 Q3 2020 Earnings Presentation20 slides · Nov 10, 2020
 Q2 2020 Earnings Presentation20 slides · Aug 12, 2020
 Q1 2020 Earnings Presentation20 slides · May 11, 2020
 Investor Presentation (March 2020)20 slides · Mar 17, 2020