Sinclair, Inc. · NASDAQ:SBGI
Sinclair — Q3 2026 Earnings Presentation
16 slides from Sinclair's earnings presentation, Nov 4, 2026
Slide 1: SINCLAIR 3Q26 Earnings Presentation
SINCLAIR 3Q26 Earnings Presentation November 4, 2026
Slide 2: Disclaimer
Disclaimer Forward-Looking Statements & Non-GAAP Financial Measures The matters discussed in this presentation, particularly those in the section labeled “Guidance," include forward-looking statements regarding, among other things, future operating results. When used in this presentation, the words
Slide 3: 3Q26 Highlights
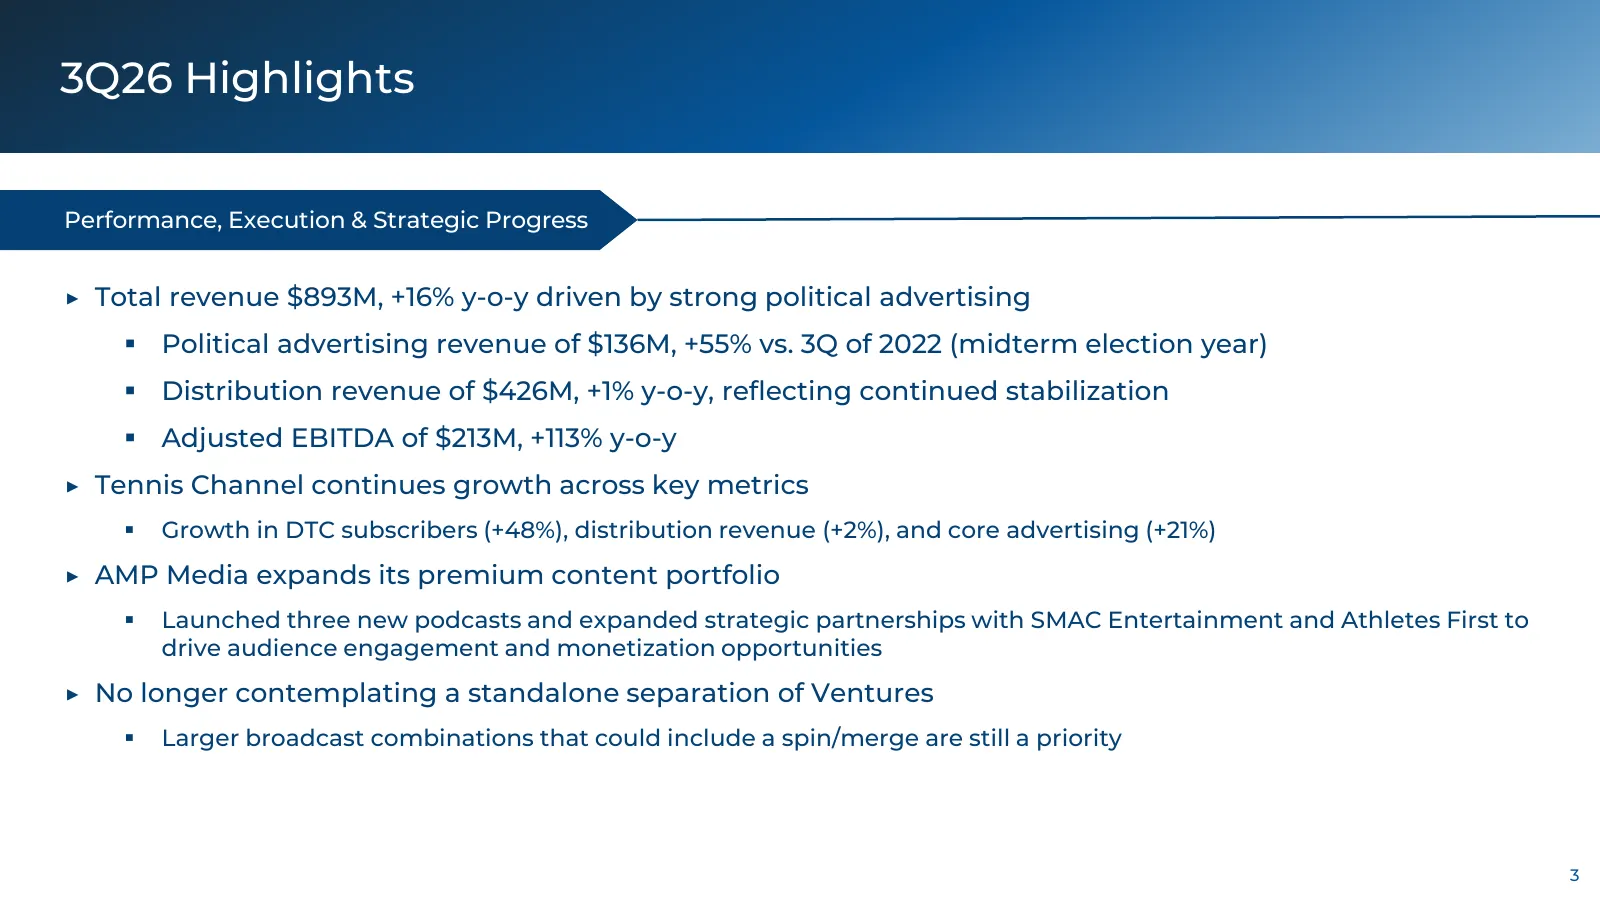
3Q26 Highlights Performance, Execution & Strategic Progress ▶ Total revenue $893M, +16% y-o-y driven by strong political advertising Political advertising revenue of $136M, +55% vs. 3Q of 2022 (midterm election year) Distribution revenue of $426M, +1% y-o-y, reflecting continued stabilization
Slide 4: 2026 Midterms: Political Revenue Update
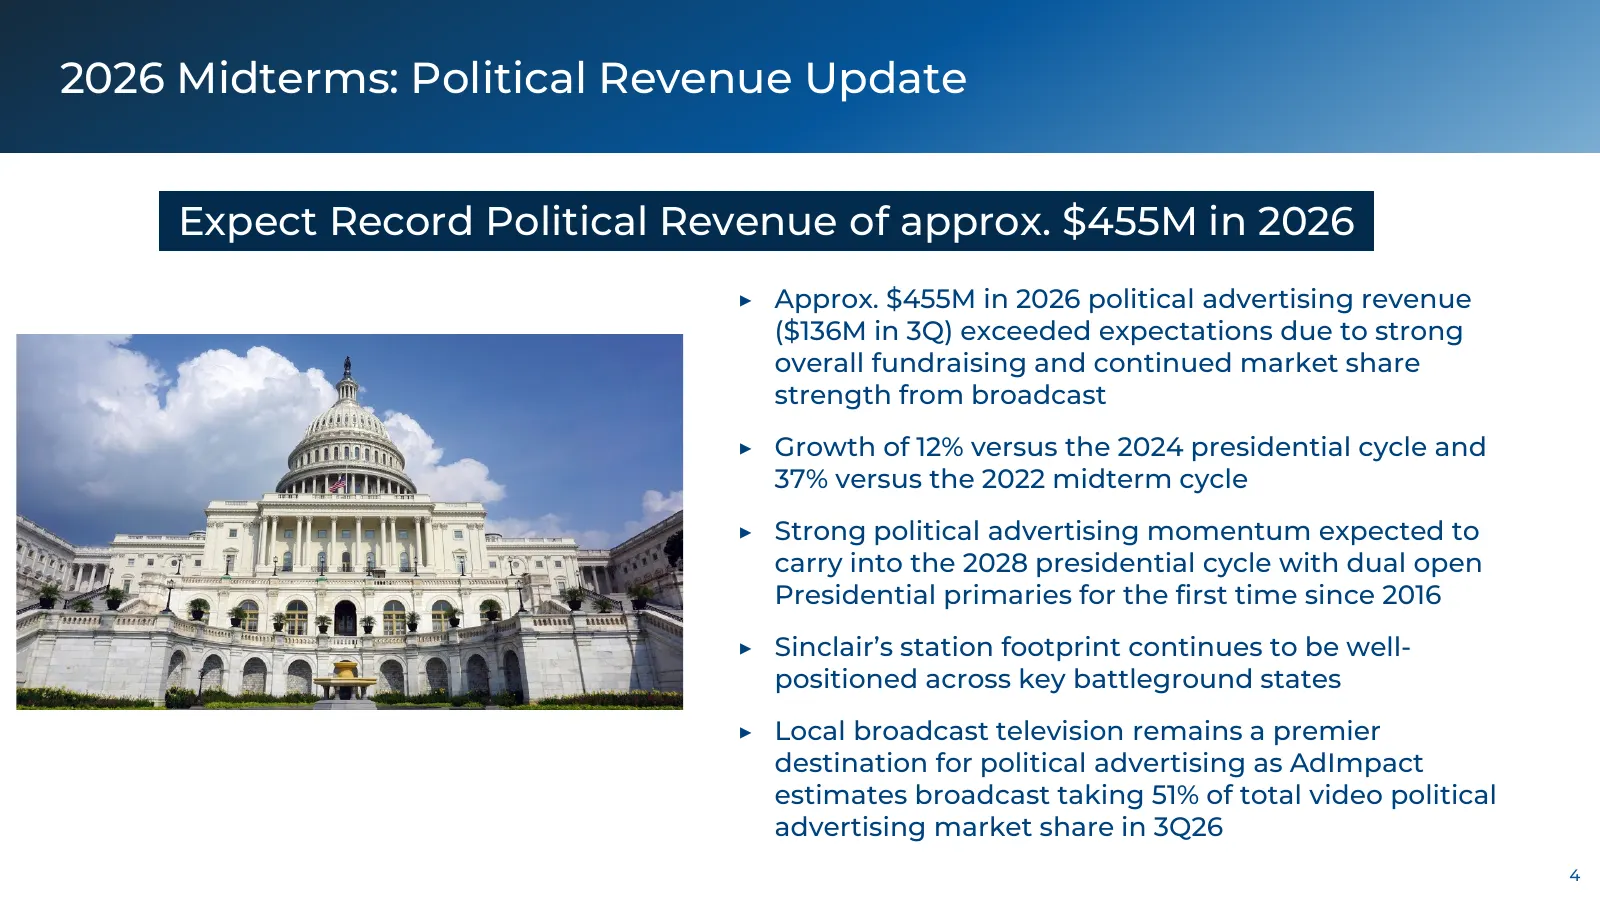
2026 Midterms: Political Revenue Update Expect Record Political Revenue of approx. $455M in 2026 ▶ Approx. $455M in 2026 political advertising revenue ($136M in 3Q) exceeded expectations due to strong overall fundraising and continued market share strength from broadcast ▶ Growth of 12% versus the 2
Slide 5: 3Q26: Financial Results
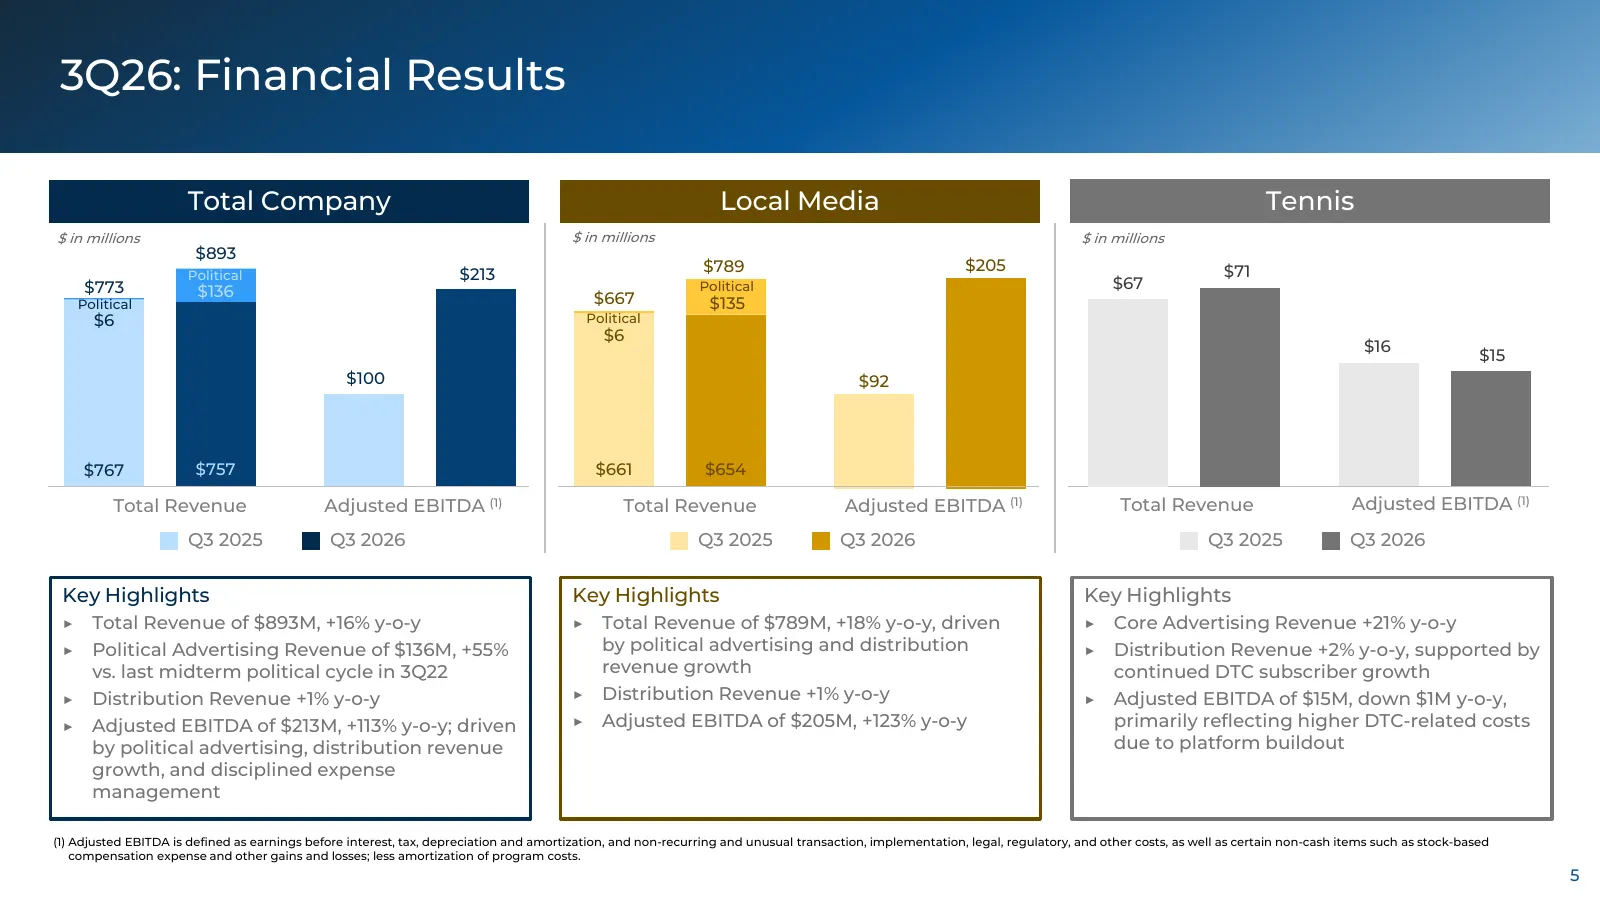
3Q26: Financial Results Total Company Local Media Tennis $ in millions $ in millions $ in millions $893 $789 $205 $71 Political $213 $773 Political $67 $136 $667 Political $135 $6 Political $6 $16 $15 $100 $92 $767 $757 $661 $654 Total Revenue Adjusted EBITDA (1) Total Revenue Adjusted EBITDA (1) To
Slide 6: Debt Maturity Schedule
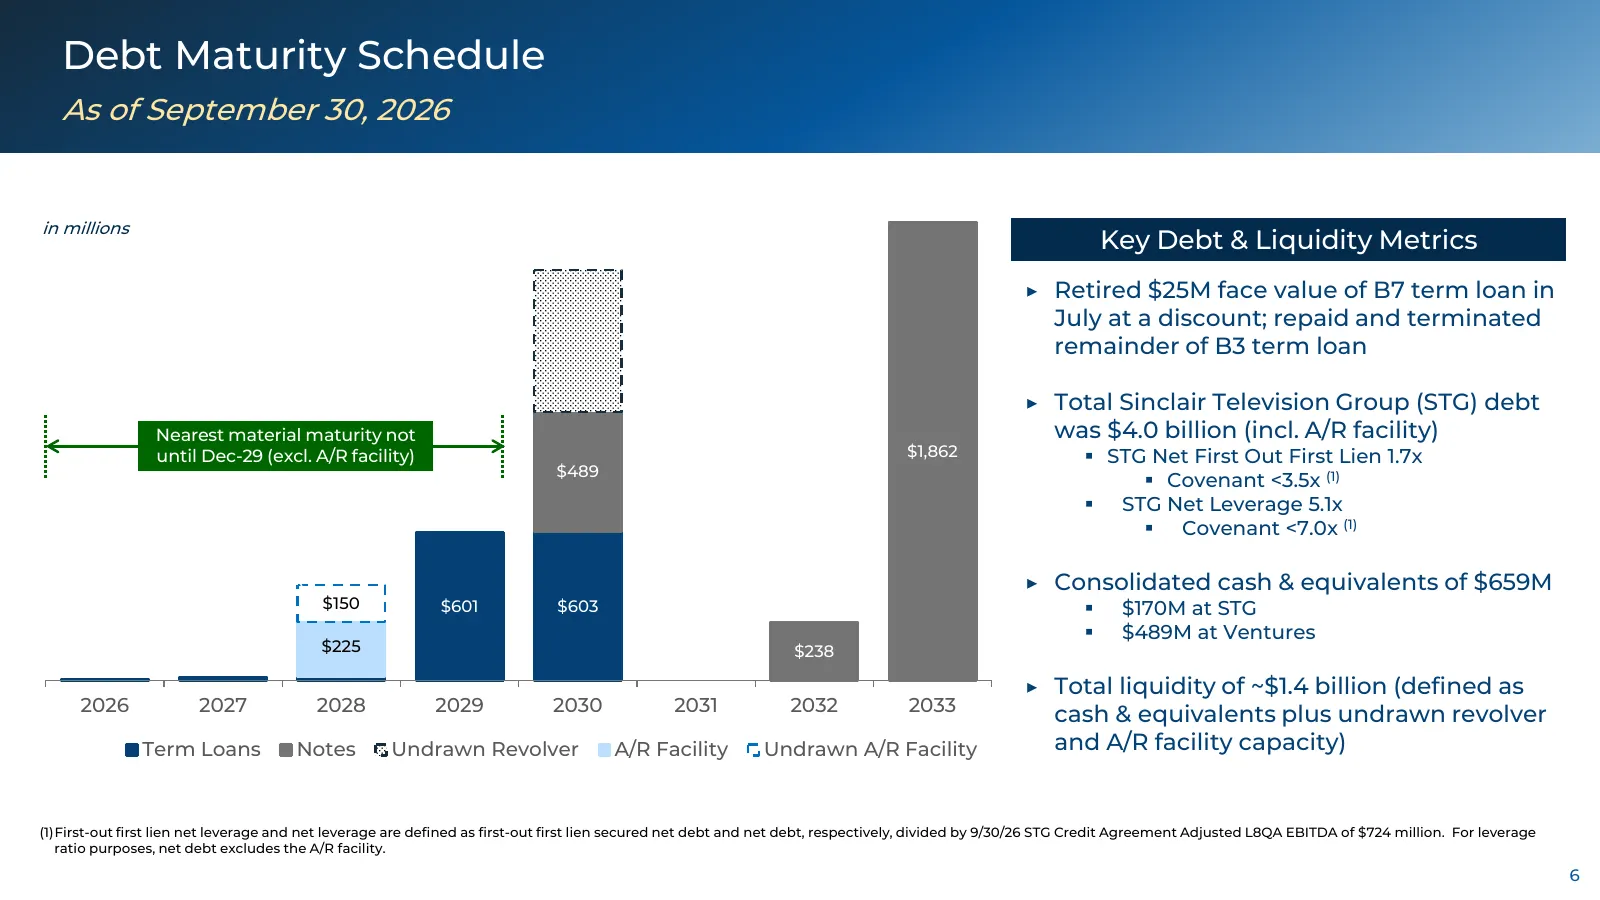
Debt Maturity Schedule As of September 30, 2026 in millions Key Debt & Liquidity Metrics 0 0 ▶ Retired $25M face value of B7 term loan in July at a discount; repaid and terminated remainder of B3 term loan ▶ Total Sinclair Television Group (STG) debt Nearest material maturity not was $4.0 billion (i
Slide 7: 2026: Updated Full Year Financial Guidance
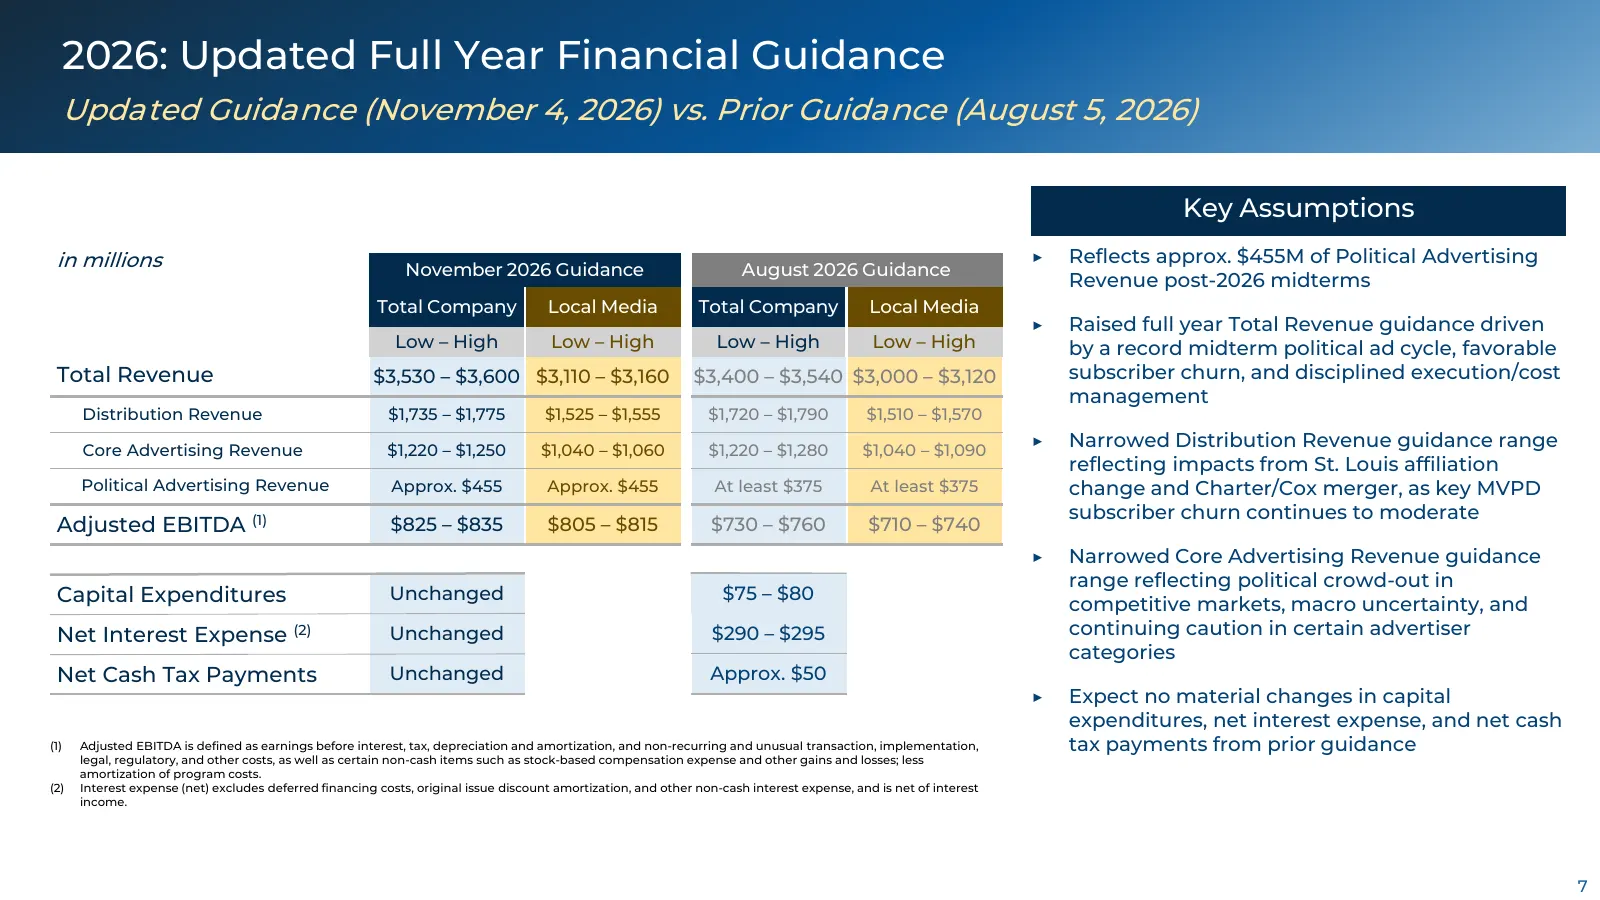
2026: Updated Full Year Financial Guidance Updated Guidance (November 4, 2026) vs. Prior Guidance (August 5, 2026) Key Assumptions in millions ▶ Reflects approx. $455M of Political Advertising November 2026 Guidance August 2026 Guidance Revenue post-2026 midterms Total Company Local Media Total Comp

Slide 8: Q&A
Q&A

Slide 9: Appendix
Appendix
Slide 10: Select Consolidated Financial Results
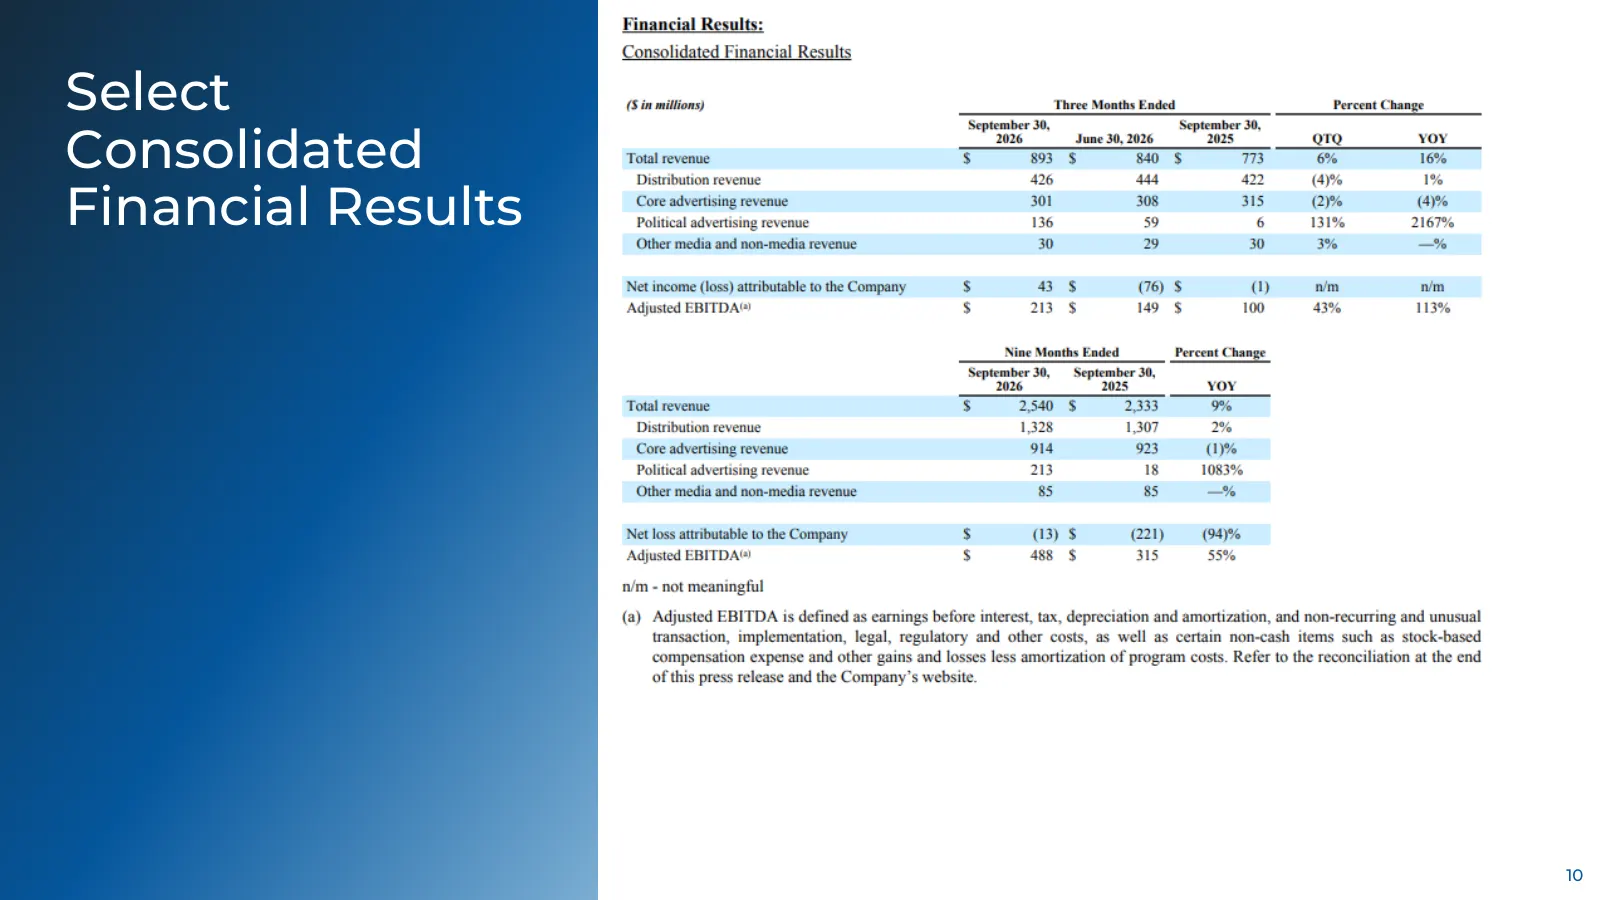
Select Consolidated Financial Results 10
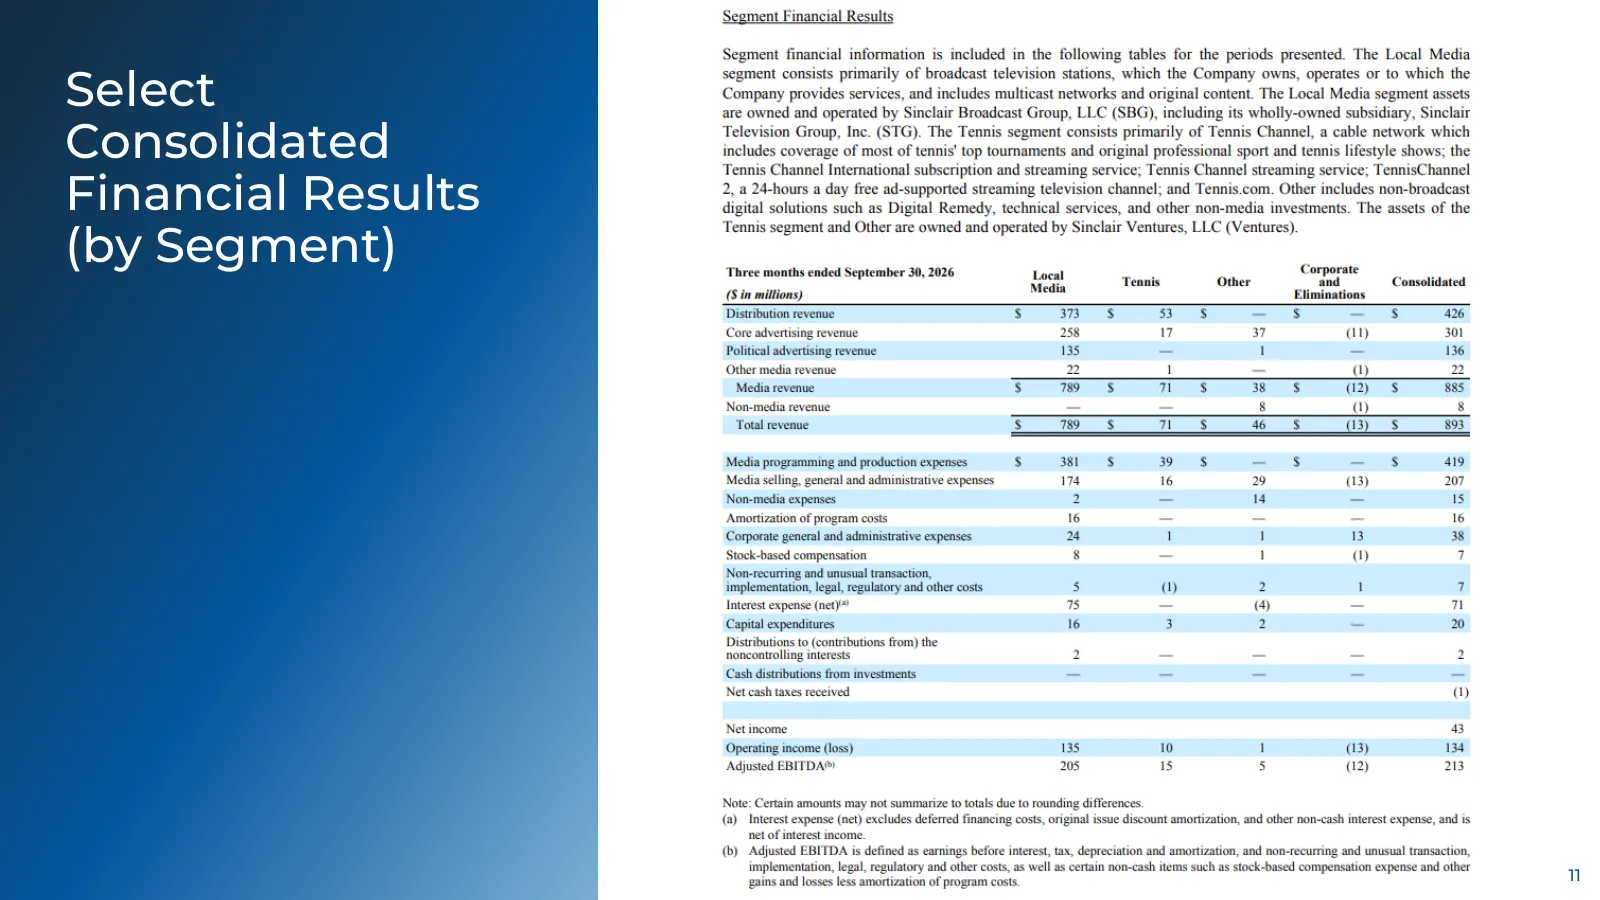
Slide 11: Select Consolidated Financial Results (by Segment)
Select Consolidated Financial Results (by Segment) 11
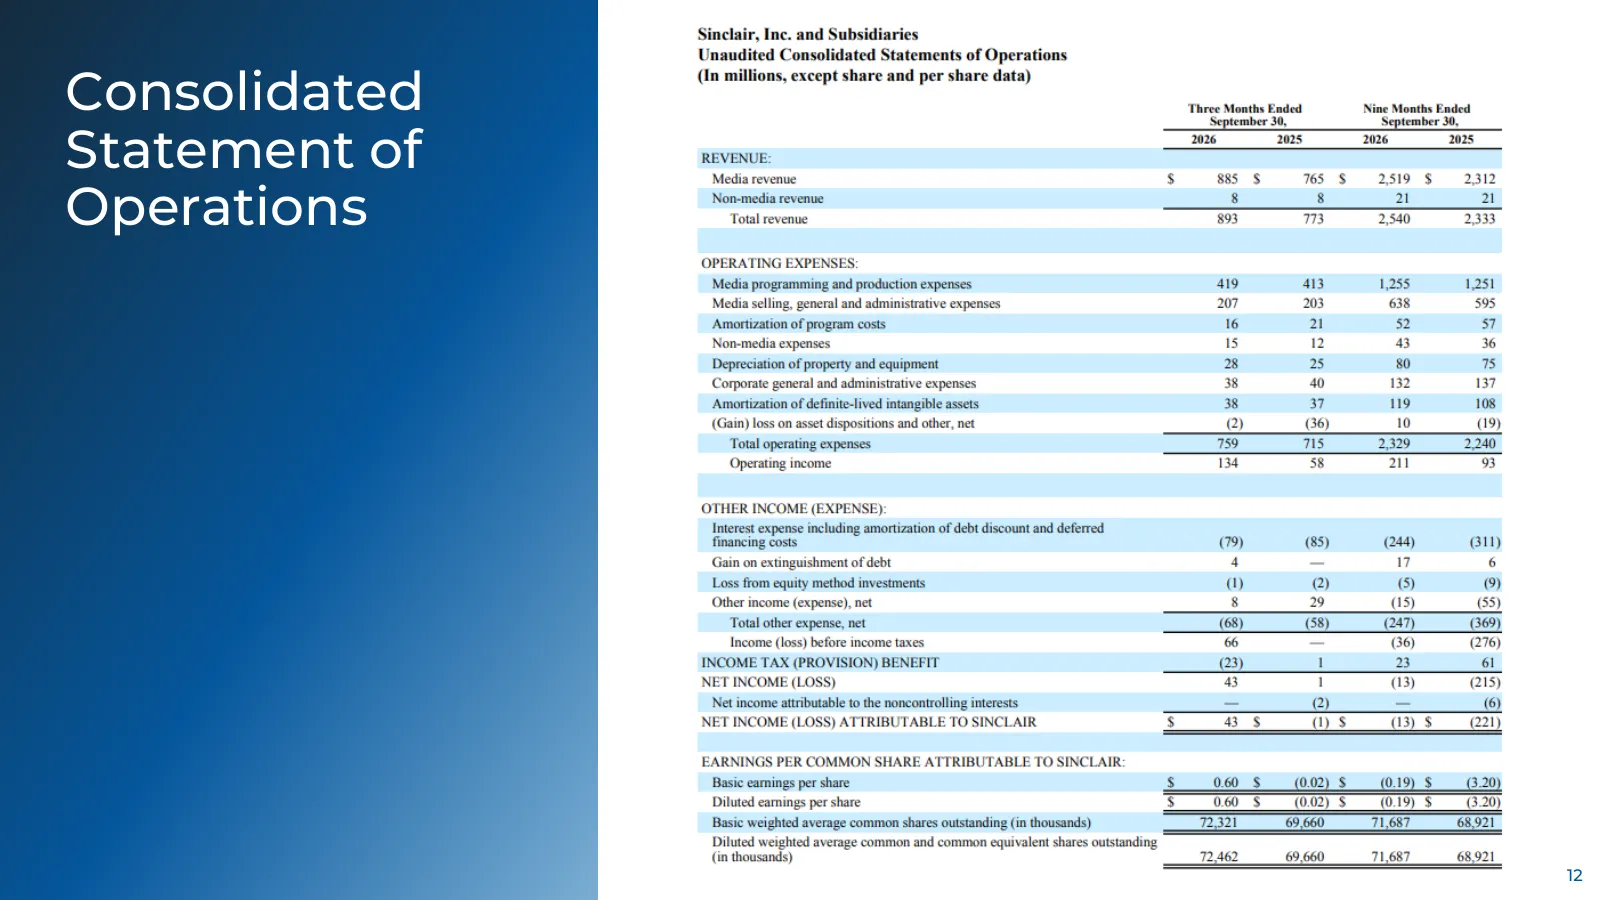
Slide 12: Consolidated Statement of Operations
Consolidated Statement of Operations 12
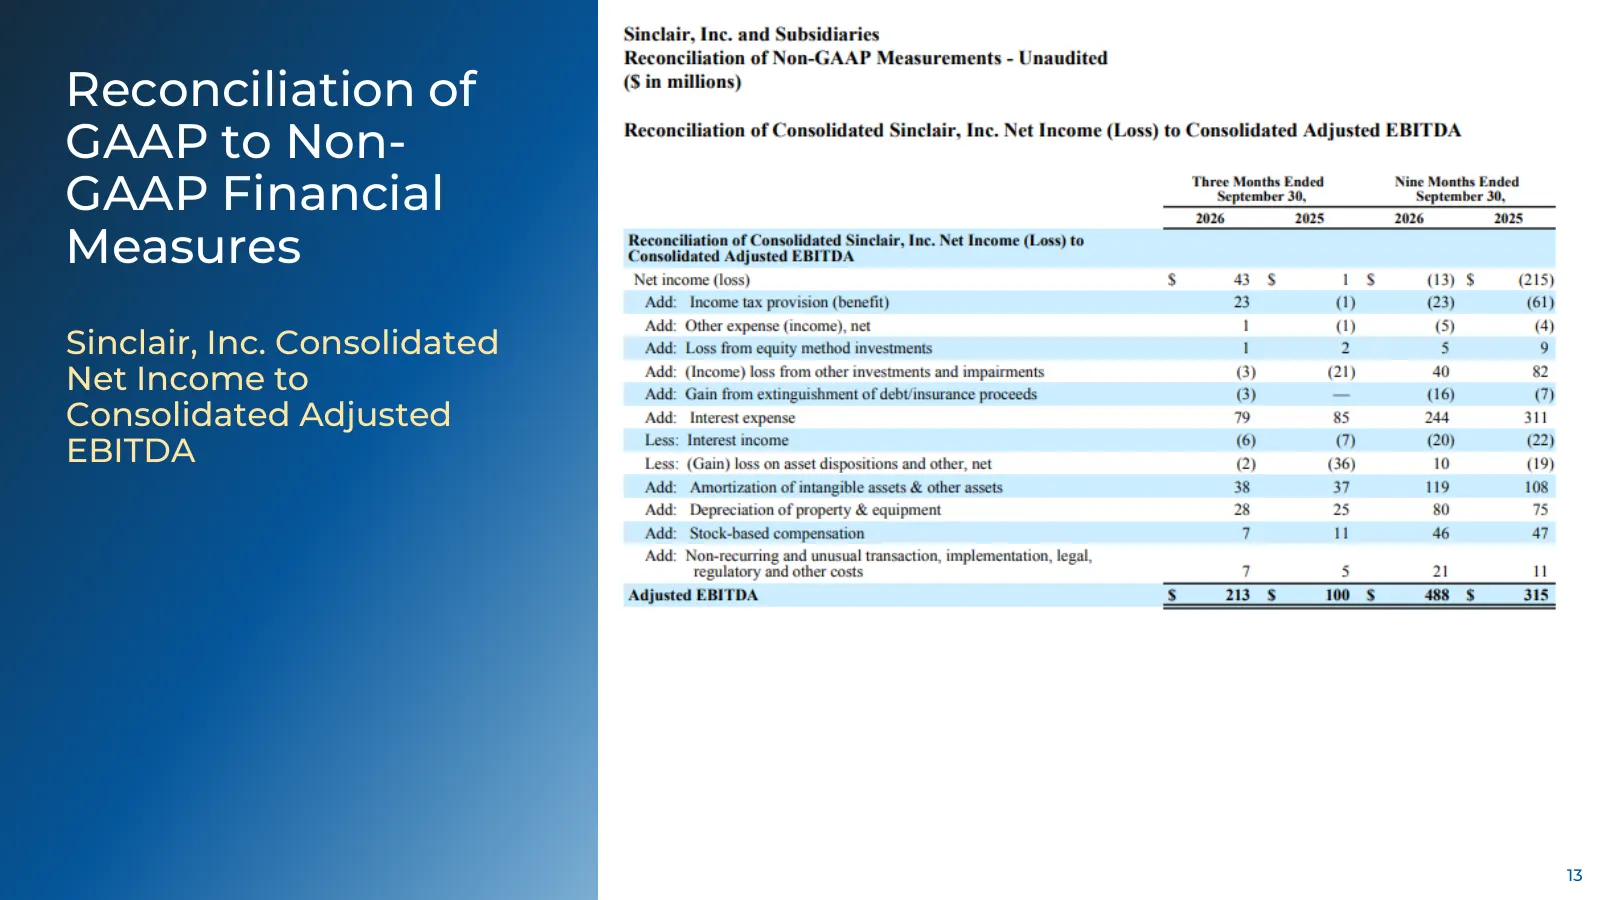
Slide 13: Reconciliation of GAAP to Non-GAAP Financial Measures
Reconciliation of GAAP to Non- GAAP Financial Measures Sinclair, Inc. Consolidated Net Income to Consolidated Adjusted EBITDA 13
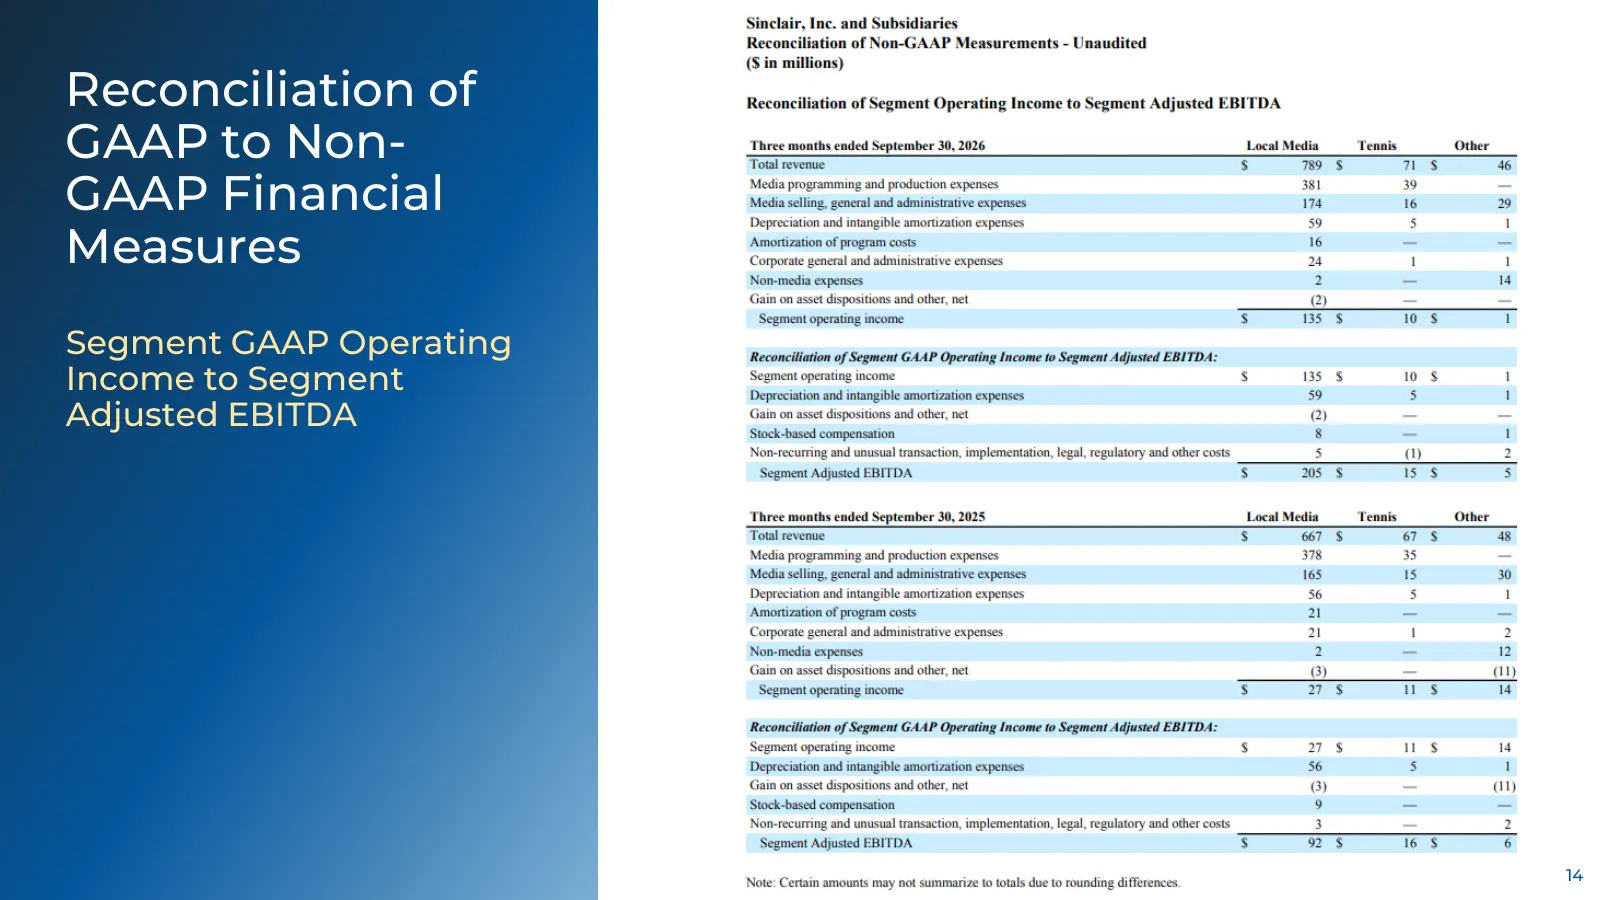
Slide 14: Reconciliation of GAAP to Non-GAAP Financial Measures
Reconciliation of GAAP to Non- GAAP Financial Measures Segment GAAP Operating Income to Segment Adjusted EBITDA 14
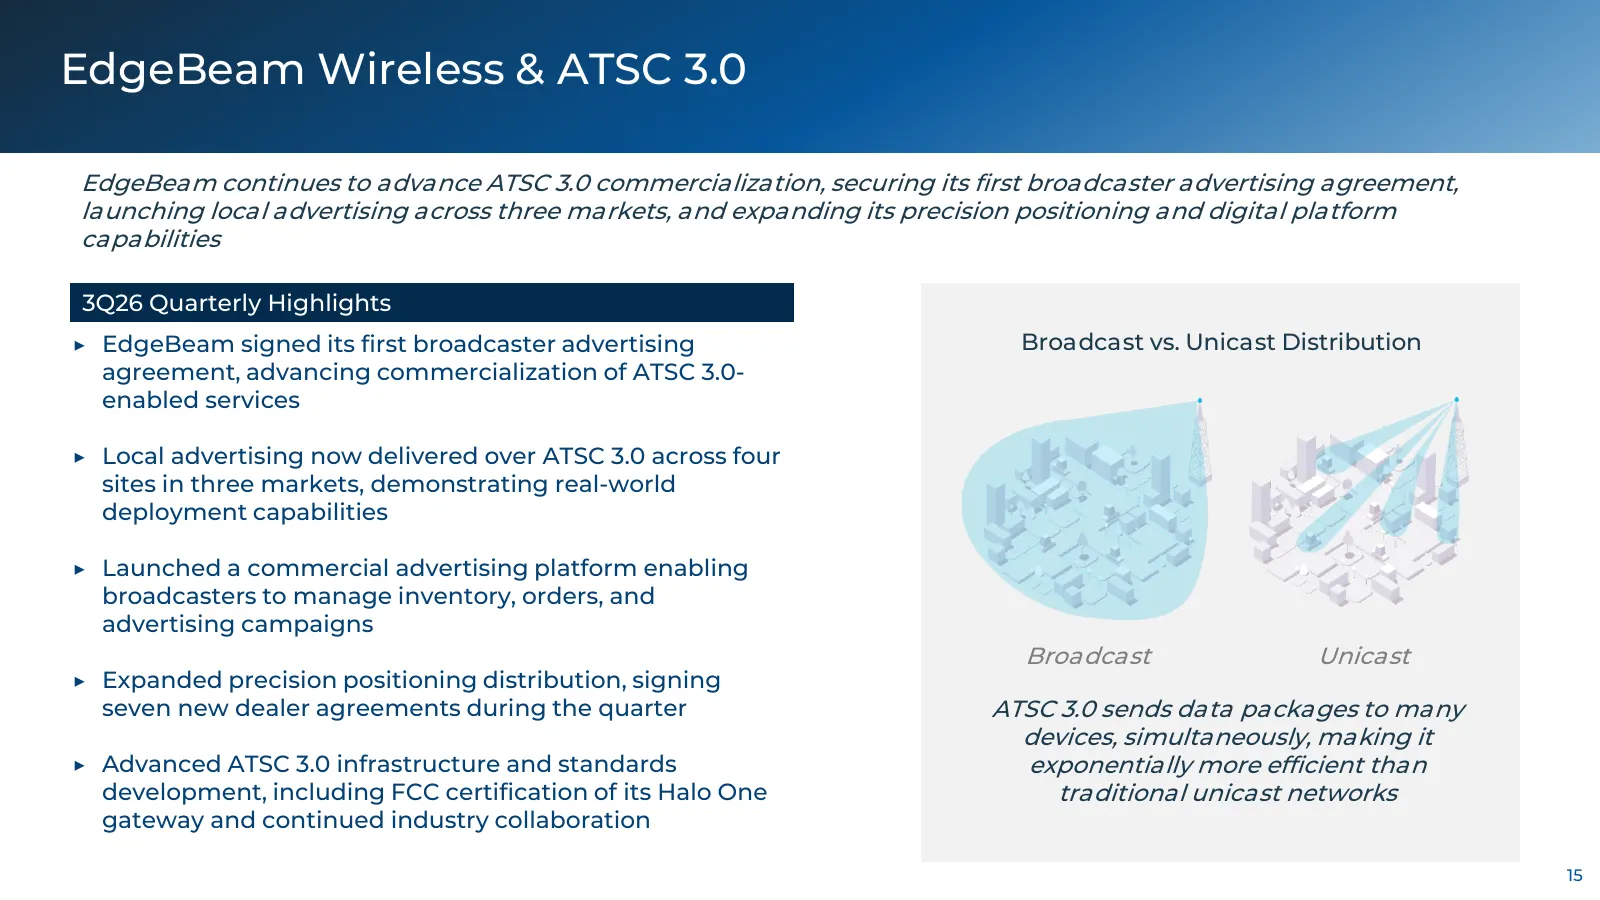
Slide 15: EdgeBeam Wireless & ATSC 3.0
EdgeBeam Wireless & ATSC 3.0 EdgeBeam continues to advance ATSC 3.0 commercialization, securing its first broadcaster advertising agreement, launching local advertising across three markets, and expanding its precision positioning and digital platform capabilities 3Q26 Quarterly Highlights ▶ EdgeBea
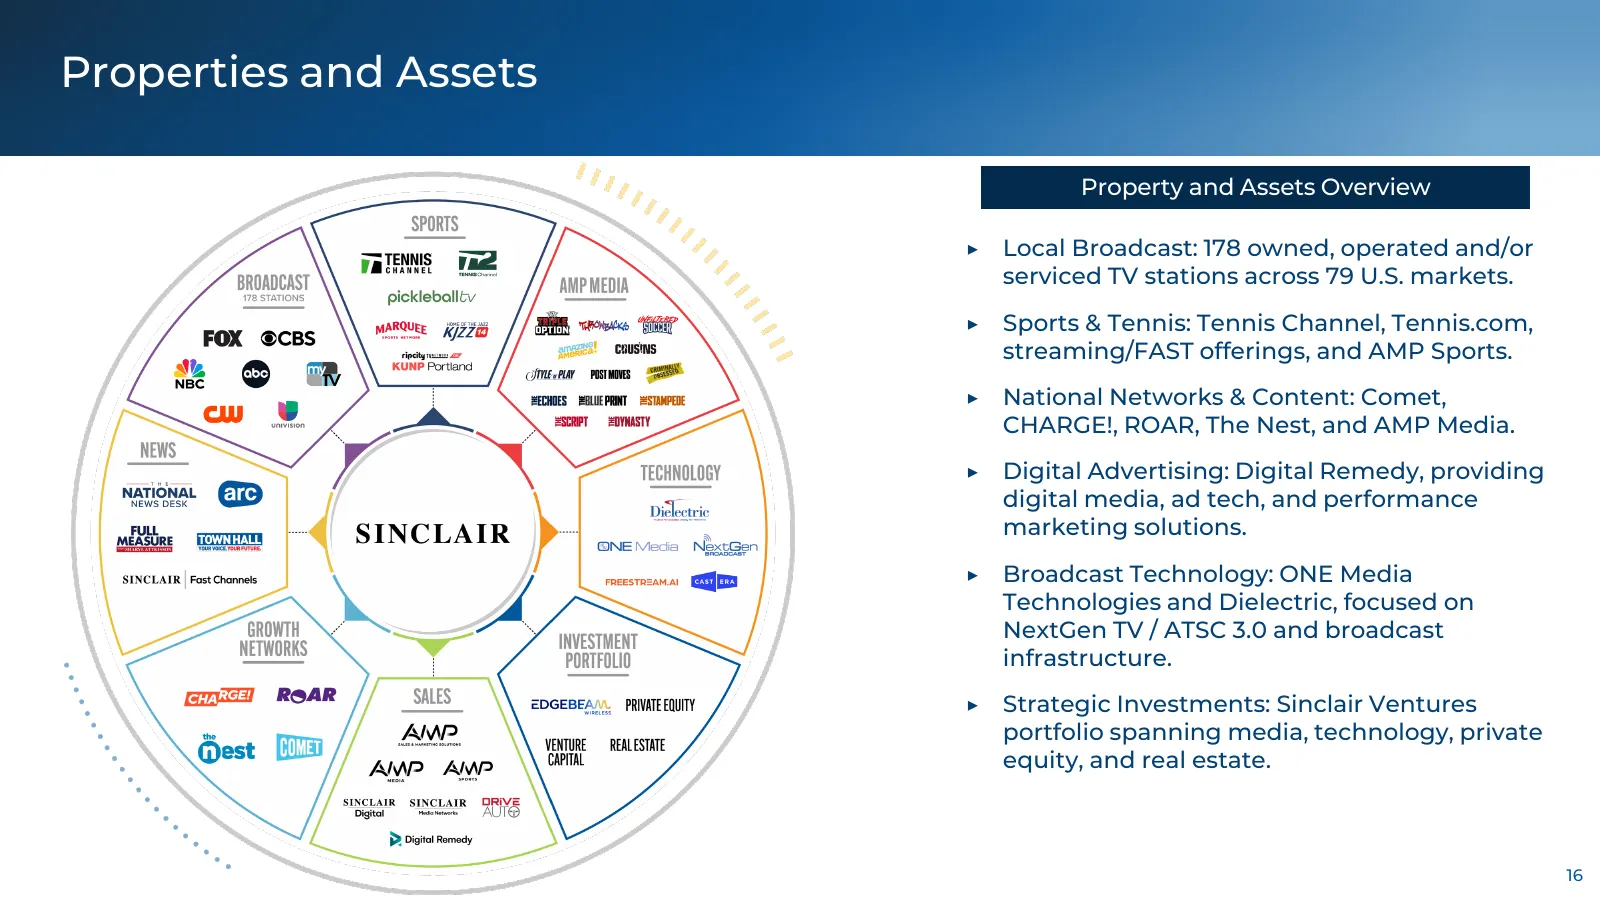
Slide 16: Properties and Assets
Properties and Assets Property and Assets Overview ▶ Local Broadcast: 178 owned, operated and/or serviced TV stations across 79 U.S. markets. ▶ Sports & Tennis: Tennis Channel, Tennis.com, streaming/FAST offerings, and AMP Sports. ▶ National Networks & Content: Comet, CHARGE!, ROAR, The Nest, and AM
Source: 6ix earnings call
More decks from Sinclair, Inc.
 Q2 2026 Earnings Presentation19 slides · Aug 5, 2026
 FY2025 Earnings Presentation132 slides · Apr 30, 2026
 Q4 2025 Earnings Presentation21 slides · Feb 25, 2026
 Q3 2025 Earnings Presentation13 slides · Nov 5, 2025
 Q2 2025 Earnings Presentation17 slides · Aug 6, 2025
 Q1 2025 Earnings Presentation16 slides · May 7, 2025