Diversified Energy Company · NYSE:DEC
Diversified Energy — Investor Presentation (November 2023)
45 slides from Diversified Energy's investor presentation, November 2023
Slide 1: Corporate Presentation: Right Company, Right Time
Corporate Presentation Right Company, Right Time November 2023
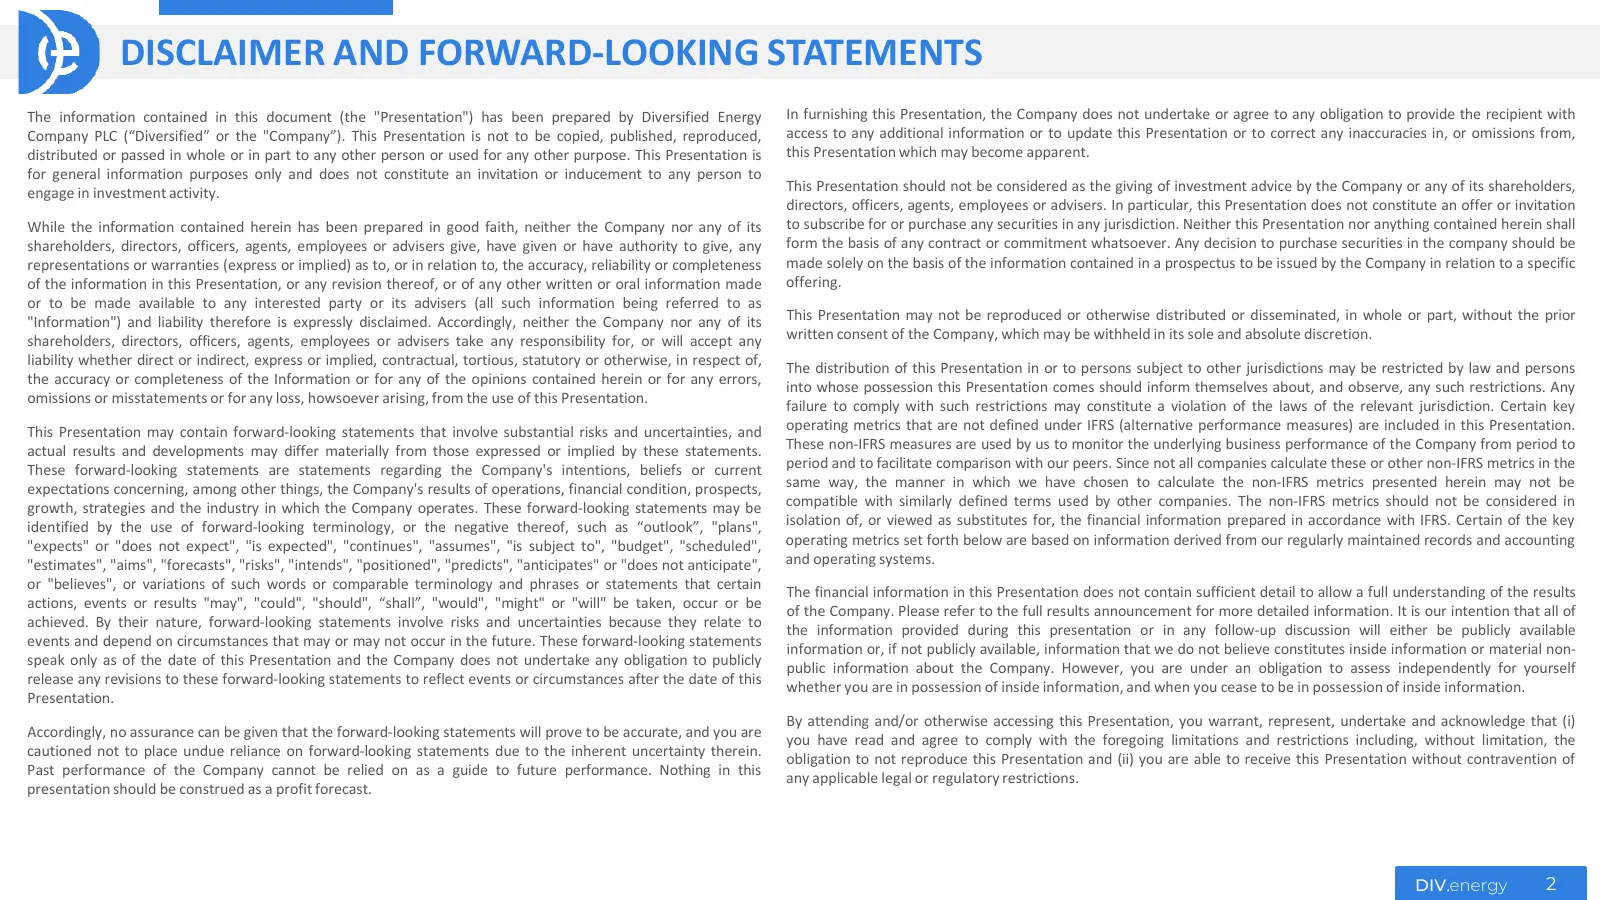
Slide 2: Disclaimer and Forward-Looking Statements
DISCLAIMER AND FORWARD-LOOKING STATEMENTS The information contained in this document (the "Presentation") has been prepared by Diversified Energy In furnishing this Presentation, the Company does not undertake or agree to any obligation to provide the recipient with Company PLC (“Diversified” or the
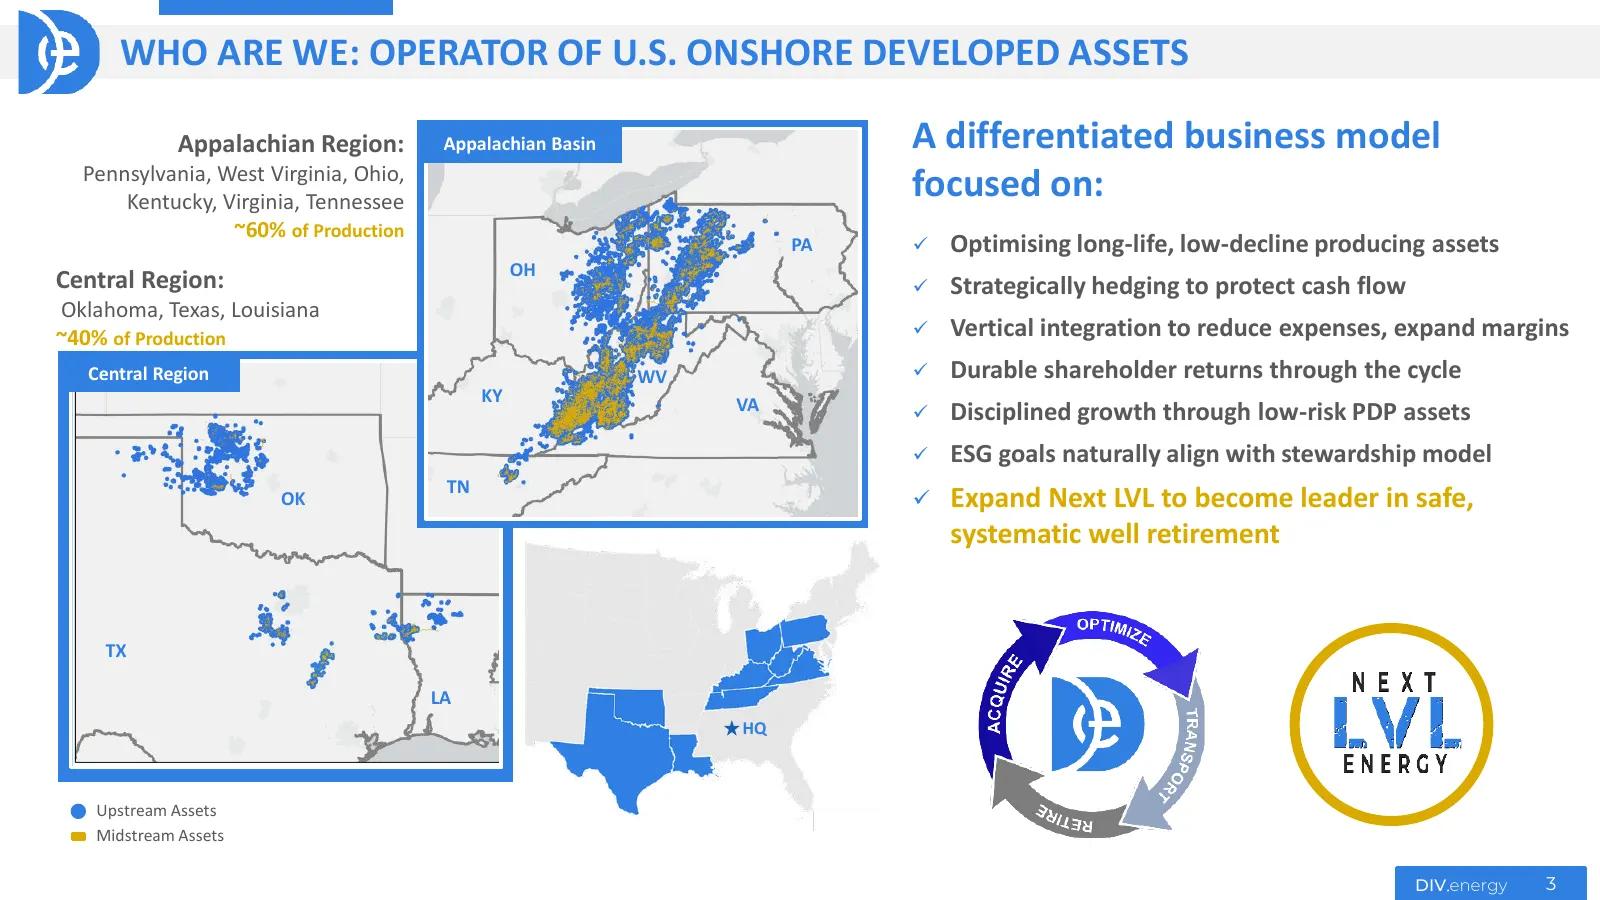
Slide 3: Who Are We: Operator of U.S. Onshore Developed Assets
WHO ARE WE: OPERATOR OF U.S. ONSHORE DEVELOPED ASSETS Appalachian Region: Appalachian Basin A differentiated business model Pennsylvania, West Virginia, Ohio, Kentucky, Virginia, Tennessee focused on: ~60% of Production PA Optimising long-life, low-decline producing assets OH Central Region: Str
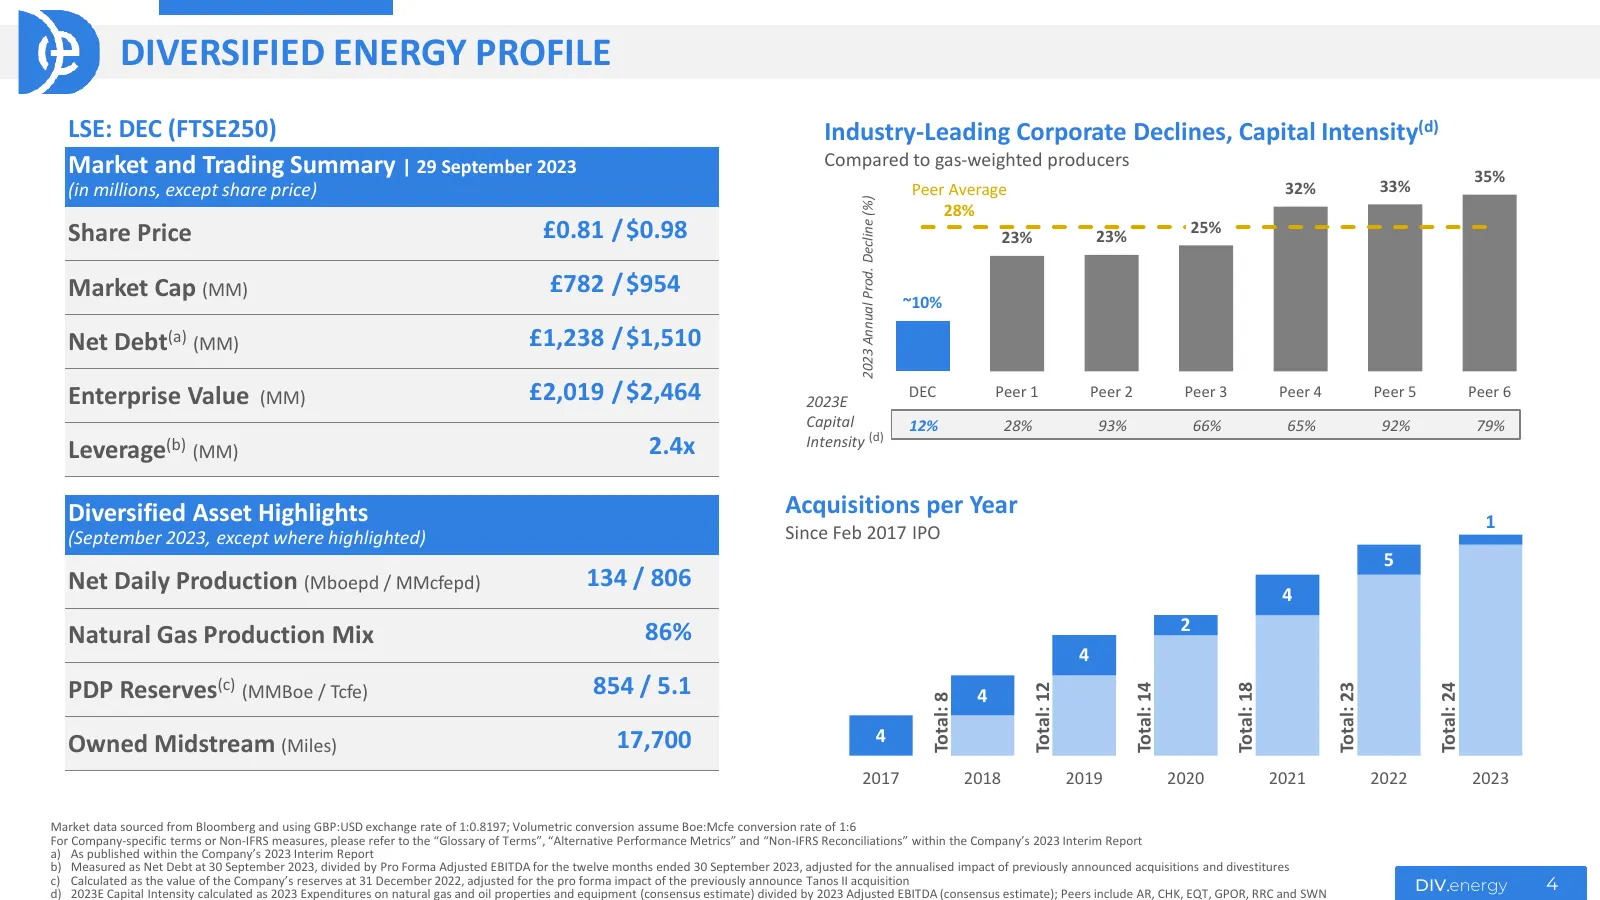
Slide 4: Diversified Energy Profile
DIVERSIFIED ENERGY PROFILE LSE: DEC (FTSE250) Industry-Leading Corporate Declines, Capital Intensity(d) Market and Trading Summary | 29 September 2023 Compared to gas-weighted producers 35% (in millions, except share price) Peer Average 32% 33% 2023 Annual Prod. Decline (%) 28% Share Price £0.81 / $
Slide 5: Relentless Focus on Increasing Value
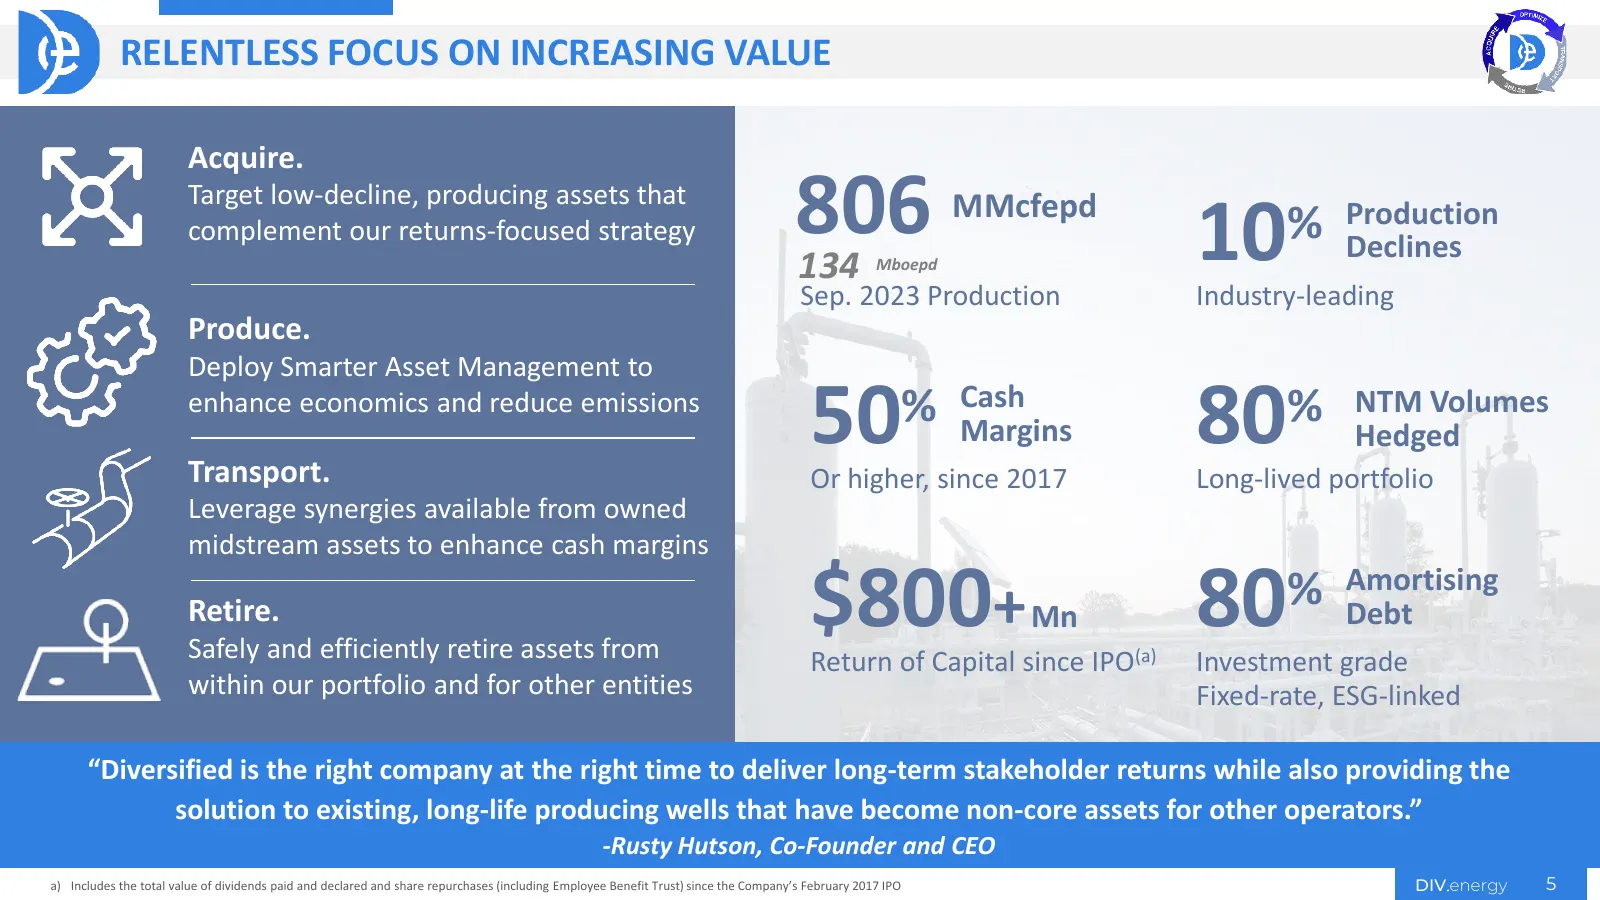
RELENTLESS FOCUS ON INCREASING VALUE Acquire. Target low-decline, producing assets that complement our returns-focused strategy 806 134 Mboepd MMcfepd 10 % Production Declines Sep. 2023 Production Industry-leading Produce. Deploy Smarter Asset Management to enhance economics and reduce emissions Tra
Slide 6: Outstanding Execution in Dynamic Environment
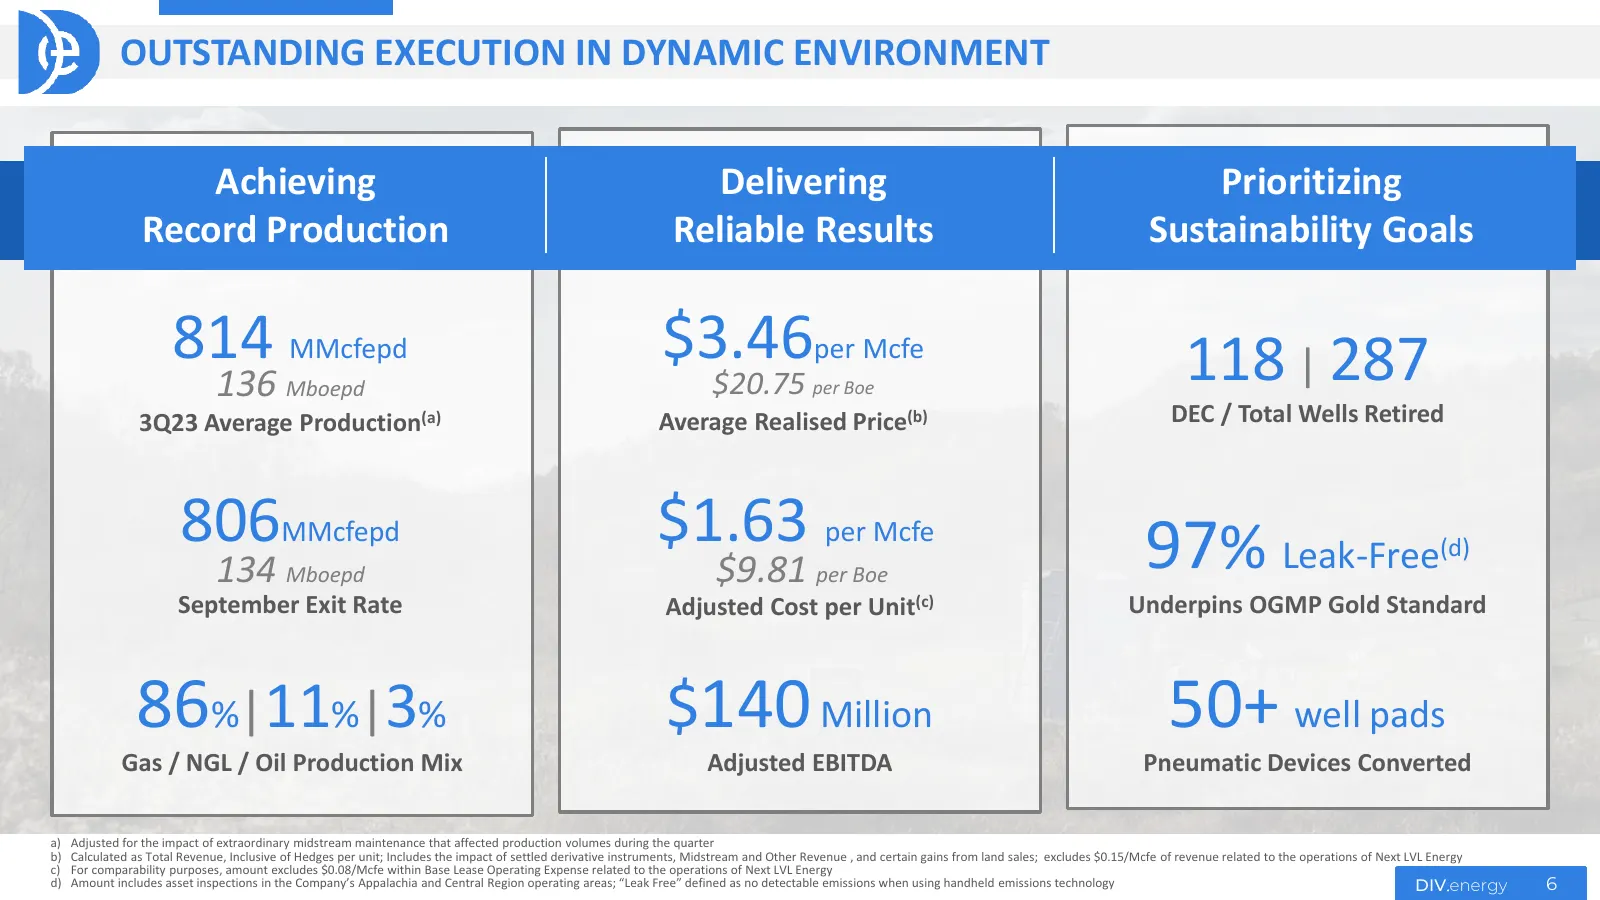
OUTSTANDING EXECUTION IN DYNAMIC ENVIRONMENT Achieving Delivering Prioritizing Record Production Reliable Results Sustainability Goals 814 MMcfepd $3.46per Mcfe 118 | 287 136 Mboepd $20.75 per Boe 3Q23 Average Production(a) Average Realised Price(b) DEC / Total Wells Retired 806MMcfepd $1.63 per Mcf
Slide 7: Value Proposition: De-Risked Investment
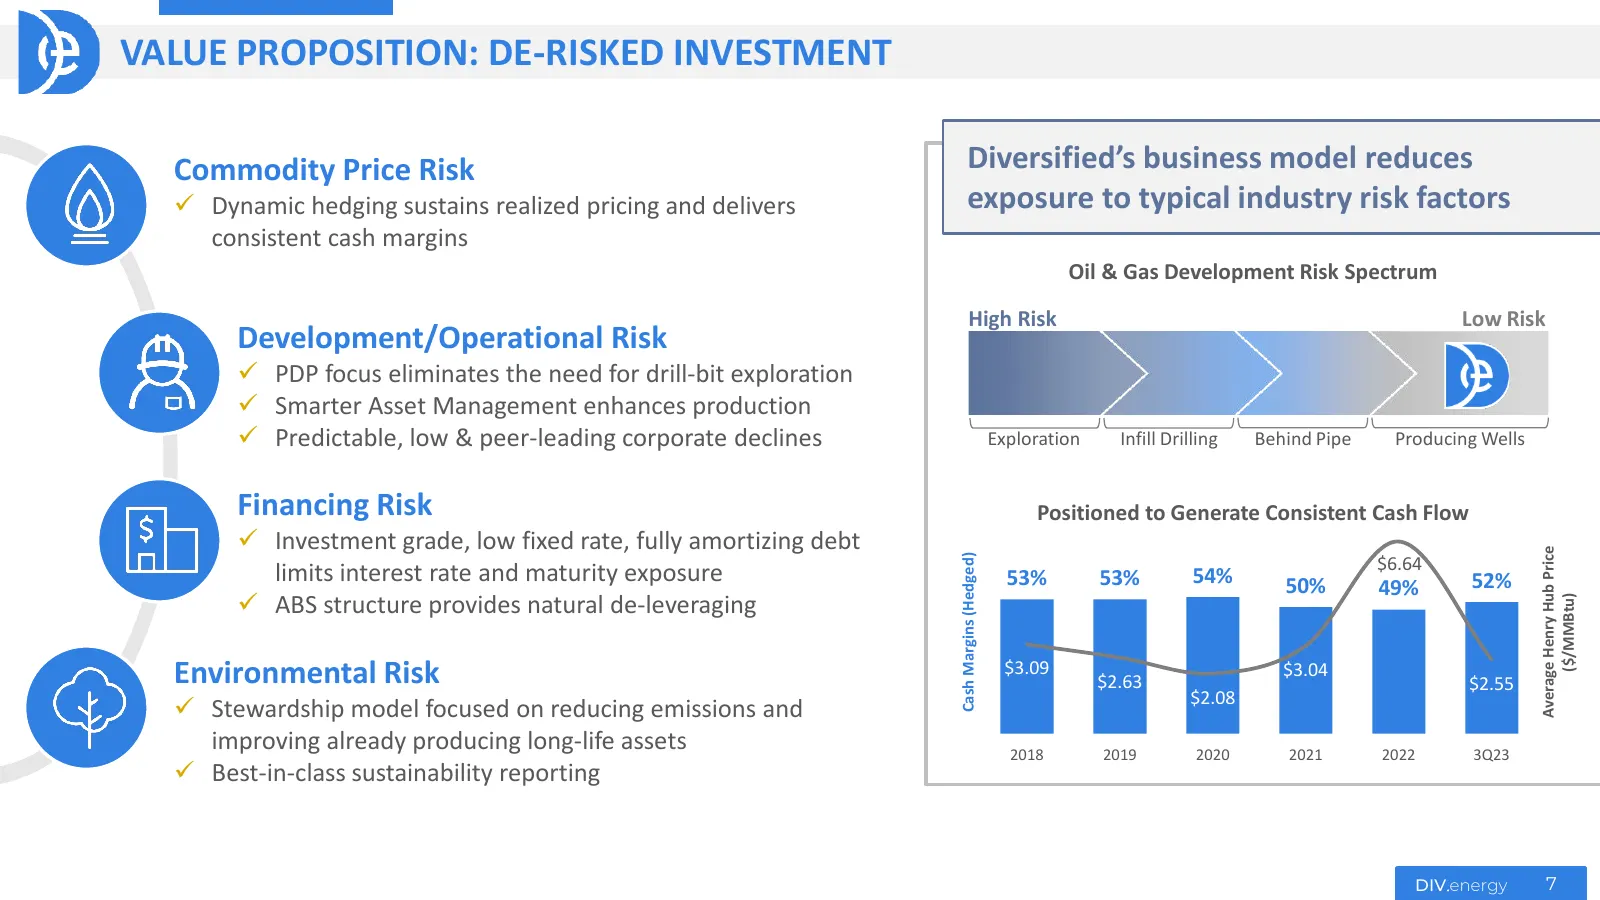
VALUE PROPOSITION: DE-RISKED INVESTMENT Commodity Price Risk Diversified’s business model reduces Dynamic hedging sustains realized pricing and delivers exposure to typical industry risk factors consistent cash margins Oil & Gas Development Risk Spectrum High Risk Low Risk Development/Operational
Slide 8: Track Record of Delivering on Strategic Objectives
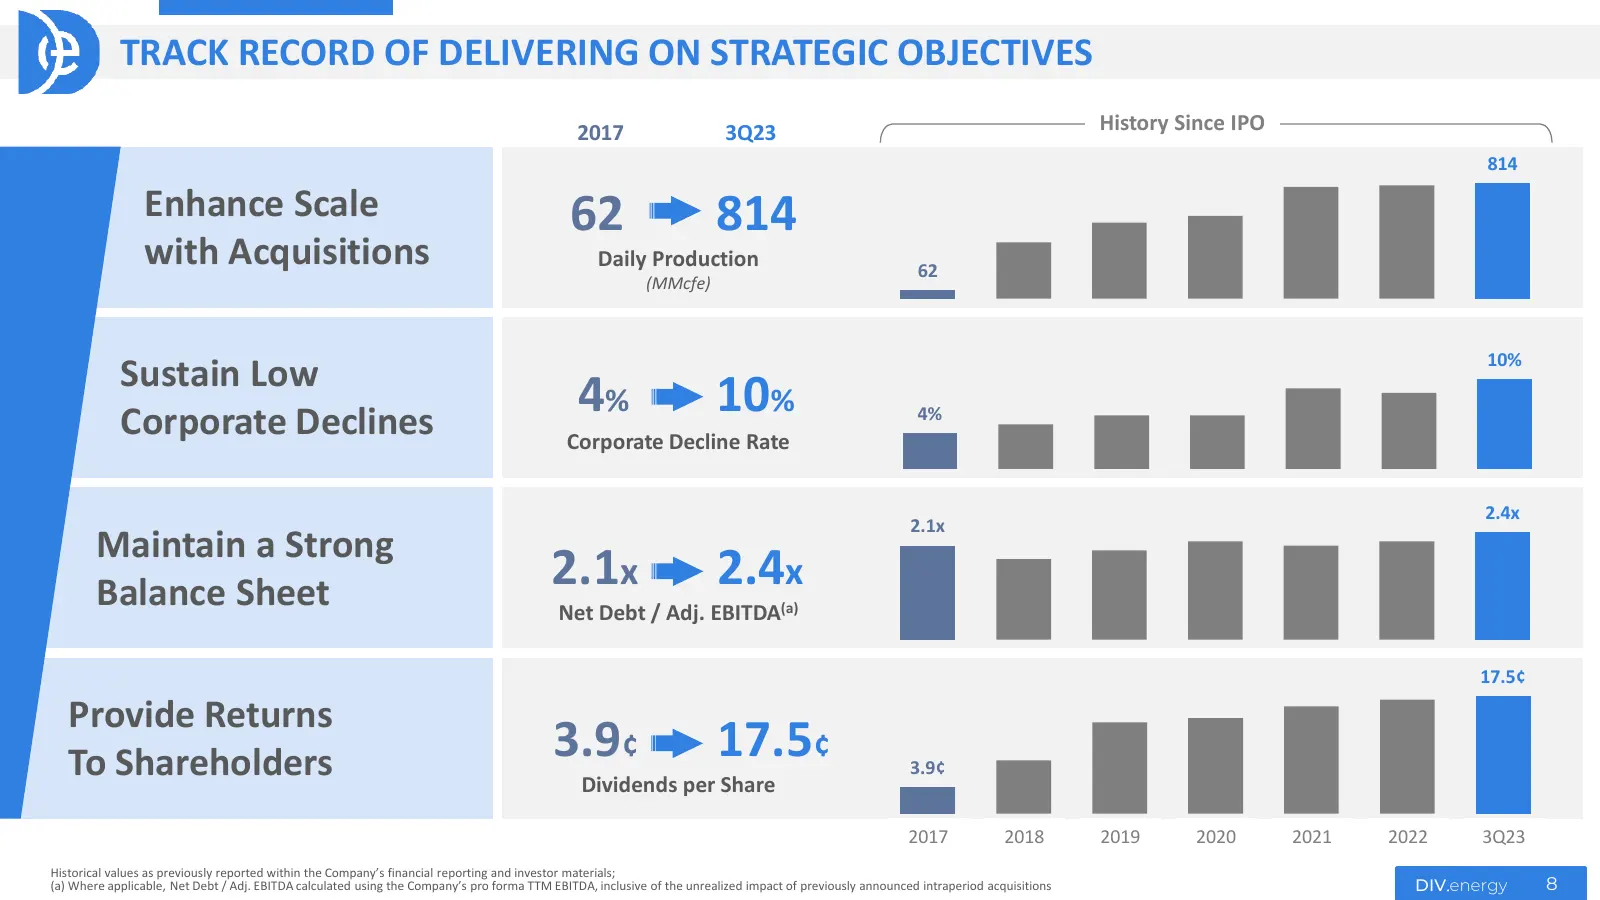
TRACK RECORD OF DELIVERING ON STRATEGIC OBJECTIVES 2017 3Q23 History Since IPO 814 Enhance Scale 62 814 with Acquisitions Daily Production 62 (MMcfe) 10% Sustain Low Corporate Declines 4% 10% 4% Corporate Decline Rate 2.4x 2.1x Maintain a Strong Balance Sheet 2.1x 2.4x Net Debt / Adj. EBITDA(a) 17.5
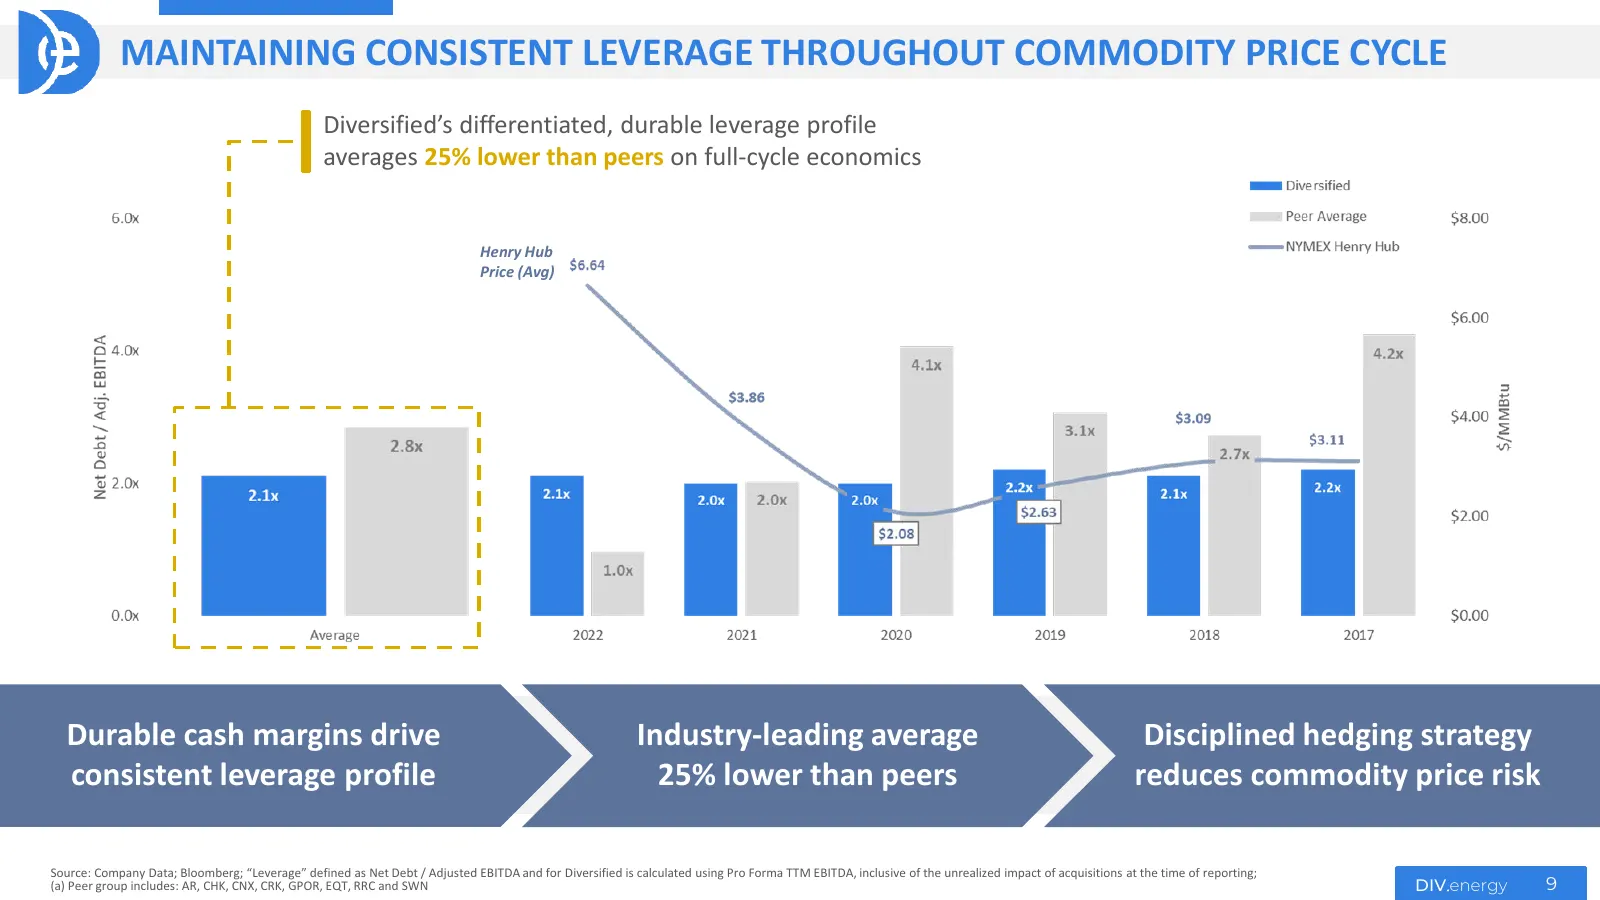
Slide 9: Maintaining Consistent Leverage Throughout Commodity Price Cycle
MAINTAINING CONSISTENT LEVERAGE THROUGHOUT COMMODITY PRICE CYCLE Diversified’s differentiated, durable leverage profile averages 25% lower than peers on full-cycle economics Henry Hub Price (Avg) Durable cash margins drive Industry-leading average Disciplined hedging strategy consistent leverage pro
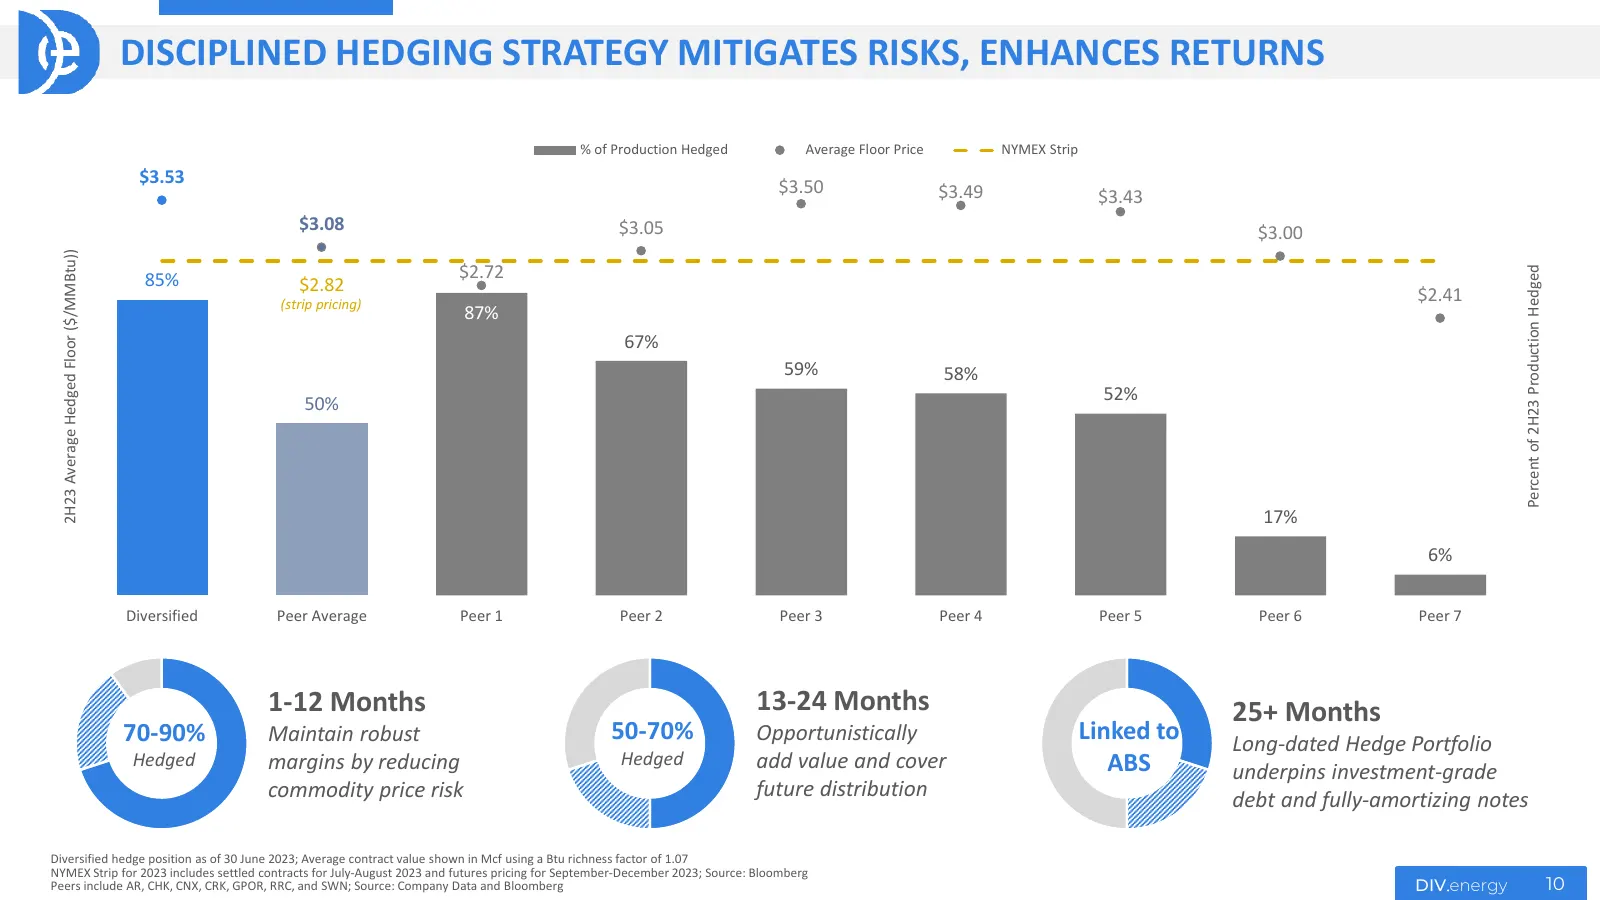
Slide 10: Disciplined Hedging Strategy Mitigates Risks, Enhances Returns
DISCIPLINED HEDGING STRATEGY MITIGATES RISKS, ENHANCES RETURNS % of Production Hedged Average Floor Price NYMEX Strip $3.53 $3.50 $3.49 $3.43 $3.08 $3.05 $3.00 2H23 Average Hedged Floor ($/MMBtu)) $2.72 Percent of 2H23 Production Hedged 85% $2.82 (strip pricing) $2.41 87% 67% 59% 58% 50% 52% 17% 6%
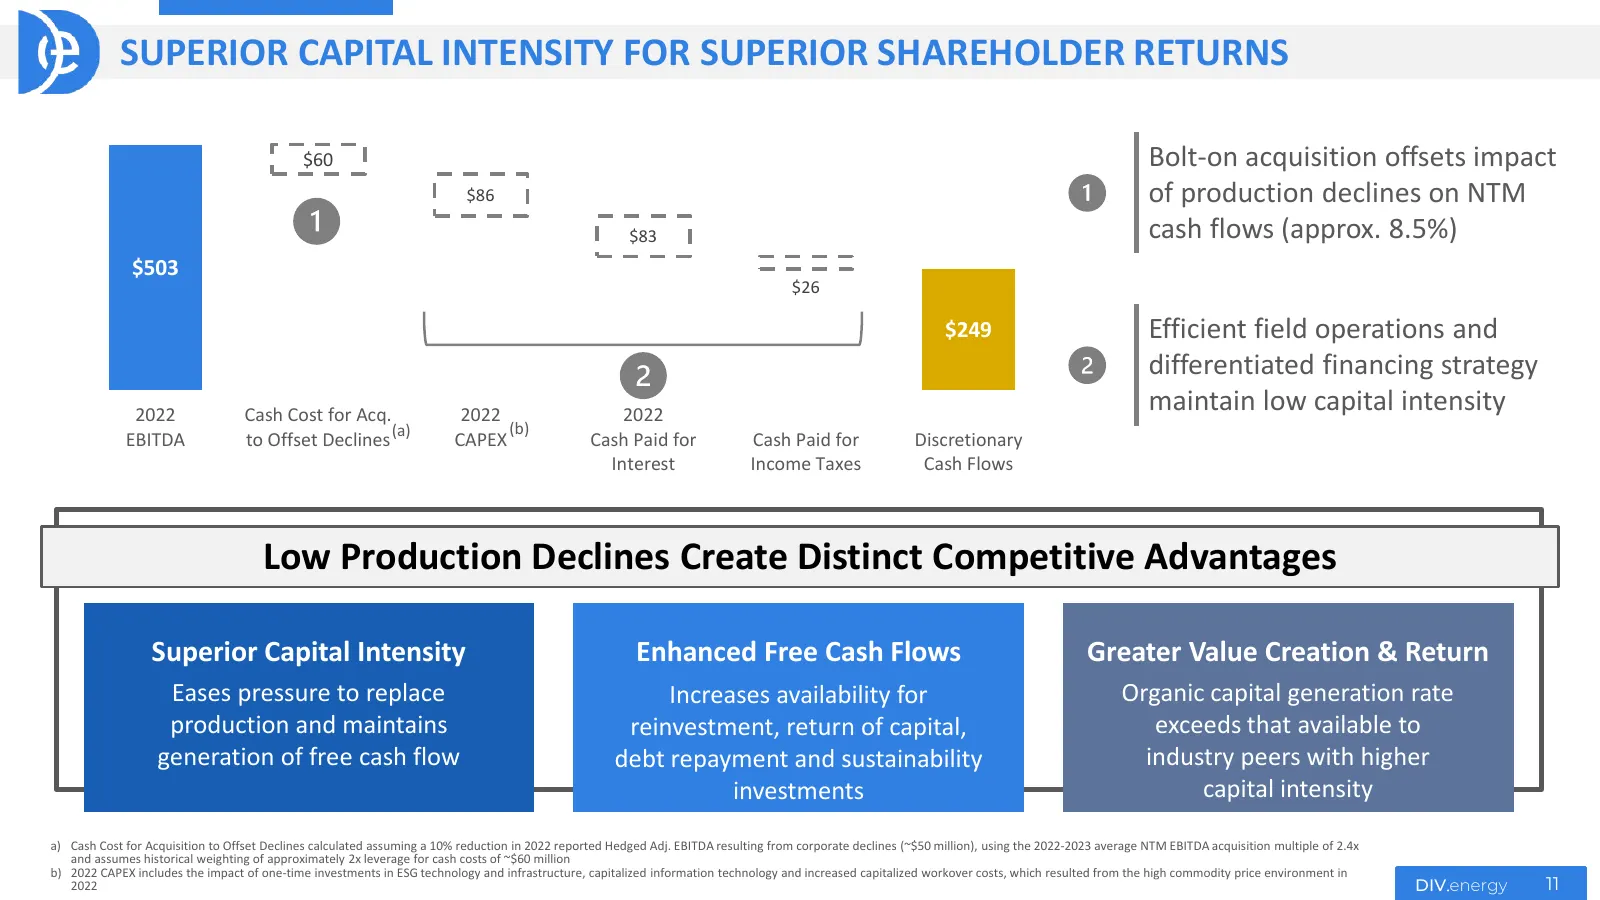
Slide 11: Superior Capital Intensity for Superior Shareholder Returns
SUPERIOR CAPITAL INTENSITY FOR SUPERIOR SHAREHOLDER RETURNS $60 Bolt-on acquisition offsets impact $86 of production declines on NTM $83 cash flows (approx. 8.5%) $503 $26 $249 Efficient field operations and differentiated financing strategy 2022 Cash Cost for Acq. 2022 2022 maintain low capital int
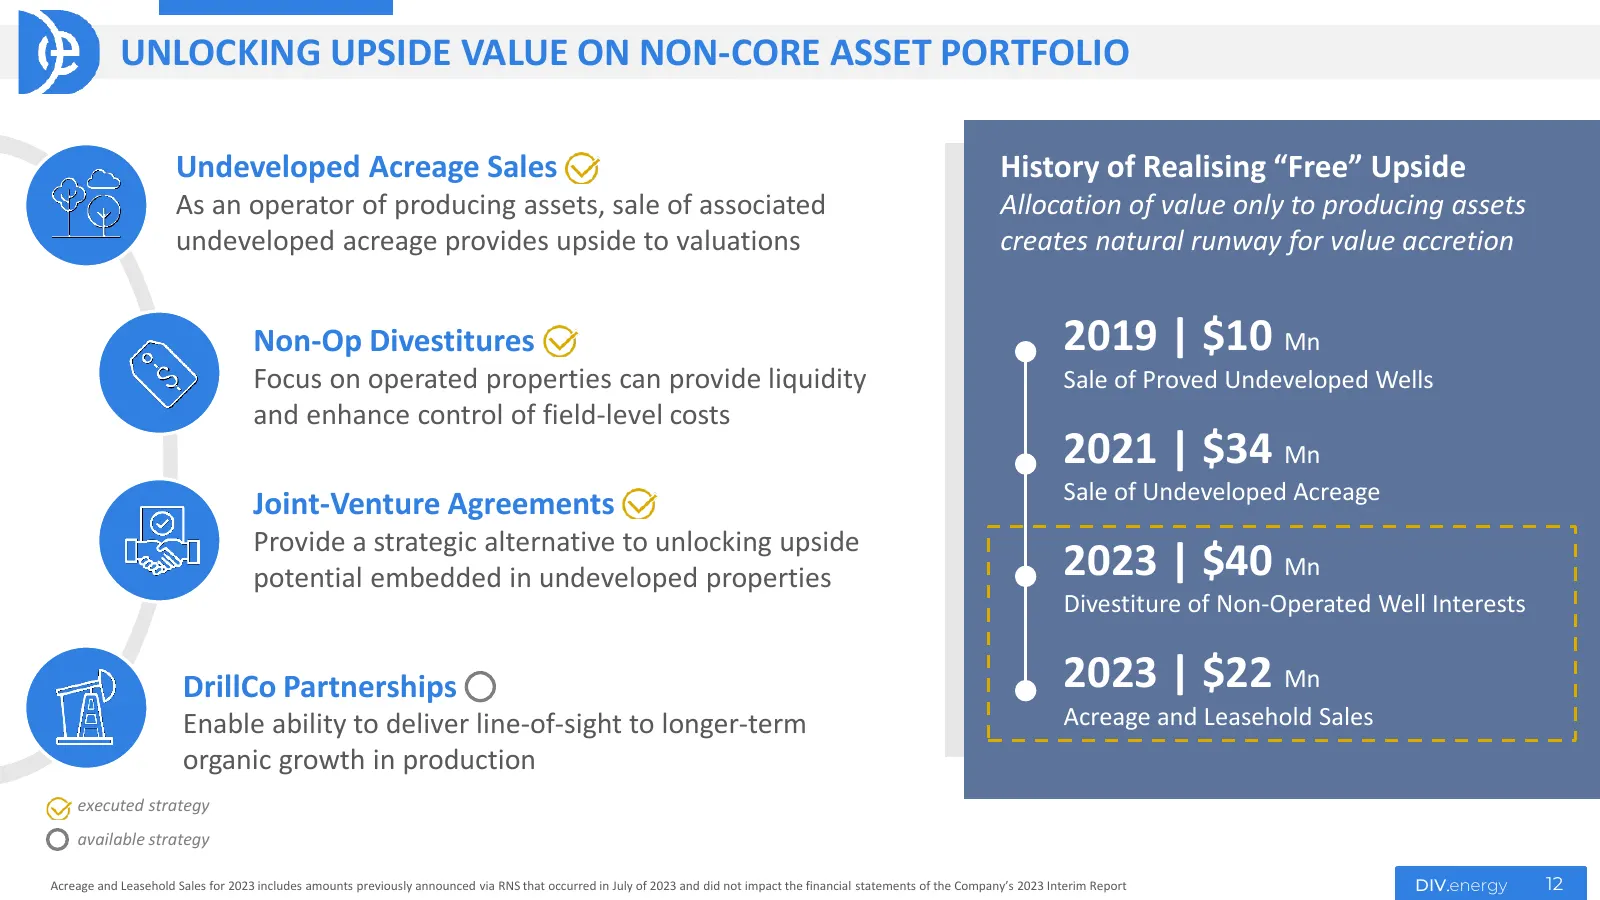
Slide 12: Unlocking Upside Value on Non-Core Asset Portfolio
UNLOCKING UPSIDE VALUE ON NON-CORE ASSET PORTFOLIO Undeveloped Acreage Sales History of Realising “Free” Upside As an operator of producing assets, sale of associated Allocation of value only to producing assets undeveloped acreage provides upside to valuations creates natural runway for value accre
Slide 13: Smarter Asset Management in Action
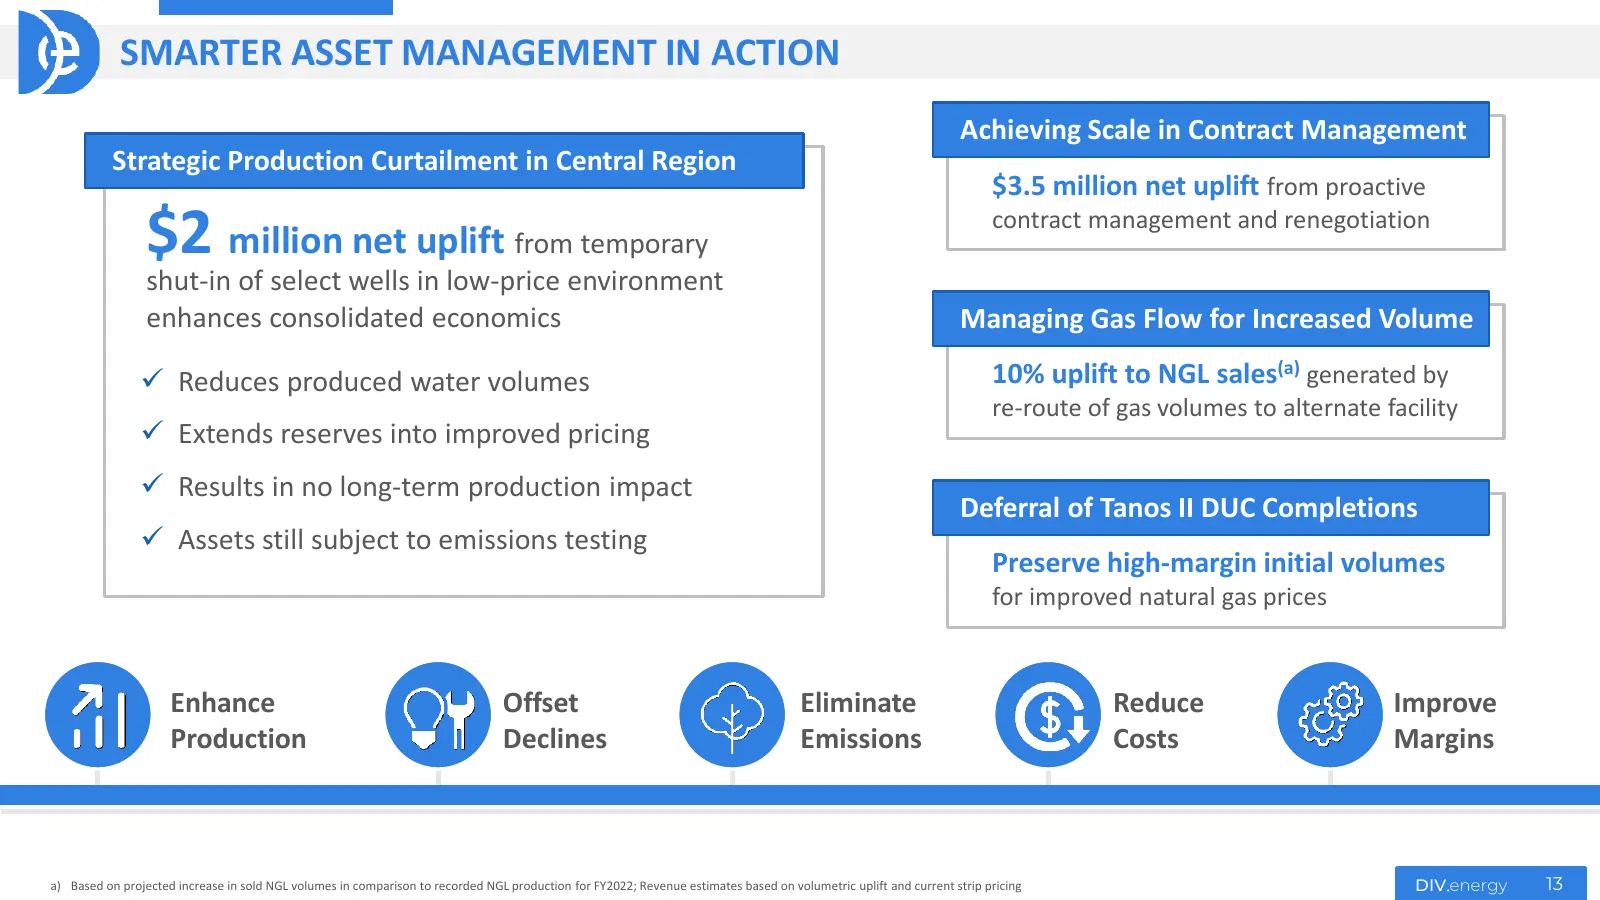
SMARTER ASSET MANAGEMENT IN ACTION Achieving Scale in Contract Management Strategic Production Curtailment in Central Region $3.5 million net uplift from proactive $2 million net uplift from temporary contract management and renegotiation shut-in of select wells in low-price environment enhances con
Slide 14: 3Q23: Delivering Consistent Cash Generation on Durable Margins
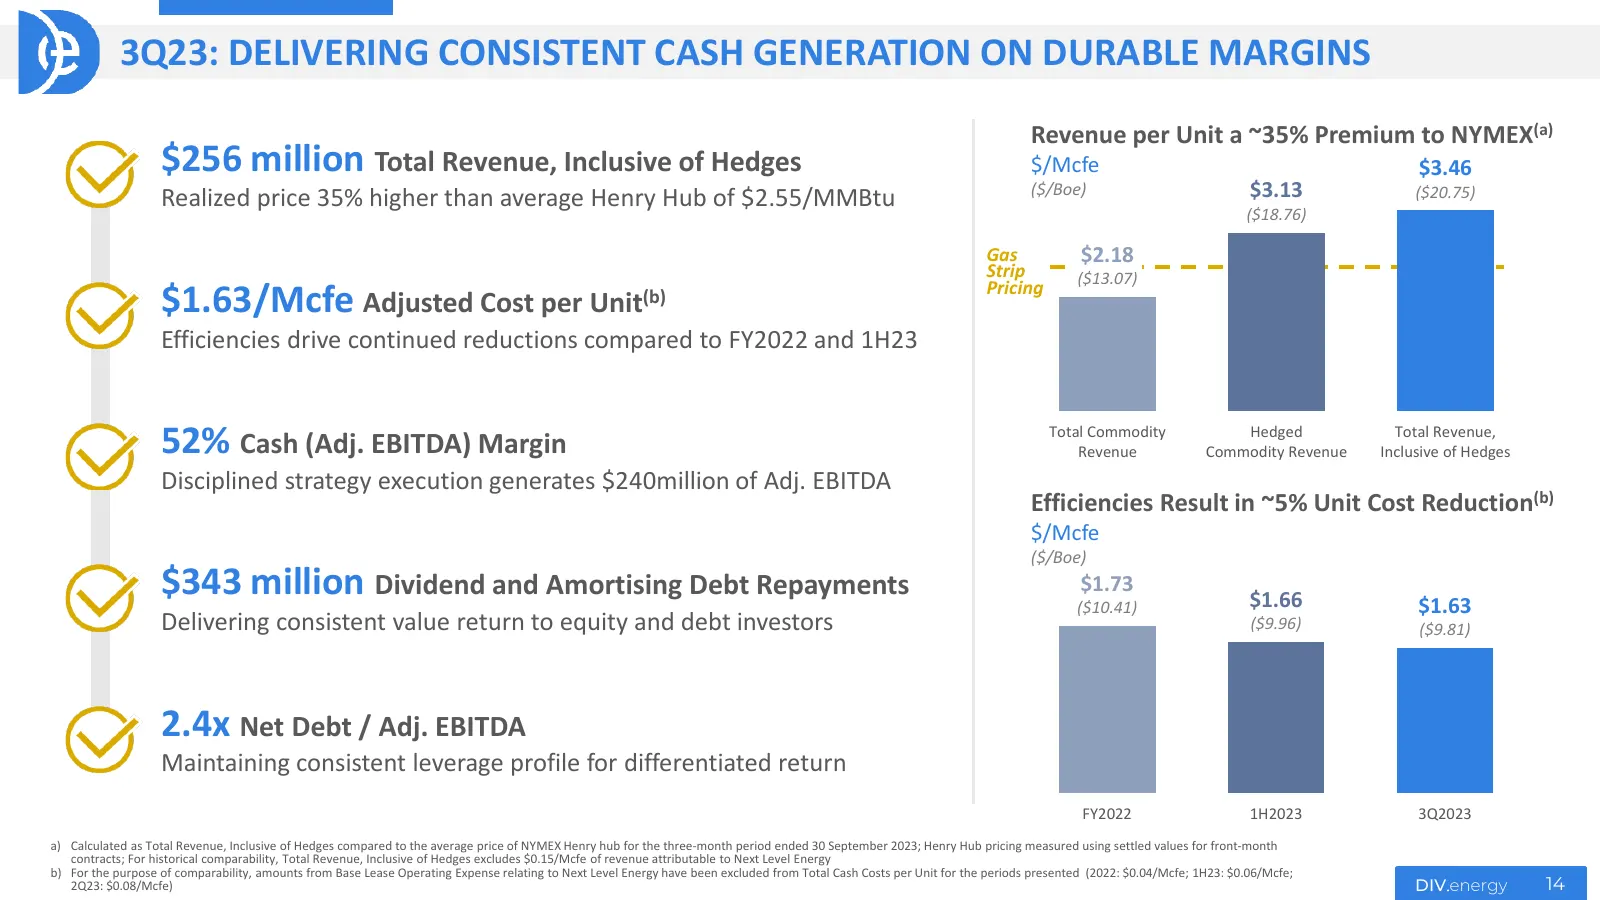
3Q23: DELIVERING CONSISTENT CASH GENERATION ON DURABLE MARGINS Revenue per Unit a ~35% Premium to NYMEX(a) $256 million Total Revenue, Inclusive of Hedges $/Mcfe $3.46 Realized price 35% higher than average Henry Hub of $2.55/MMBtu ($/Boe) $3.13 ($20.75) ($18.76) Gas $2.18 Strip ($13.07) Pricing $1.
Slide 15: Continued Commitment to Strong Sustainability Practices
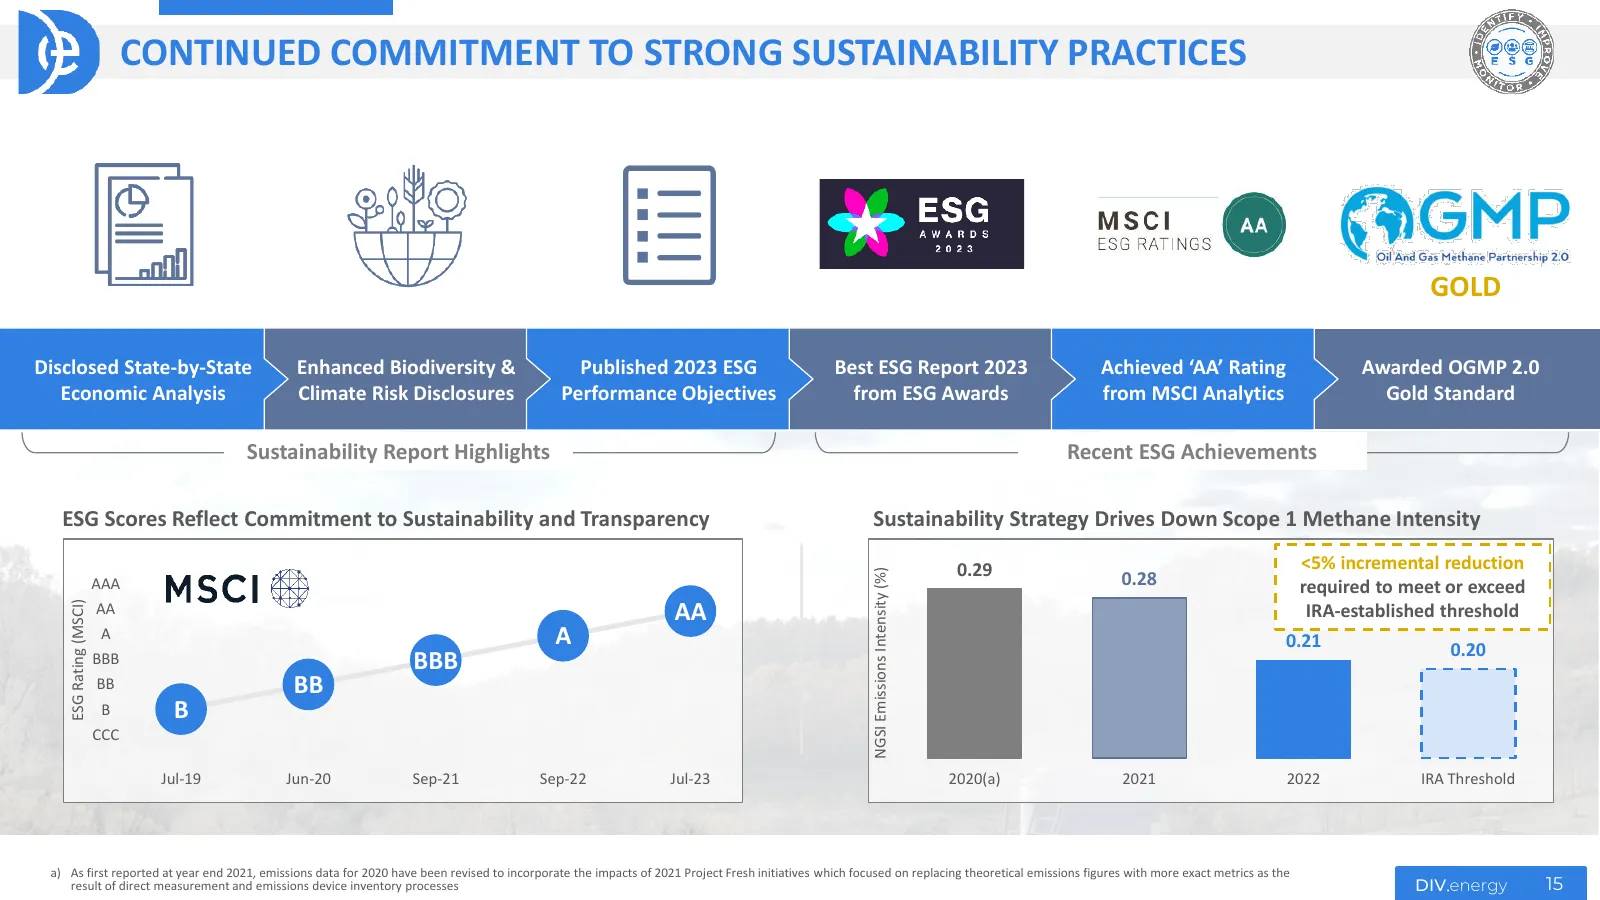
CONTINUED COMMITMENT TO STRONG SUSTAINABILITY PRACTICES GOLD Disclosed State-by-State Enhanced Biodiversity & Published 2023 ESG Best ESG Report 2023 Achieved ‘AA’ Rating Awarded OGMP 2.0 Economic Analysis Climate Risk Disclosures Performance Objectives from ESG Awards from MSCI Analytics Gold Stand
Slide 16: Next LVL Energy: Setting a New Standard for Retirement
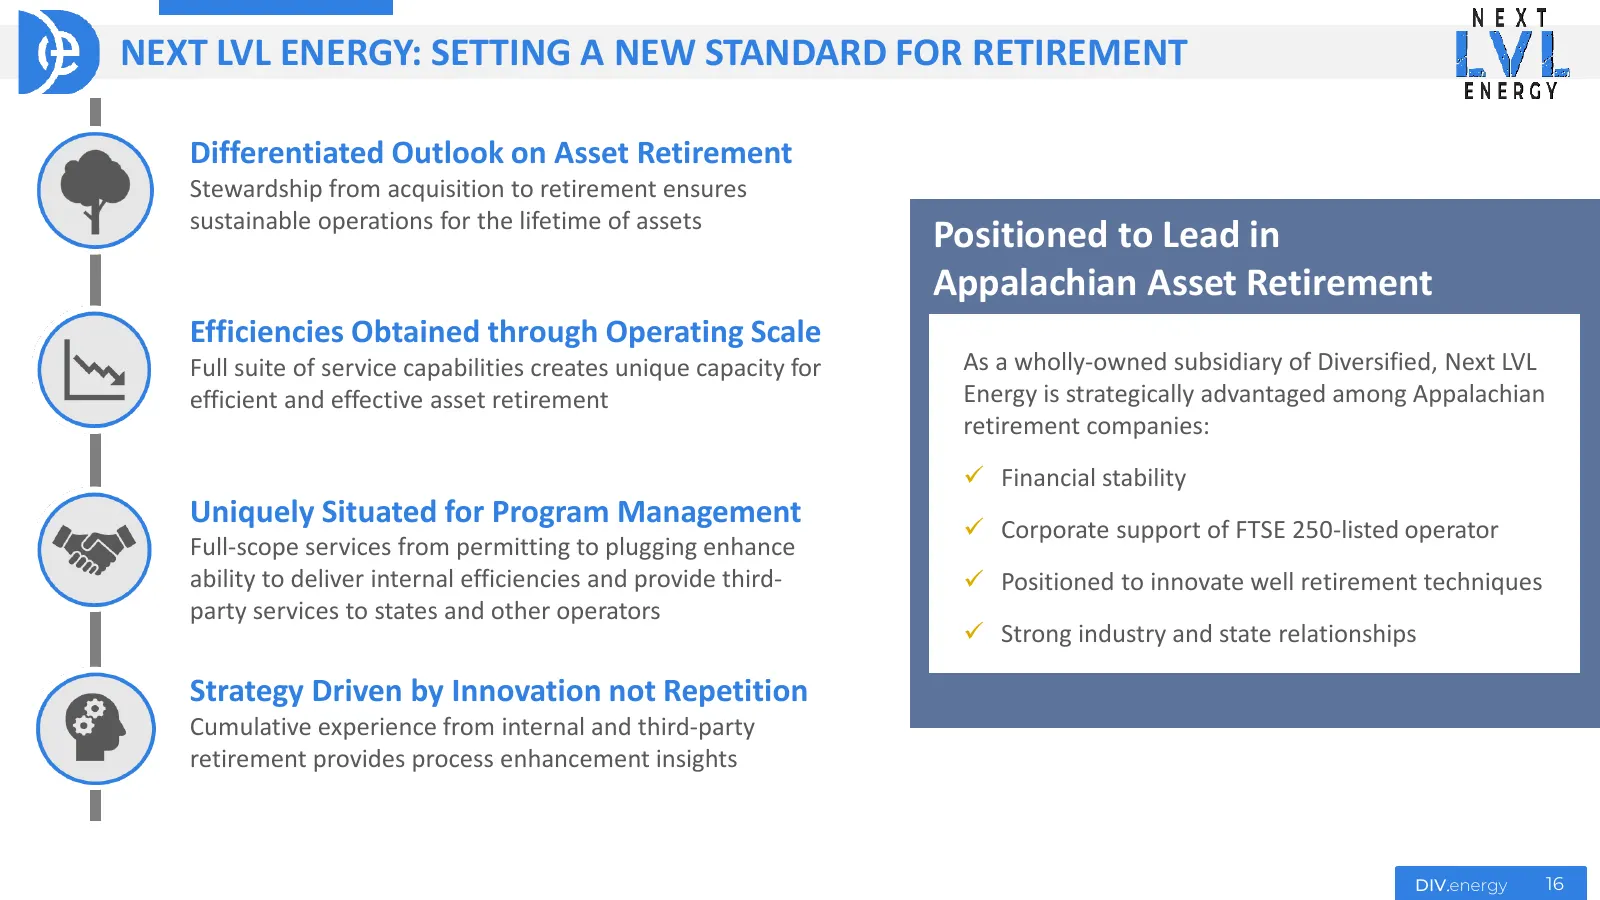
NEXT LVL ENERGY: SETTING A NEW STANDARD FOR RETIREMENT Differentiated Outlook on Asset Retirement Stewardship from acquisition to retirement ensures sustainable operations for the lifetime of assets Positioned to Lead in Appalachian Asset Retirement Efficiencies Obtained through Operating Scale Full
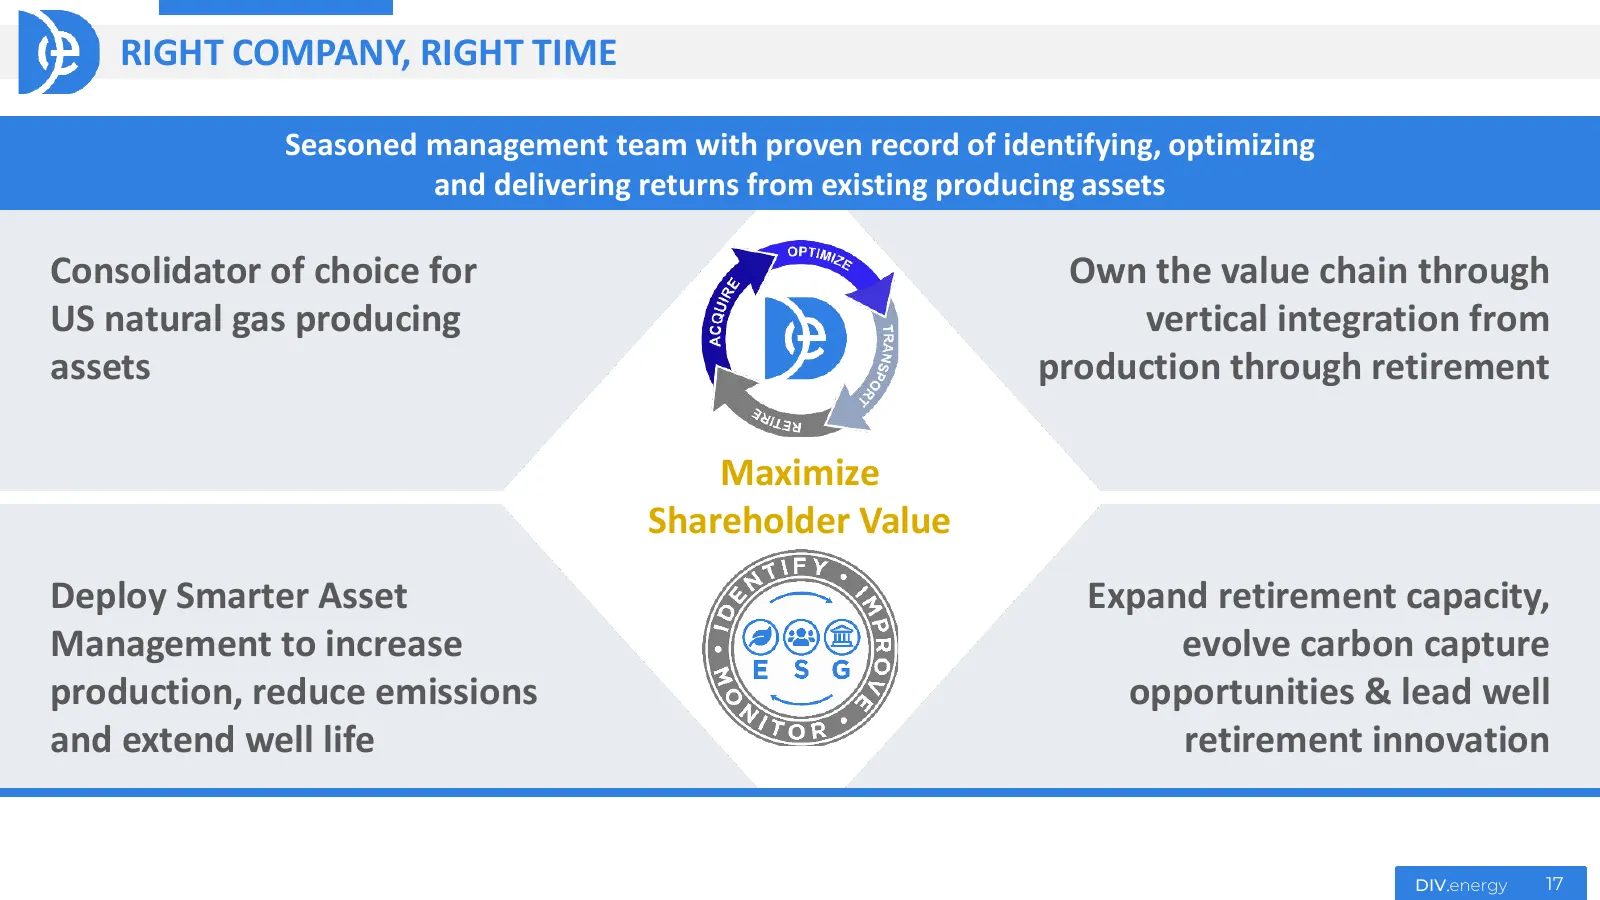
Slide 17: Right Company, Right Time
RIGHT COMPANY, RIGHT TIME Seasoned management team with proven record of identifying, optimizing and delivering returns from existing producing assets Consolidator of choice for Own the value chain through US natural gas producing vertical integration from assets production through retirement Maximi
Slide 18: Vertical Integration Model
Vertical Integration Model DIV.energy
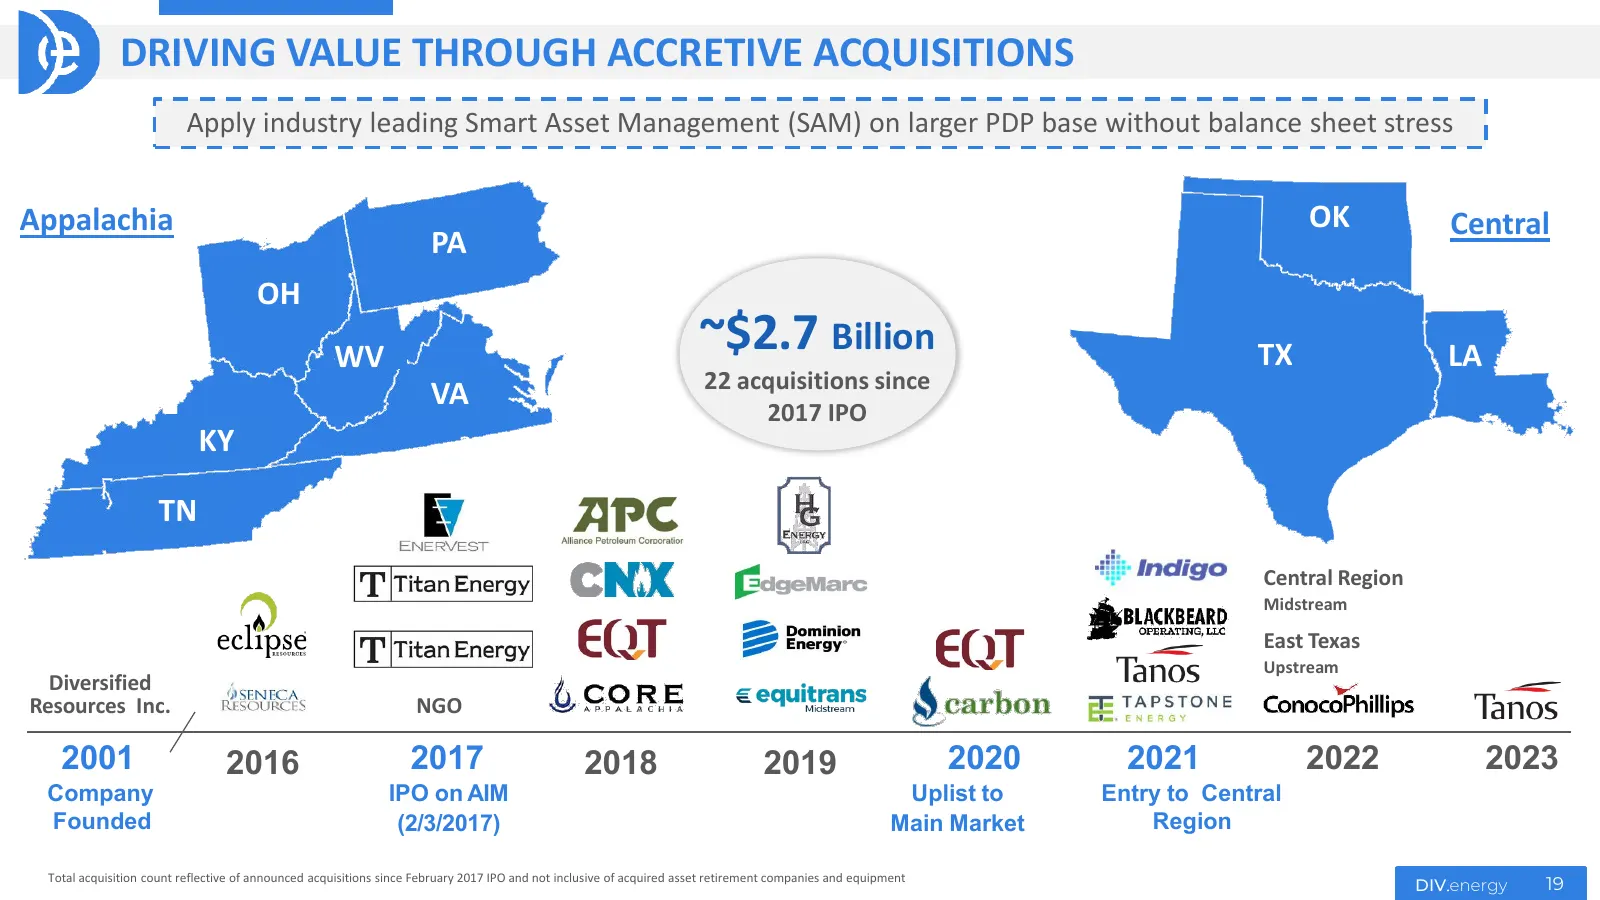
Slide 19: Driving Value Through Accretive Acquisitions
DRIVING VALUE THROUGH ACCRETIVE ACQUISITIONS Apply industry leading Smart Asset Management (SAM) on larger PDP base without balance sheet stress Appalachia OK Central PA OH WV ~$2.7 Billion TX LA 22 acquisitions since VA 2017 IPO KY TN Central Region Midstream East Texas Upstream Diversified Resourc
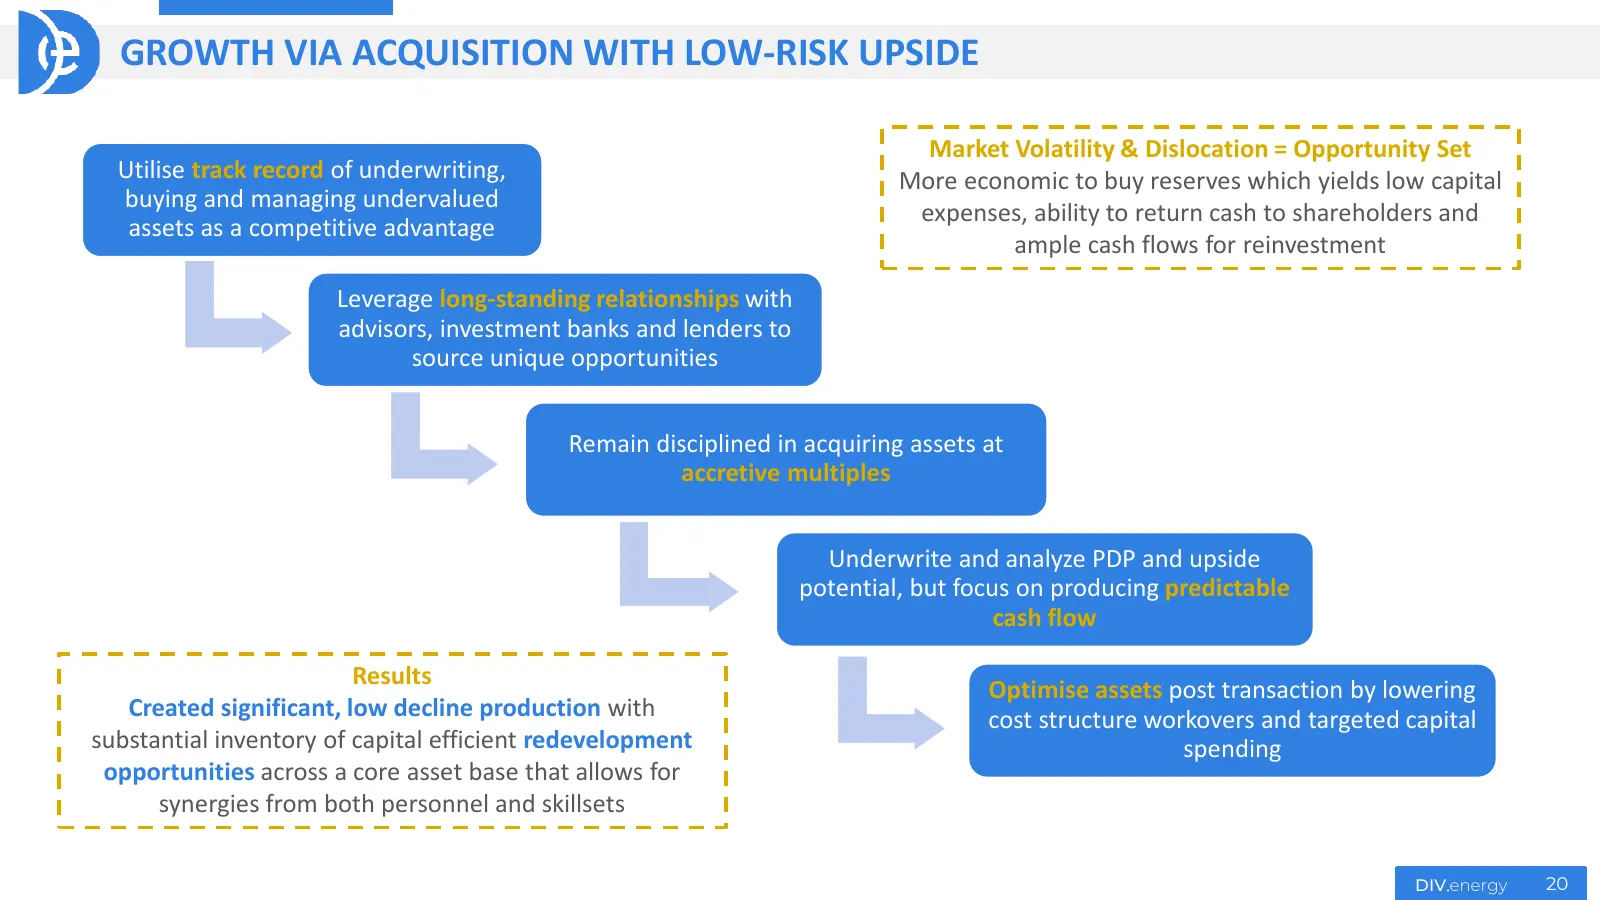
Slide 20: Growth via Acquisition with Low-Risk Upside
GROWTH VIA ACQUISITION WITH LOW-RISK UPSIDE Market Volatility & Dislocation = Opportunity Set Utilise track record of underwriting, More economic to buy reserves which yields low capital buying and managing undervalued expenses, ability to return cash to shareholders and assets as a competitive adva
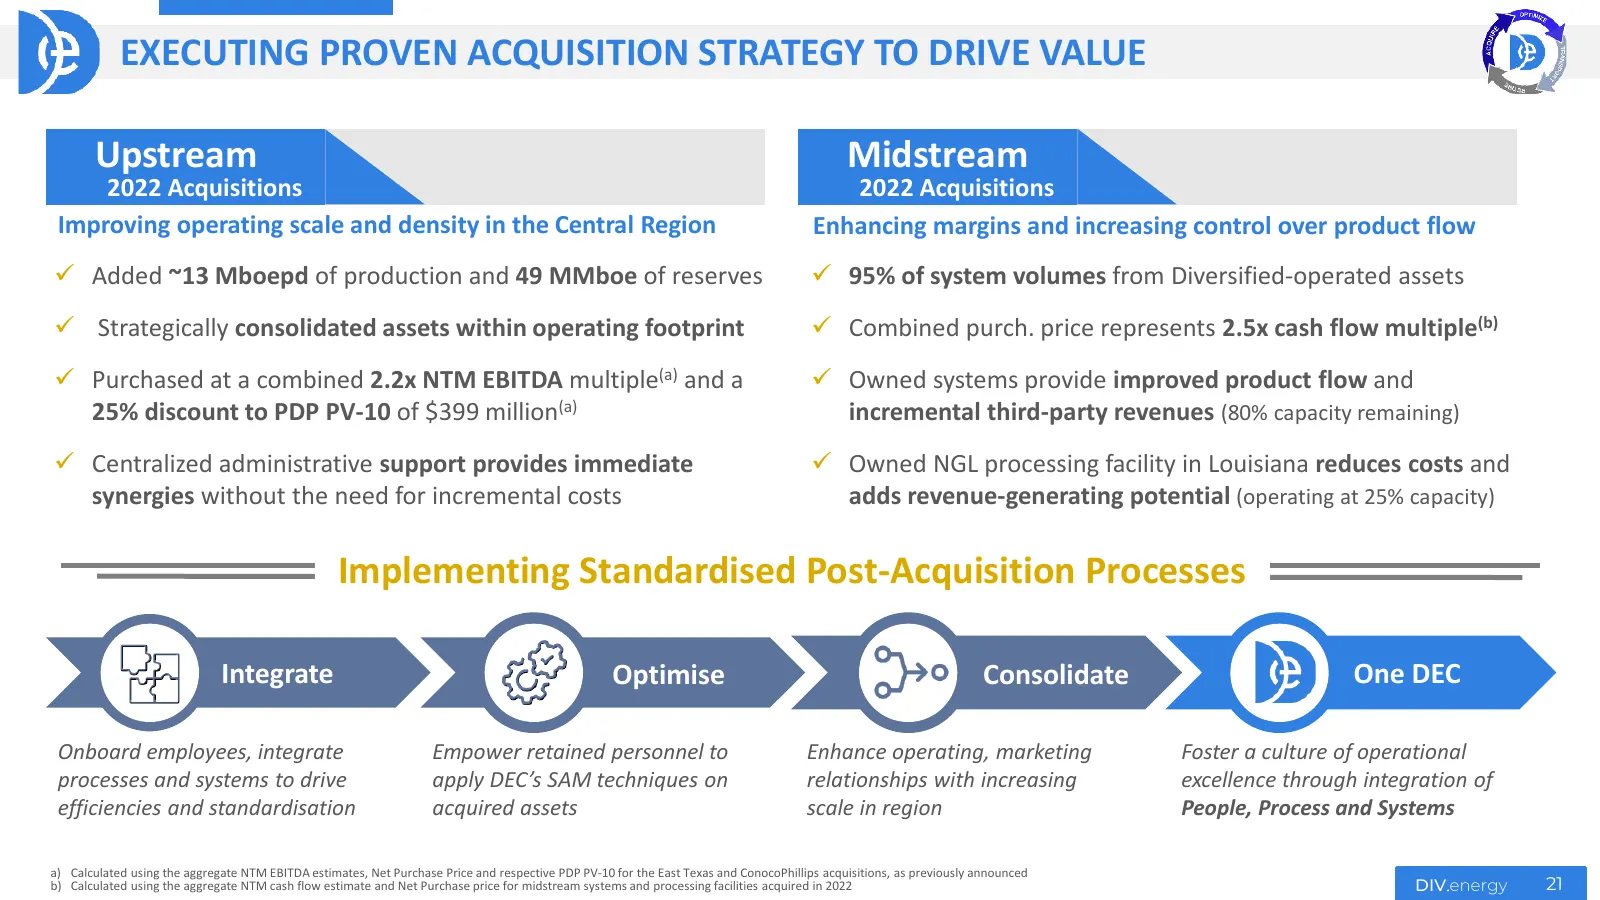
Slide 21: Executing Proven Acquisition Strategy to Drive Value
EXECUTING PROVEN ACQUISITION STRATEGY TO DRIVE VALUE Upstream Midstream 2022 Acquisitions 2022 Acquisitions Improving operating scale and density in the Central Region Enhancing margins and increasing control over product flow Added ~13 Mboepd of production and 49 MMboe of reserves 95% of system
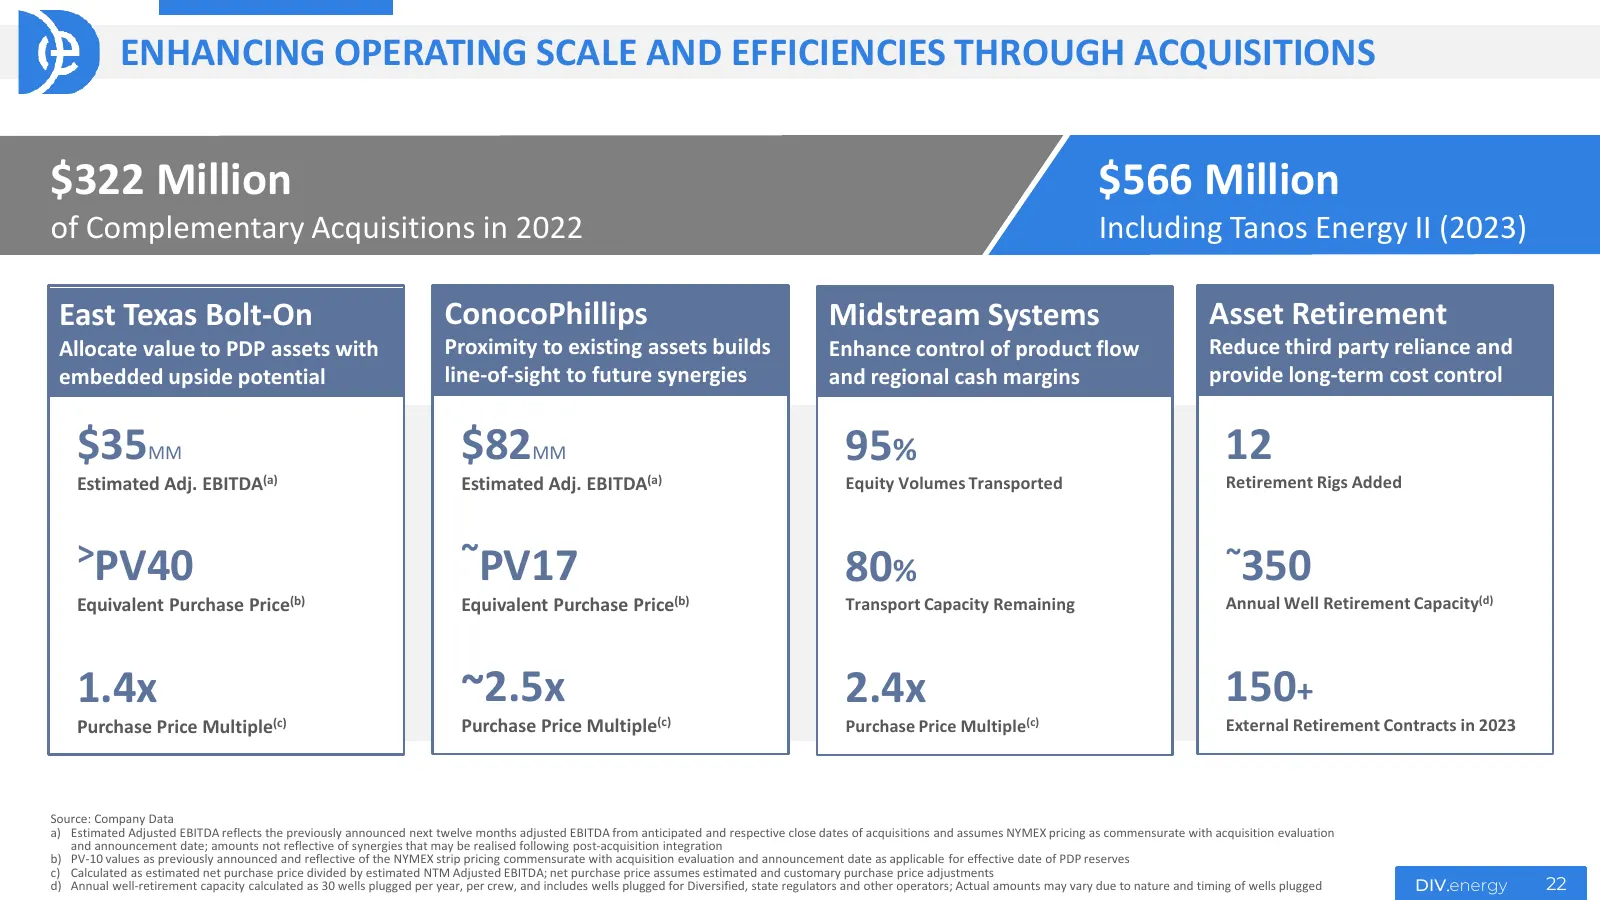
Slide 22: Enhancing Operating Scale and Efficiencies Through Acquisitions
ENHANCING OPERATING SCALE AND EFFICIENCIES THROUGH ACQUISITIONS $322 Million $566 Million of Complementary Acquisitions in 2022 Including Tanos Energy II (2023) East Texas Bolt-On ConocoPhillips Midstream Systems Asset Retirement Allocate value to PDP assets with Proximity to existing assets builds
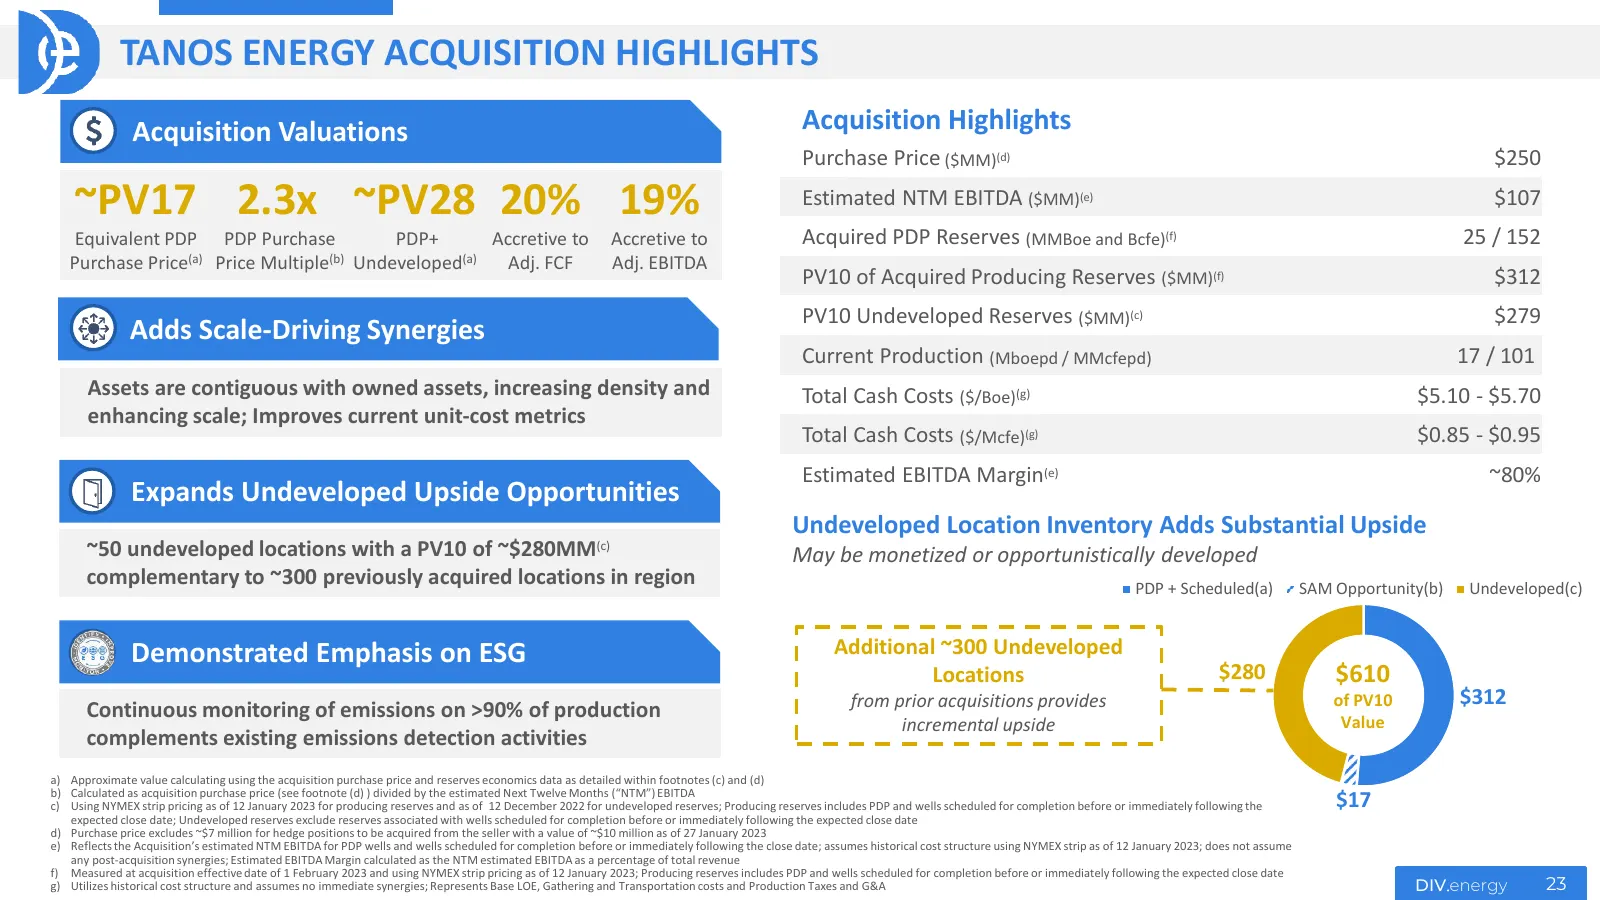
Slide 23: Tanos Energy Acquisition Highlights
TANOS ENERGY ACQUISITION HIGHLIGHTS Acquisition Valuations Acquisition Highlights Purchase Price ($MM)(d) $250 ~PV17 2.3x ~PV28 20% 19% Estimated NTM EBITDA ($MM)(e) $107 Equivalent PDP PDP Purchase PDP+ Accretive to Accretive to Acquired PDP Reserves (MMBoe and Bcfe)(f) 25 / 152 (a) (b) Purchase Pr
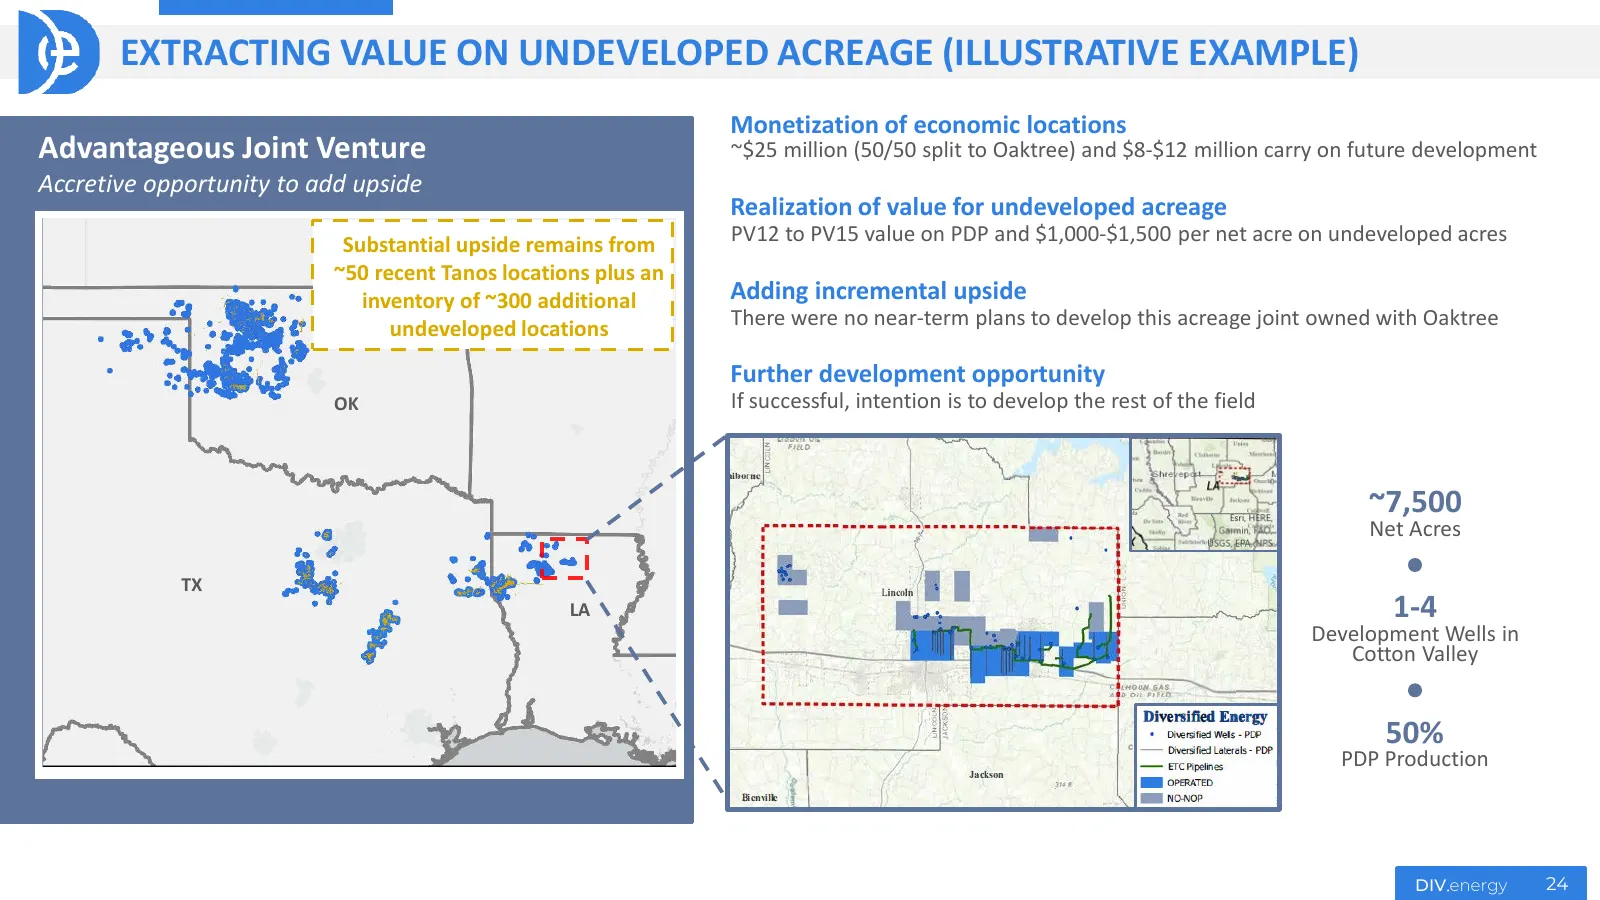
Slide 24: Extracting Value on Undeveloped Acreage (Illustrative Example)
EXTRACTING VALUE ON UNDEVELOPED ACREAGE (ILLUSTRATIVE EXAMPLE) Monetization of economic locations Advantageous Joint Venture ~$25 million (50/50 split to Oaktree) and $8-$12 million carry on future development Accretive opportunity to add upside Realization of value for undeveloped acreage Substanti
Slide 25: Smarter Asset Management Provides Ongoing Value
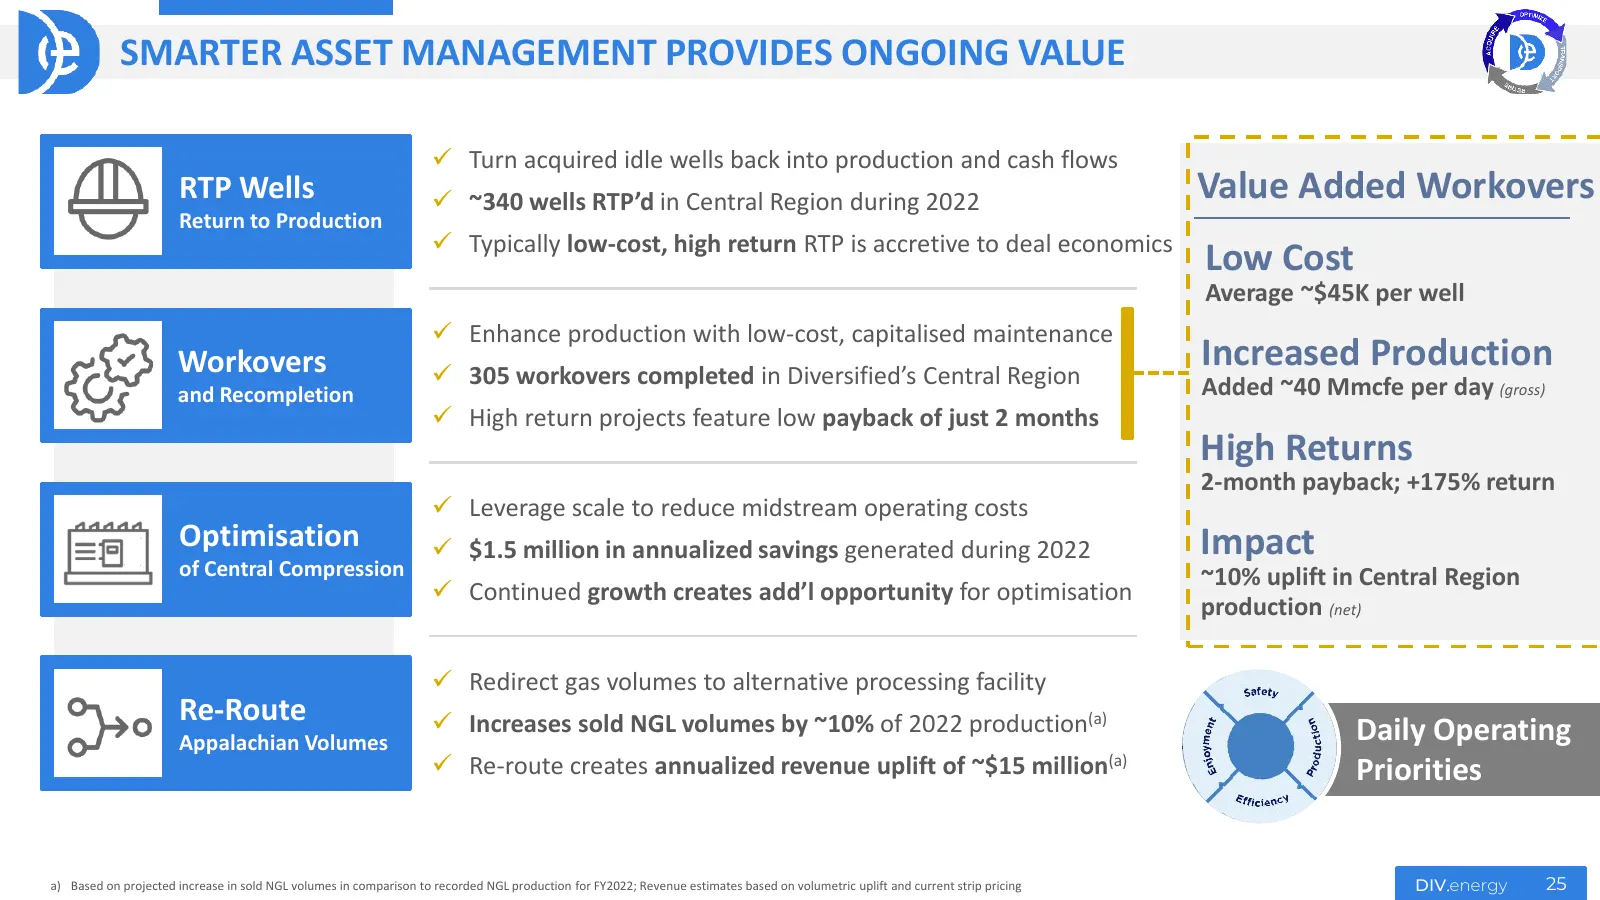
SMARTER ASSET MANAGEMENT PROVIDES ONGOING VALUE Turn acquired idle wells back into production and cash flows RTP Wells ~340 wells RTP’d in Central Region during 2022 Value Added Workovers Return to Production Typically low-cost, high return RTP is accretive to deal economics Low Cost Average ~
Slide 26: Creating Value Across Operating Regions
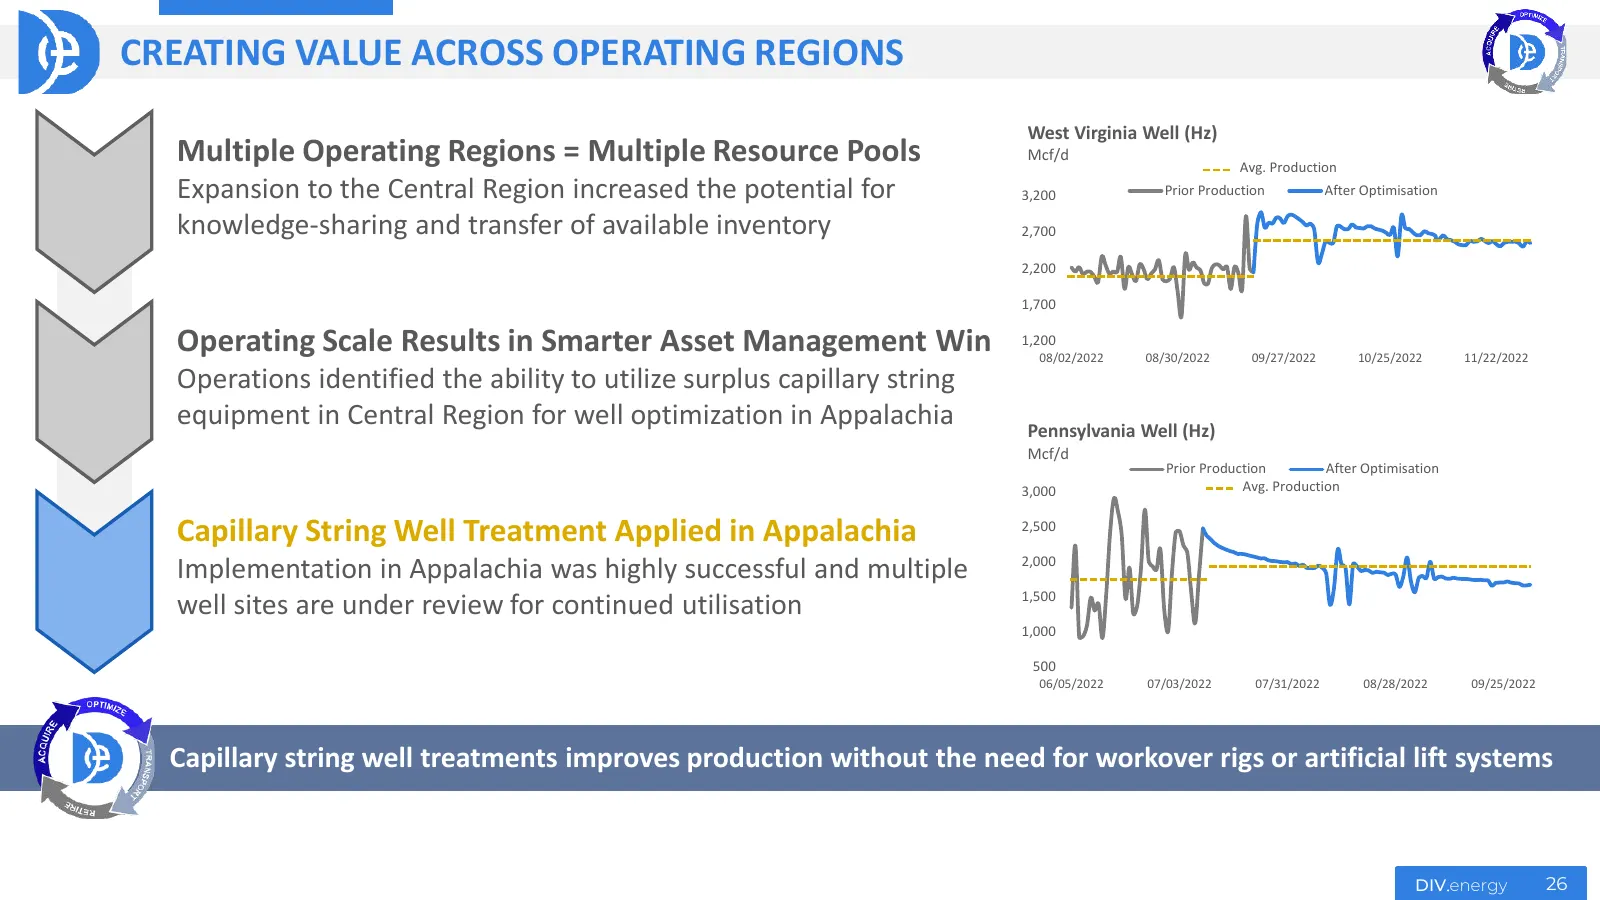
CREATING VALUE ACROSS OPERATING REGIONS West Virginia Well (Hz) Multiple Operating Regions = Multiple Resource Pools Mcf/d Avg. Production Expansion to the Central Region increased the potential for 3,200 Prior Production After Optimisation knowledge-sharing and transfer of available inventory 2,700
Slide 27: Operational Insights Driven by Technology Investments
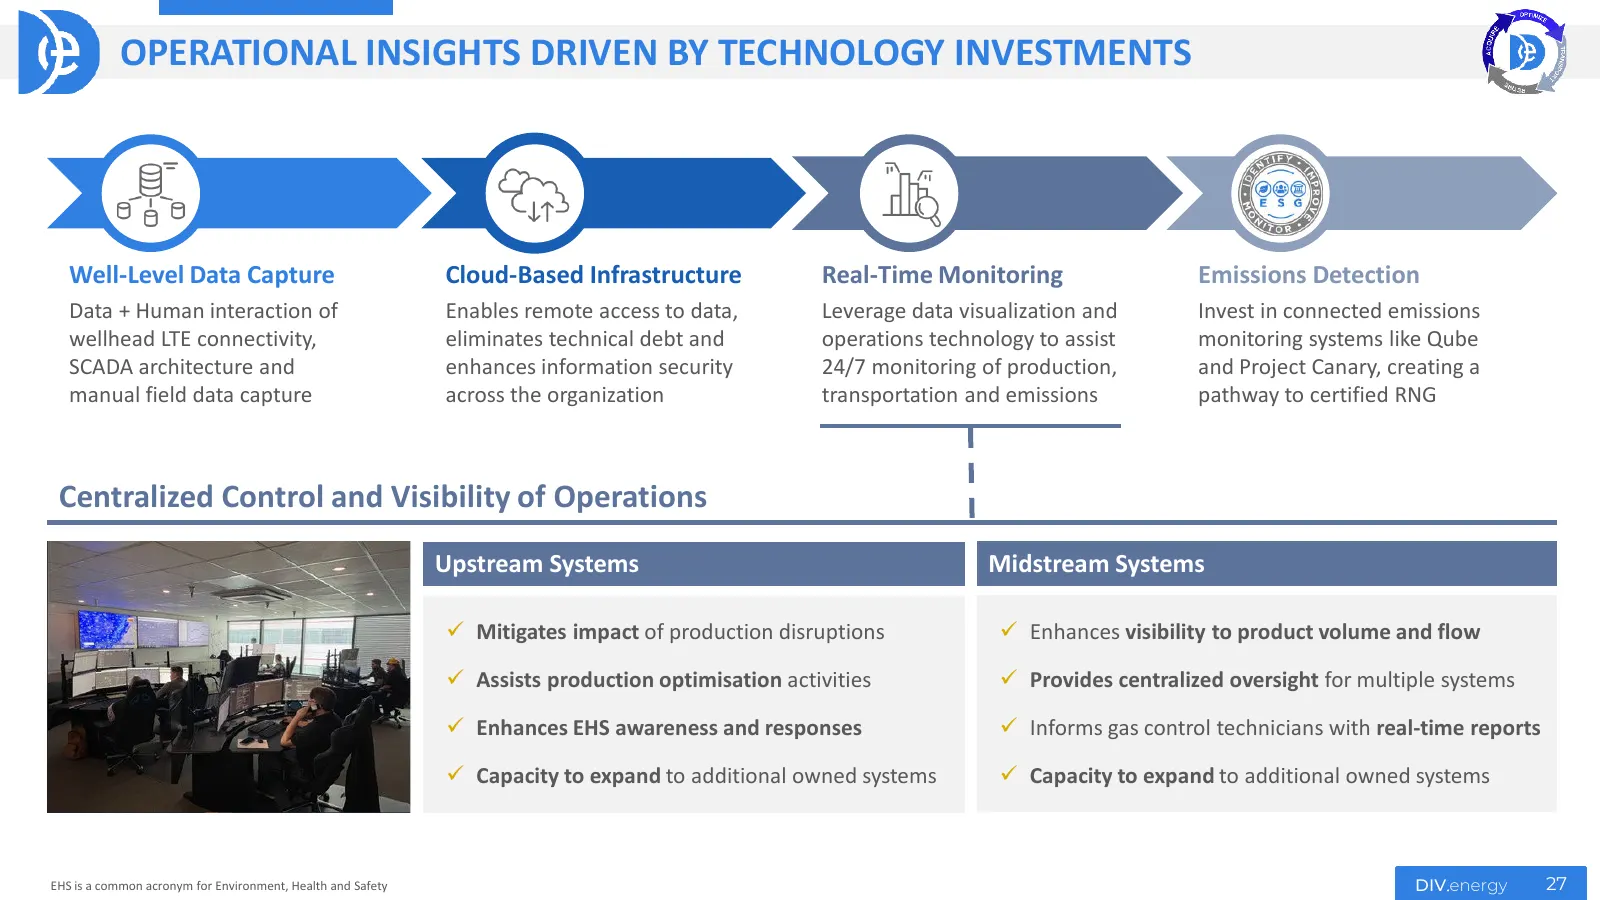
OPERATIONAL INSIGHTS DRIVEN BY TECHNOLOGY INVESTMENTS Well-Level Data Capture Cloud-Based Infrastructure Real-Time Monitoring Emissions Detection Data + Human interaction of Enables remote access to data, Leverage data visualization and Invest in connected emissions wellhead LTE connectivity, elimin
Slide 28: Midstream Operations
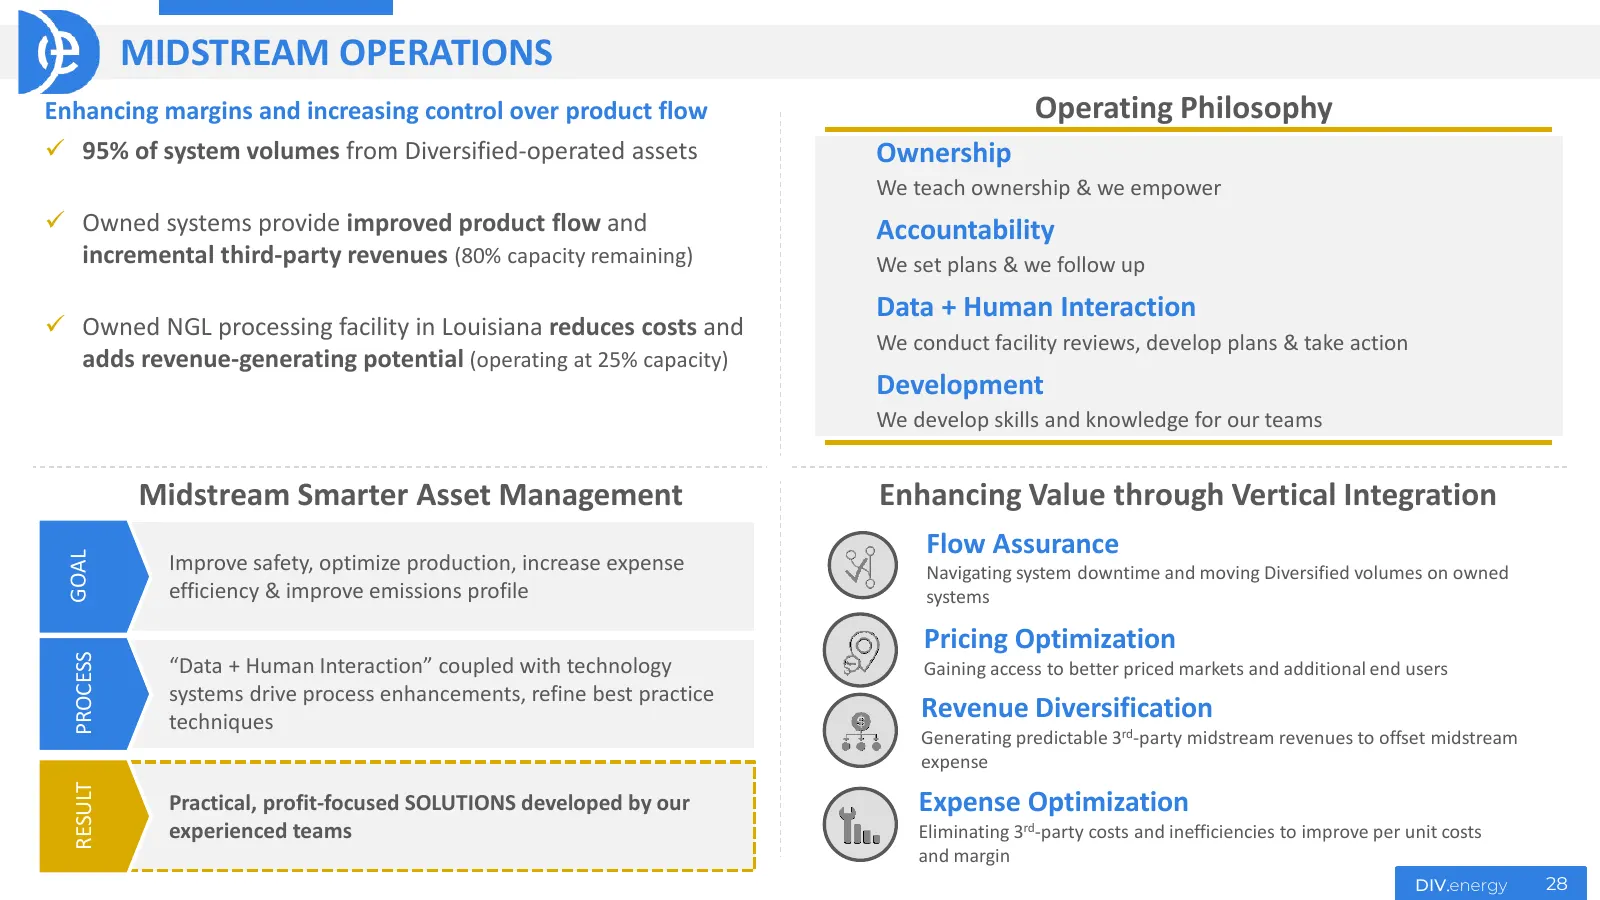
MIDSTREAM OPERATIONS Enhancing margins and increasing control over product flow Operating Philosophy 95% of system volumes from Diversified-operated assets Ownership We teach ownership & we empower Owned systems provide improved product flow and Accountability incremental third-party revenues (8
Slide 29: Supplemental Information
Supplemental Information DIV.energy
Slide 30: Commodity Derivatives Portfolio (as of September 2023)
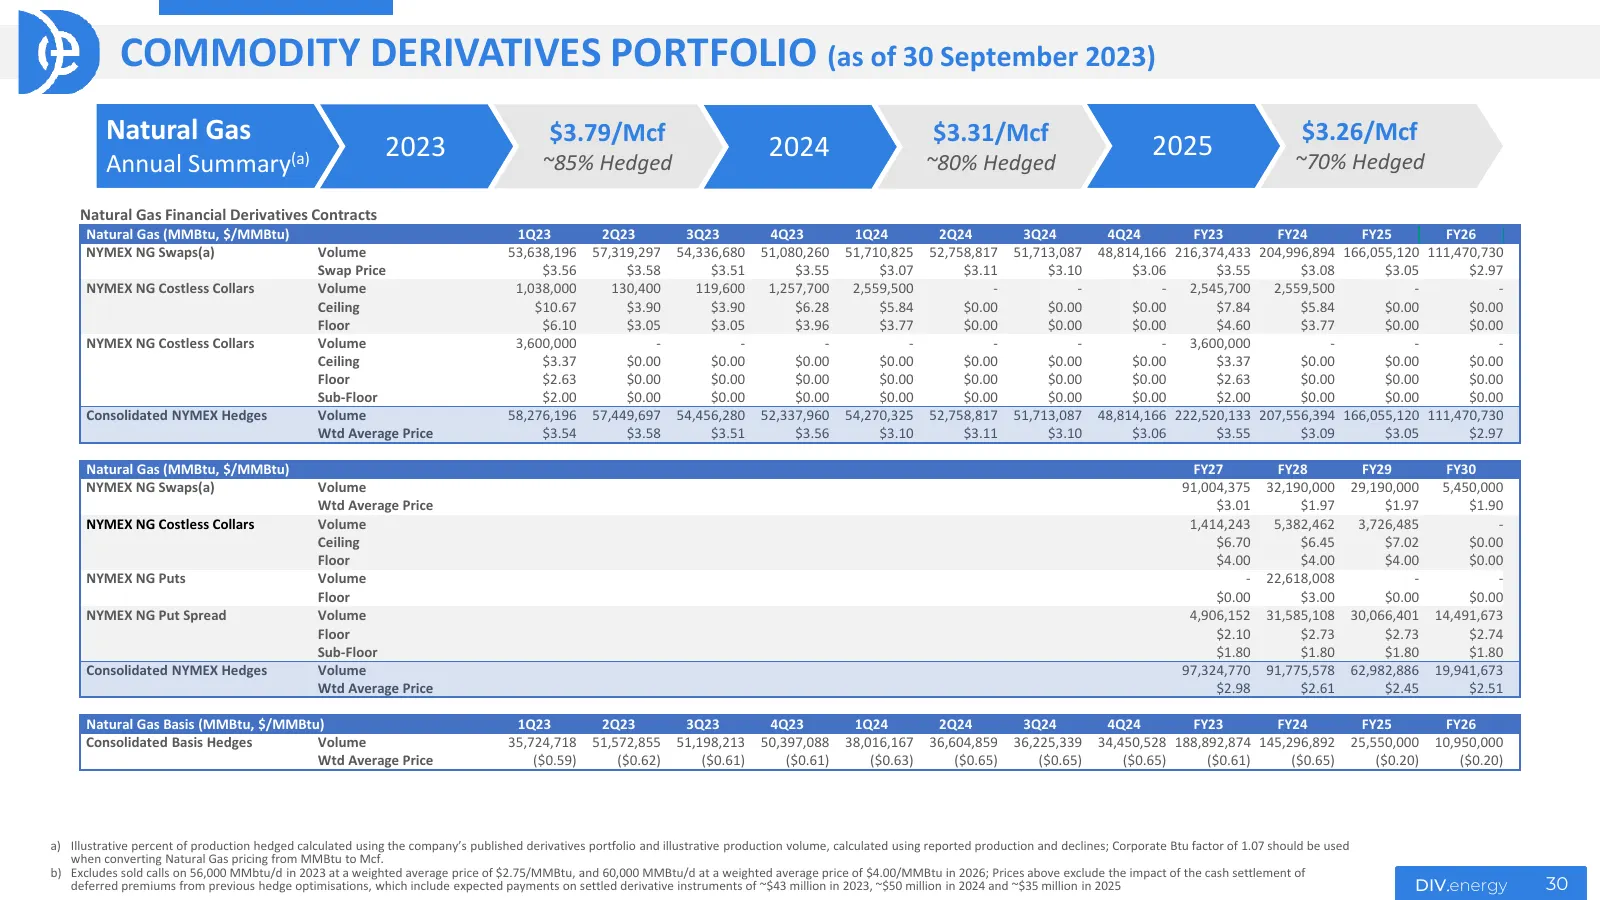
COMMODITY DERIVATIVES PORTFOLIO (as of 30 September 2023) Natural Gas $3.79/Mcf $3.31/Mcf $3.26/Mcf 2023 2024 2025 Annual Summary(a) ~85% Hedged ~80% Hedged ~70% Hedged Natural Gas Financial Derivatives Contracts Natural Gas (MMBtu, $/MMBtu) 1Q23 2Q23 3Q23 4Q23 1Q24 2Q24 3Q24 4Q24 FY23 FY24 FY25 FY2
Slide 31: Commodity Derivatives Portfolio (as of September 2023)
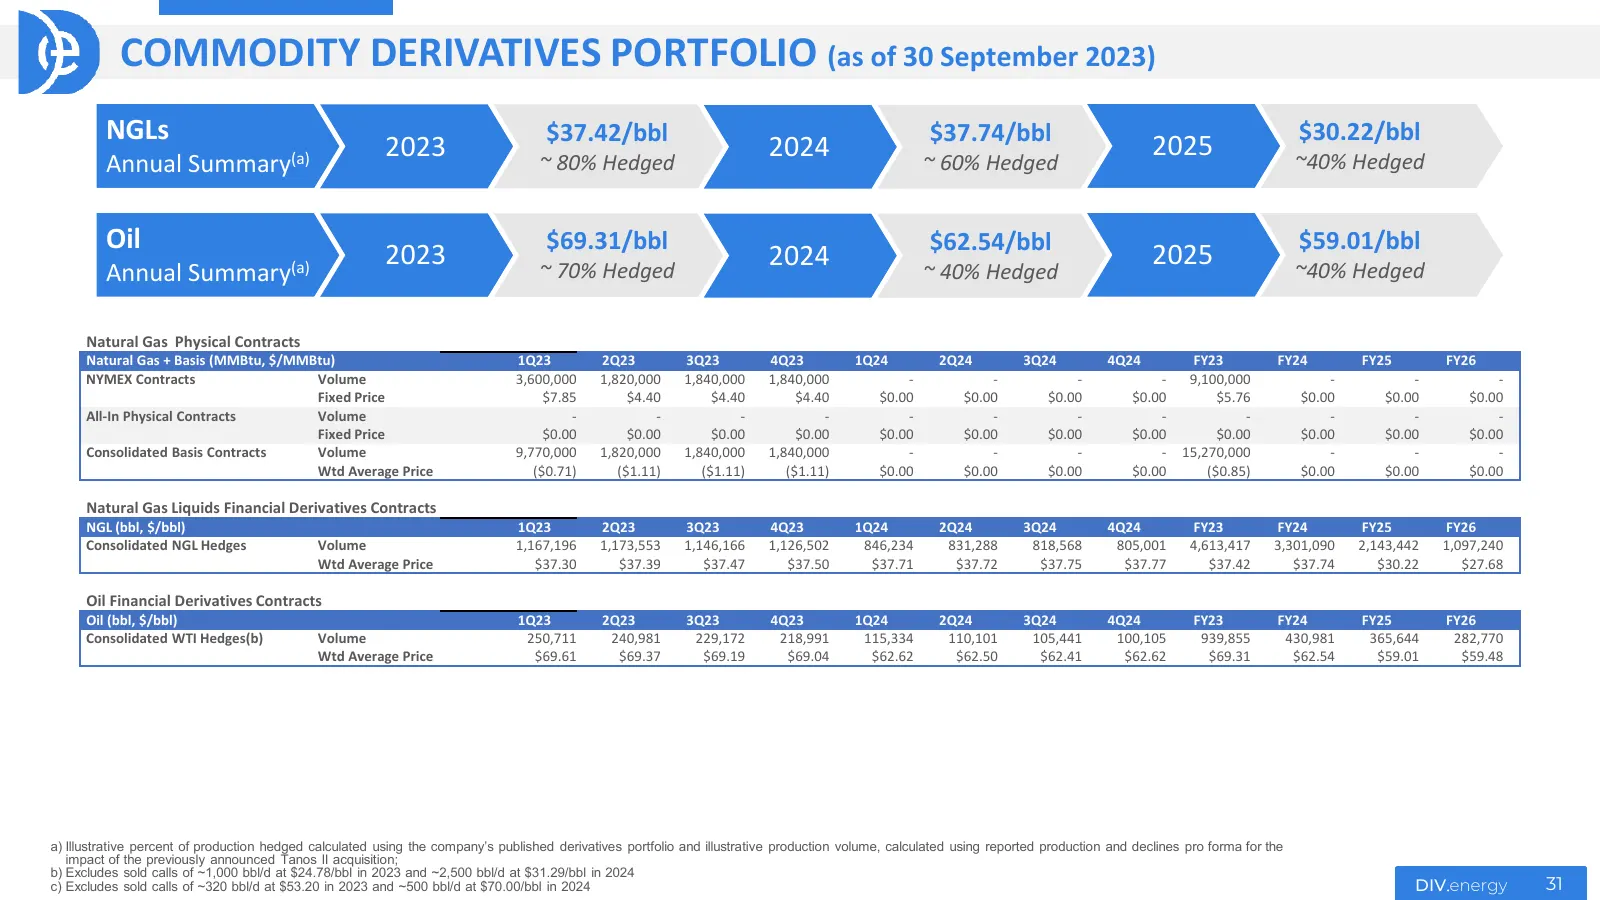
COMMODITY DERIVATIVES PORTFOLIO (as of 30 September 2023) NGLs $37.42/bbl $37.74/bbl $30.22/bbl 2023 2024 2025 Annual Summary(a) ~ 80% Hedged ~ 60% Hedged ~40% Hedged Oil $69.31/bbl $62.54/bbl $59.01/bbl 2023 2024 2025 Annual Summary(a) ~ 70% Hedged ~ 40% Hedged ~40% Hedged Natural Gas Physical Cont
Slide 32: Historical Operating Expenses by Nature
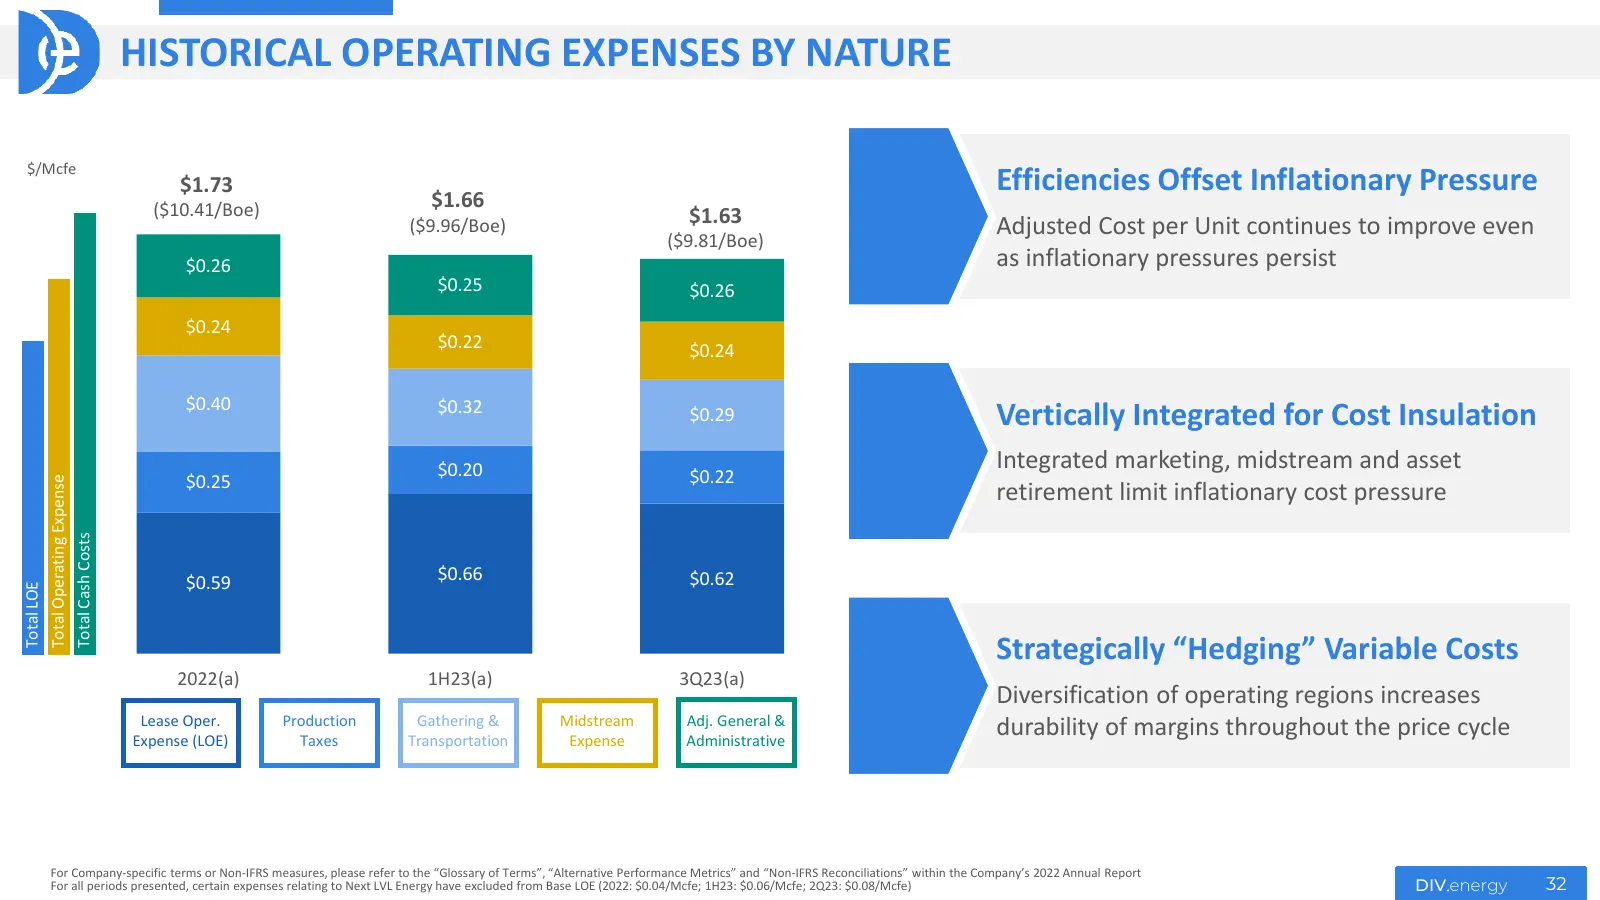
HISTORICAL OPERATING EXPENSES BY NATURE $/Mcfe $1.73 Efficiencies Offset Inflationary Pressure ($10.41/Boe) $1.66 ($9.96/Boe) $1.63 Adjusted Cost per Unit continues to improve even ($9.81/Boe) $0.26 as inflationary pressures persist $0.25 $0.26 $0.24 $0.22 $0.24 $0.40 $0.32 $0.29 Vertically Integrat
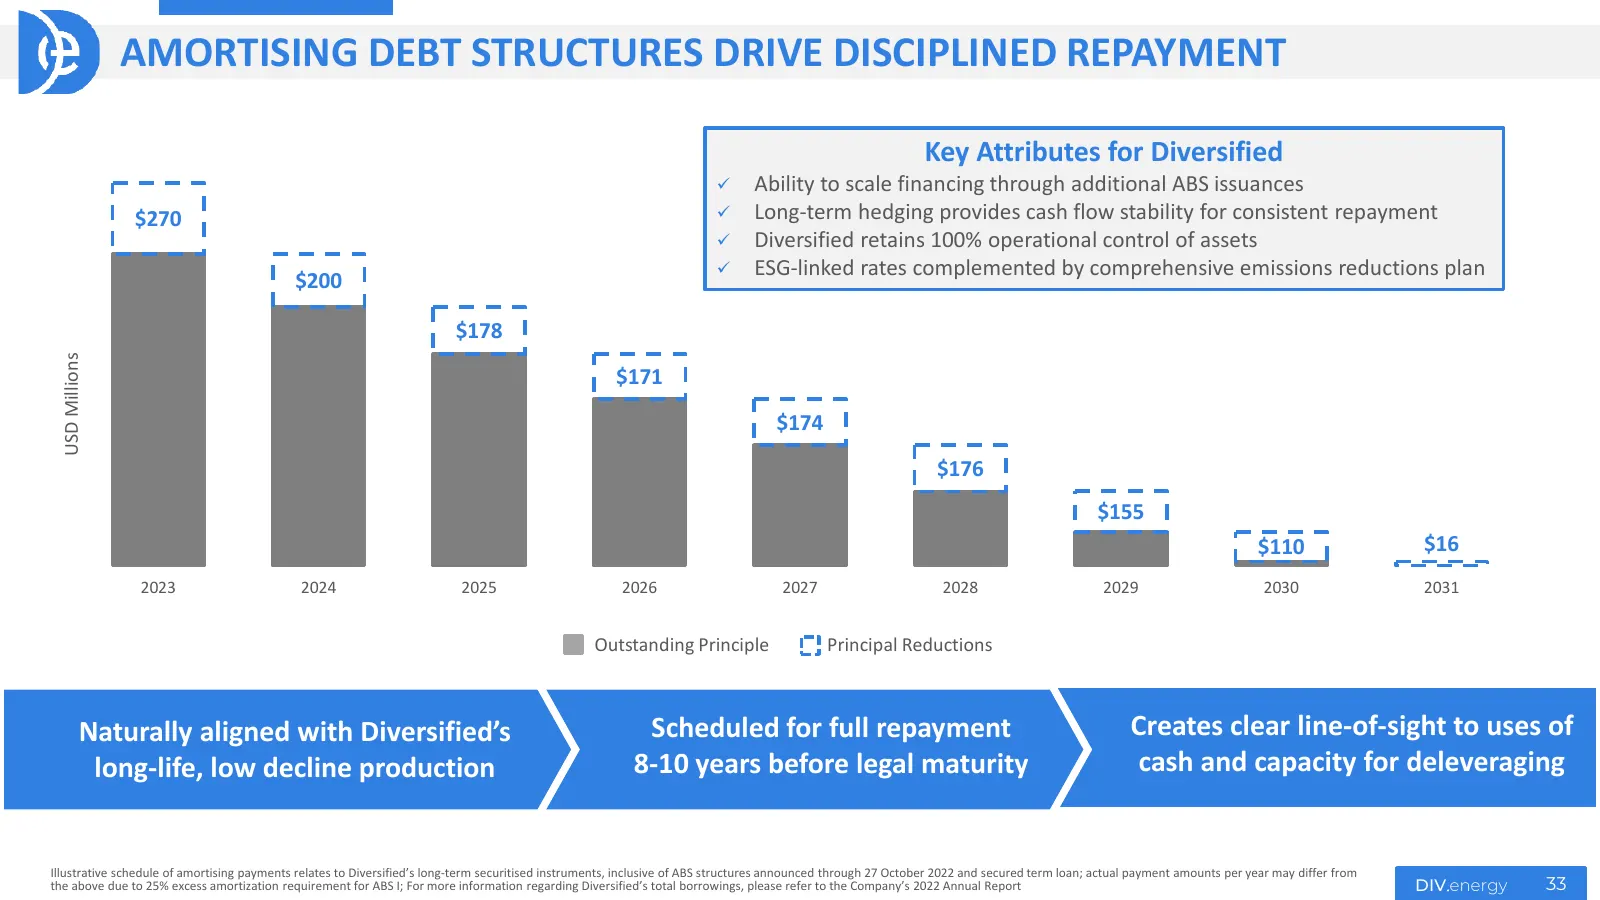
Slide 33: Amortising Debt Structures Drive Disciplined Repayment
AMORTISING DEBT STRUCTURES DRIVE DISCIPLINED REPAYMENT Key Attributes for Diversified Ability to scale financing through additional ABS issuances $270 Long-term hedging provides cash flow stability for consistent repayment Diversified retains 100% operational control of assets ESG-linked rat
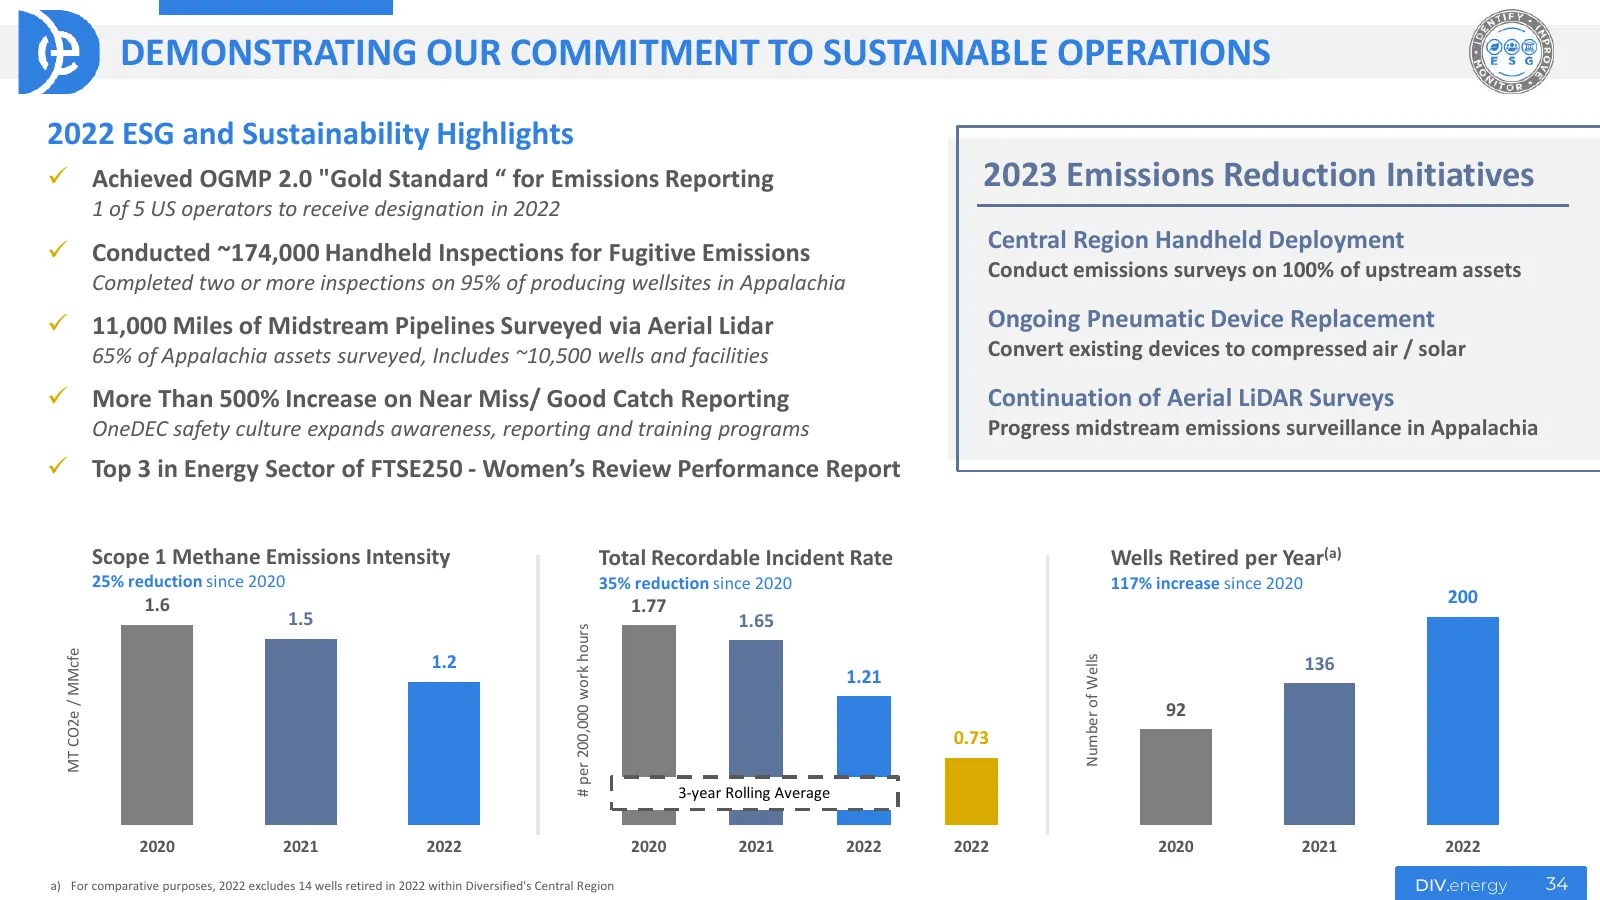
Slide 34: Demonstrating Our Commitment to Sustainable Operations
DEMONSTRATING OUR COMMITMENT TO SUSTAINABLE OPERATIONS 2022 ESG and Sustainability Highlights Achieved OGMP 2.0 "Gold Standard “ for Emissions Reporting 2023 Emissions Reduction Initiatives 1 of 5 US operators to receive designation in 2022 Conducted ~174,000 Handheld Inspections for Fugitive Em
Slide 35: Financial Statements
Financial Statements Including APMs and Non-IFRS Reconciliations DIV.energy
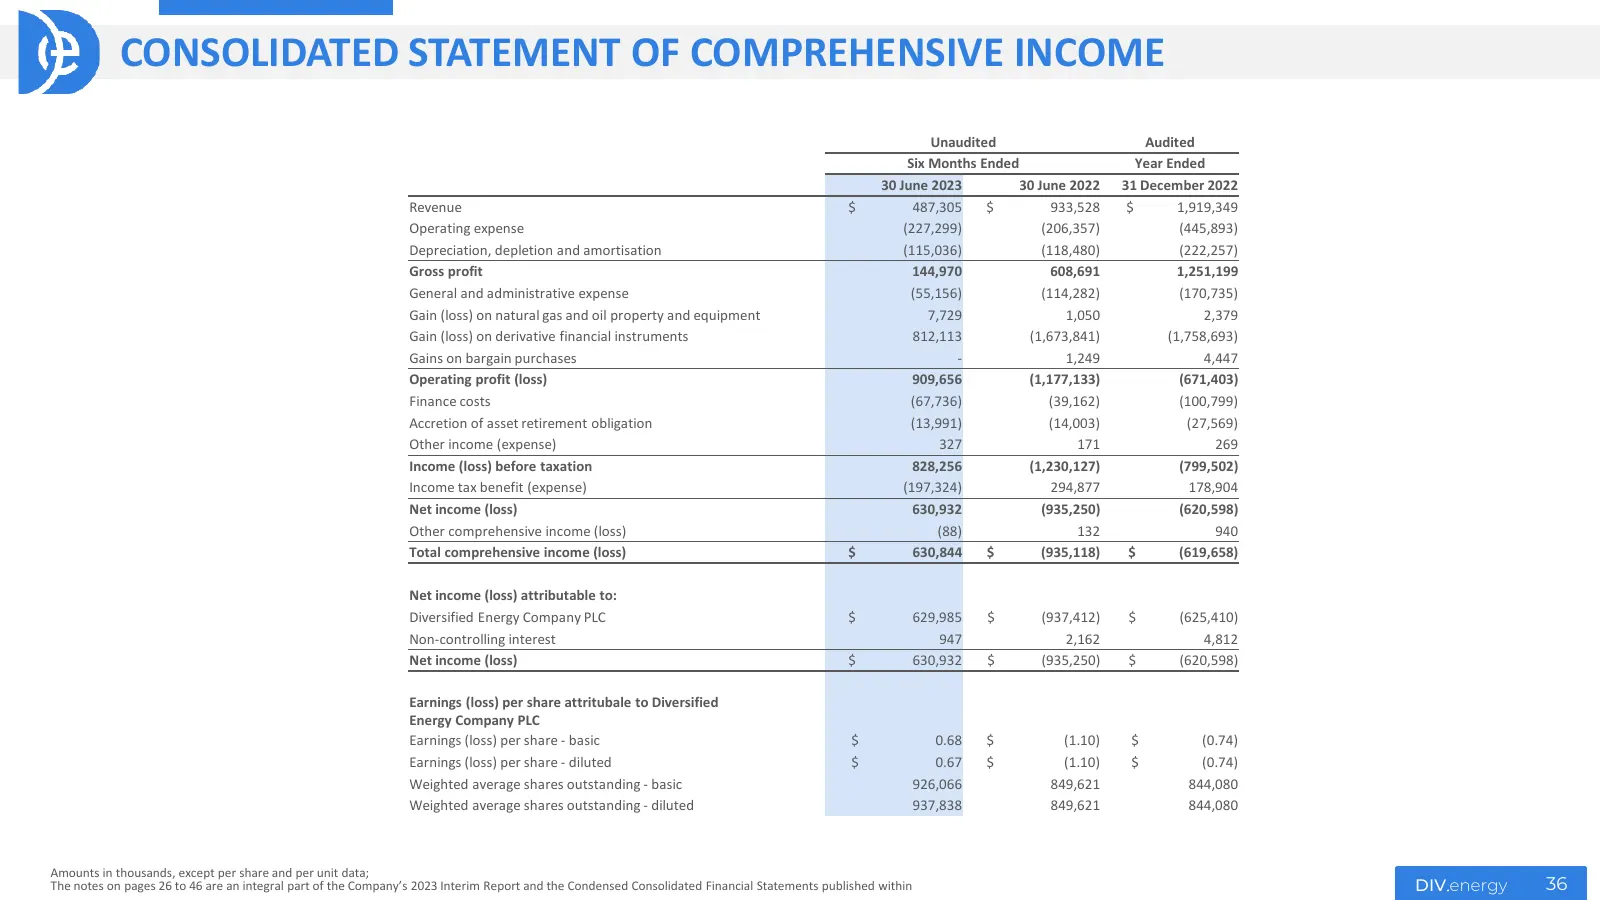
Slide 36: Consolidated Statement of Comprehensive Income
CONSOLIDATED STATEMENT OF COMPREHENSIVE INCOME Unaudited Audited Six Months Ended Year Ended 30 June 2023 30 June 2022 31 December 2022 Revenue $ 487,305 $ 933,528 $ 1,919,349 Operating expense (227,299) (206,357) (445,893) Depreciation, depletion and amortisation (115,036) (118,480) (222,257) Gross
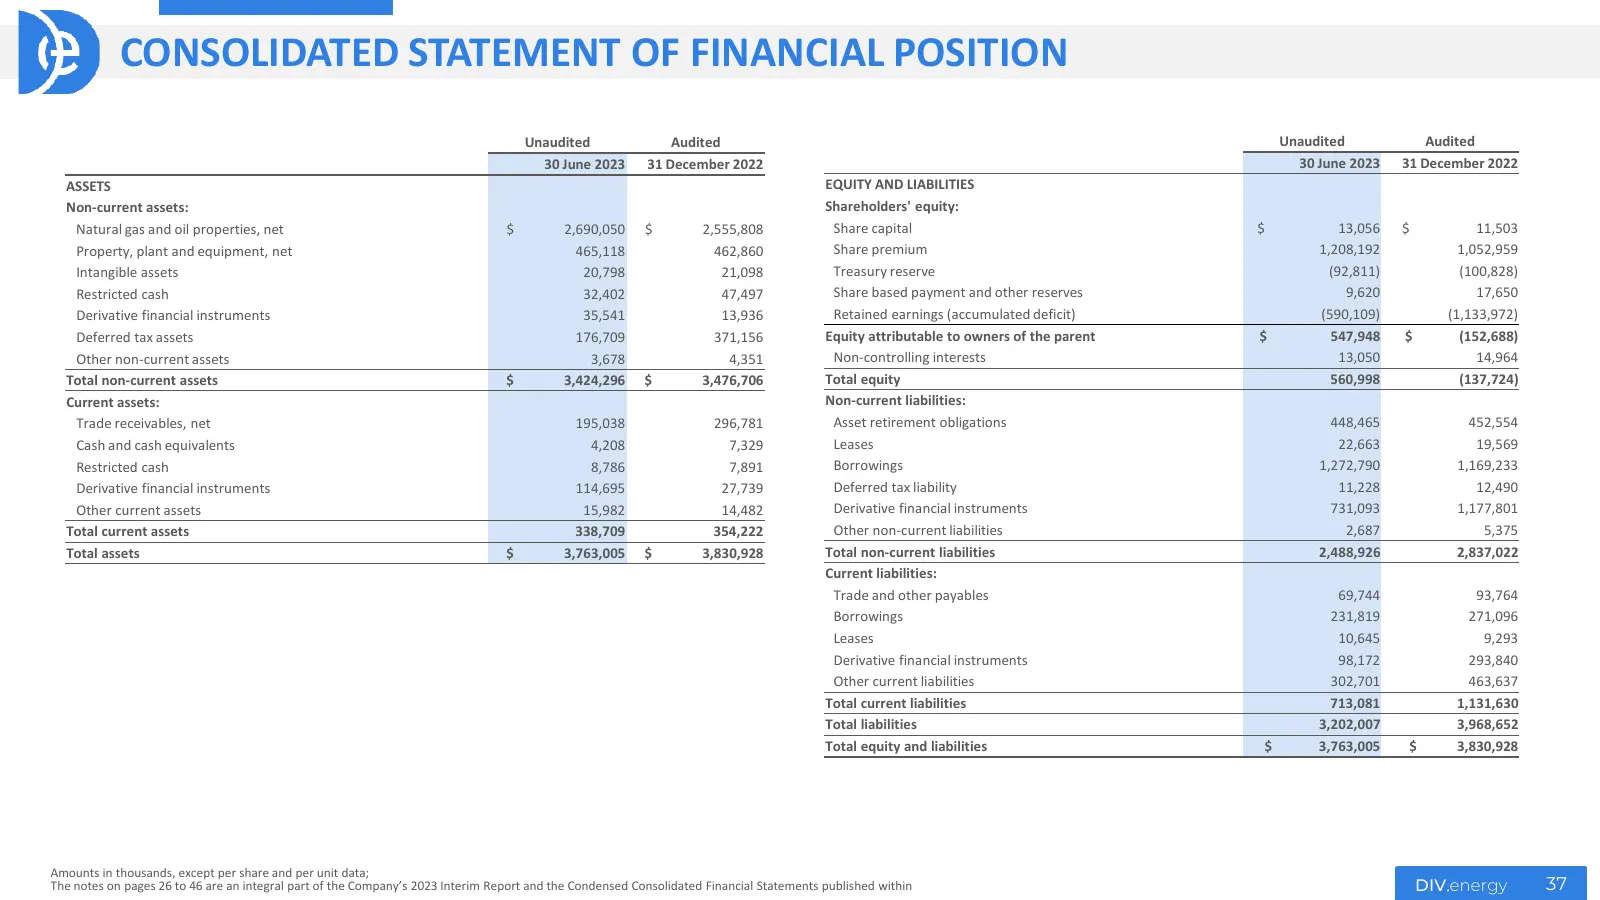
Slide 37: Consolidated Statement of Financial Position
CONSOLIDATED STATEMENT OF FINANCIAL POSITION Unaudited Audited Unaudited Audited 30 June 2023 31 December 2022 30 June 2023 31 December 2022 ASSETS EQUITY AND LIABILITIES Non-current assets: Shareholders' equity: Natural gas and oil properties, net $ 2,690,050 $ 2,555,808 Share capital $ 13,056 $ 11
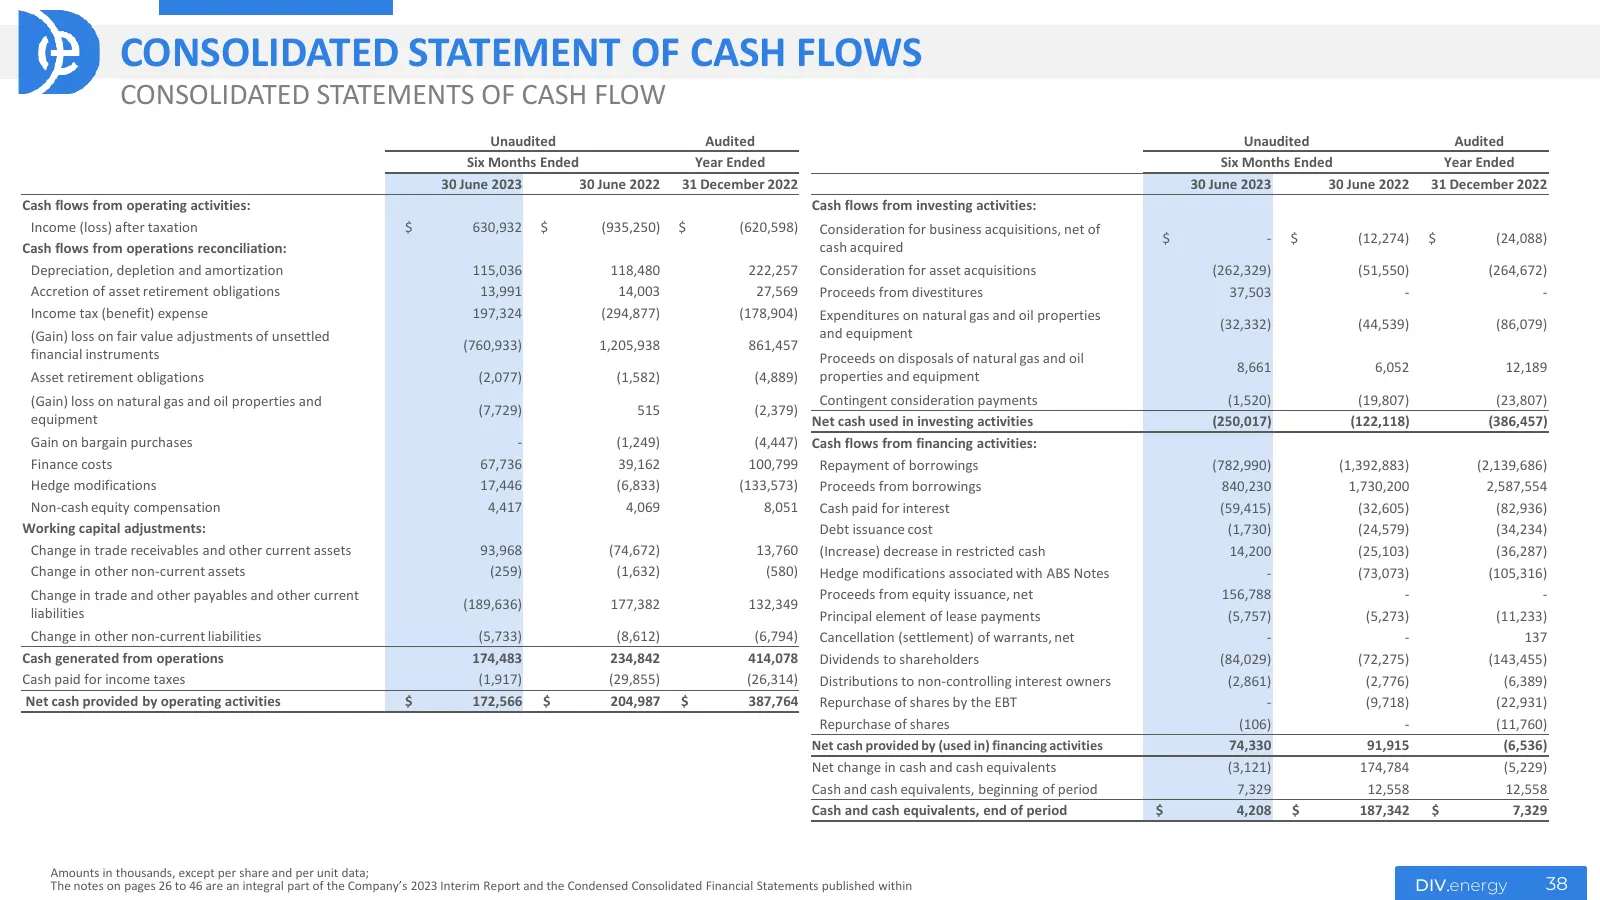
Slide 38: Consolidated Statement of Cash Flows
CONSOLIDATED STATEMENT OF CASH FLOWS CONSOLIDATED STATEMENTS OF CASH FLOW Unaudited Audited Unaudited Audited Six Months Ended Year Ended Six Months Ended Year Ended 30 June 2023 30 June 2022 31 December 2022 30 June 2023 30 June 2022 31 December 2022 Cash flows from operating activities: Cash flows
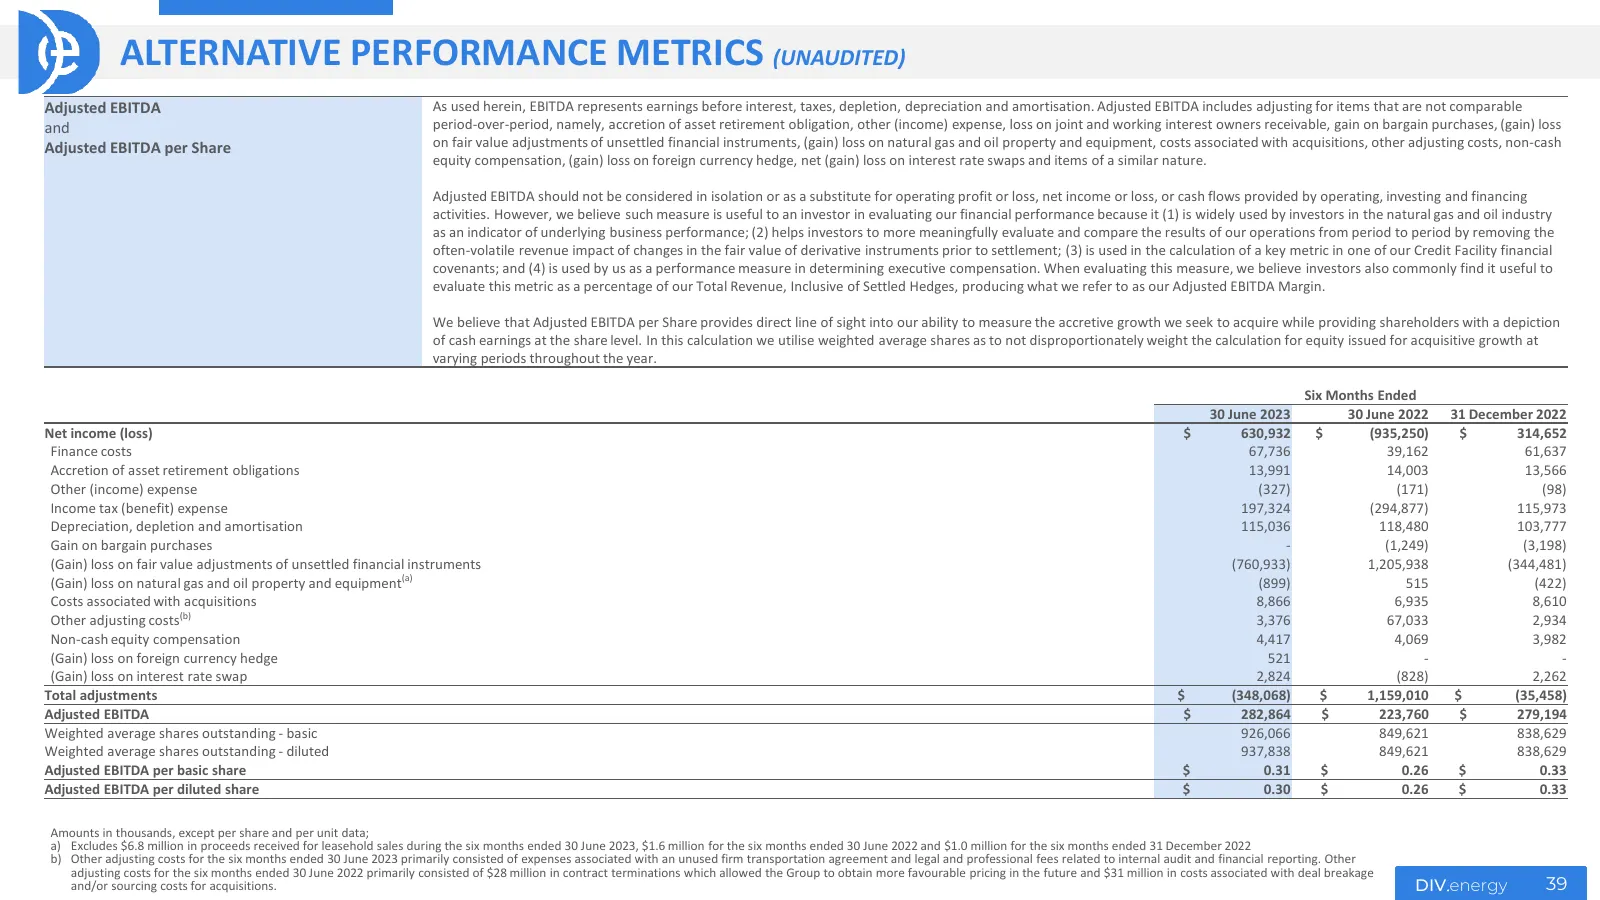
Slide 39: Alternative Performance Metrics (Unaudited)
ALTERNATIVE PERFORMANCE METRICS (UNAUDITED) Adjusted EBITDA As used herein, EBITDA represents earnings before interest, taxes, depletion, depreciation and amortisation. Adjusted EBITDA includes adjusting for items that are not comparable and period-over-period, namely, accretion of asset retirement
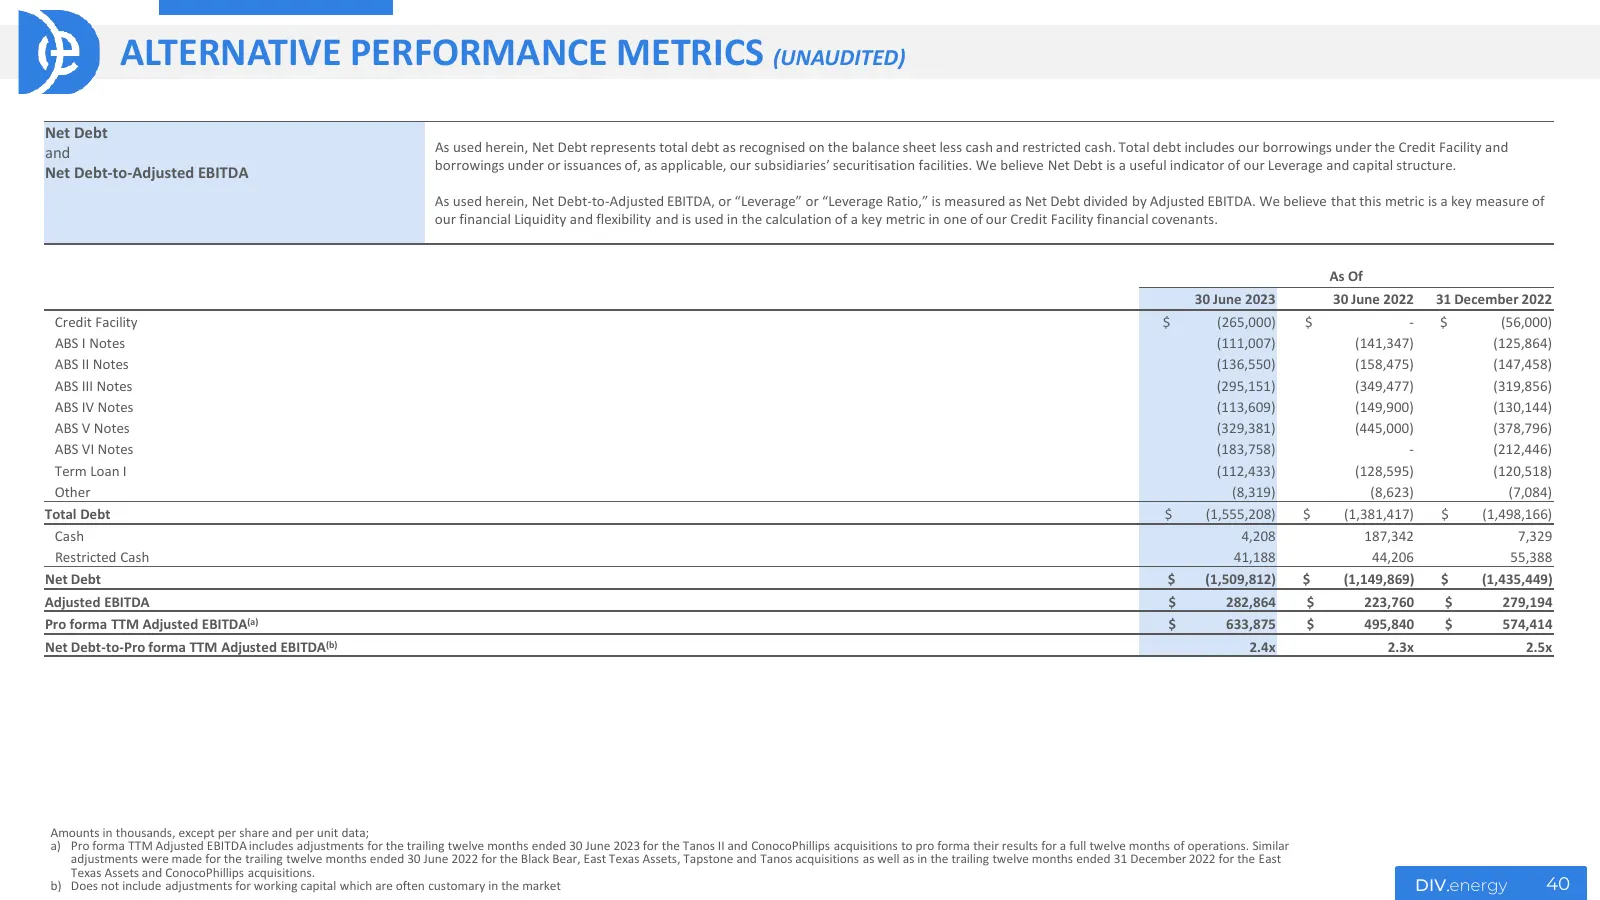
Slide 40: Alternative Performance Metrics (Unaudited)
ALTERNATIVE PERFORMANCE METRICS (UNAUDITED) Net Debt and As used herein, Net Debt represents total debt as recognised on the balance sheet less cash and restricted cash. Total debt includes our borrowings under the Credit Facility and borrowings under or issuances of, as applicable, our subsidiaries
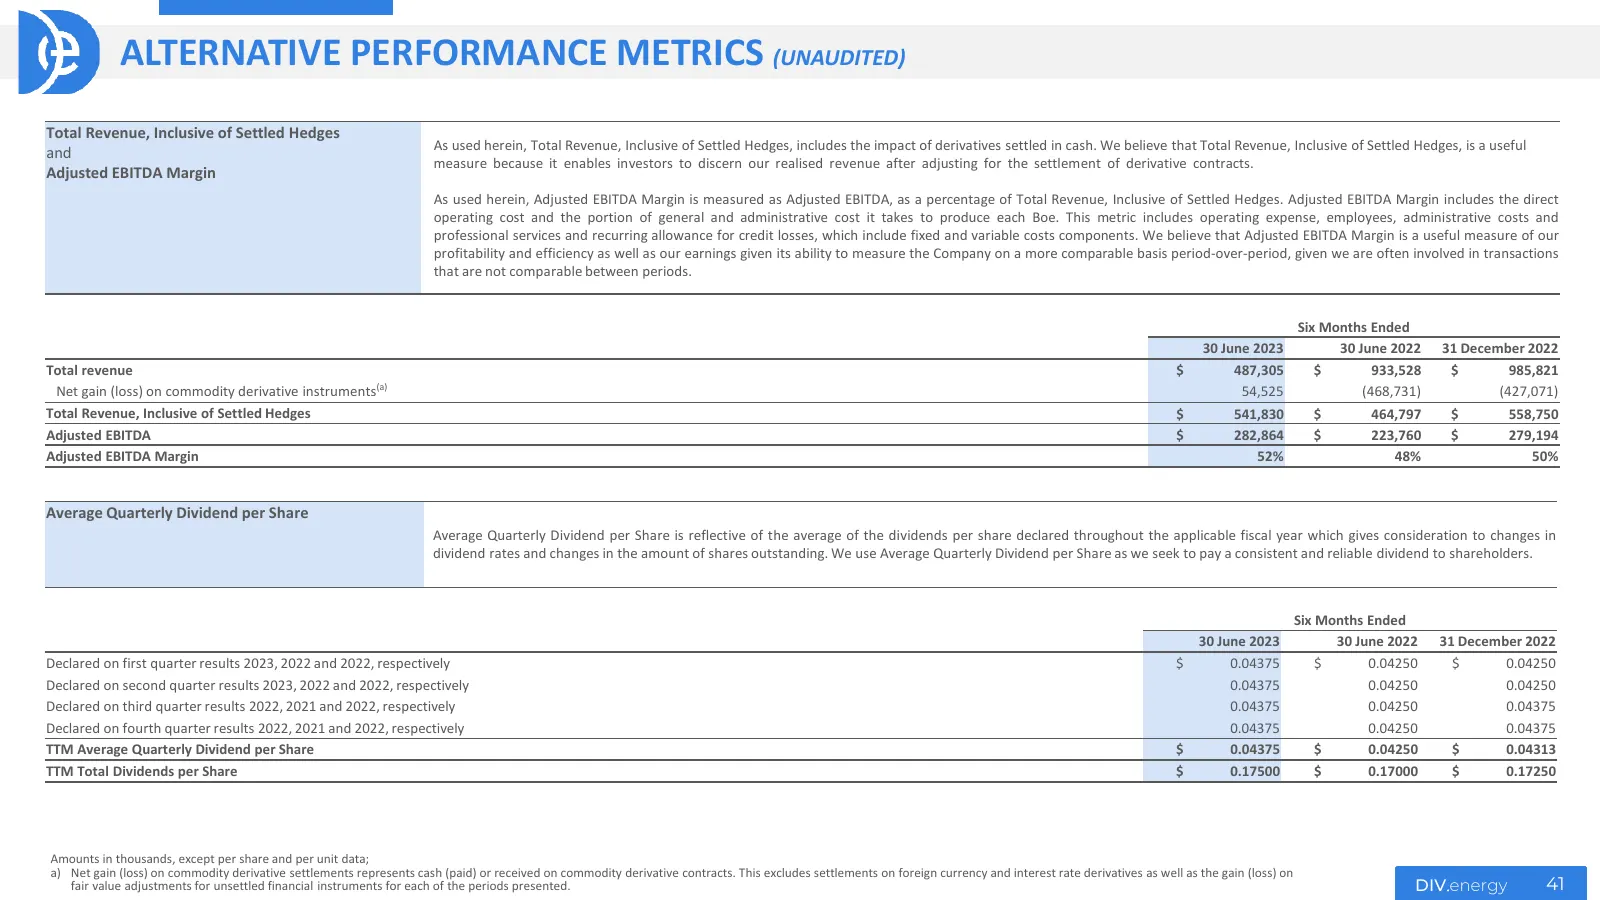
Slide 41: Alternative Performance Metrics (Unaudited)
ALTERNATIVE PERFORMANCE METRICS (UNAUDITED) Total Revenue, Inclusive of Settled Hedges As used herein, Total Revenue, Inclusive of Settled Hedges, includes the impact of derivatives settled in cash. We believe that Total Revenue, Inclusive of Settled Hedges, is a useful and measure because it enable
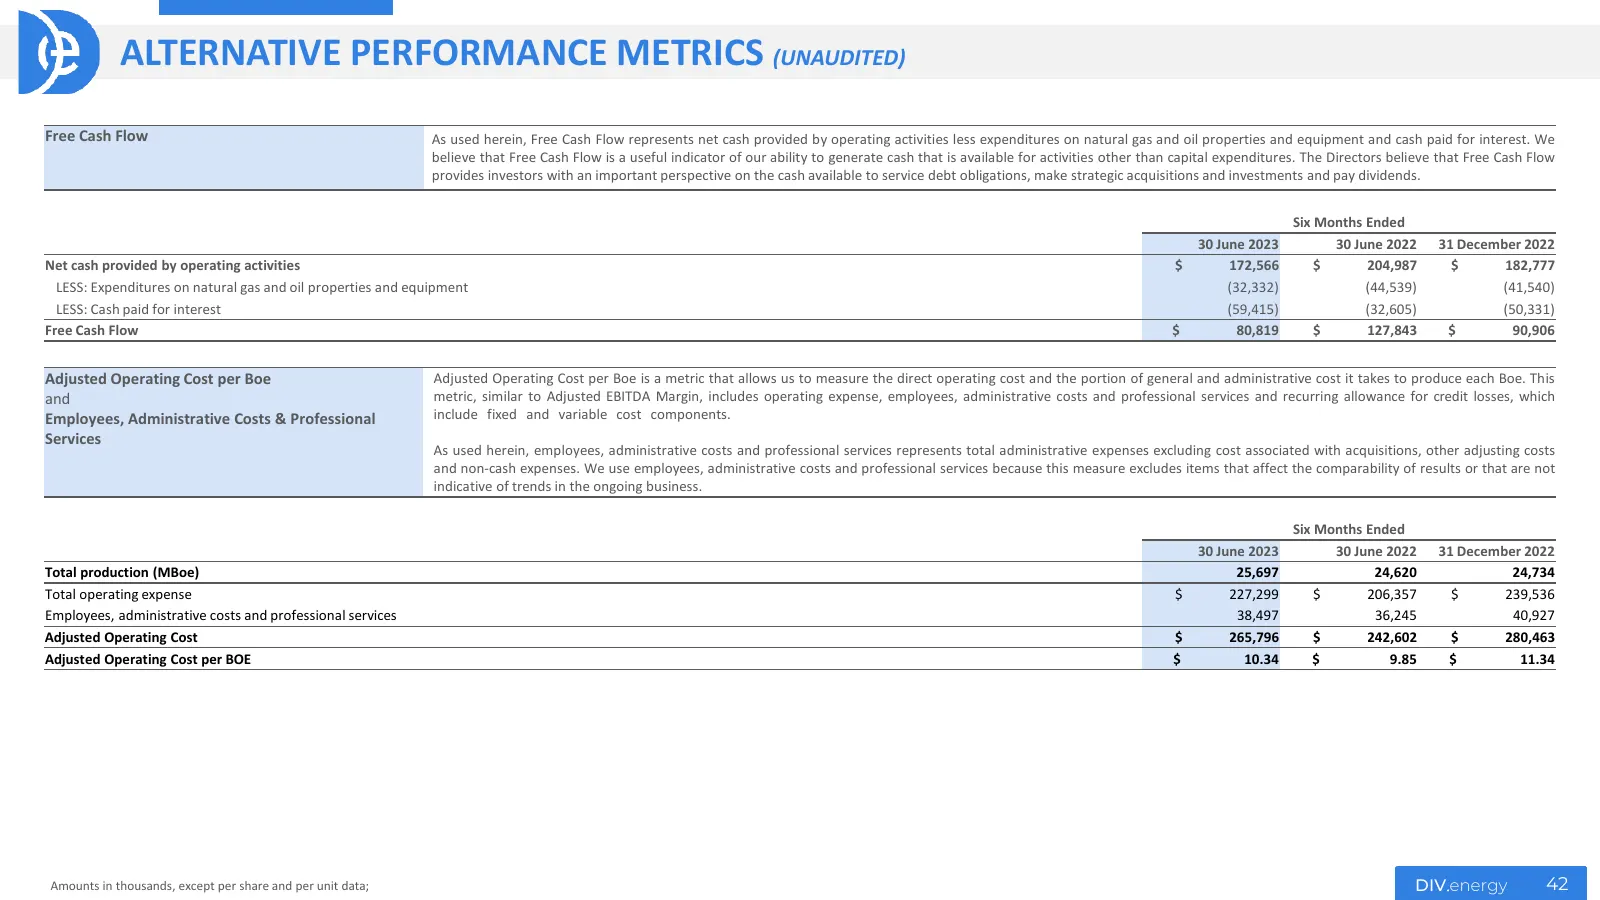
Slide 42: Alternative Performance Metrics (Unaudited)
ALTERNATIVE PERFORMANCE METRICS (UNAUDITED) Free Cash Flow As used herein, Free Cash Flow represents net cash provided by operating activities less expenditures on natural gas and oil properties and equipment and cash paid for interest. We believe that Free Cash Flow is a useful indicator of our abi
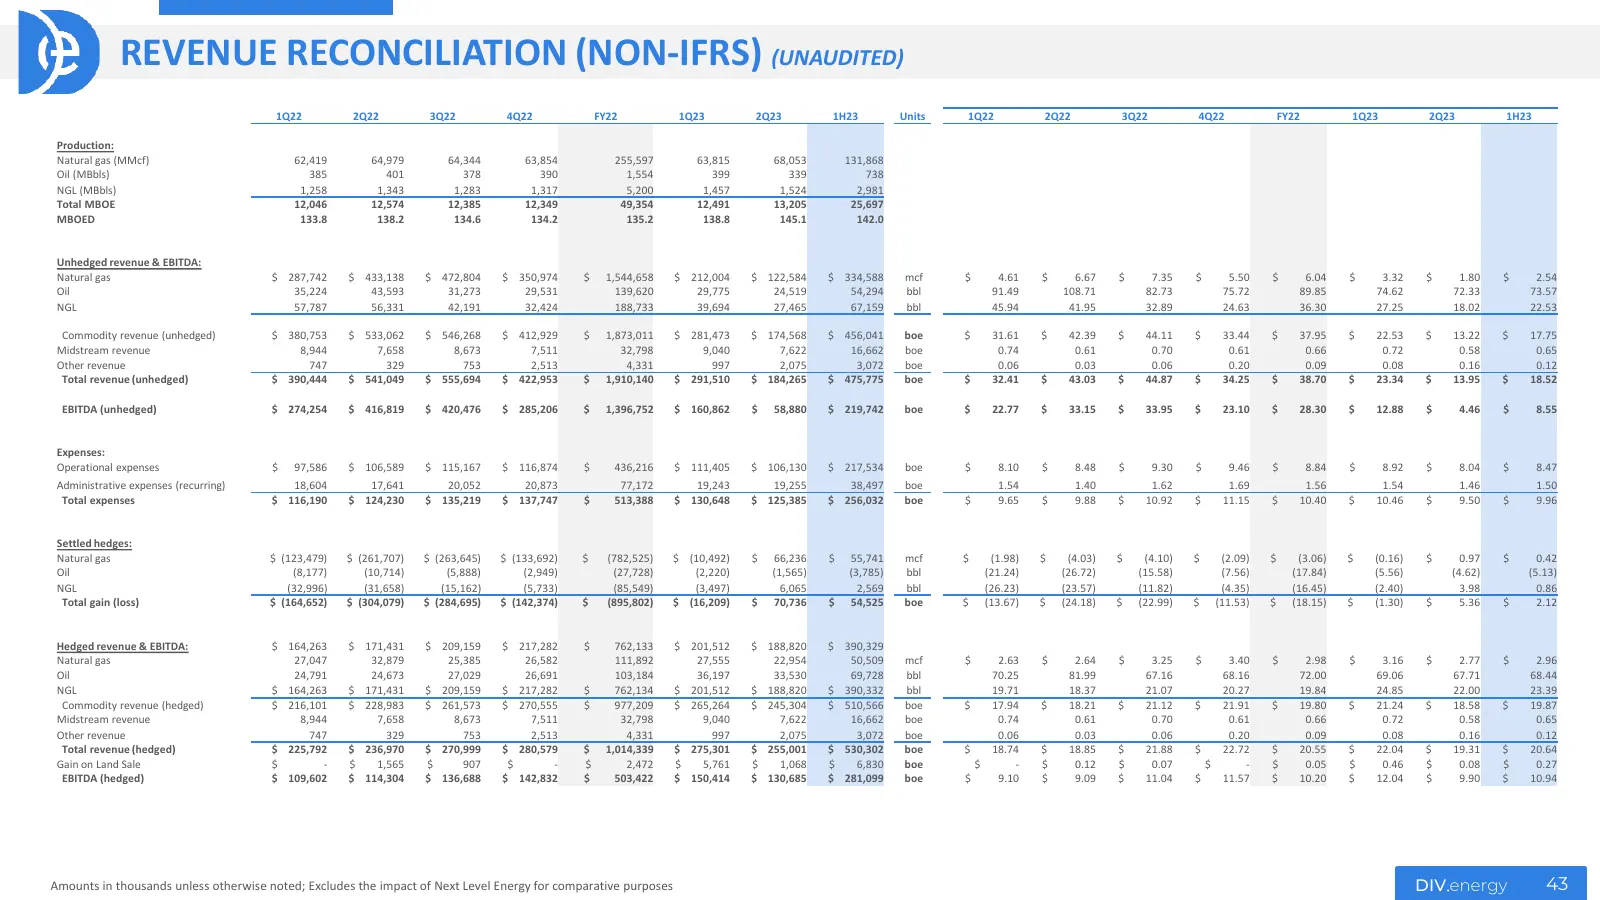
Slide 43: Revenue Reconciliation (Non-IFRS) (Unaudited)
REVENUE RECONCILIATION (NON-IFRS) (UNAUDITED) 1Q22 2Q22 3Q22 4Q22 FY22 1Q23 2Q23 1H23 Units 1Q22 2Q22 3Q22 4Q22 FY22 1Q23 2Q23 1H23 Production: Natural gas (MMcf) 62,419 64,979 64,344 63,854 255,597 63,815 68,053 131,868 Oil (MBbls) 385 401 378 390 1,554 399 339 738 NGL (MBbls) 1,258 1,343 1,283 1,3
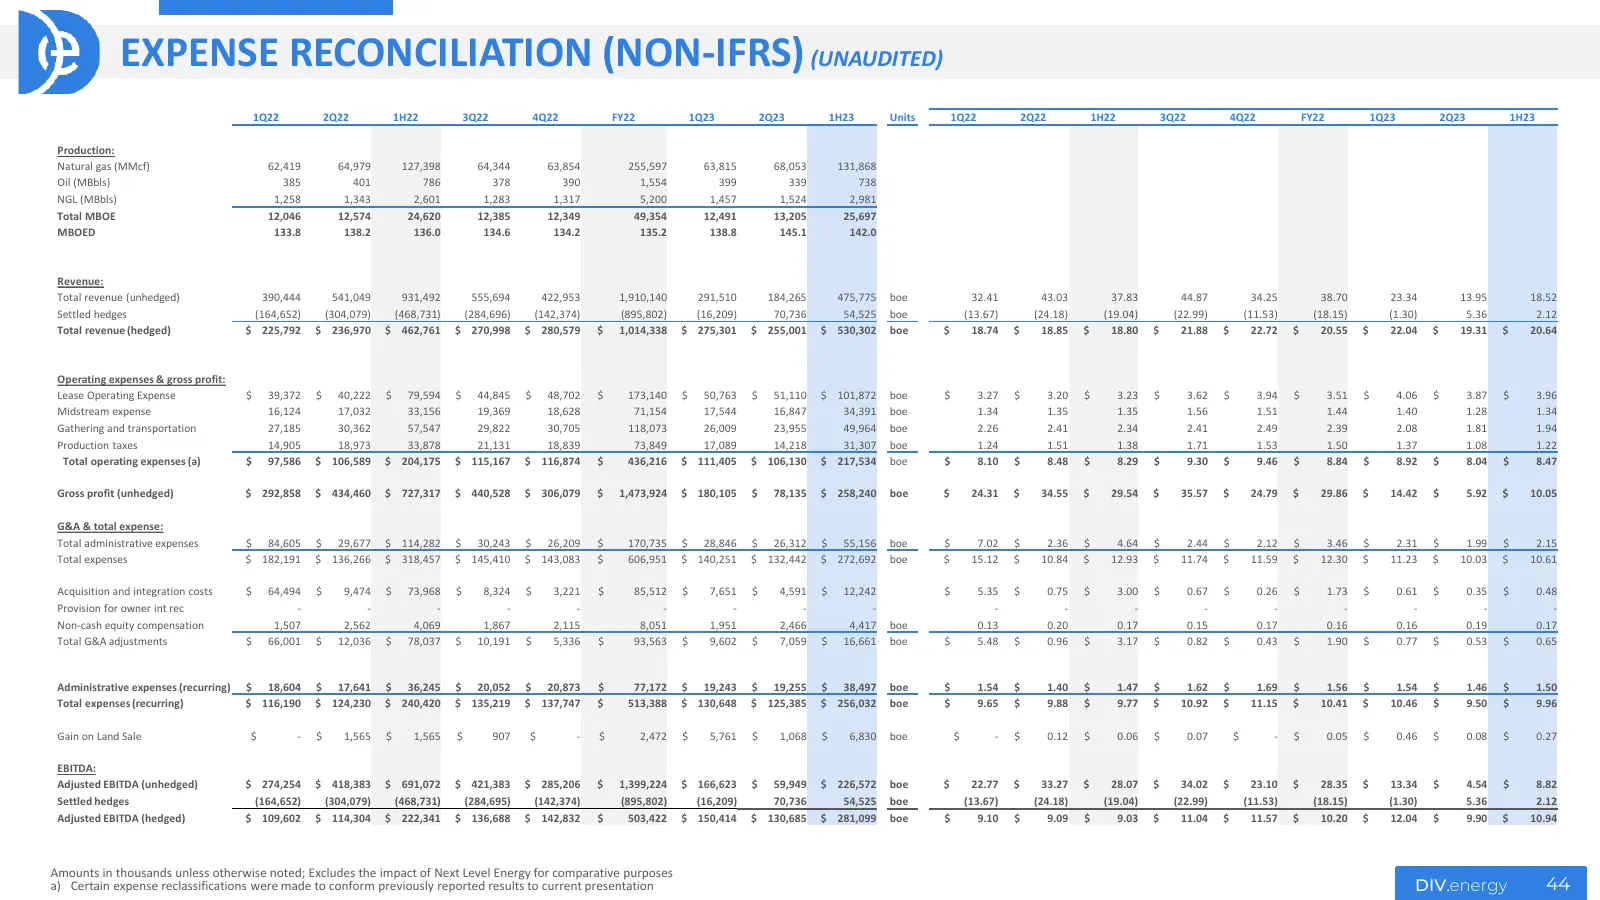
Slide 44: Expense Reconciliation (Non-IFRS) (Unaudited)
EXPENSE RECONCILIATION (NON-IFRS) (UNAUDITED) 1Q22 2Q22 1H22 3Q22 4Q22 FY22 1Q23 2Q23 1H23 Units 1Q22 2Q22 1H22 3Q22 4Q22 FY22 1Q23 2Q23 1H23 Production: Natural gas (MMcf) 62,419 64,979 127,398 64,344 63,854 255,597 63,815 68,053 131,868 Oil (MBbls) 385 401 786 378 390 1,554 399 339 738 NGL (MBbls)
Slide 45: Diversified Brokers
DIVERSIFIED BROKERS Corporate Tennyson Stifel Peel Hunt PO Box 381087 Tennyson Securities Stifel Nicolaus Europe Ltd Peel Hunt LLP Birmingham, Alabama 65 Petty France 150 Cheapside 100 Liverpool Street 35238-1087 (USA) London SW1H 9EU London EC2V 6ET London EC2M 2AT div.energy chton@peelhunt.com Dou
Source: Internet Archive copy of div.energy
More decks from Diversified Energy Company
 Q3 2026 Earnings Presentation16 slides · Nov 7, 2026
 Investor Presentation (November 2026)51 slides · Nov 6, 2026
 Merger or Acquisition (September 2026)13 slides · Sep 2, 2026
 Investor Presentation (August 2026)48 slides · Aug 7, 2026
 Q2 2026 Earnings Presentation14 slides · Aug 6, 2026
 Investor Presentation (May 2026)50 slides · May 8, 2026