Valero Energy Partners LP — Barclays MLP Corporate Access Day March 2015
18 slides from Valero Energy Partners LP's conference presentation, Mar 3, 2015
Slide 1: Barclays MLP Corporate Access Day
Exhibit 99.01 Barclays MLP Corporate Access Day March 2015
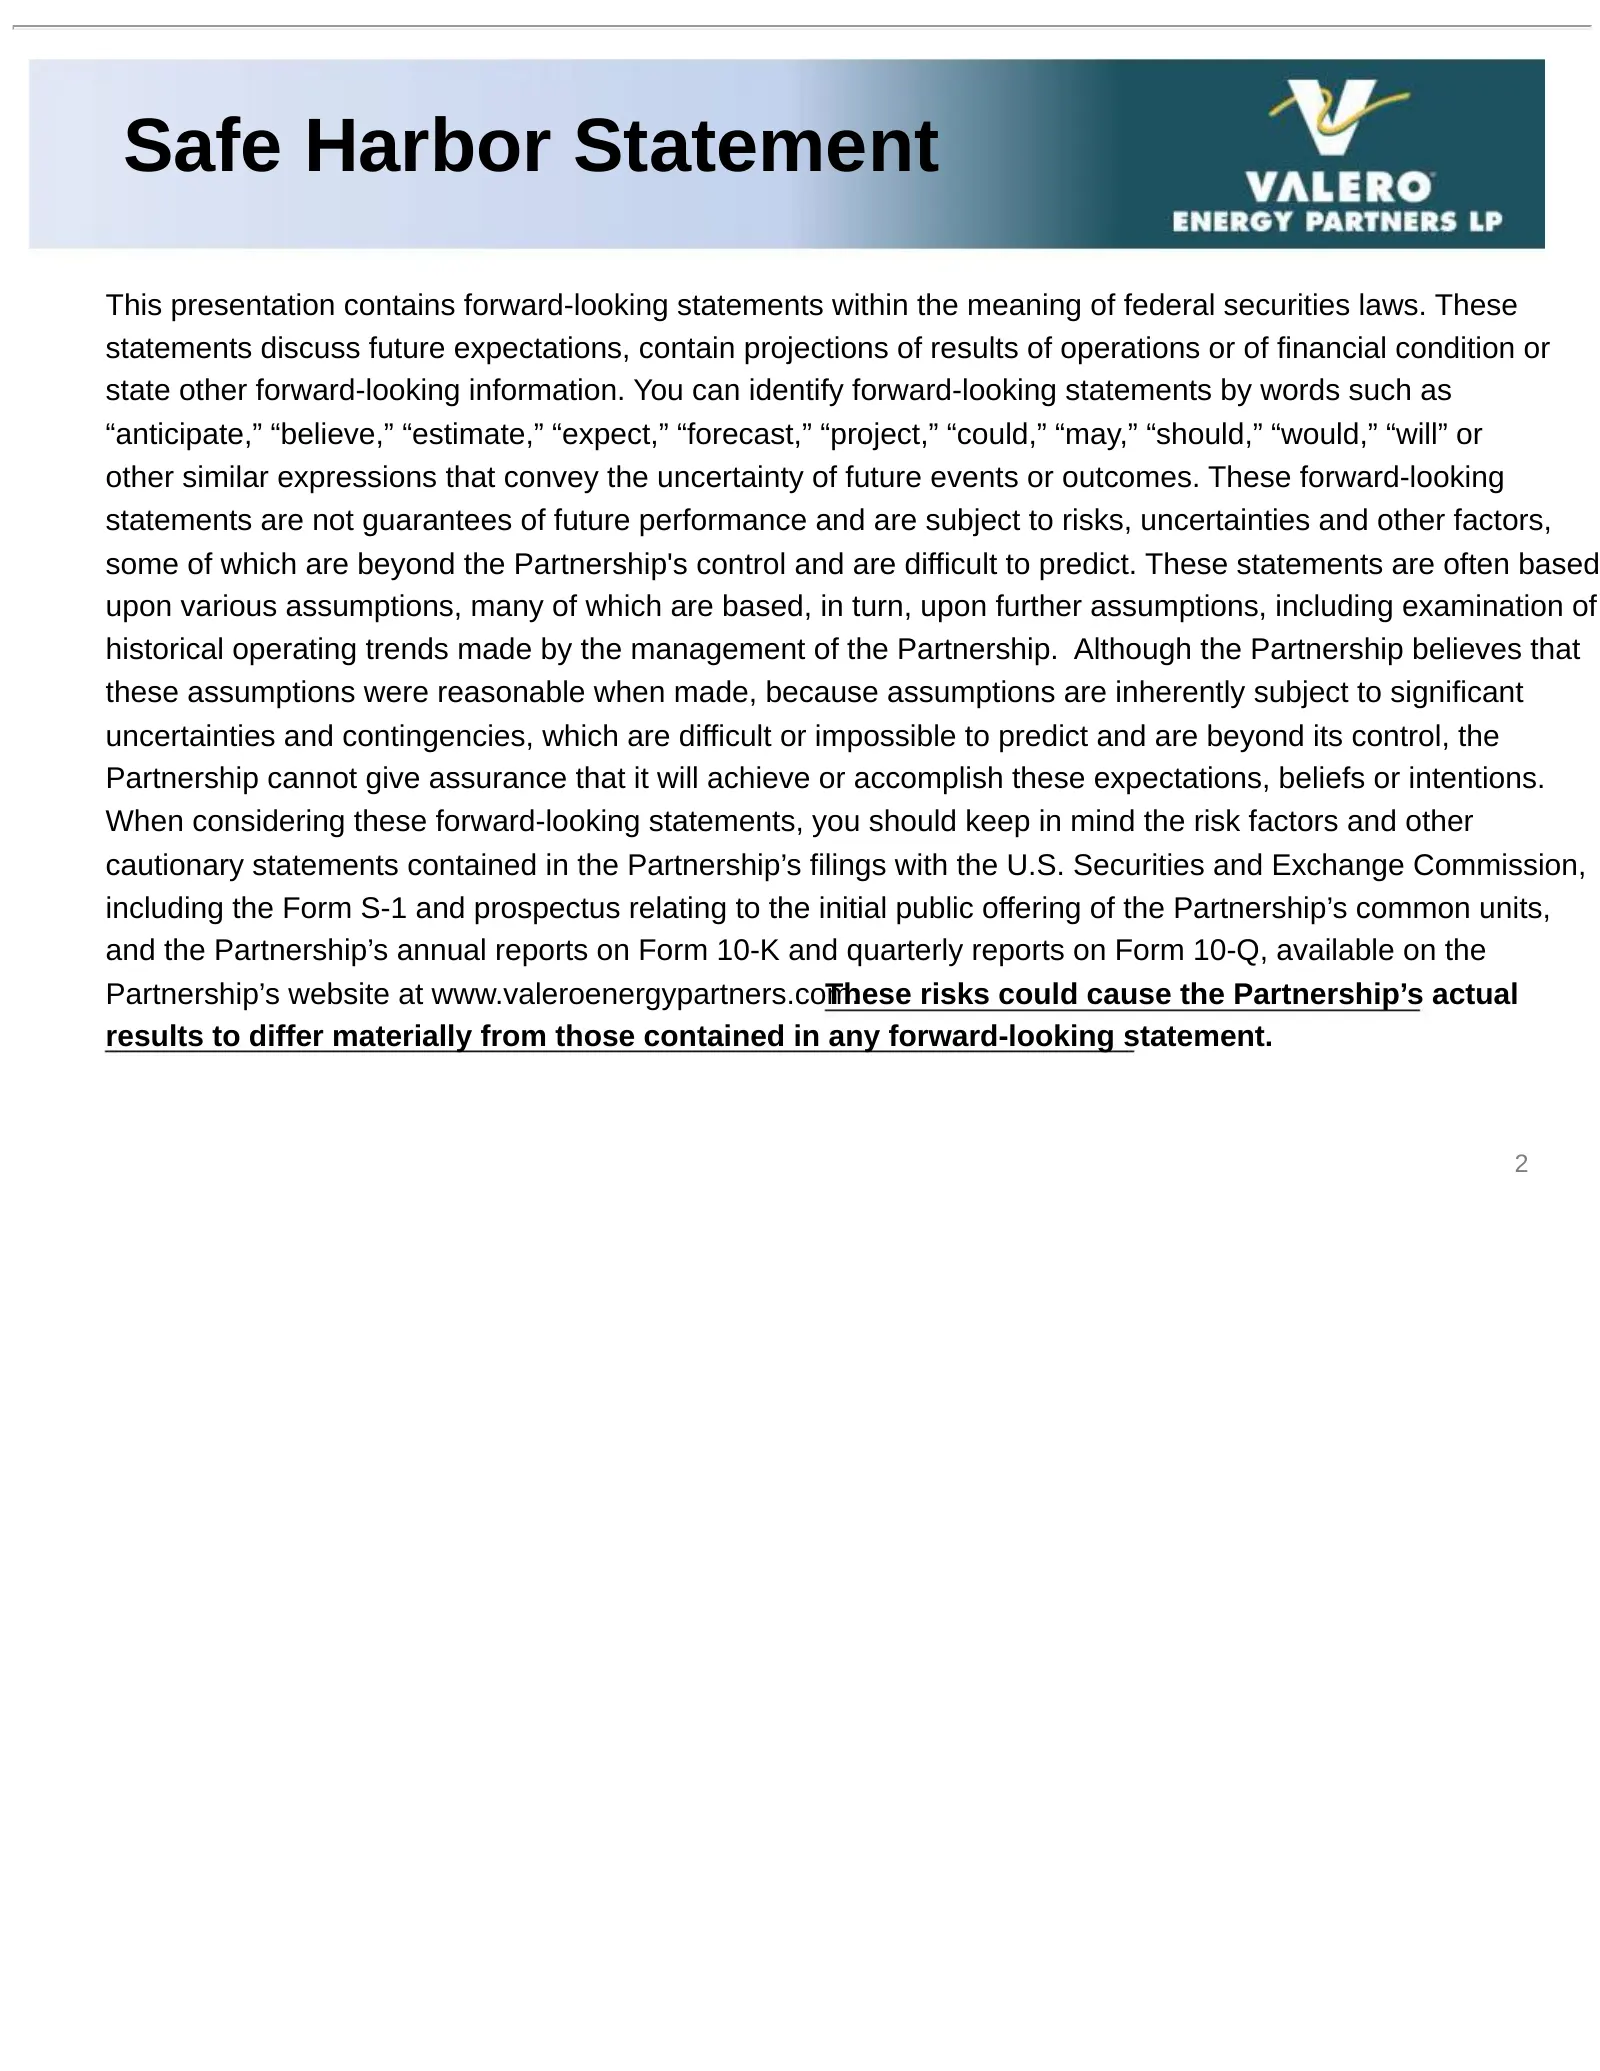
Slide 2: Safe Harbor Statement
Safe Harbor Statement This presentation contains forward-looking statements within the meaning of federal securities laws. These statements discuss future expectations, contain projections of results of operations or of financial condition or state other forward-looking information. You can identify
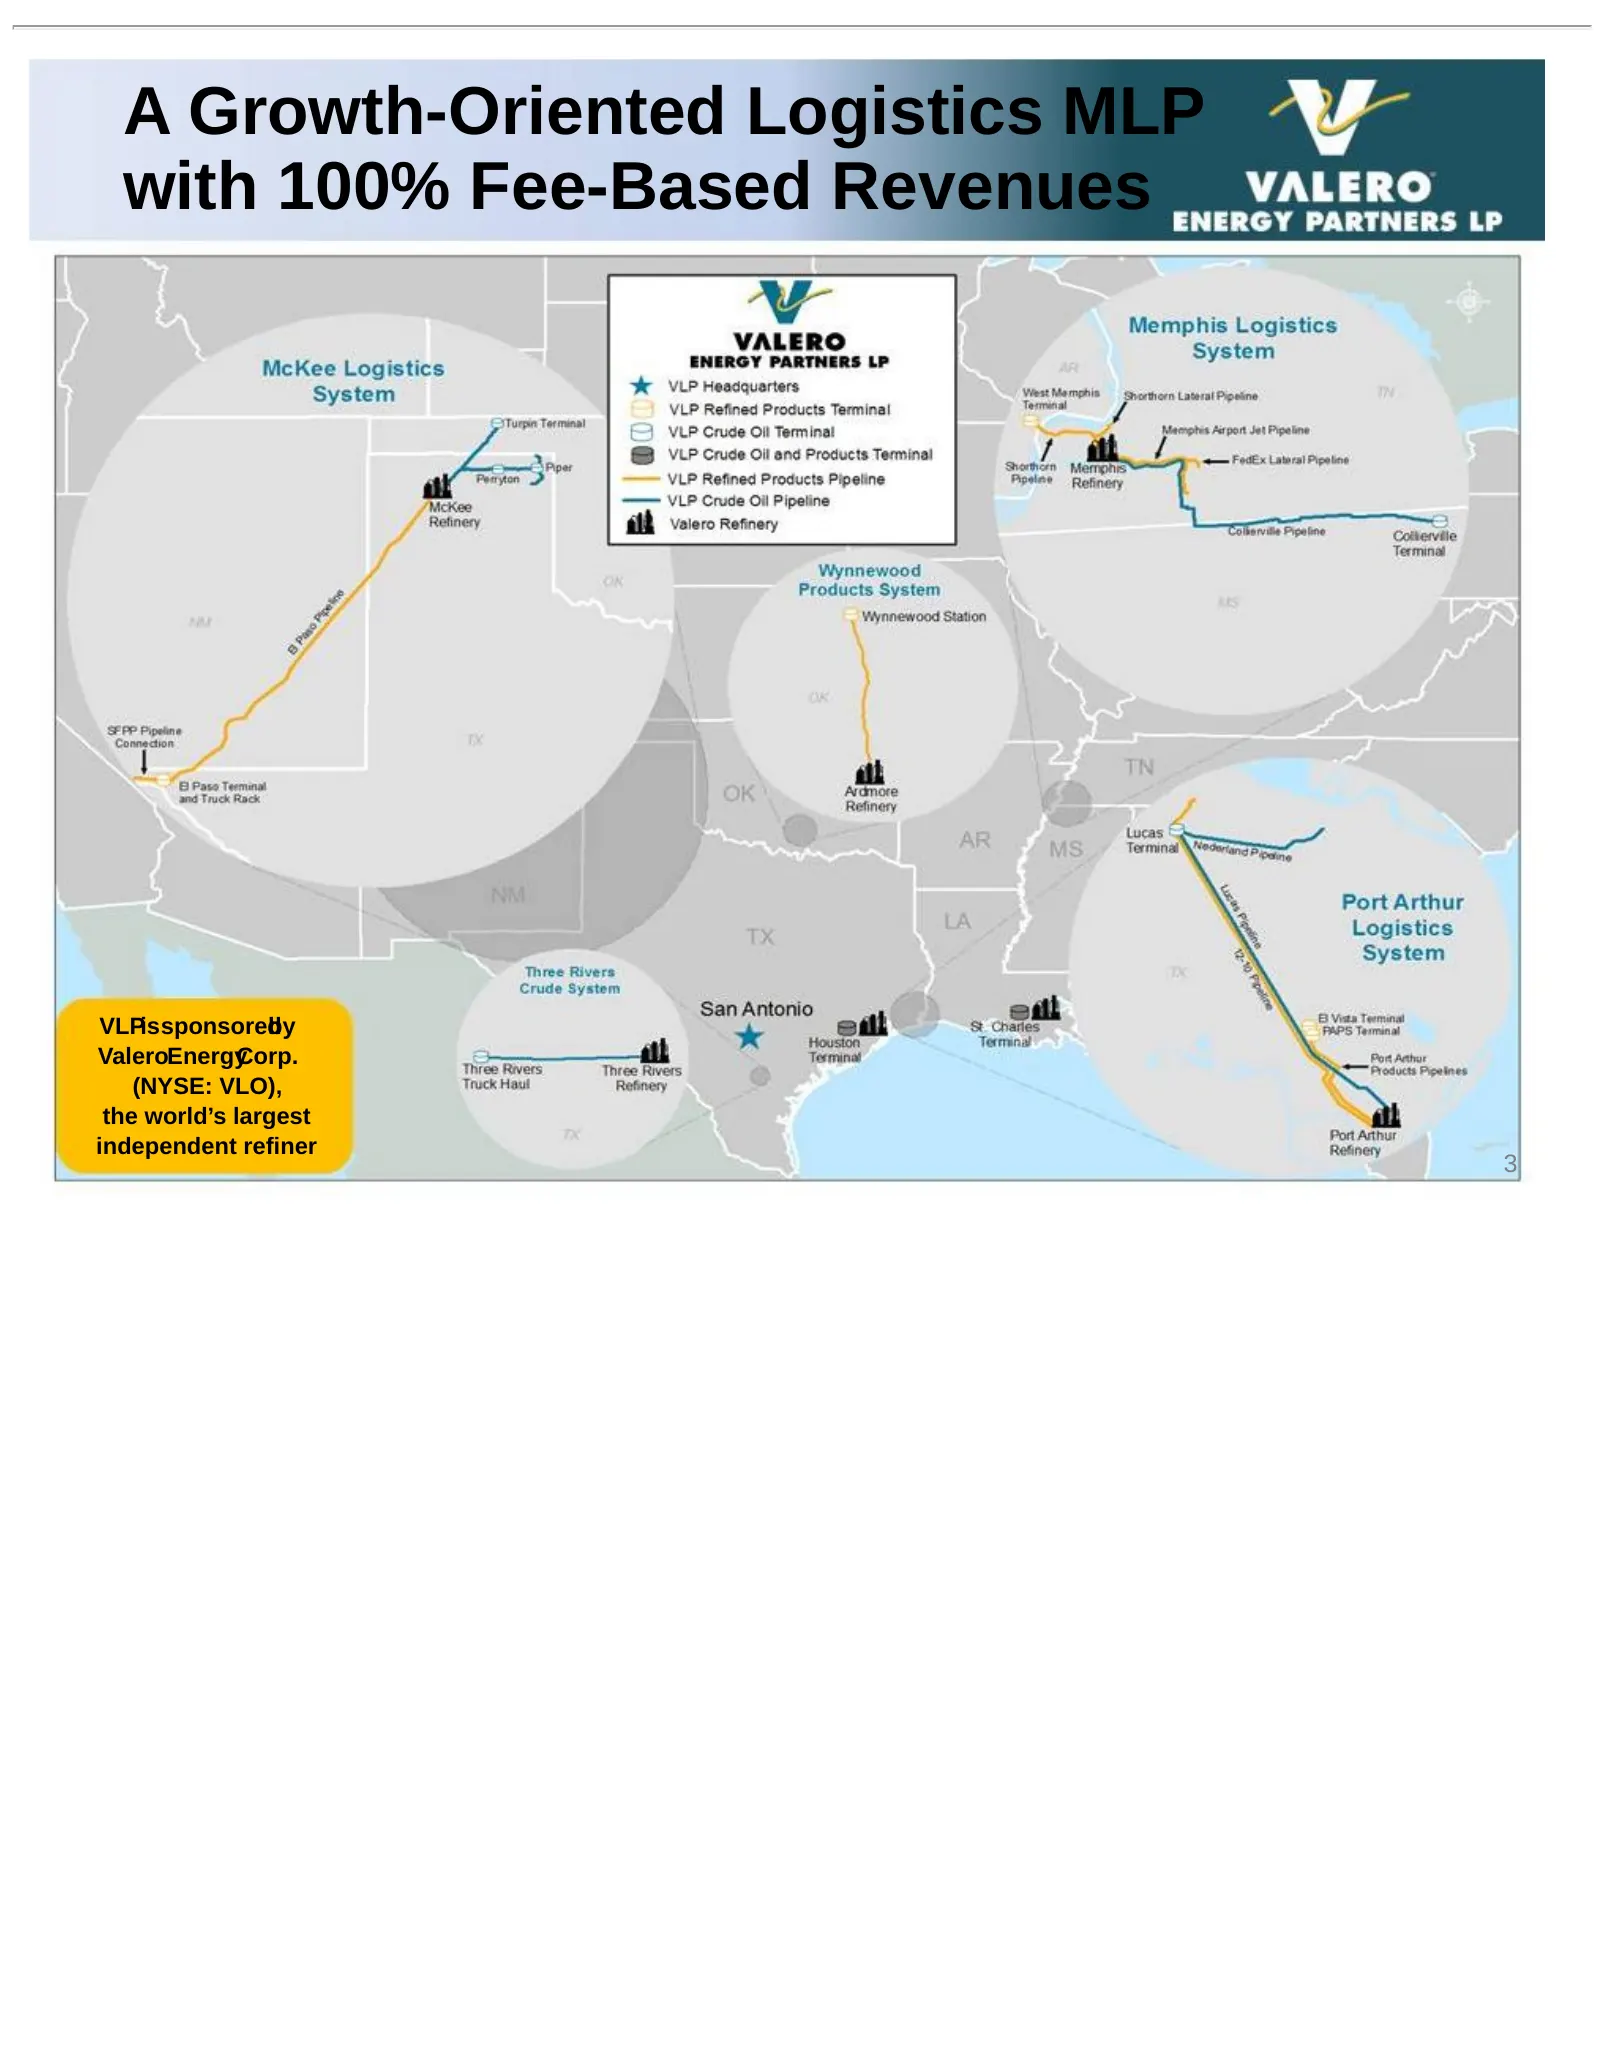
Slide 3: A Growth-Oriented Logistics MLP with 100% Fee-Based Revenues
A Growth-Oriented Logistics MLP with 100% Fee-Based Revenues VLPissponsored by ValeroEnergyCorp. (NYSE: VLO), the world’s largest independent refiner 3
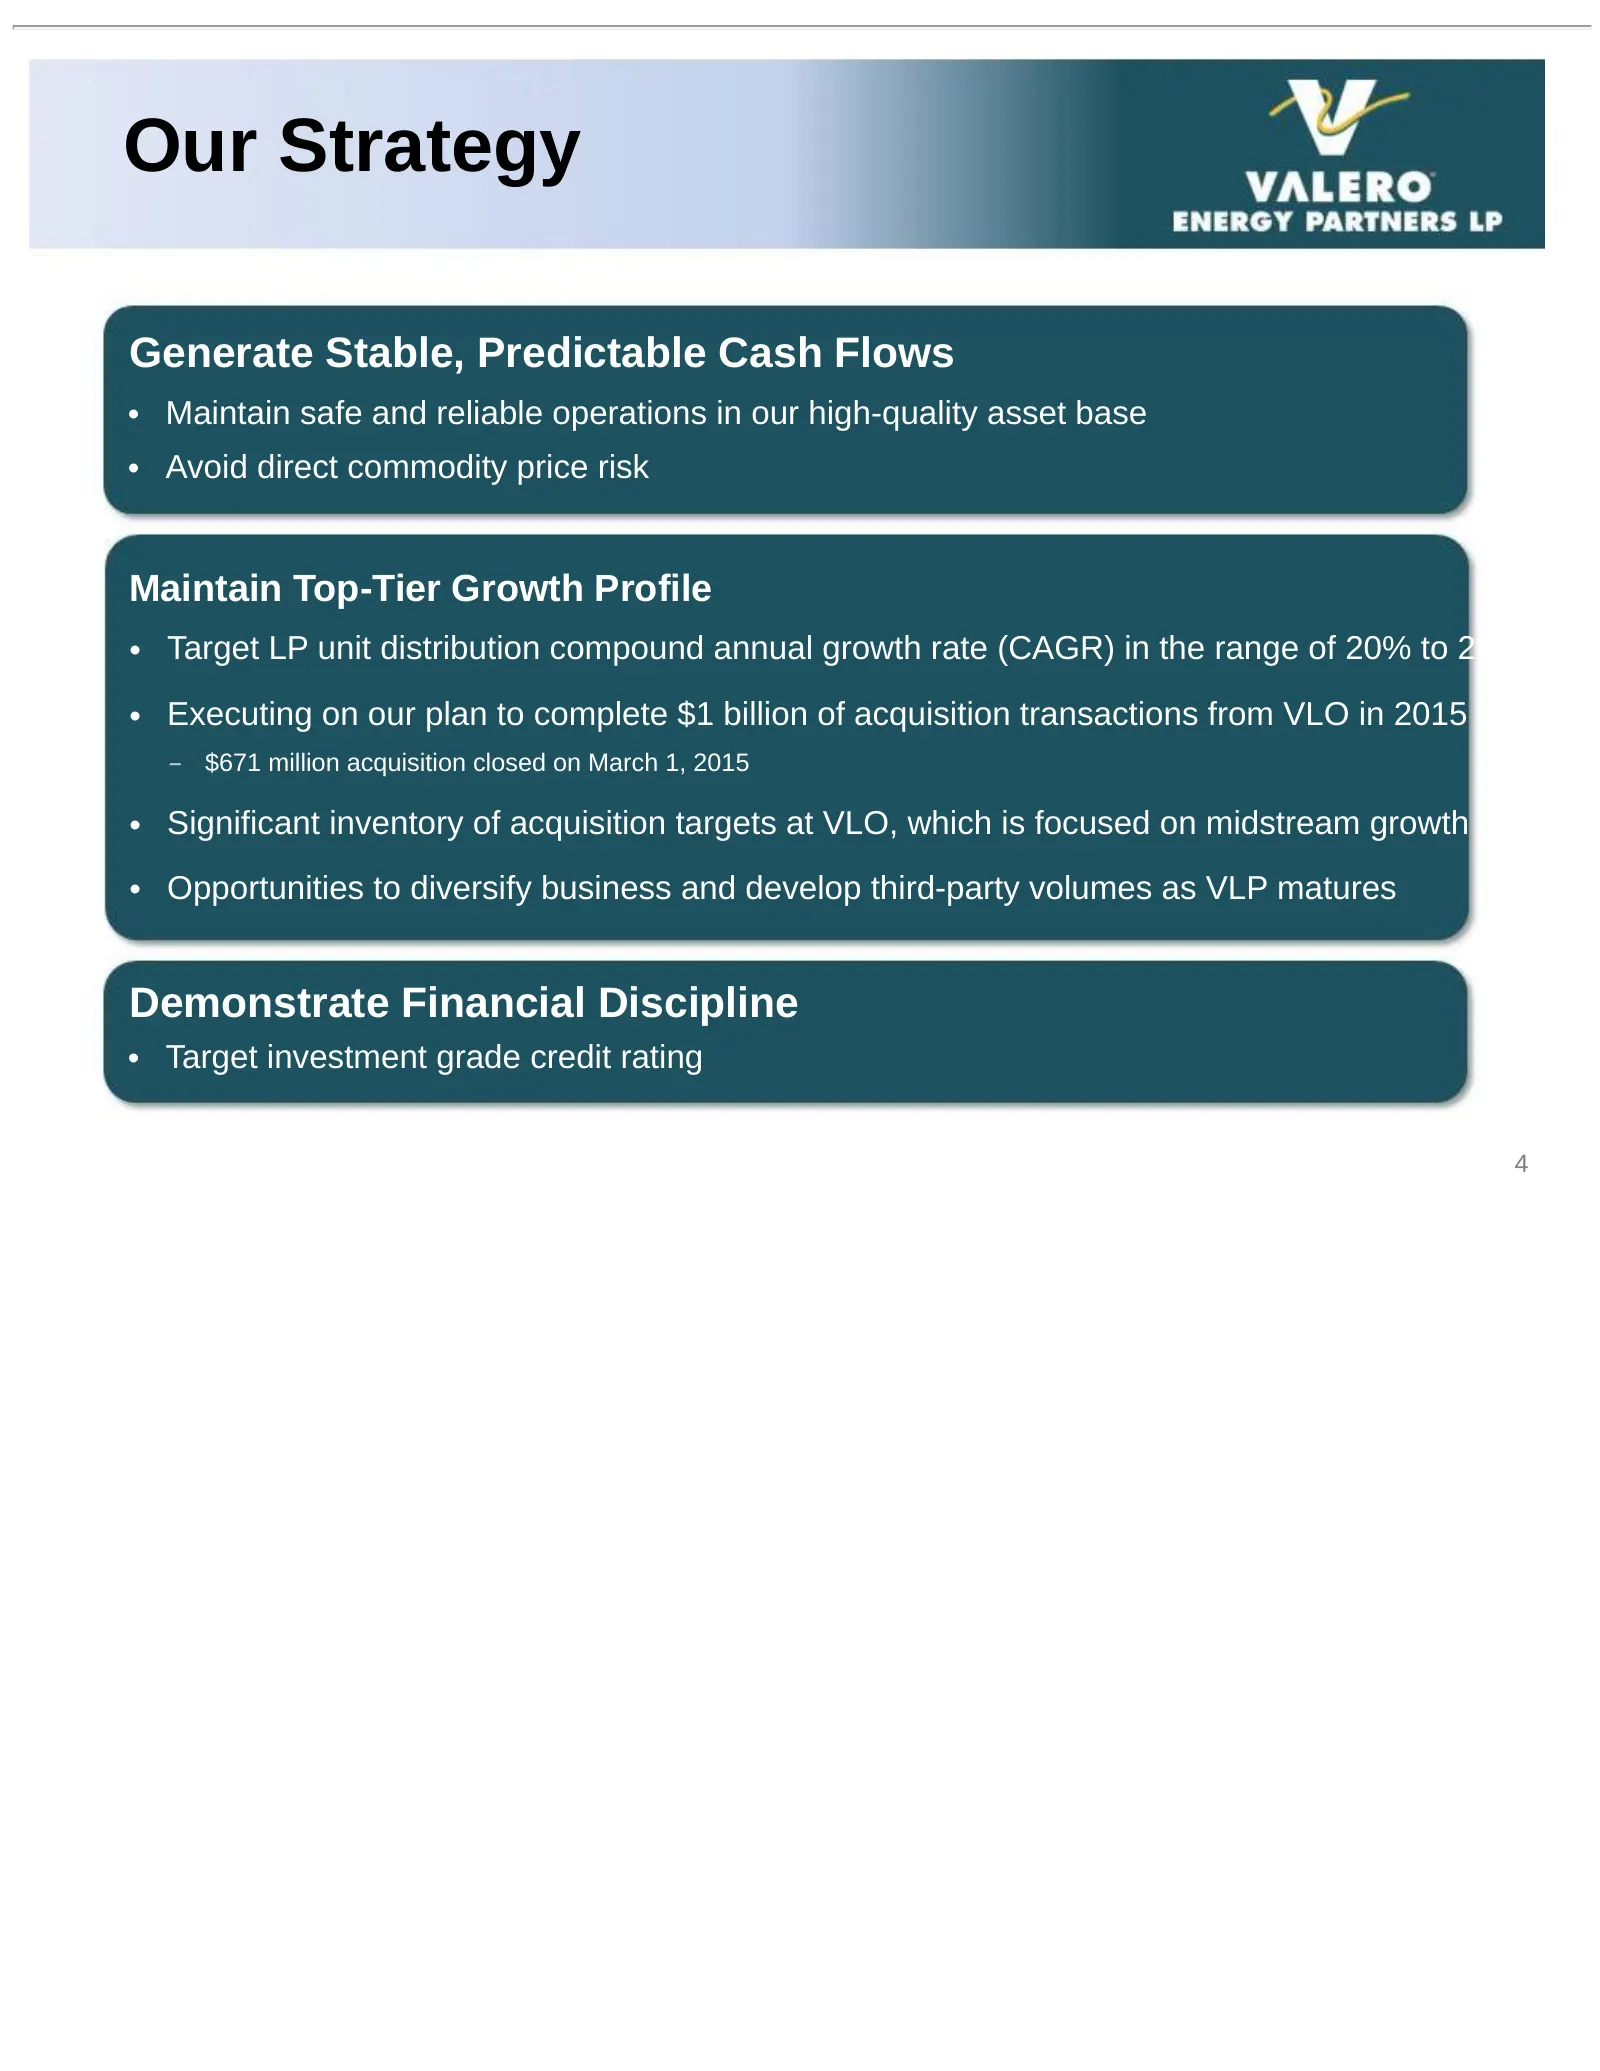
Slide 4: Our Strategy
Our Strategy Generate Stable, Predictable Cash Flows • Maintain safe and reliable operations in our high-quality asset base • Avoid direct commodity price risk Maintain Top-Tier Growth Profile • Target LP unit distribution compound annual growth rate (CAGR) in the range of 20% to 25% • Executing on
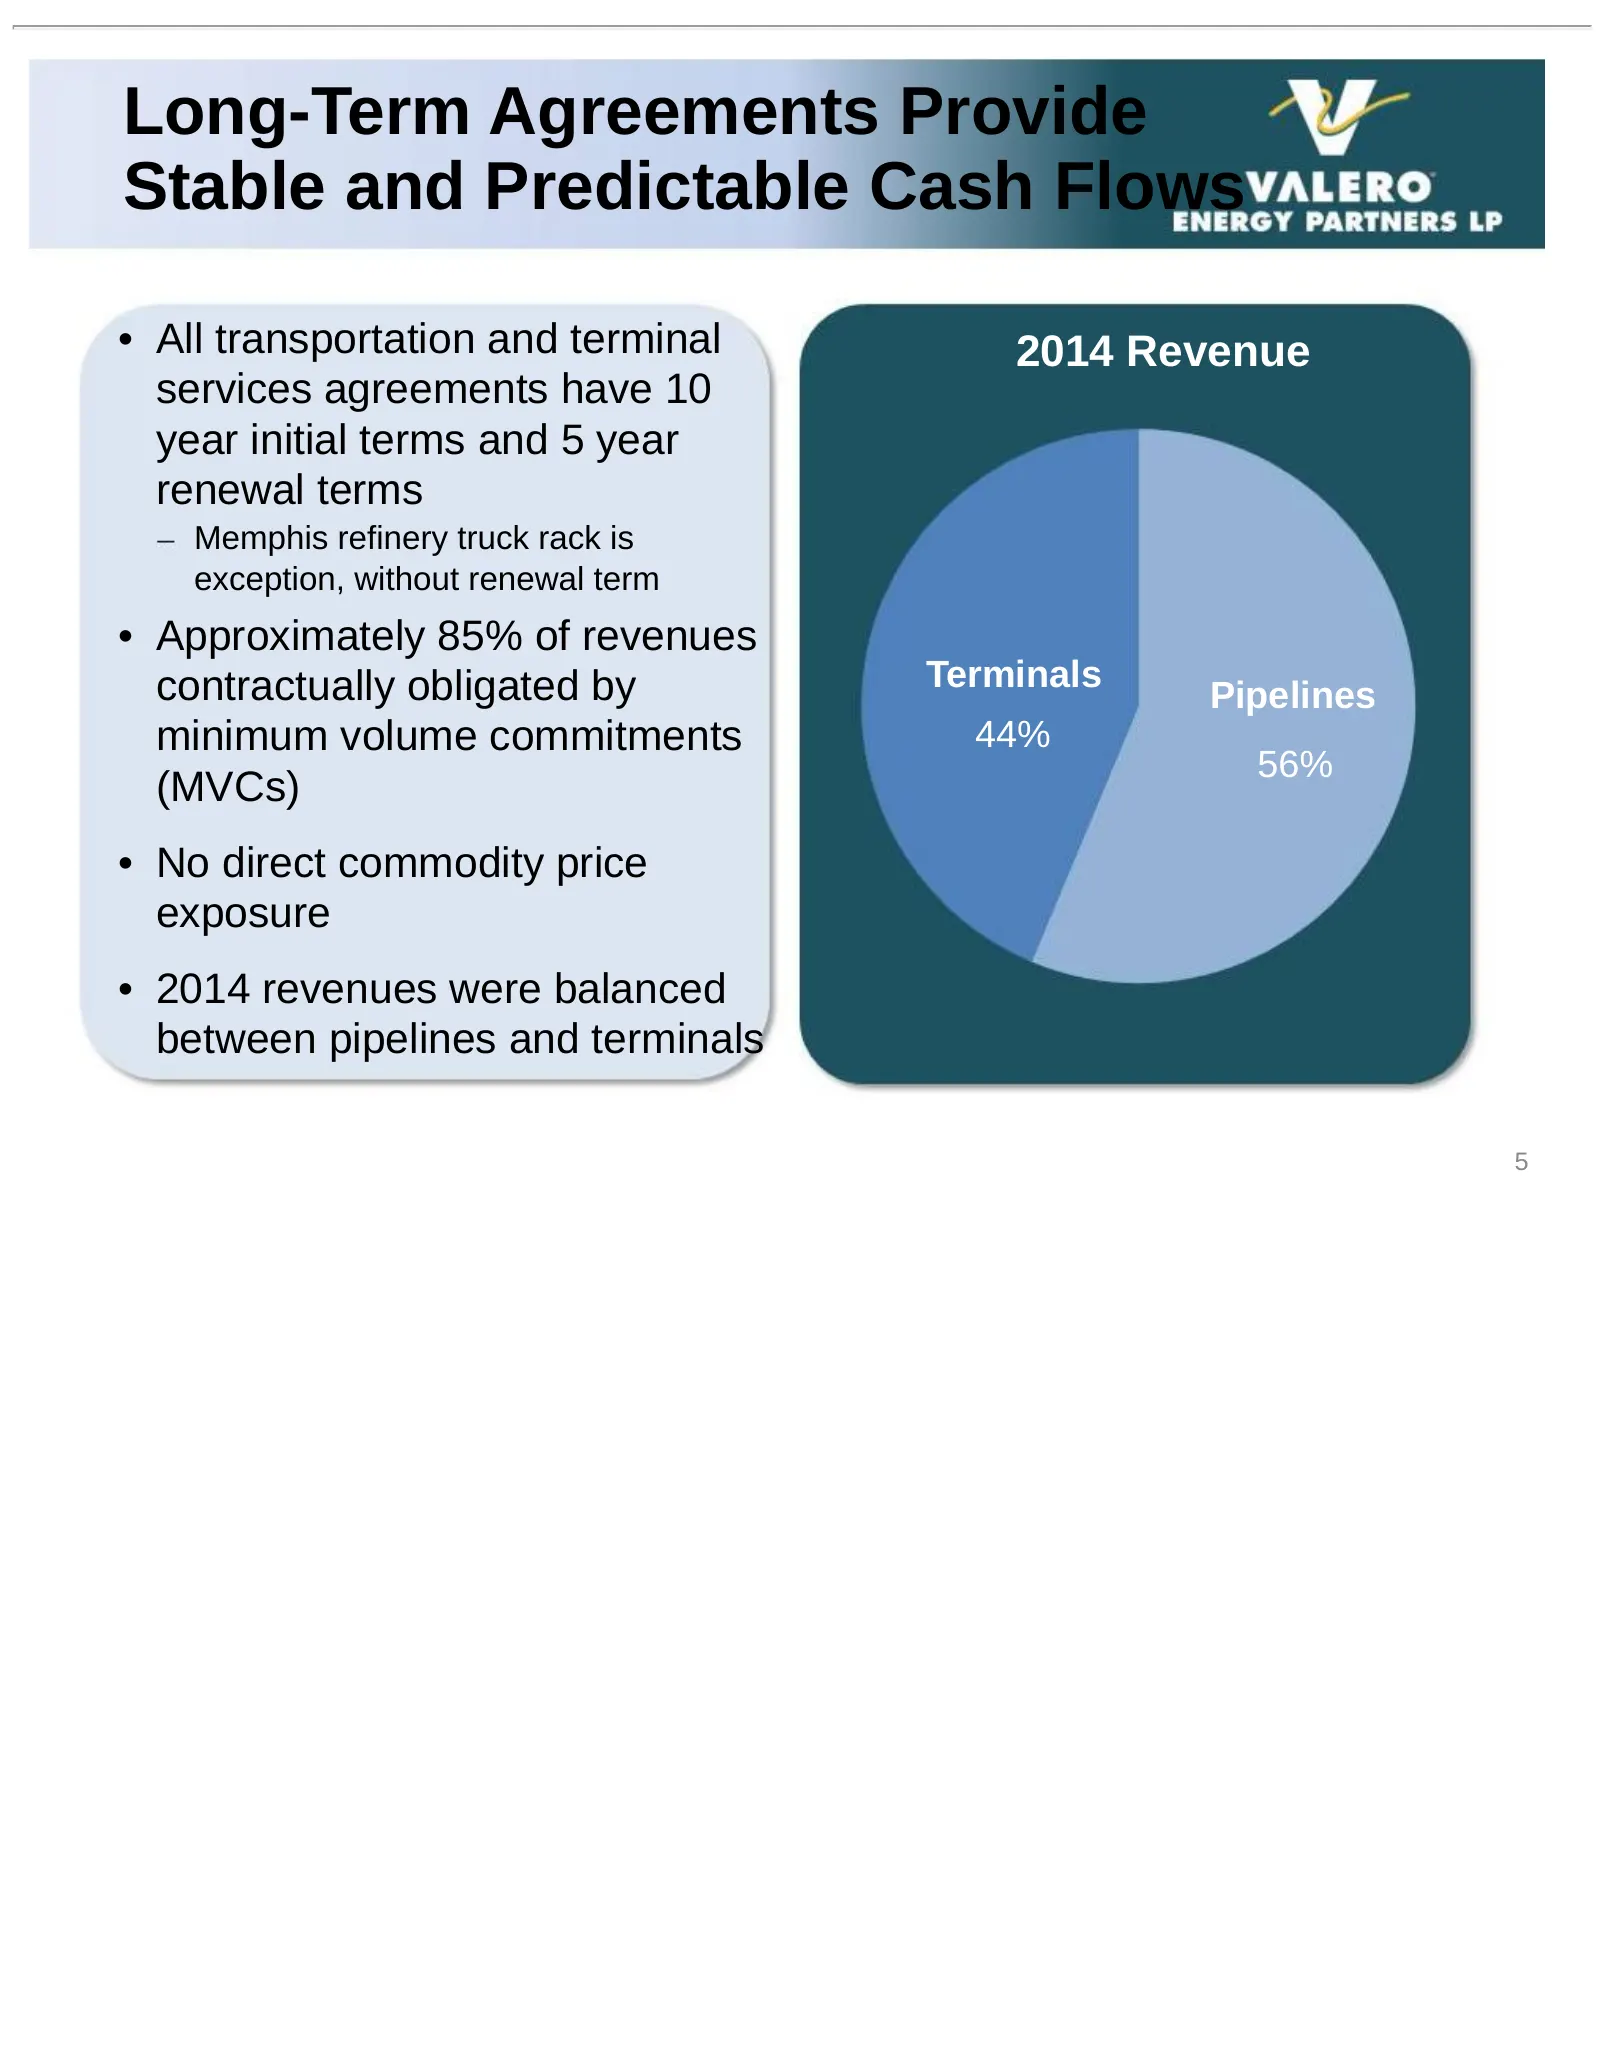
Slide 5: Long-Term Agreements Provide Stable and Predictable Cash Flows
Long-Term Agreements Provide Stable and Predictable Cash Flows • All transportation and terminal 2014 Revenue services agreements have 10 year initial terms and 5 year renewal terms Memphis refinery truck rack is exception, without renewal term • Approximately 85% of revenues contractually obligated
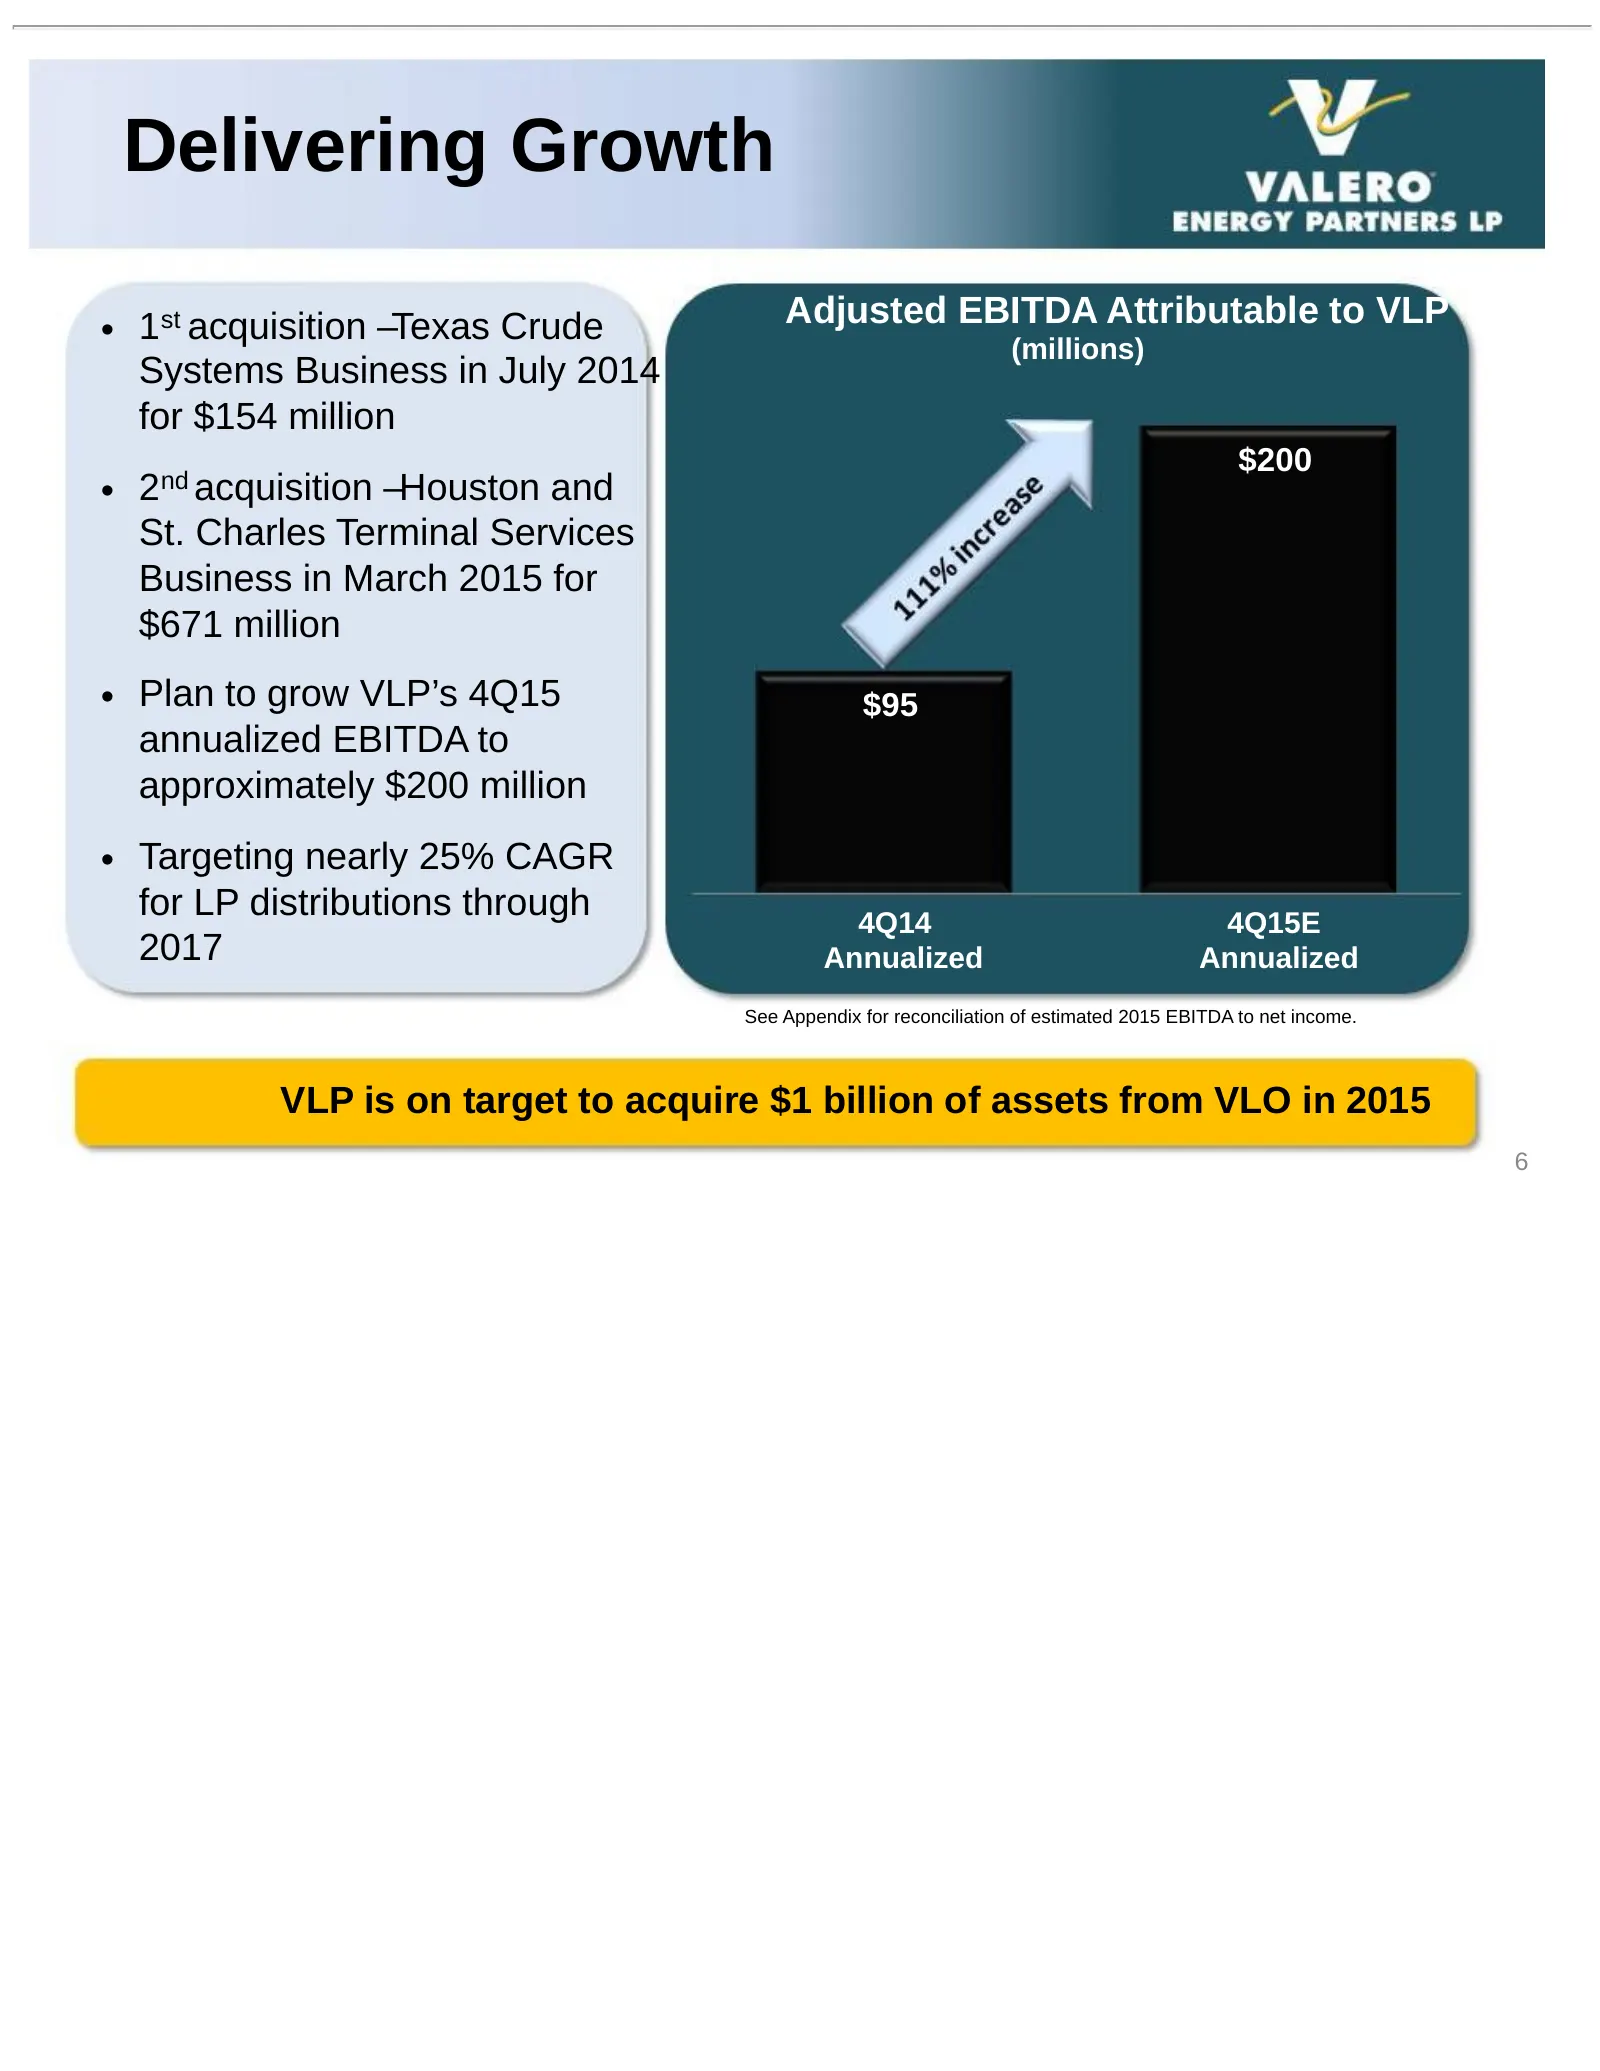
Slide 6: Delivering Growth
Delivering Growth • 1st acquisition –Texas Crude Adjusted EBITDA Attributable to VLP (millions) Systems Business in July 2014 for $154 million $200 • 2nd acquisition –Houston and St. Charles Terminal Services Business in March 2015 for $671 million • Plan to grow VLP’s 4Q15 $95 annualized EBITDA to
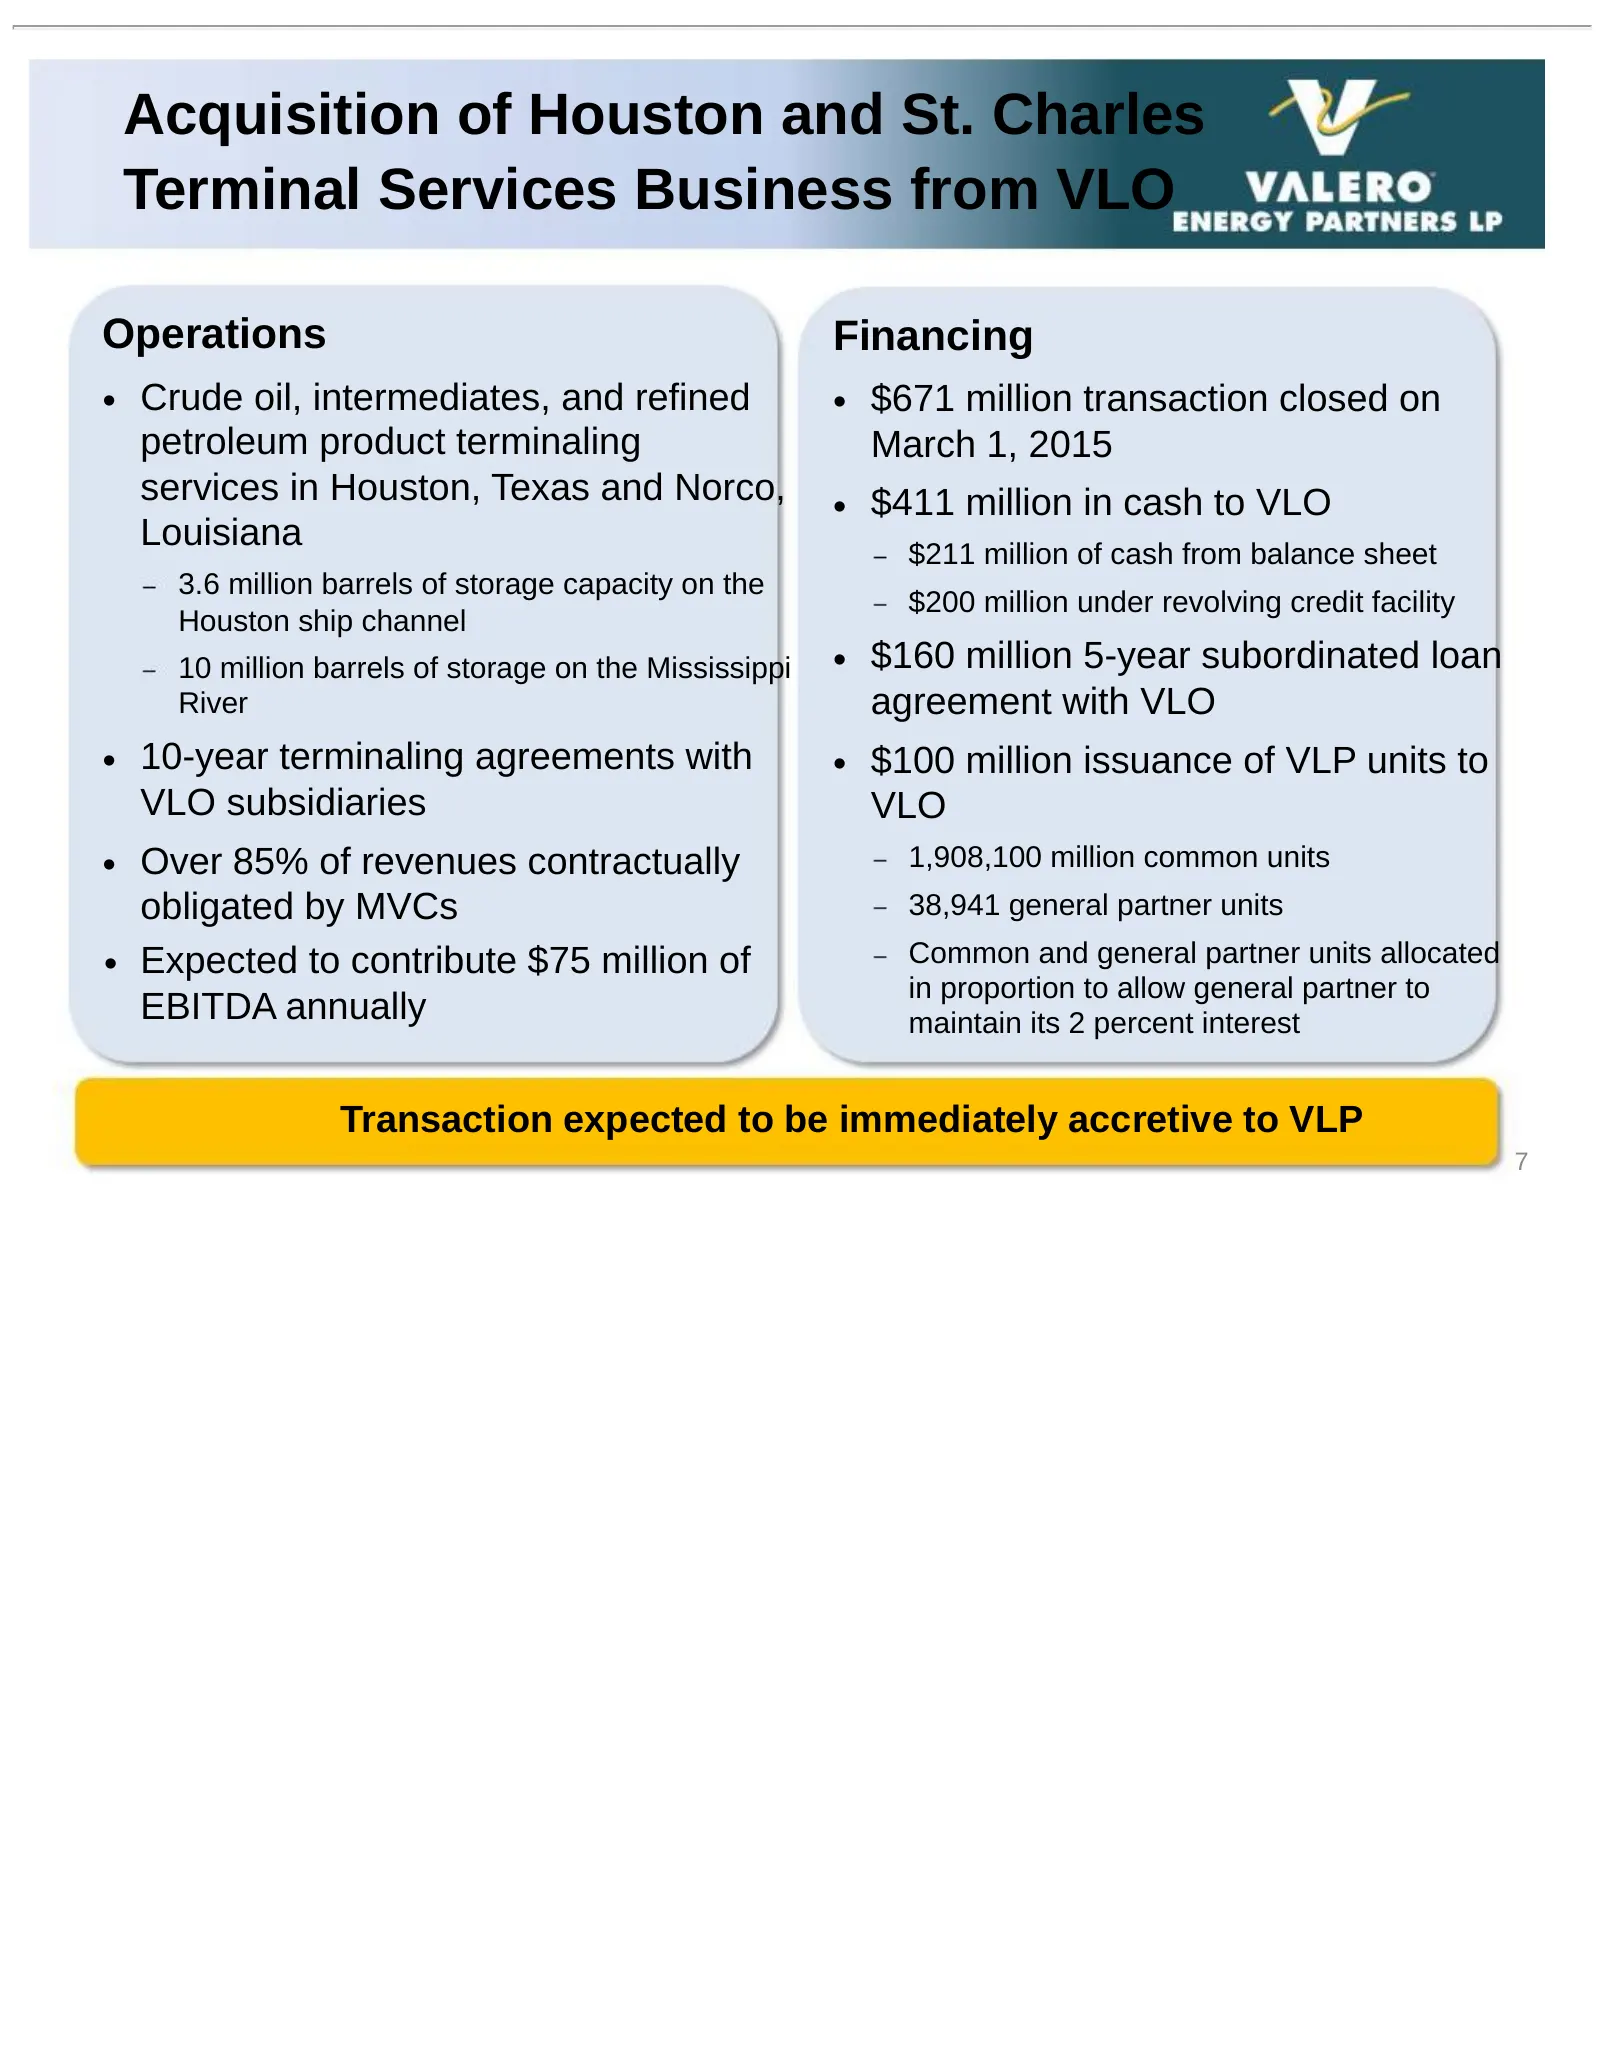
Slide 7: Acquisition of Houston and St. Charles Terminal Services Business from VLO
Acquisition of Houston and St. Charles Terminal Services Business from VLO Operations Financing • Crude oil, intermediates, and refined • $671 million transaction closed on petroleum product terminaling March 1, 2015 services in Houston, Texas and Norco, • $411 million in cash to VLO Louisiana $211
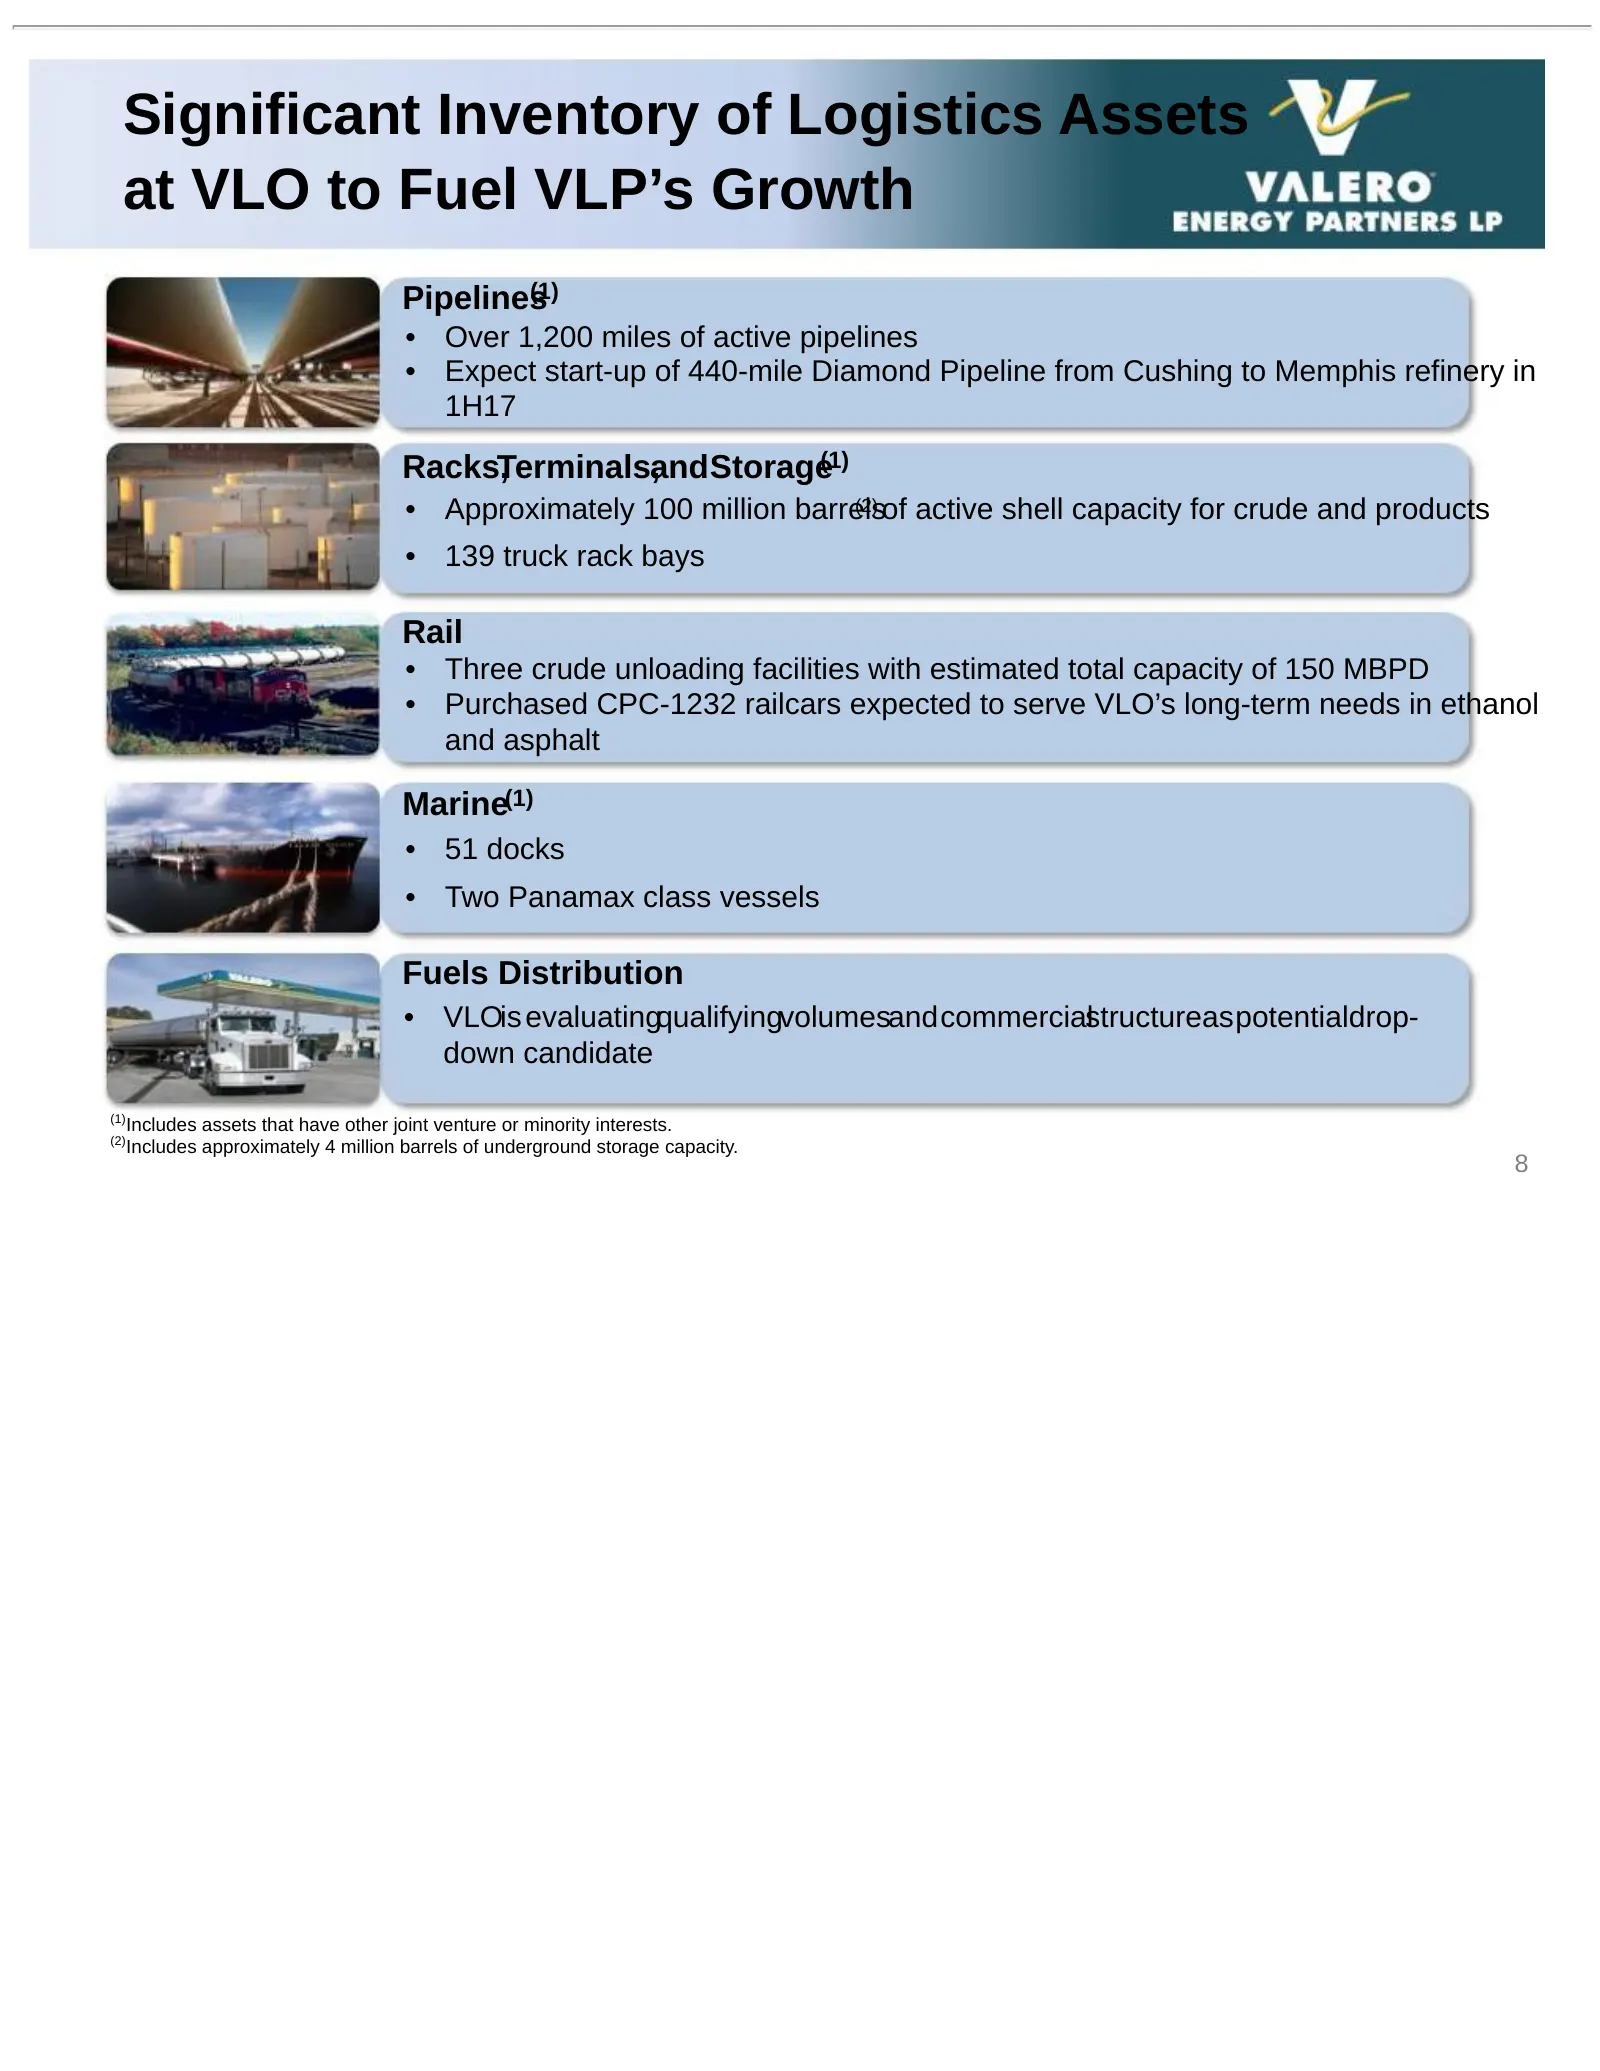
Slide 8: Significant Inventory of Logistics Assets at VLO to Fuel VLP's Growth
Significant Inventory of Logistics Assets at VLO to Fuel VLP’s Growth (1) Pipelines • Over 1,200 miles of active pipelines • Expect start-up of 440-mile Diamond Pipeline from Cushing to Memphis refinery in 1H17 Racks,Terminals,andStorage(1) • Approximately 100 million barrels (2) of active shell cap
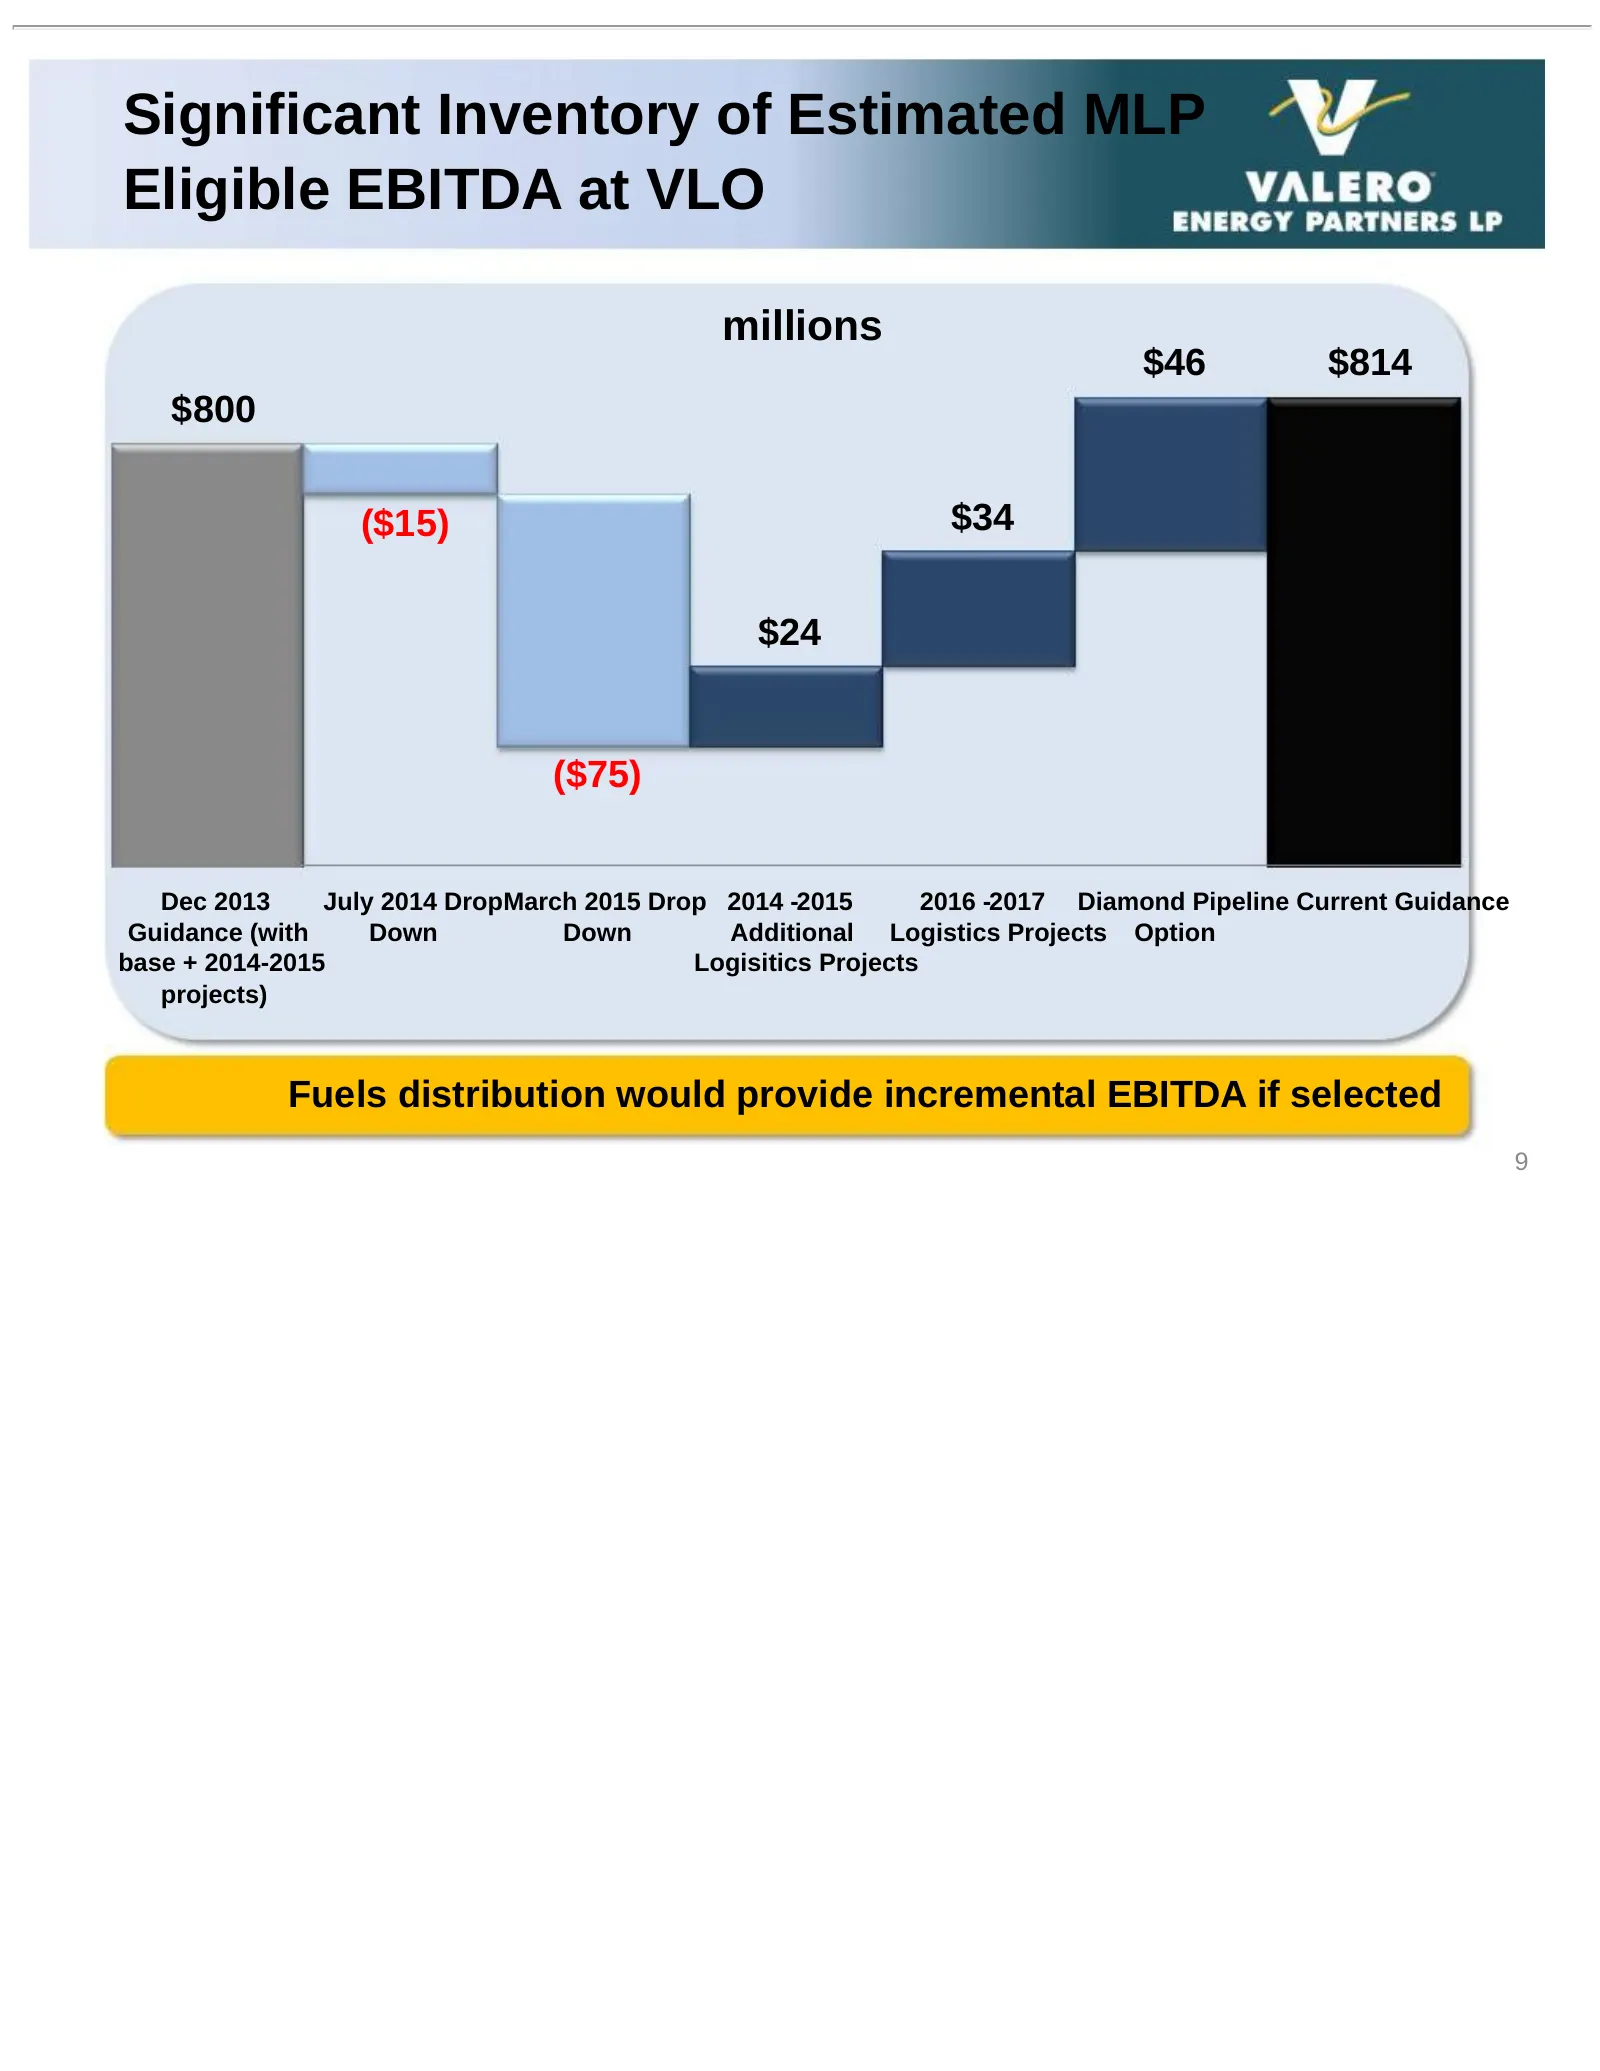
Slide 9: Significant Inventory of Estimated MLP Eligible EBITDA at VLO
Significant Inventory of Estimated MLP Eligible EBITDA at VLO millions $46 $814 $800 ($15) $34 $24 ($75) Dec 2013 July 2014 DropMarch 2015 Drop 2014 -2015 2016 -2017 Diamond Pipeline Current Guidance Guidance (with Down Down Additional Logistics Projects Option base + 2014-2015 Logisitics Projects p
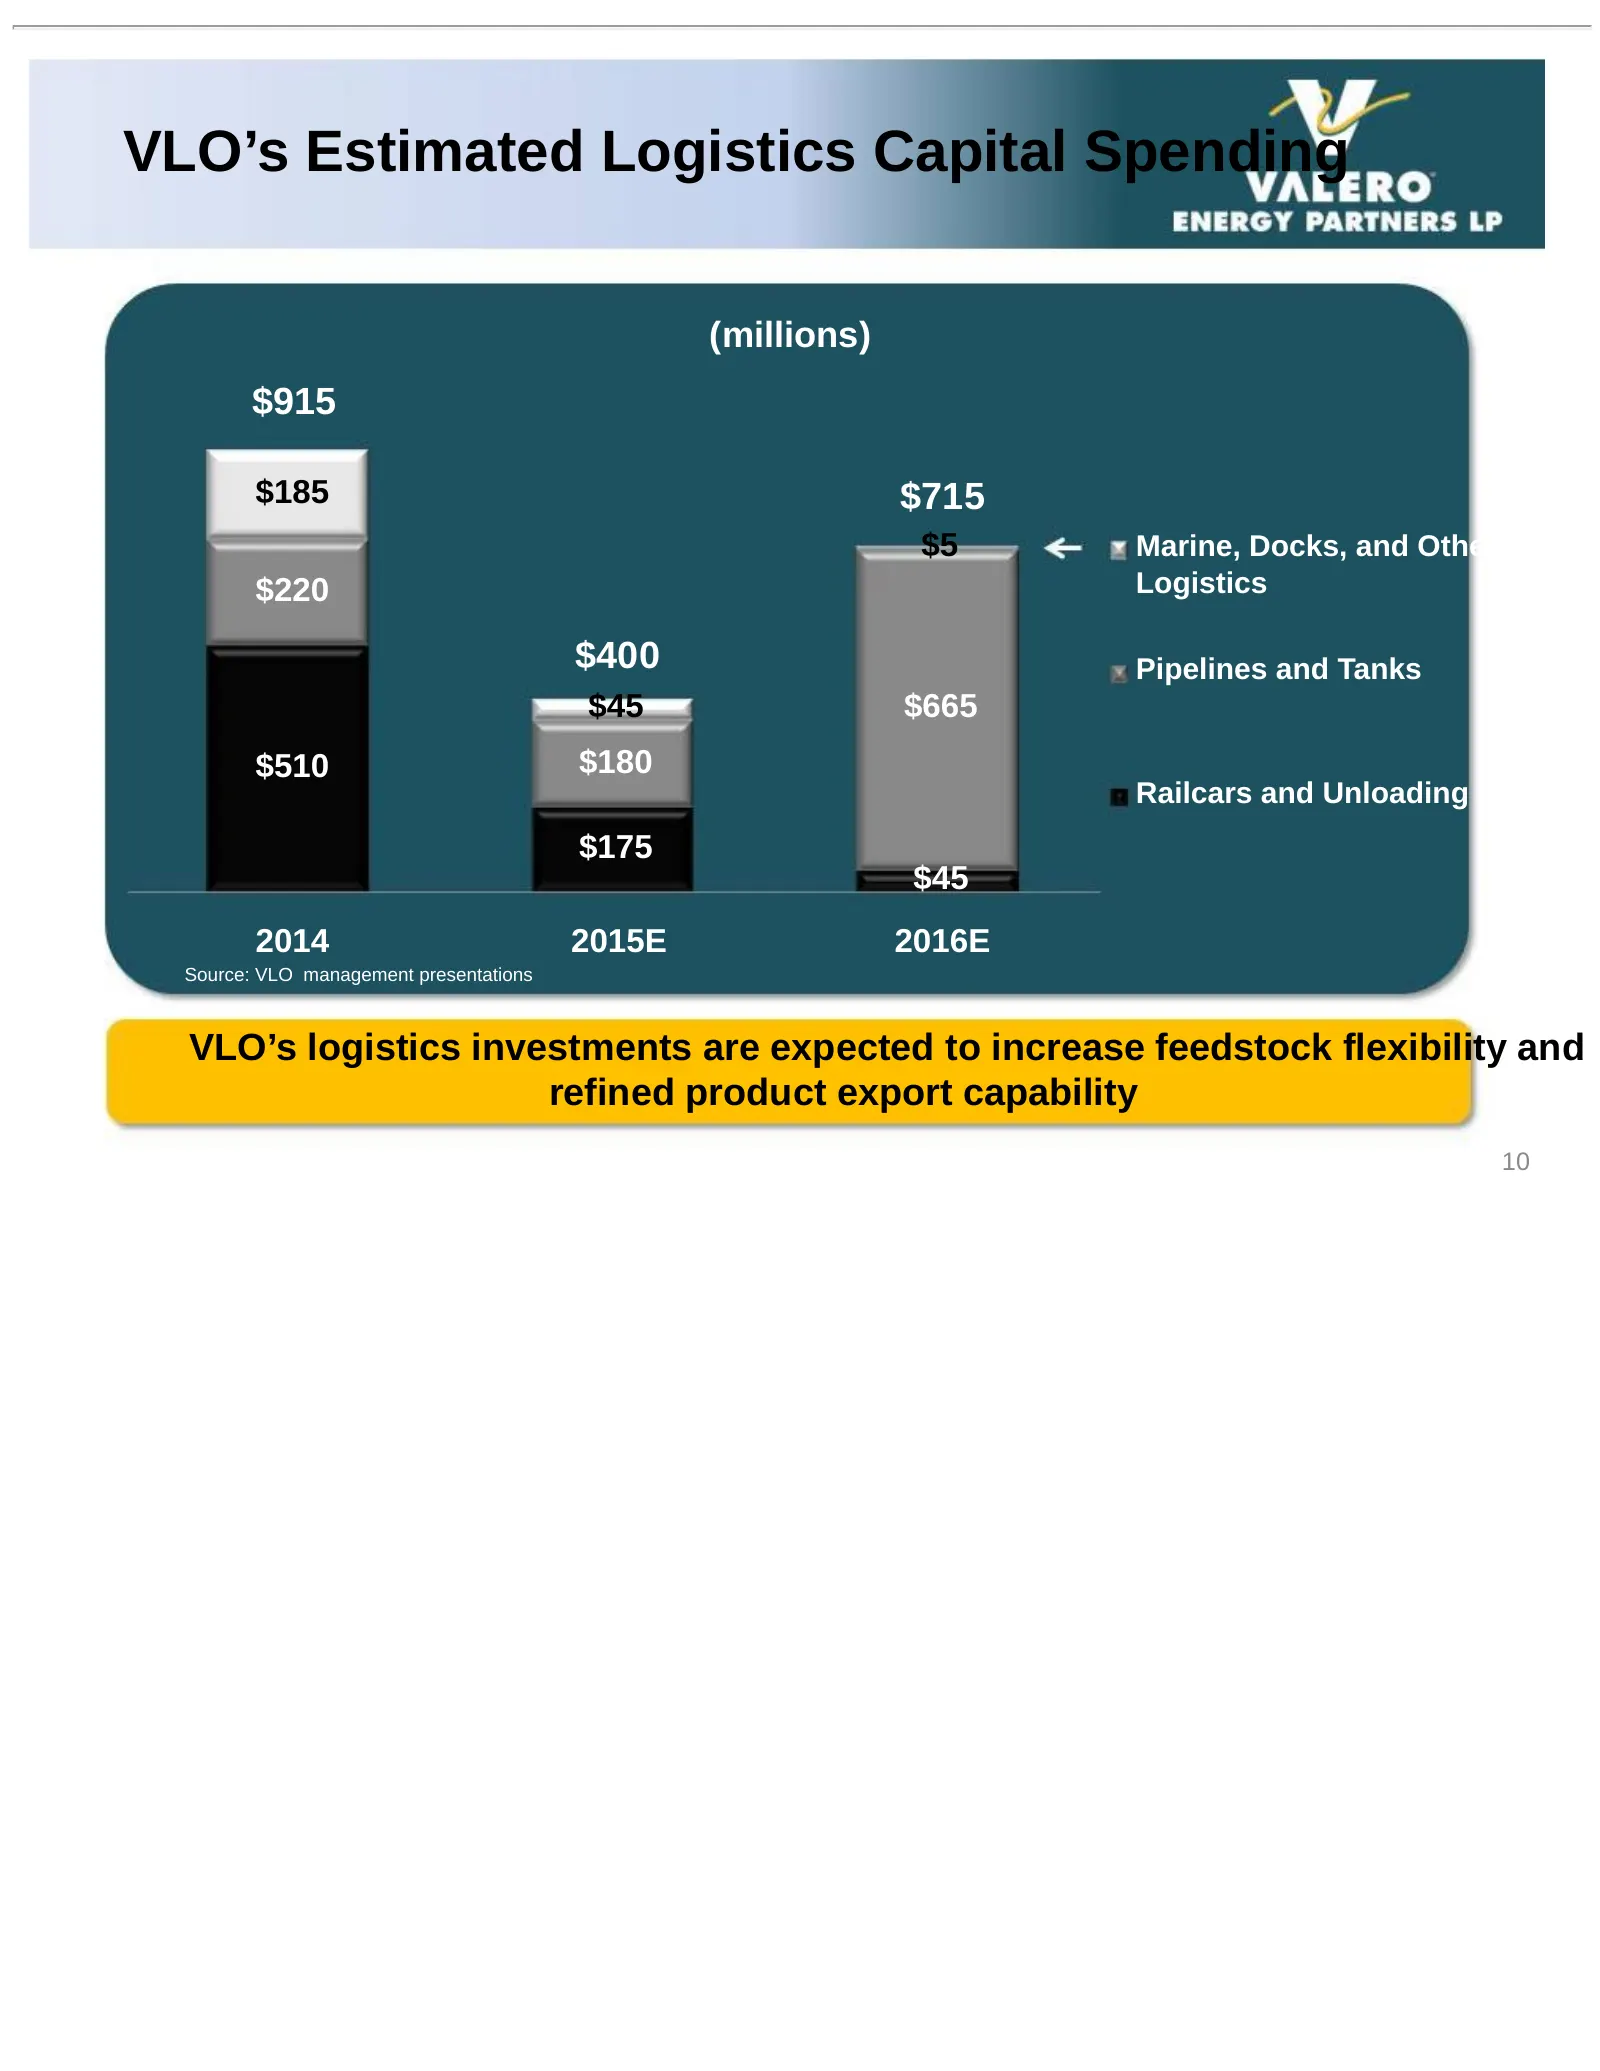
Slide 10: VLO's Estimated Logistics Capital Spending
VLO’s Estimated Logistics Capital Spending (millions) $915 $185 $715 $5 Marine, Docks, and Other $220 Logistics $400 Pipelines and Tanks $45 $665 $510 $180 Railcars and Unloading $175 $45 2014 2015E 2016E Source: VLO management presentations VLO’s logistics investments are expected to increase feeds
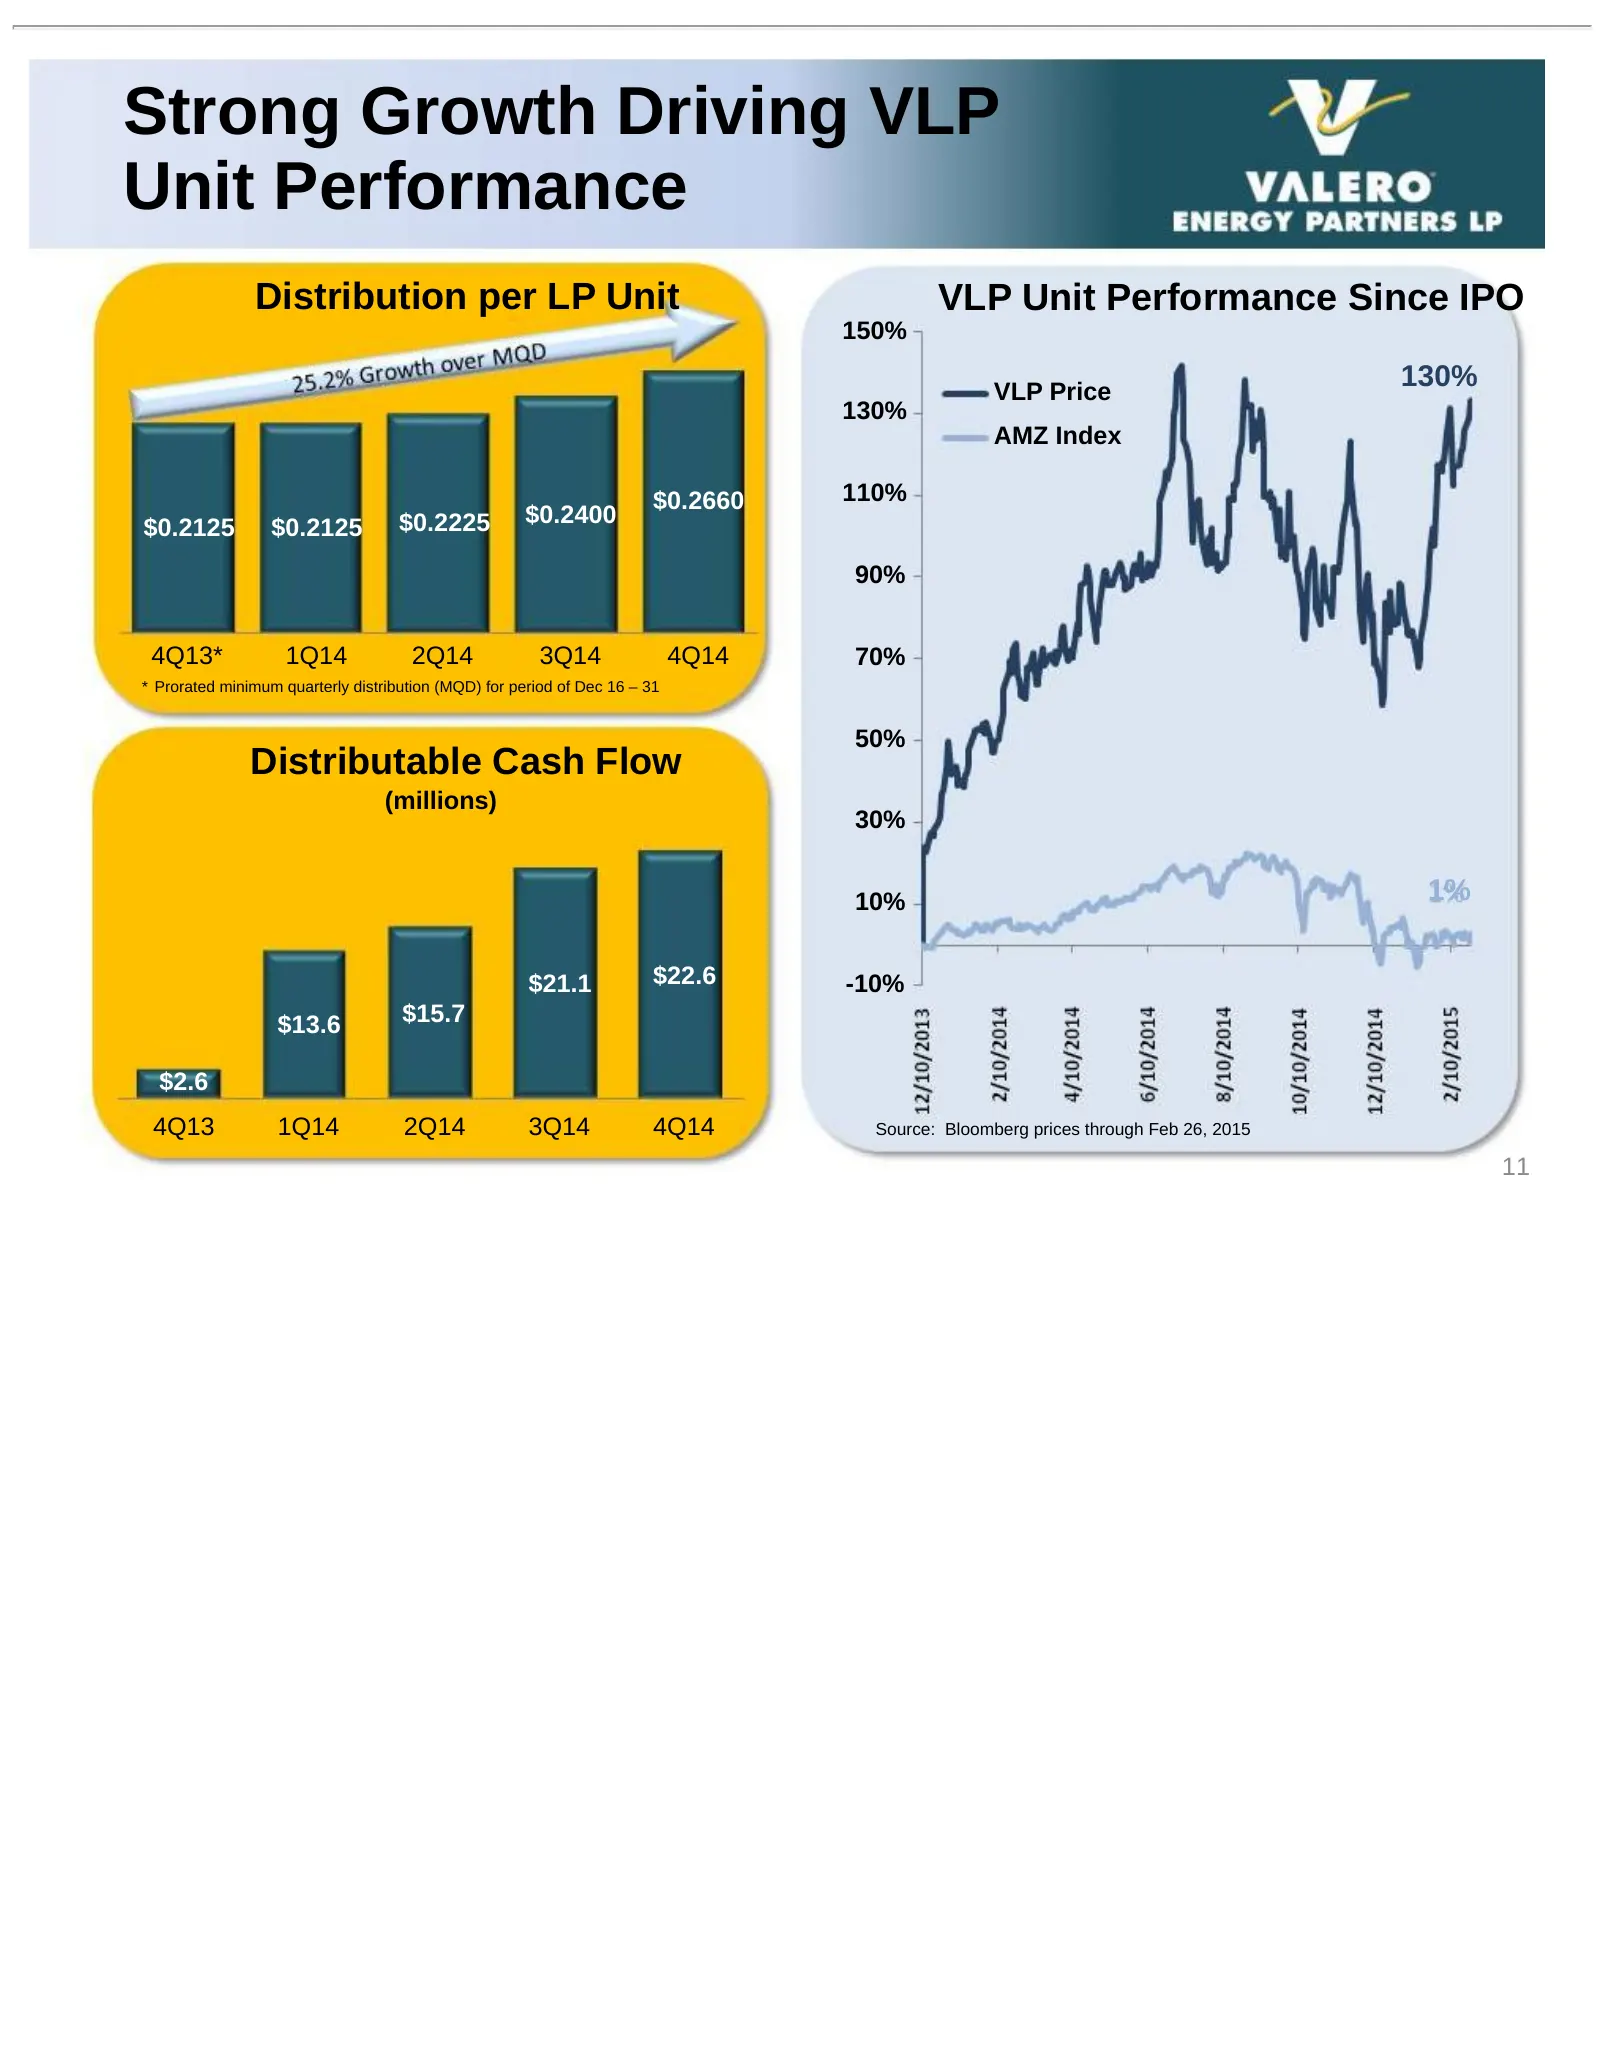
Slide 11: Strong Growth Driving VLP Unit Performance
Strong Growth Driving VLP Unit Performance Distribution per LP Unit VLP Unit Performance Since IPO 150% VLP Price 130% 130% AMZ Index $0.2660 110% $0.2225 $0.2400 $0.2125 $0.2125 90% 4Q13* 1Q14 2Q14 3Q14 4Q14 70% * Prorated minimum quarterly distribution (MQD) for period of Dec 16 – 31 50% Distribut
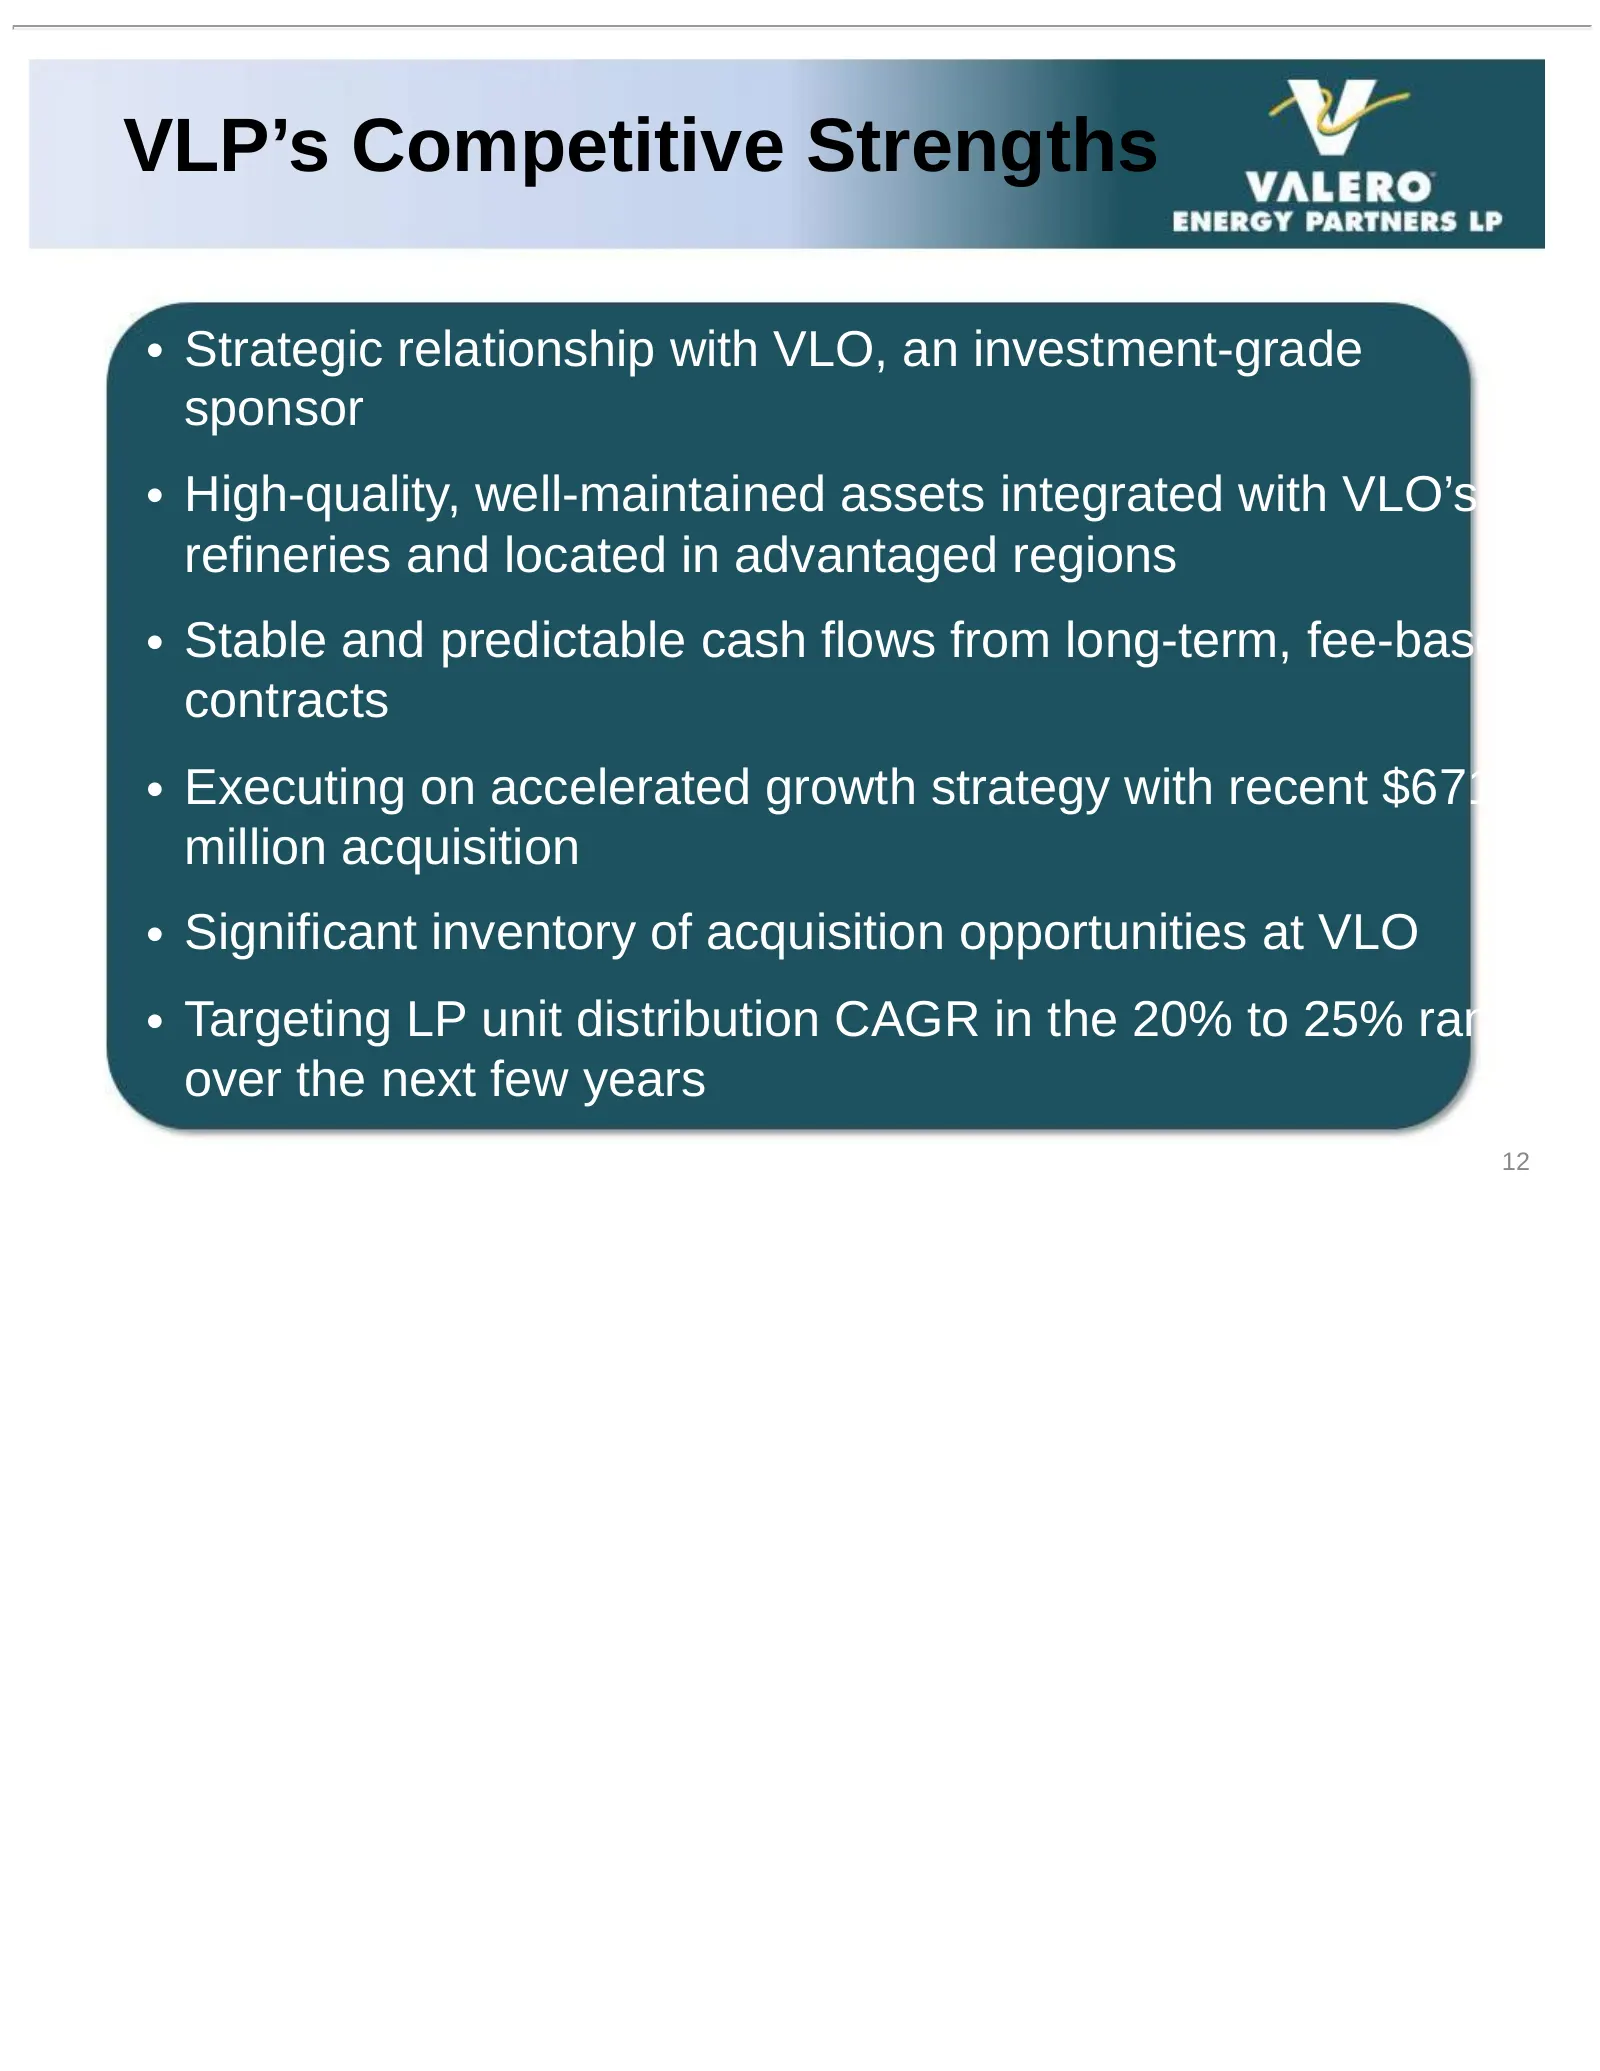
Slide 12: VLP's Competitive Strengths
VLP’s Competitive Strengths • Strategic relationship with VLO, an investment-grade sponsor • High-quality, well-maintained assets integrated with VLO’s refineries and located in advantaged regions • Stable and predictable cash flows from long-term, fee-based contracts • Executing on accelerated grow
Slide 13: Appendix
Appendix Topic Page VLP Alignment with VLO 14 Long Term Macro Market Expectations 15 VLO Asset Overview 16 Non-GAAP Reconciliations 17 IR Contact Information 18 13
Slide 14: VLP Aligned with VLO
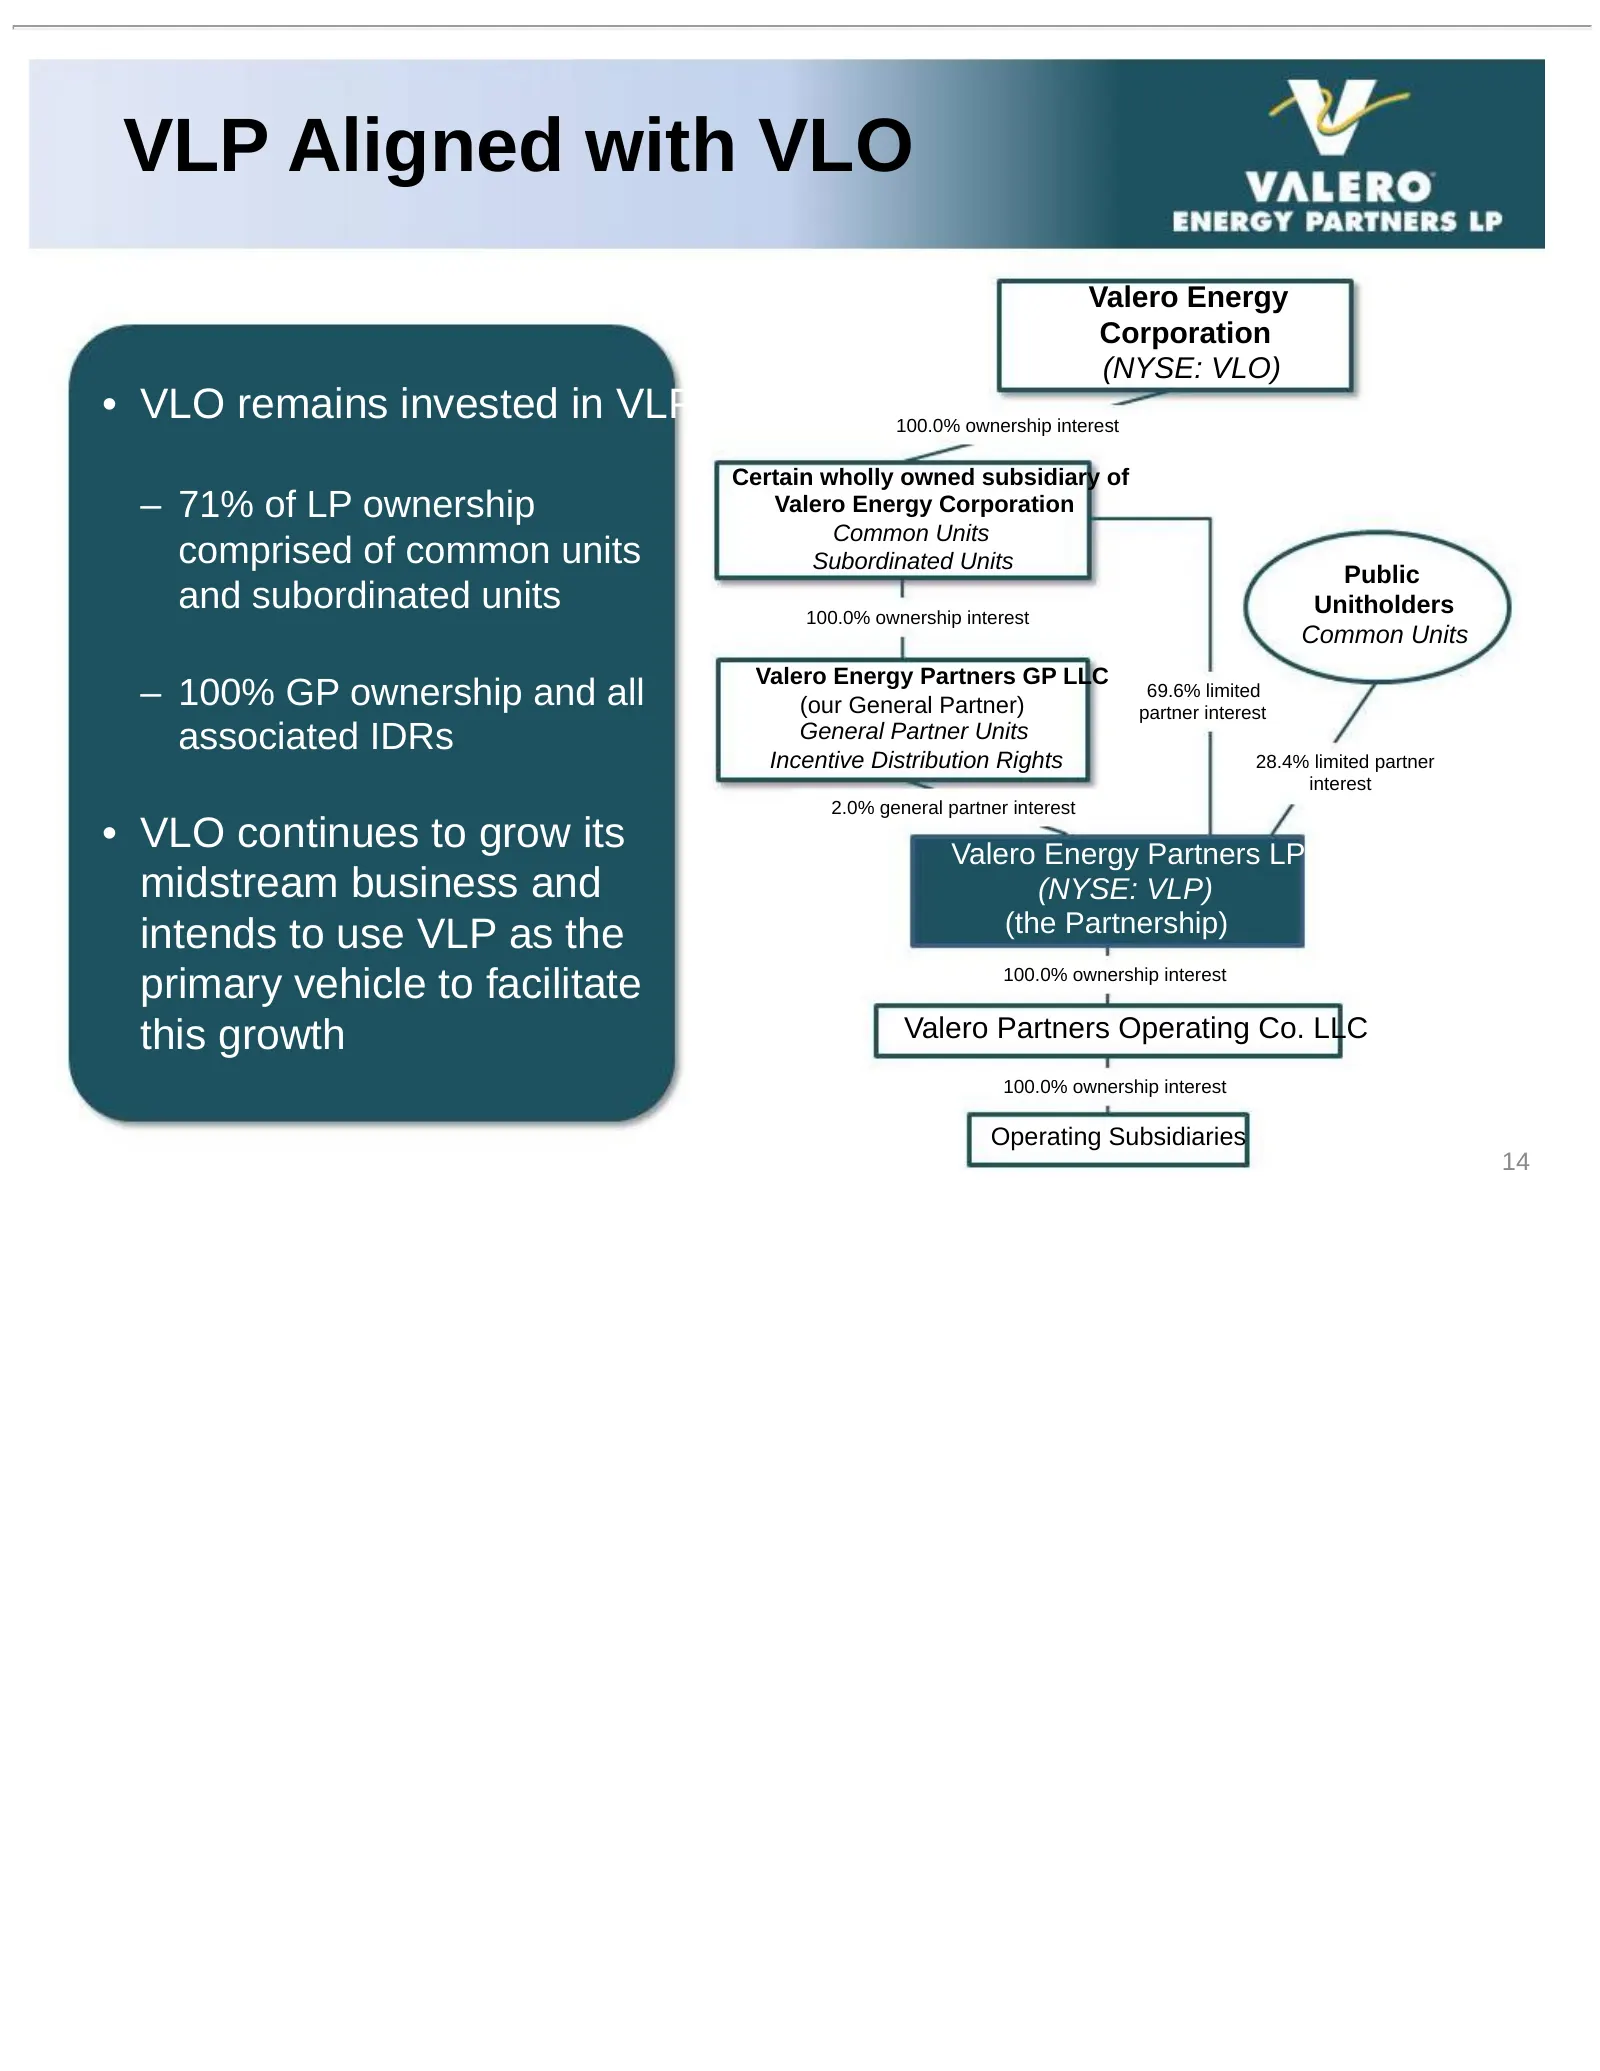
VLP Aligned with VLO Valero Energy Corporation (NYSE: VLO) • VLO remains invested in VLP 100.0% ownership interest Certain wholly owned subsidiary of – 71% of LP ownership Valero Energy Corporation Common Units comprised of common units Subordinated Units Public and subordinated units 100.0% ownersh
Slide 15: Our Long-Term Macro Market Expectations
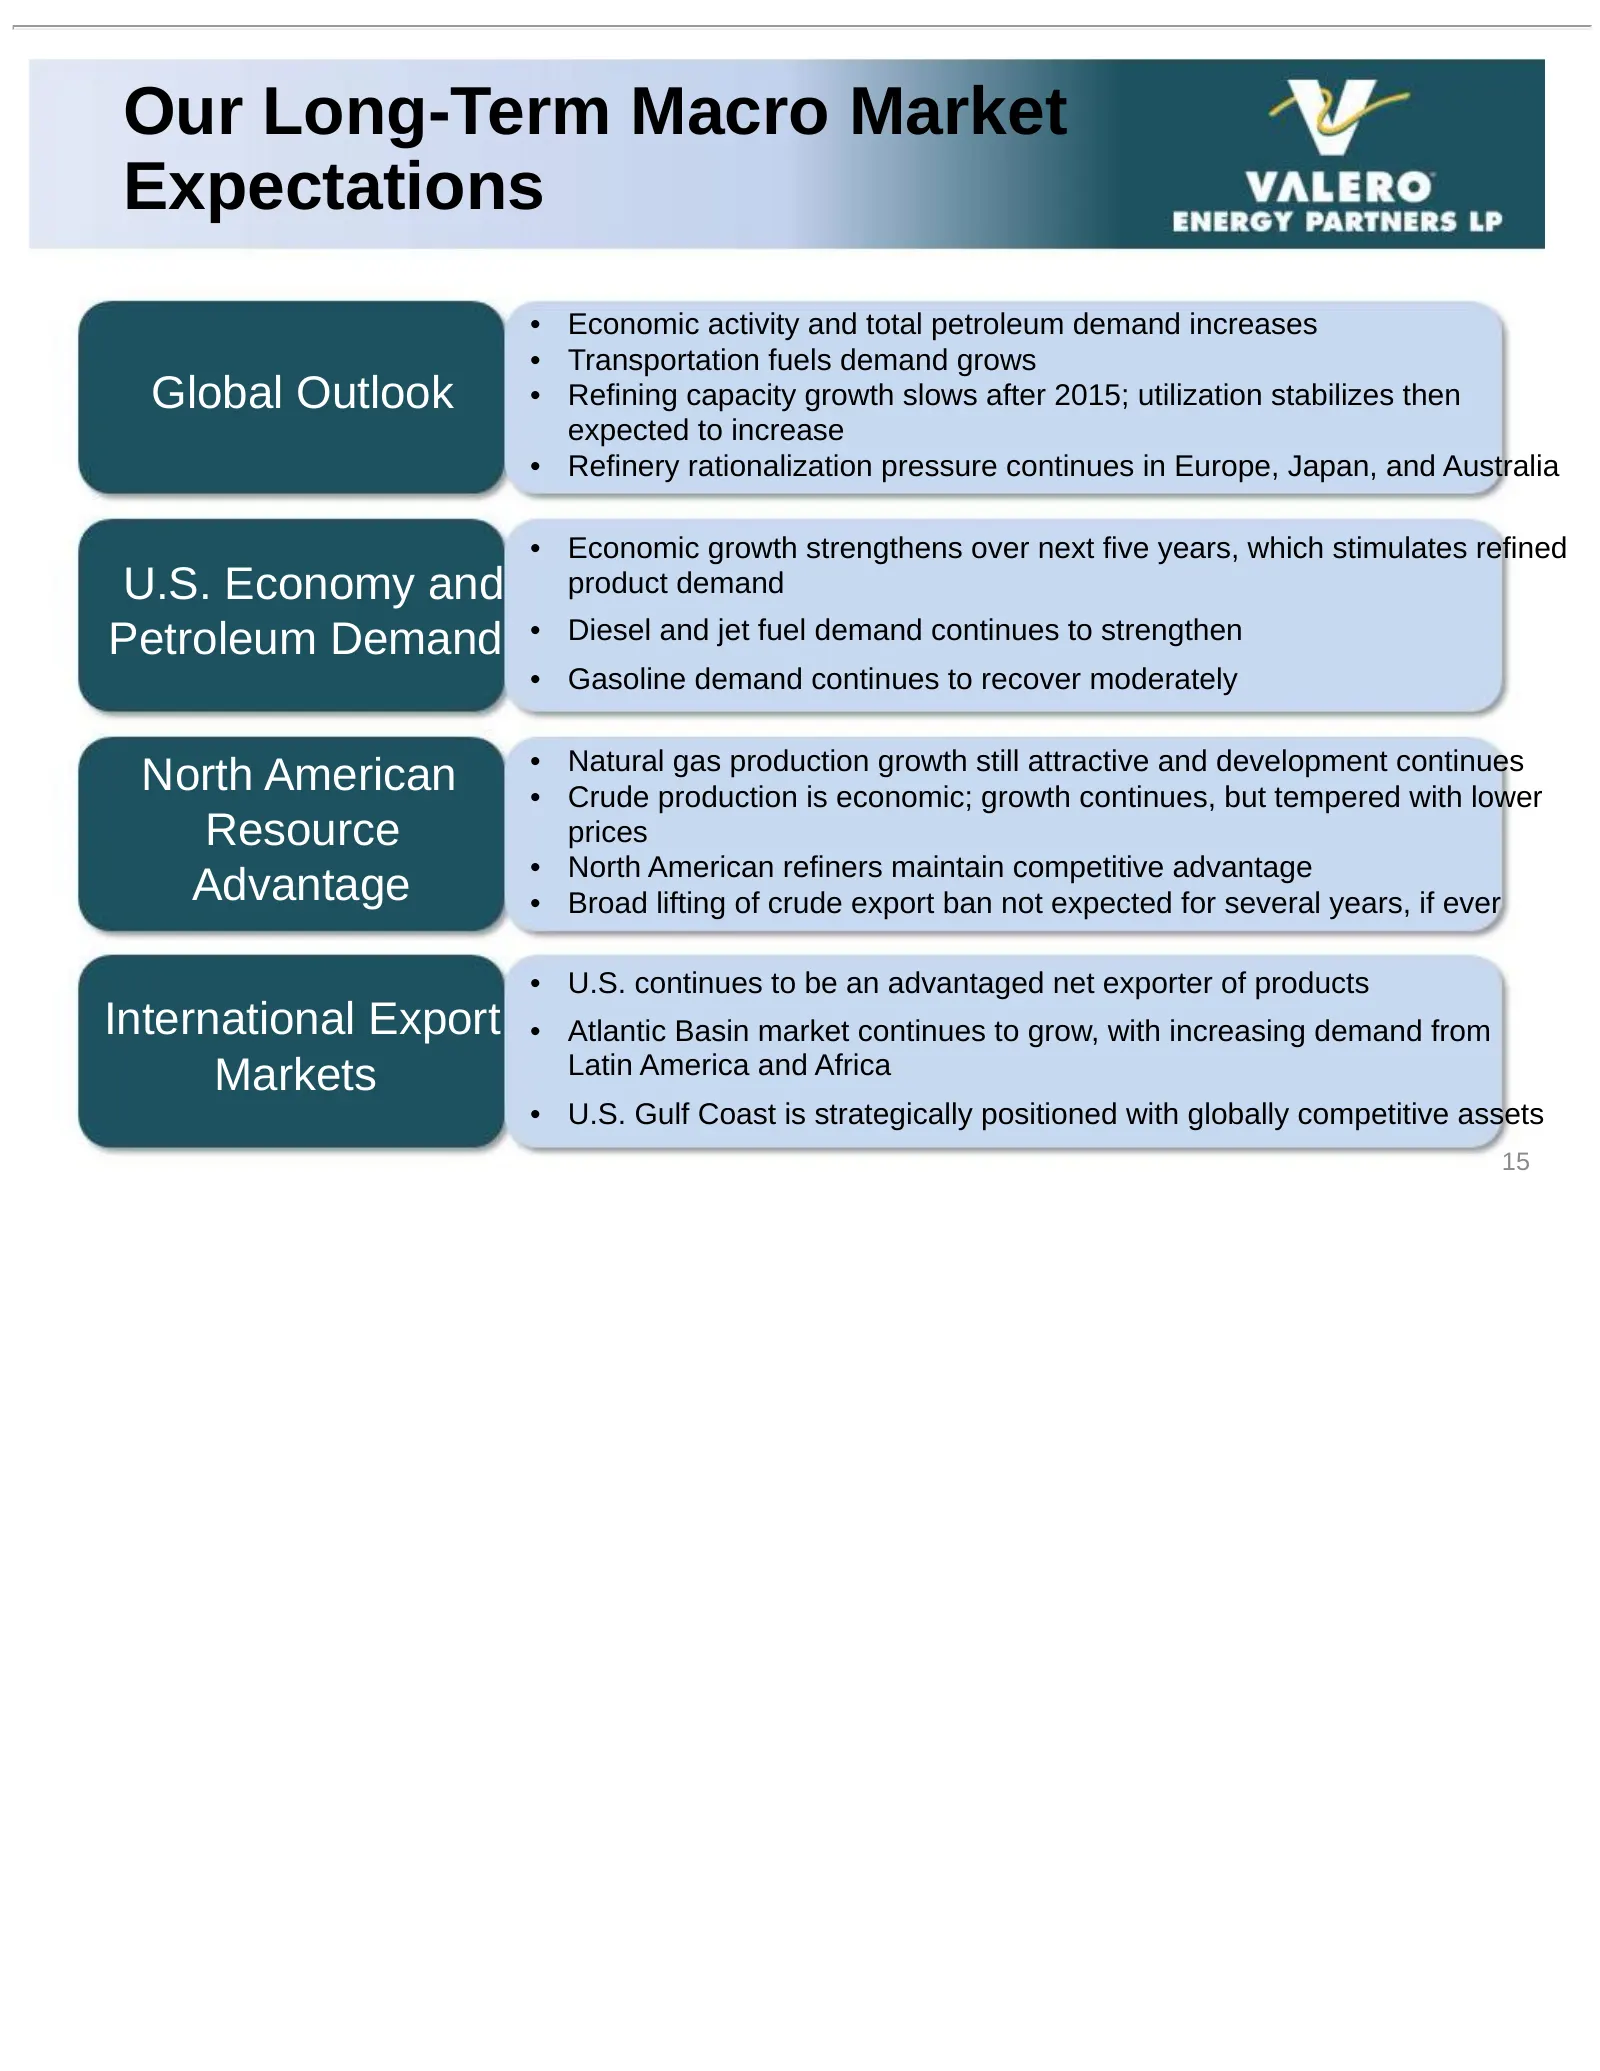
Our Long-Term Macro Market Expectations • Economic activity and total petroleum demand increases • Transportation fuels demand grows Global Outlook • Refining capacity growth slows after 2015; utilization stabilizes then expected to increase • Refinery rationalization pressure continues in Europe, J
Slide 16: VLO's Assets Concentrated in Advantaged Locations
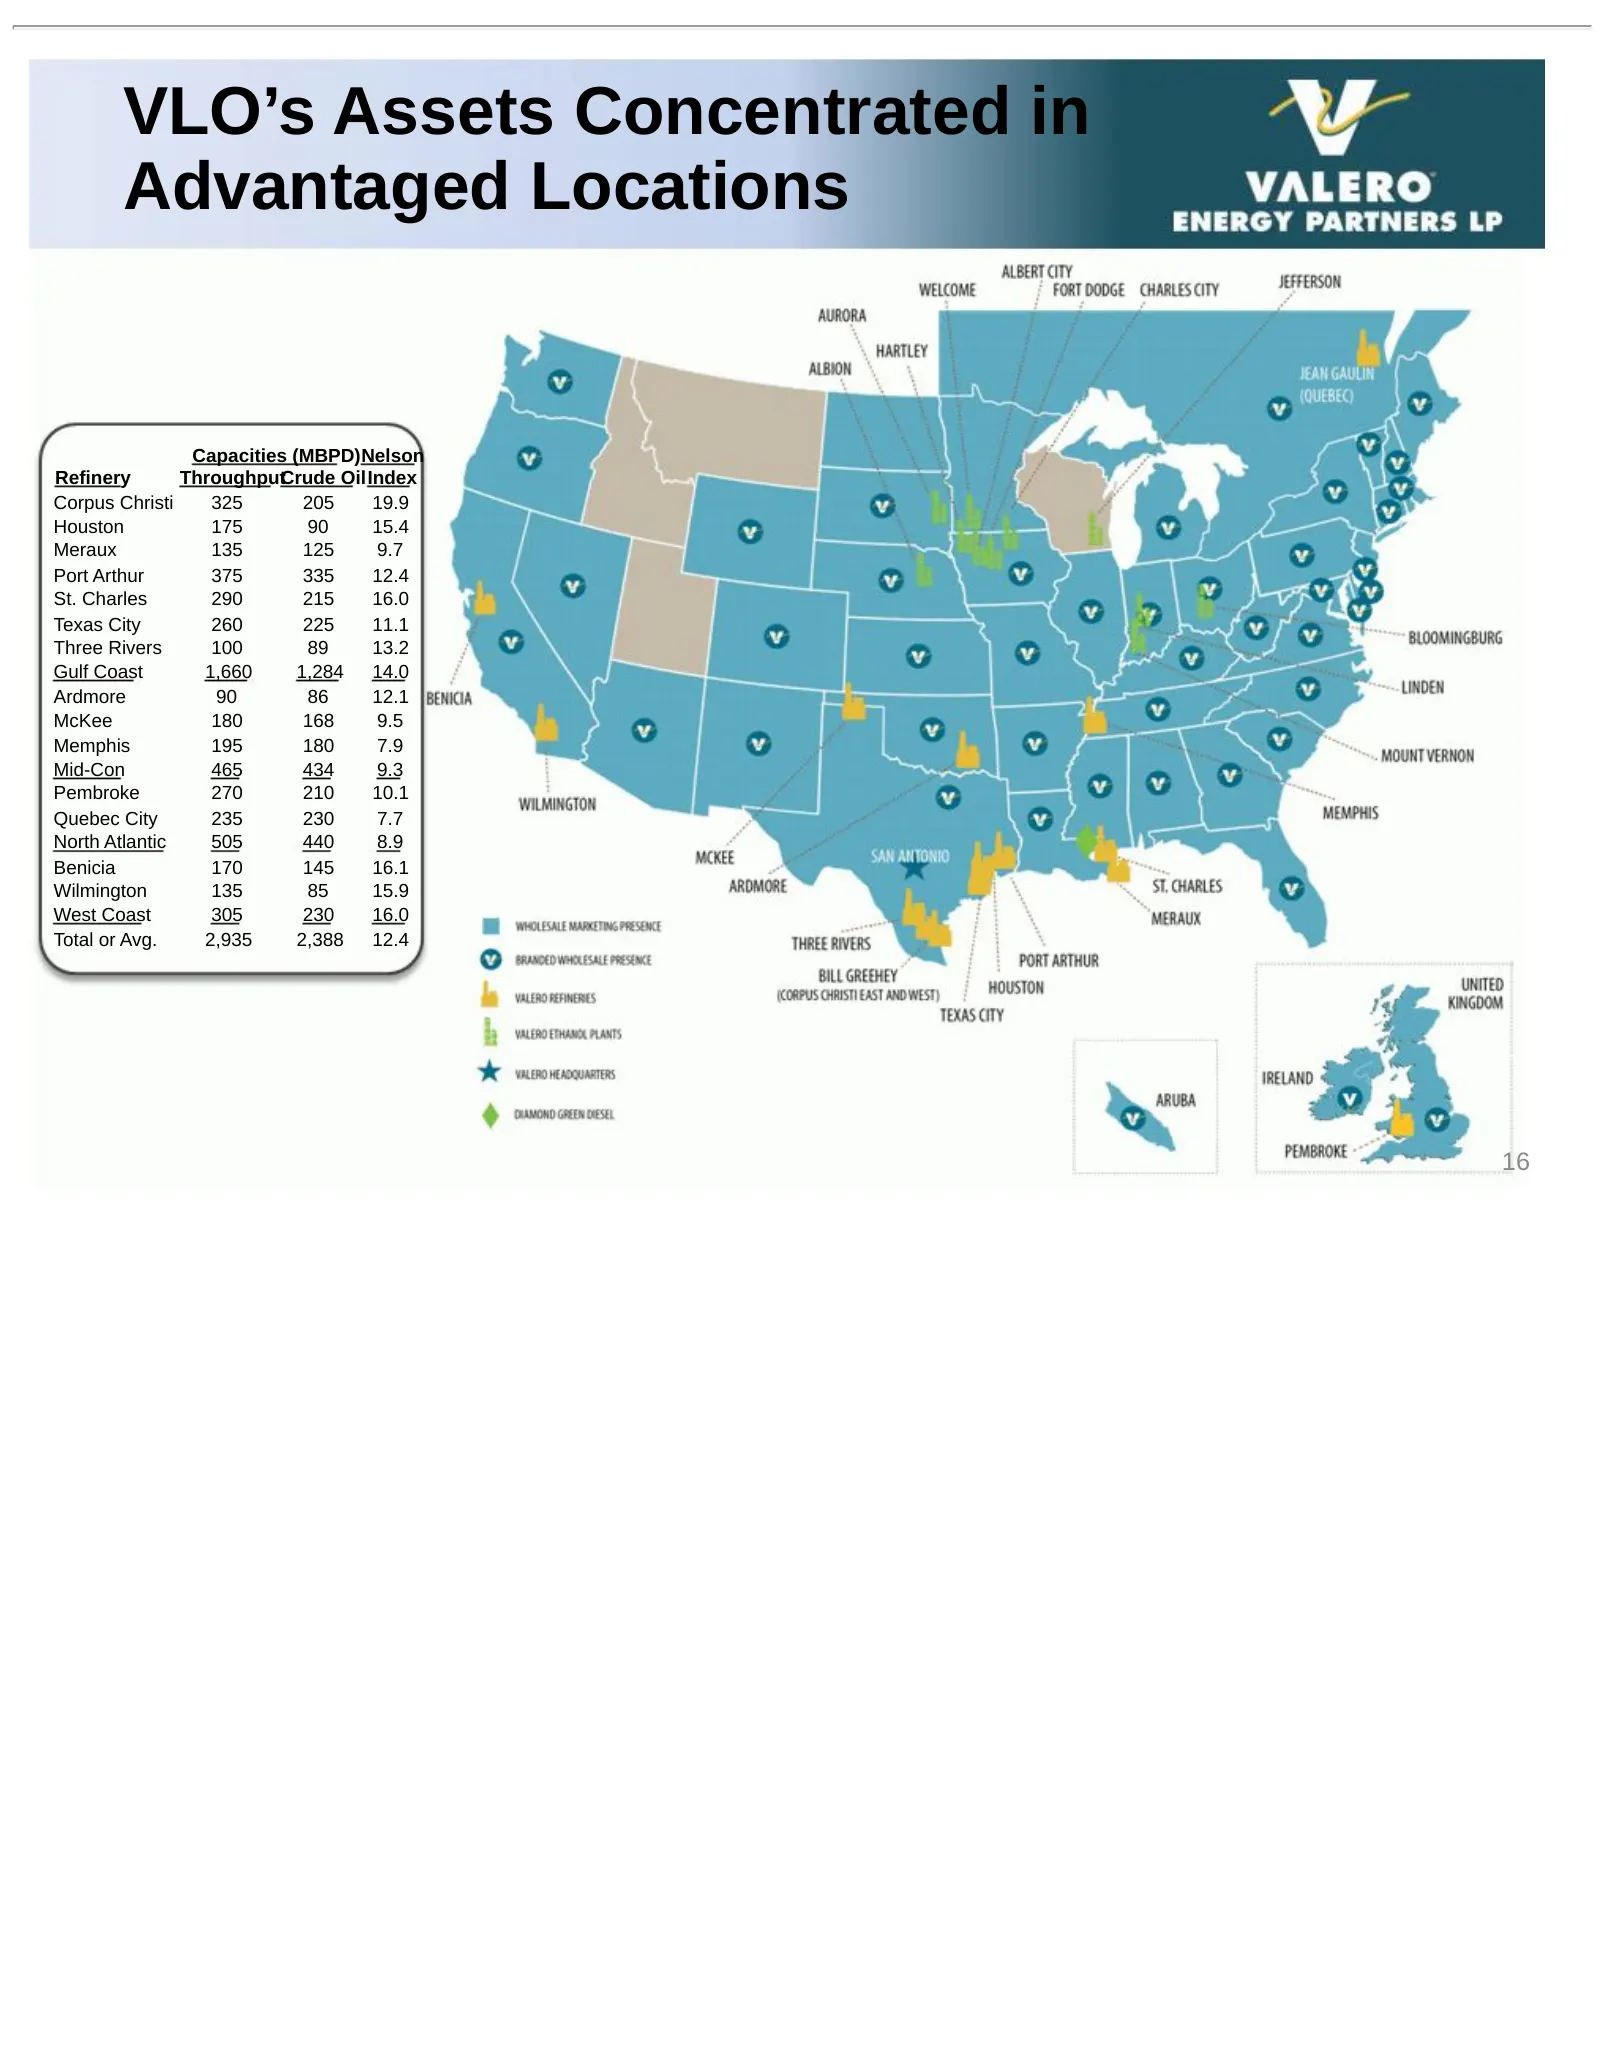
VLO’s Assets Concentrated in Advantaged Locations Capacities (MBPD)Nelson Refinery ThroughputCrude Oil Index Corpus Christi 325 205 19.9 Houston 175 90 15.4 Meraux 135 125 9.7 Port Arthur 375 335 12.4 St. Charles 290 215 16.0 Texas City 260 225 11.1 Three Rivers 100 89 13.2 Gulf Coast 1,660 1,284 14
Slide 17: Non-GAAP Reconciliations
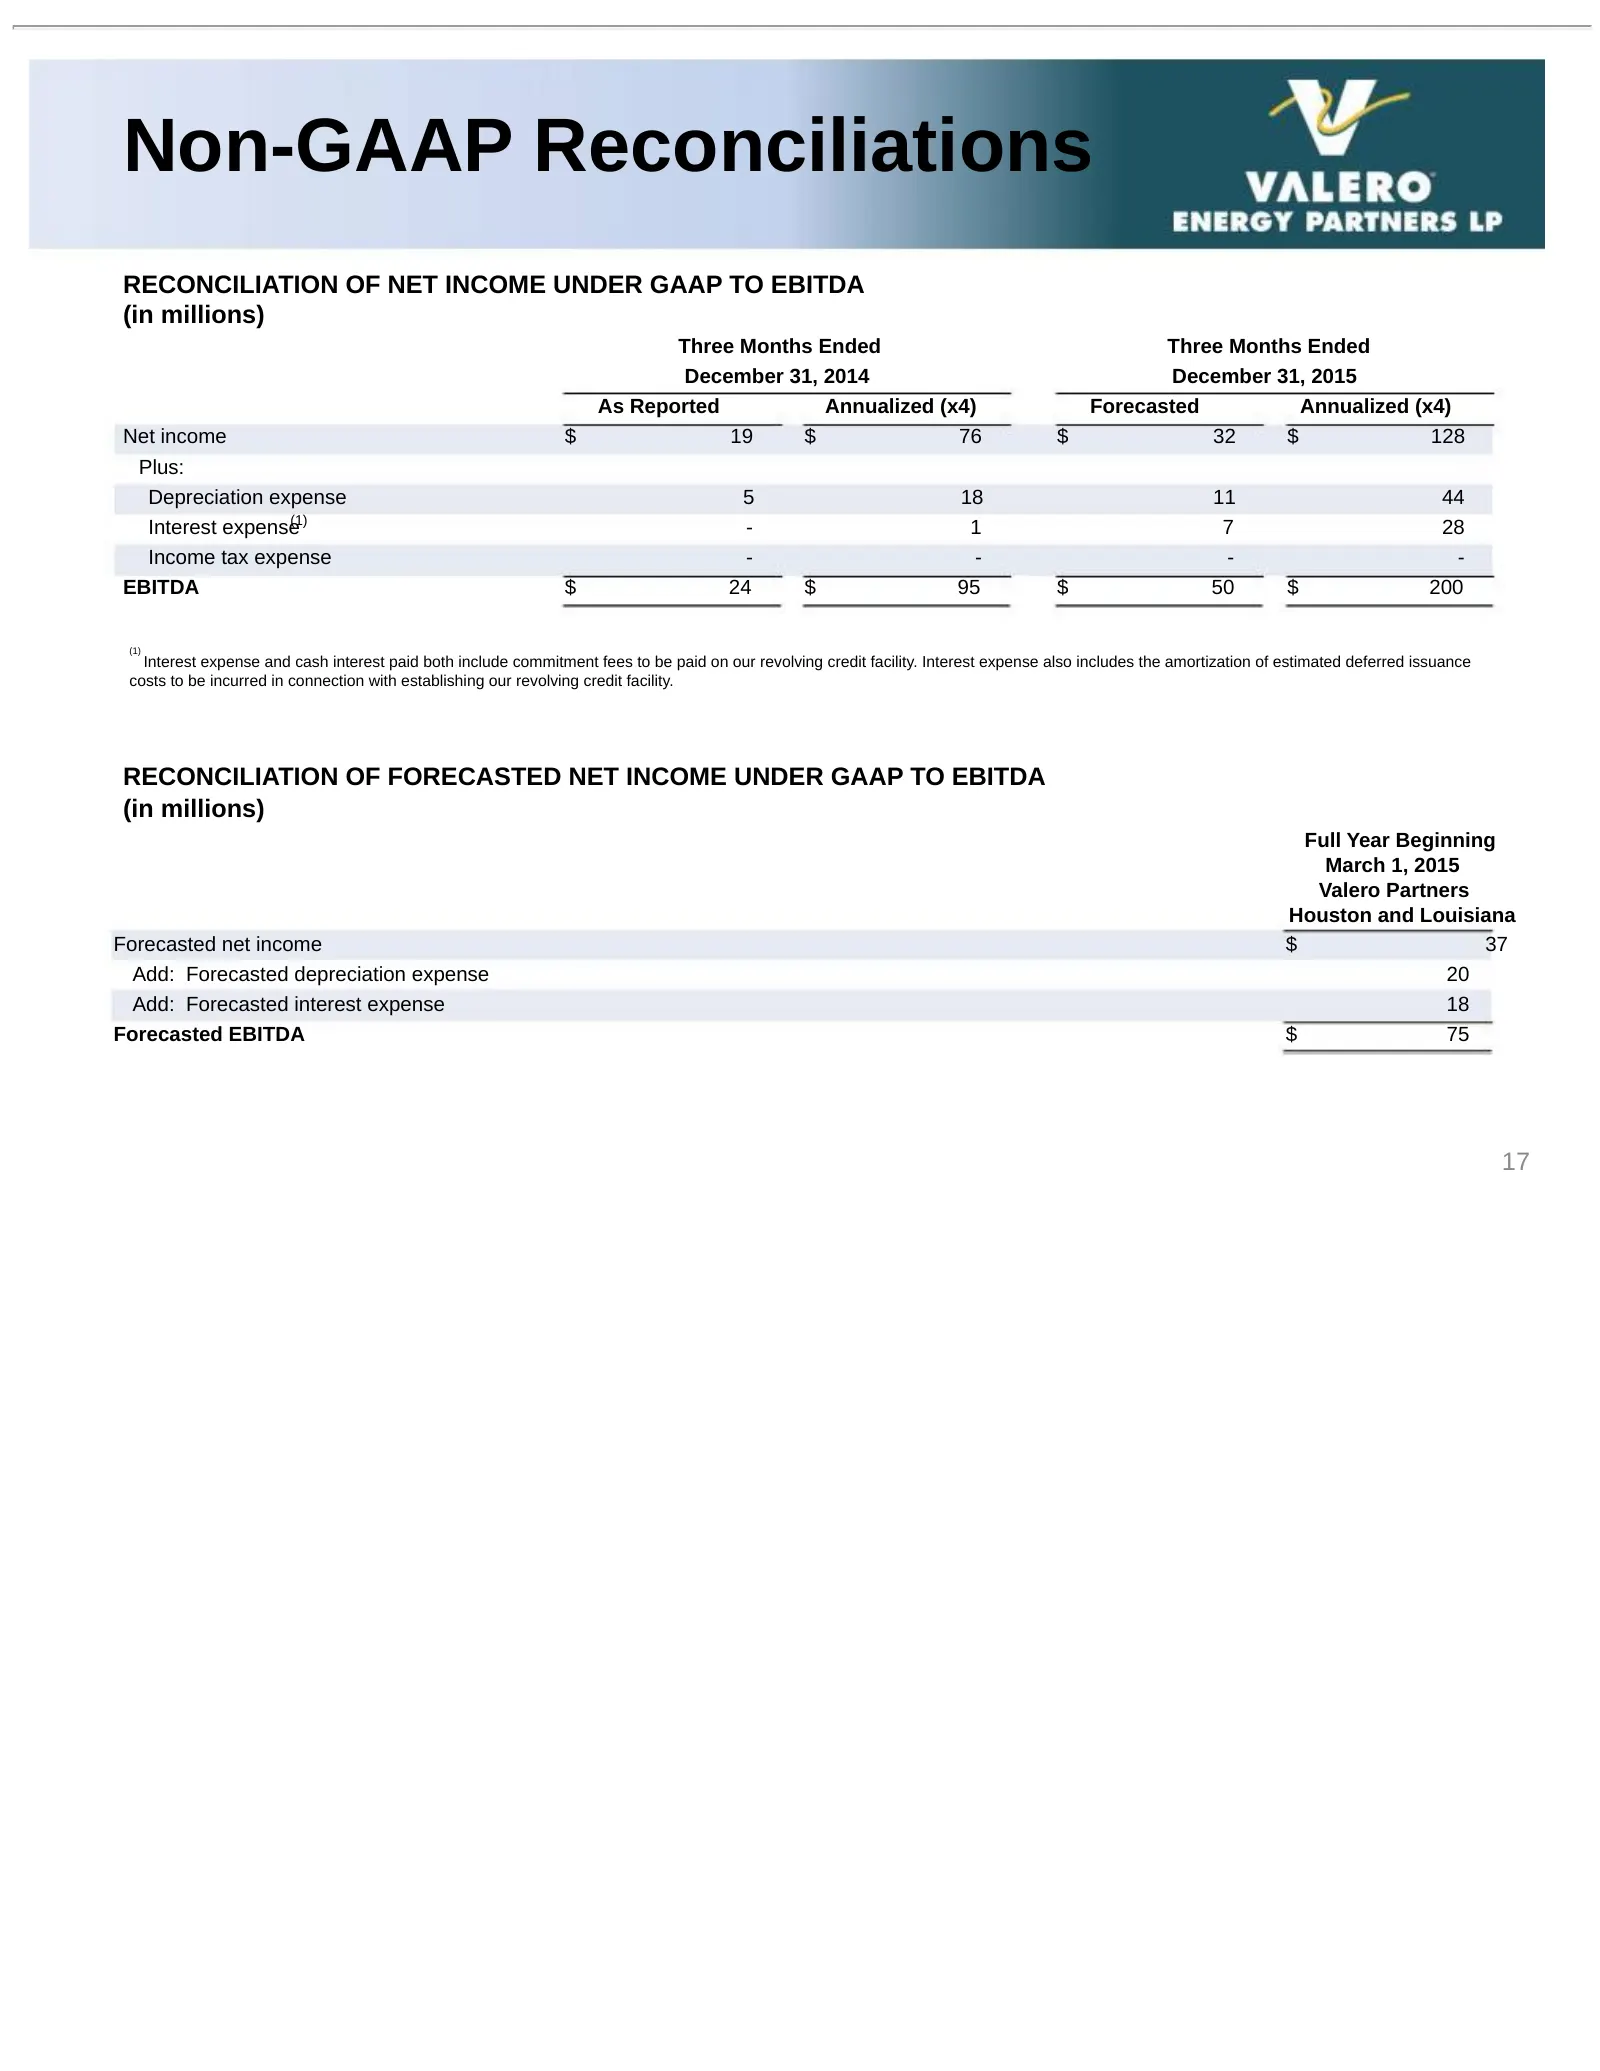
Non-GAAP Reconciliations RECONCILIATION OF NET INCOME UNDER GAAP TO EBITDA (in millions) Three Months Ended Three Months Ended December 31, 2014 December 31, 2015 As Reported Annualized (x4) Forecasted Annualized (x4) Net income $ 19 $ 76 $ 32 $ 128 Plus: Depreciation expense 5 18 11 44 Interest exp
Slide 18: Investor Relations Contacts
Investor Relations Contacts For more information, please contact: John Locke Executive Director, Investor Relations 210-345-3077 john.locke@valero.com Karen Ngo Manager, Investor Relations 210-345-4574 karen.ngo@valero.com 18
Source: SEC EDGAR · 8-K filed Mar 3, 2015
More decks from Valero Energy Partners LP
 Investor Presentation (February 2018)28 slides · Feb 14, 2018
 Investor Presentation (January 2018)27 slides · Jan 5, 2018
 Investor Presentation (June 2017)25 slides · Jun 27, 2017
 Investor Presentation (April 2017)24 slides · Apr 3, 2017
 Investor Presentation (February 2017)25 slides · Feb 28, 2017
 Investor Presentation (November 2016)23 slides · Nov 15, 2016