Westar Energy — 43rd Annual EEI Financial Conference 2008
60 slides from Westar Energy's conference presentation, Nov 7, 2008
Slide 1: There's Never a Good Time for a Liquidity Crisis, But…
There’s Never a Good Time for a Liquidity Crisis, But… Westar Energy, Inc. 43 Annual EEI Financial Conference November 11, 2008 EXHIBIT 99.1 There’s Never a Good Time for a Liquidity Crisis, But… Westar Energy, Inc. 43 Annual EEI Financial Conference November 11, 2008 rd
Slide 2: Westar Business Overview
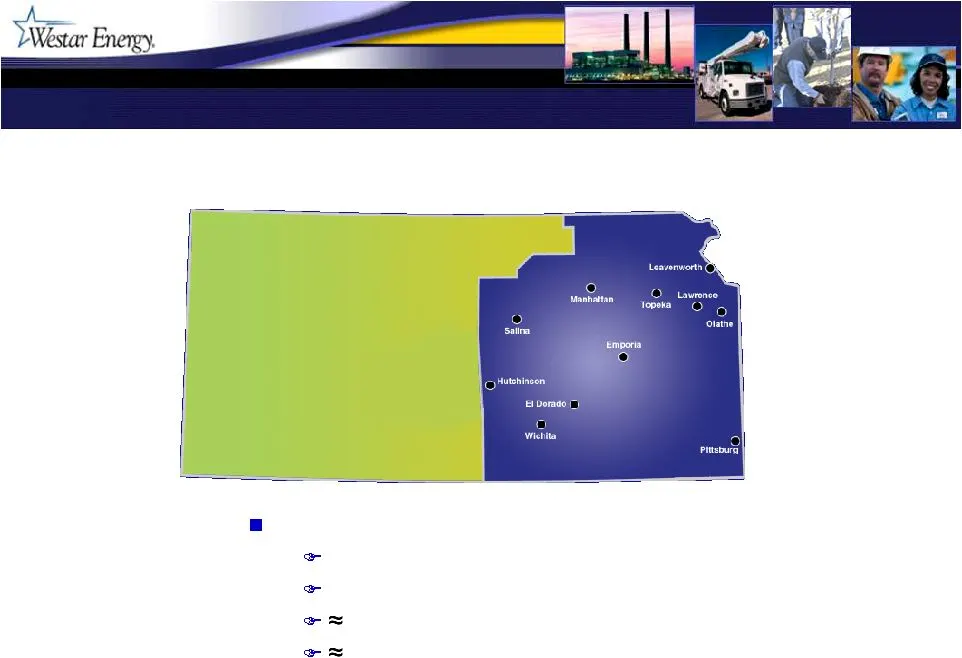
Westar Business Overview Westar Business Overview Key operational facts Pure-play electric Rate regulated 6,500 MW of fuel-diverse generation 675,000 customers Key operational facts Pure-play electric Rate regulated 6,500 MW of fuel-diverse generation 675,000 customers Kansas’ largest electric provi
Slide 3: Our Strategy Leaves Us Well-Positioned
Our Strategy Leaves Us Well-Positioned Our Strategy Leaves Us Well-Positioned Strategic approach is validated by present market conditions Approach to regulation is working Sustaining our ability to meet customers’ needs Strategic approach is validated by present market conditions Approach to regula
Slide 4: Westar's Strategic Approach
Westar’s Strategic Approach Westar’s Strategic Approach Embrace uncertainty rather than assume it away Don’t try to outsmart markets or pretend to know the future Place a high value on flexibility and remaining nimble Preserving options and off ramps Avoid over committing to a single strategy Levera
Slide 5: Our Strategy in Practice…
Our Strategy in Practice… Our Strategy in Practice… Defer commitments to a new base load plant Diversify CAPEX across asset types Flexible capital raising strategies Raise equity capital through multiple channels Work with regulators to: Minimize regulatory lag Make rate increases smaller and less v
Slide 6: Examples of How It's Paying Off
Examples of How It’s Paying Off Examples of How It’s Paying Off Raising capital Capital planning and project management Rates and regulation Raising capital Capital planning and project management Rates and regulation
Slide 7: Advantages in Capital Raising
Advantages in Capital Raising Advantages in Capital Raising In February increased multi-year revolving credit facility by 50% to $750 million Between April 2007 and June 2008 issued more than $500 million of equity Three different methods Three different times All new equity reflected in recent rate
Slide 8: Advantages in Capital Planning & Project Management
Advantages in Capital Planning & Project Management Advantages in Capital Planning & Project Management Virtually complete with the first phase of large CAPEX plan Three scrubbers 600 MW of peaking generation 300 MW of wind First 345 kV transmission line But haven’t yet started the next phase Enviro
Slide 9: Advantages from Rate Mechanisms
Advantages from Rate Mechanisms Advantages from Rate Mechanisms Retail Energy Cost Adjustment (i.e., fuel clause) Operating as planned Environmental Cost Recovery Rider Presently capturing $27 million of annual revenue requirement $22 million estimated annual increase in June FERC Transmission Formu
Slide 10: What This Means in Present Market Turmoil
What This Means in Present Market Turmoil What This Means in Present Market Turmoil More control over our own destiny Not forced into tough capital markets No need to change our strategy Can adjust speed of implementation Avoid the risk of half-completed projects that could reflect dead regulatory i
Slide 11: Settlement of General Rate Case
Settlement of General Rate Case Settlement of General Rate Case
Slide 12: Drivers of Retail Rate Case
Drivers of Retail Rate Case Drivers of Retail Rate Case May 2008, filed request for $178 million increase to recover: Spring Creek investment Emporia Energy Center Phase I plant service Phase II CWIP Wind generation CWIP December 2007 deferred ice storm cost Update capital costs Higher equity ratio
Slide 13: Pending Settlement
Pending Settlement Pending Settlement Unanimous settlement among staff, consumer advocate, and commercial and industrial customers Signed on October 27 and presented to KCC on same day Awaiting Commission approval and order Statutory deadline January 23 Unanimous settlement among staff, consumer adv
Slide 14: Key Provisions of the Settlement
Key Provisions of the Settlement Key Provisions of the Settlement $130 million annual revenue increase Ice storm recovery over five years Increase in steam generating plant depreciation of $7.6 million Wind and Emporia CWIP measurement through September 25 Rate base of $3.1 billion and equity ratio
Slide 15: Capital Planning and Project Management
Capital Planning and Project Management Capital Planning and Project Management
Slide 16: Nearing Closure of First Phase of Major Projects
Nearing Closure of First Phase of Major Projects Nearing Closure of First Phase of Major Projects Second JEC scrubber outage underway and within schedule Wichita-Hutchinson 345 kV expected in-service before year end All three wind farms expected in-service by year end Emporia Phase II on schedule fo
Slide 17: Flexibility With Next Phase of Major Projects
Flexibility With Next Phase of Major Projects Flexibility With Next Phase of Major Projects Given conditions in capital markets and economy We are taking advantage of the flexibility in our strategy Not backed into a corner with “must do now” projects Capability to scale back, stop and re-start any
Slide 18: Financing Plans
Financing Plans Financing Plans
Slide 19: Future Financings
Future Financings Future Financings Plan for continued use of multiple channels and opportunities as they present themselves Amount and type of financing will depend on nexus between our 2009 budget matched with capital market conditions Next long-term financing likely to be a first mortgage bond of
Slide 20: Future Rate Issues
Future Rate Issues Future Rate Issues
Slide 21: Rates & Regulatory Events on the Horizon
Rates & Regulatory Events on the Horizon Rates & Regulatory Events on the Horizon Expect order on rate case settlement by late January FERC approval of forward-looking transmission rate early 2009 Retail TDC to follow shortly Expect ECRR update June 2009 Expect abbreviated rate case to be filed earl
Slide 22: Closing Comments
Closing Comments Closing Comments
Slide 23: Well-Positioned in Present Circumstances
Well-Positioned in Present Circumstances Well-Positioned in Present Circumstances Stable, experienced utility management team Thoughtful, flexible approach to capital planning and financing Focus on containing risks and maintaining returns Collaborative and constructive approach to regulation and en
Slide 24: Future Investor Communications
Future Investor Communications Future Investor Communications Plan to issue 2009 guidance following rate order and with discussion of 2008 results in late February Board typically addresses dividend in late February as well Plan to issue 2009 guidance following rate order and with discussion of 2008
Slide 25: Introduction and Company Strategy
Introduction and Company Strategy Introduction and Company Strategy
Slide 26: Westar Business Overview
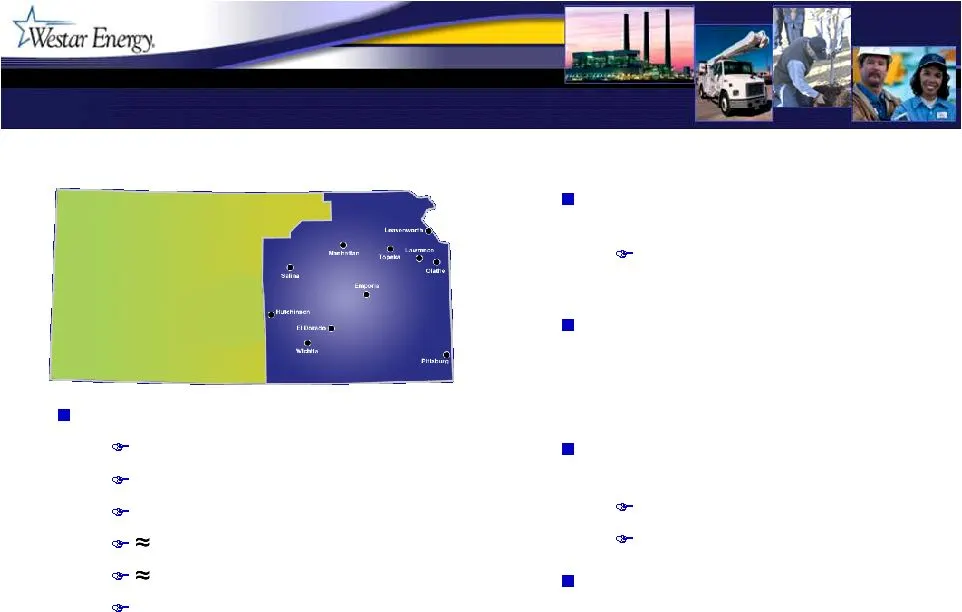
Key operational facts Pure-play electric Vertically integrated Rate regulated 6,500 MW of fuel-diverse generation 675,000 customers Very low retail utility rates Westar Business Overview Westar Business Overview Capable, experienced utility management team Track record of meeting and exceeding commi
Slide 27: Leveraging Unique Attributes
Leveraging Unique Attributes Leveraging Unique Attributes Leverage around unique attributes Low rates Quality baseload resources Minimal present natural gas use Flexible wholesale contracts Abundant wind resources Constructive regulation and energy policy environment Policy support for added transmi
Slide 28: We Have Much In Our Favor
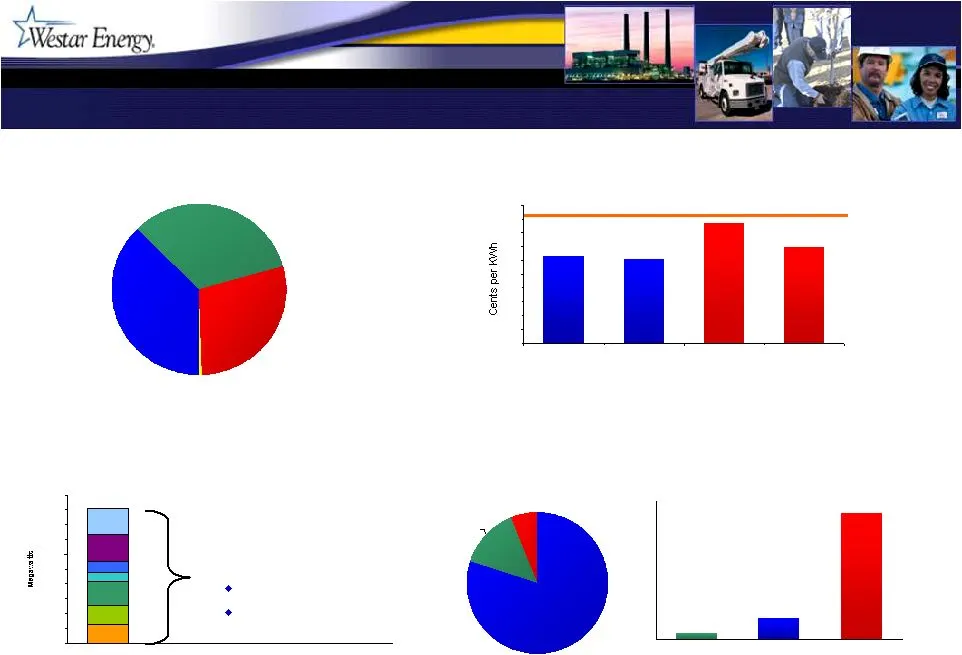
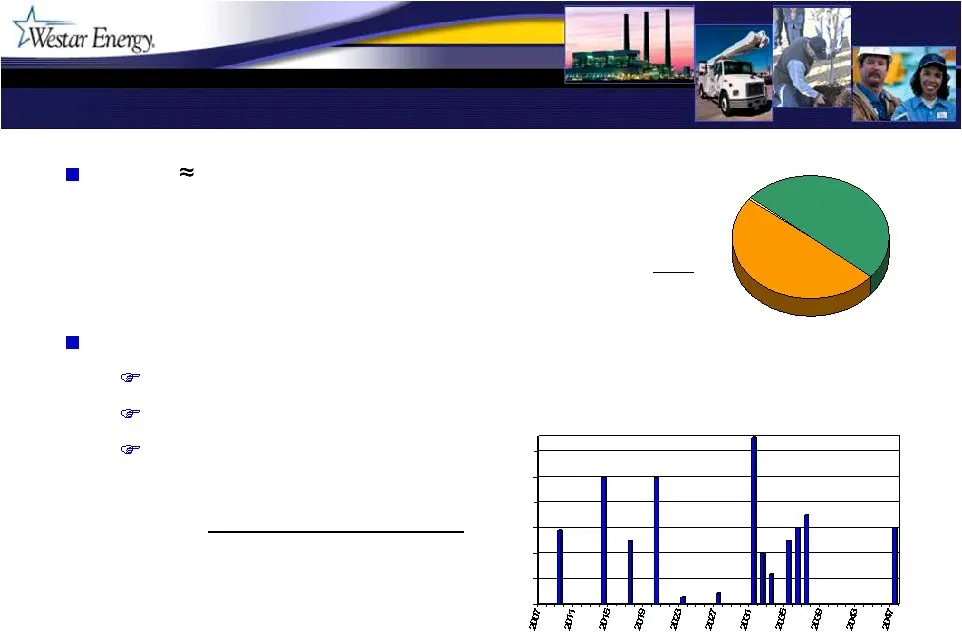
We Have Much In Our Favor We Have Much In Our Favor 0 100 200 300 400 500 600 700 800 900 1,000 2007 2011 2015 2019 Coal 80% Gas 6% Uranium 14% 0.0¢ 1.0¢ 2.0¢ 3.0¢ 4.0¢ 5.0¢ 6.0¢ 7.0¢ 8.0¢ 9.0¢ 10.0¢ Westar Energy North Westar Energy South Empire District Electric (KS) Kansas City Power and Light (K
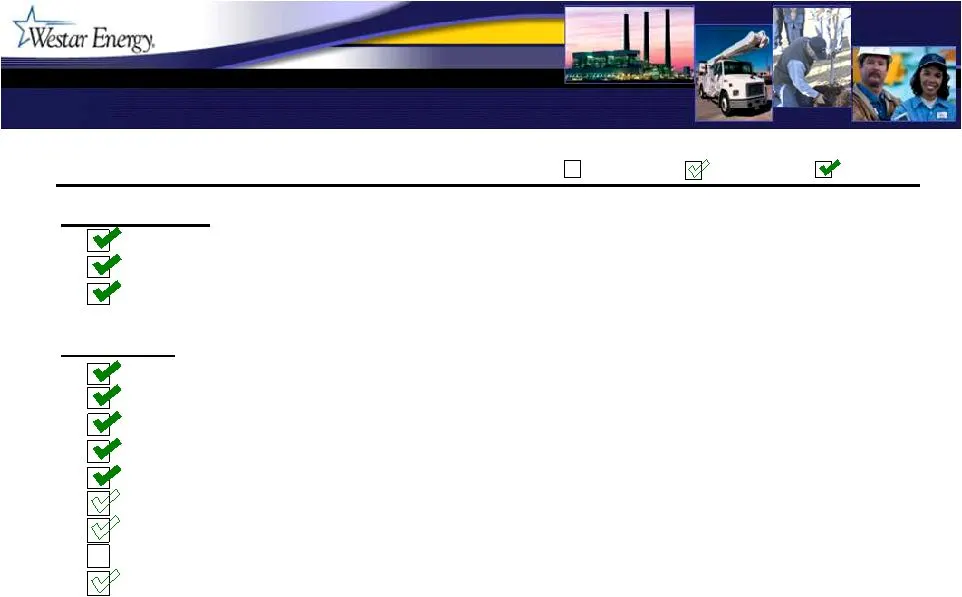
Slide 29: Our Plan / Progress Report
Our Plan / Progress Report Our Plan / Progress Report Status Timing Objective Business Plan Late 2007 Publish “A Strategic Plan for Uncertain TImes” (comprehensive plan) Ongoing Finance capital program targeting 50/50 capital struture Mid 2008 Roll out first phase of conservation and efficiency prog
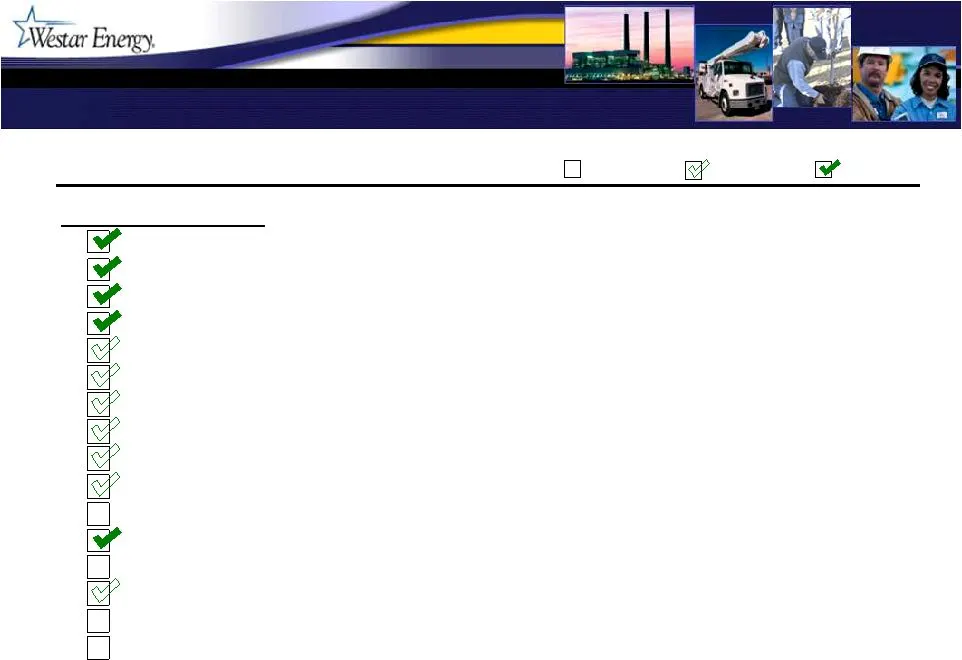
Slide 30: Our Plan / Progress Report (continued)
Our Plan / Progress Report (continued) Our Plan / Progress Report (continued) Status Timing Objective Capital Growth Plan Late 2007 Execute wind contracts Early 2008 Begin construction of Wichita-Salina 345 kV line Spring 2008 First scrubber at JEC on line June 2008 Emporia Energy Center phase I com
Slide 31: Investment Highlights
Investment Highlights Investment Highlights Transparent and straight-forward strategy Pure-play, vertically integrated, regulated electric utility Proven, experienced management team Thoughtful and constructive regulatory mechanics Stable & predictable Aimed at reducing rate volatility and maintaini
Slide 32: Major Capital Projects
Major Capital Projects Major Capital Projects
Slide 33: Transmission Projects
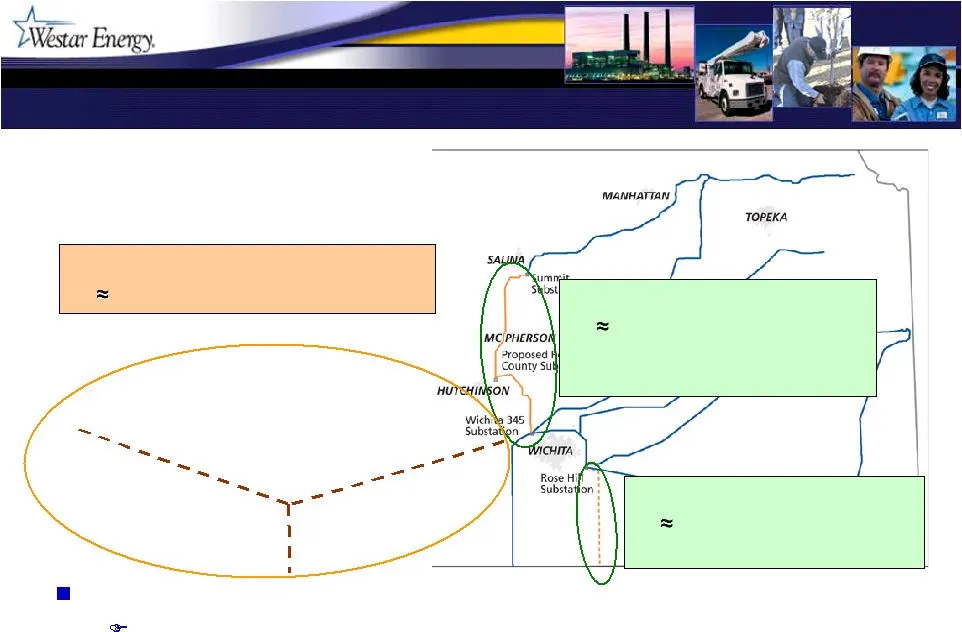
Transmission Projects Transmission Projects Wichita – Salina update Phase I from Wichita to Hutchinson planned to be in-service year-end 2008 Wichita – Salina 100 mile, 345 kV Construction started FERC-approved incentives Rose Hill – Oklahoma 50 mile, 345 kV Siting authority approved Wichita – Salin
Slide 34: Prairie Wind Transmission, LLC
Prairie Wind Transmission, LLC Prairie Wind Transmission, LLC Joint venture between Westar Energy and Electric Transmission America Venture to develop 230-mile, 765 kV transmission in Kansas 50% Westar / 50% ETA ETA is joint venture between AEP Transmission Holding Company and MEHC America Transco P
Slide 35: Coal Plant Emission Controls
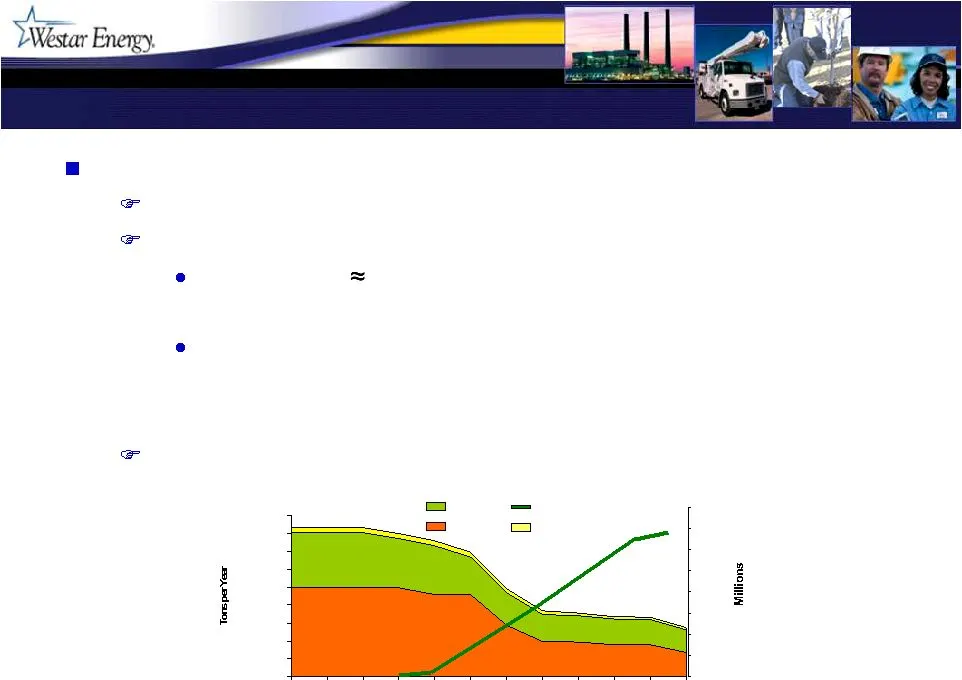
Coal Plant Emission Controls Coal Plant Emission Controls Eight to 10 year program to improve air emissions Investments to reduce SO 2 , NO x , particulates and mercury Currently rebuilding three scrubbers at JEC Project estimate $415 million • First unit placed in service July 2008 On schedule for:
Slide 36: Fossil Capacity Additions
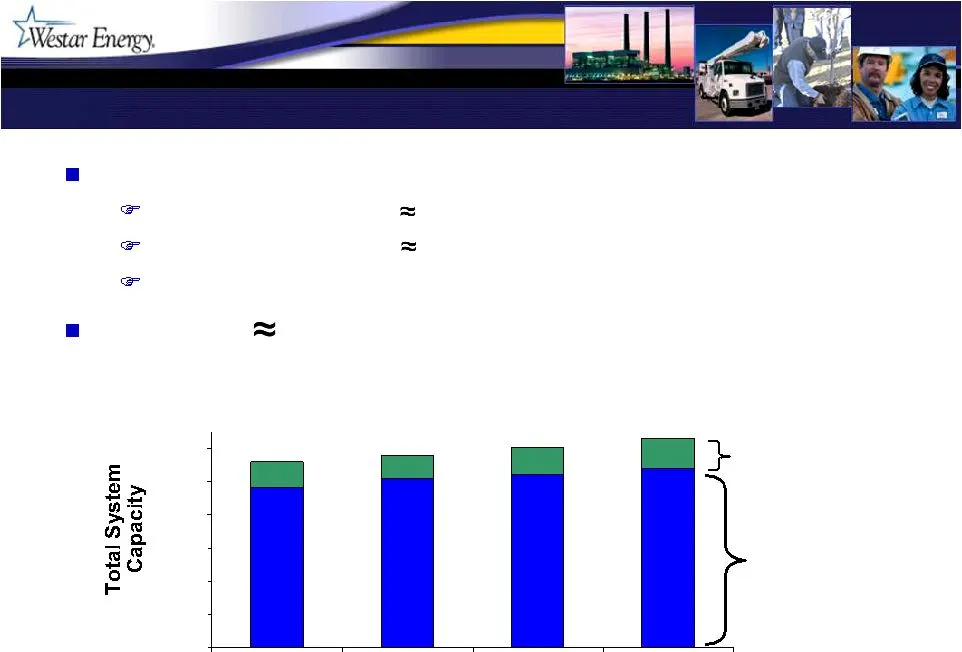
Fossil Capacity Additions Fossil Capacity Additions Peaking capacity Emporia Energy Center 310 MW (phase I) completed spring 2008 Emporia Energy Center 300 MW (phase II) before summer 2009 Potential for smaller additions approximately 2013 Potential for 350 MW intermediate capacity later next decade
Slide 37: Planned Capacity Additions
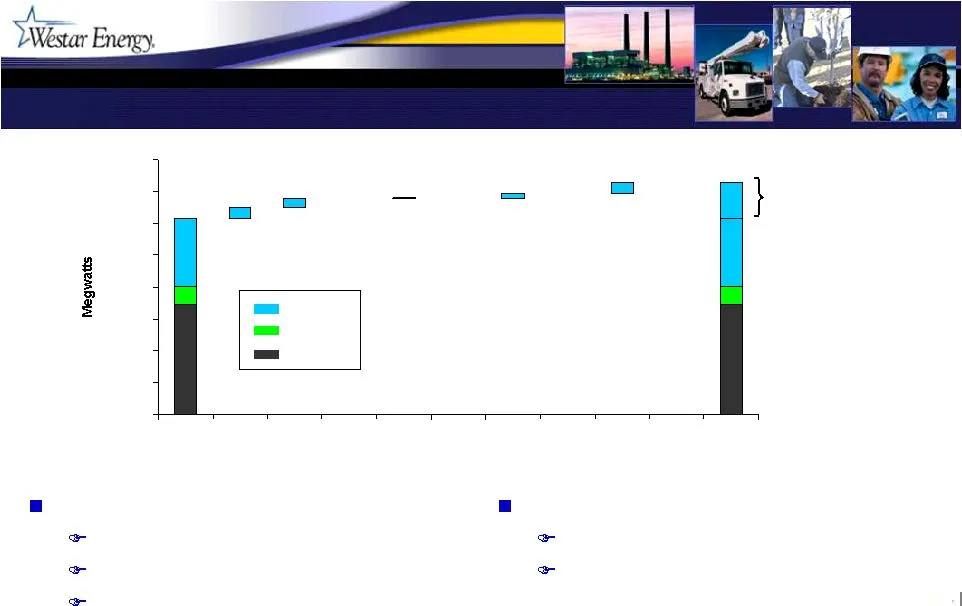
Planned Capacity Additions Planned Capacity Additions 0 1,000 2,000 3,000 4,000 5,000 6,000 7,000 8,000 2007 2008 2009 2010 2011 2012 2013 2014 2015 2016 2017 Emporia Energy Center 610 MW peaking facility Project on budget at $318 million Phase II on schedule for in-service before summer 2009 Estima
Slide 38: Investment in Renewable Energy
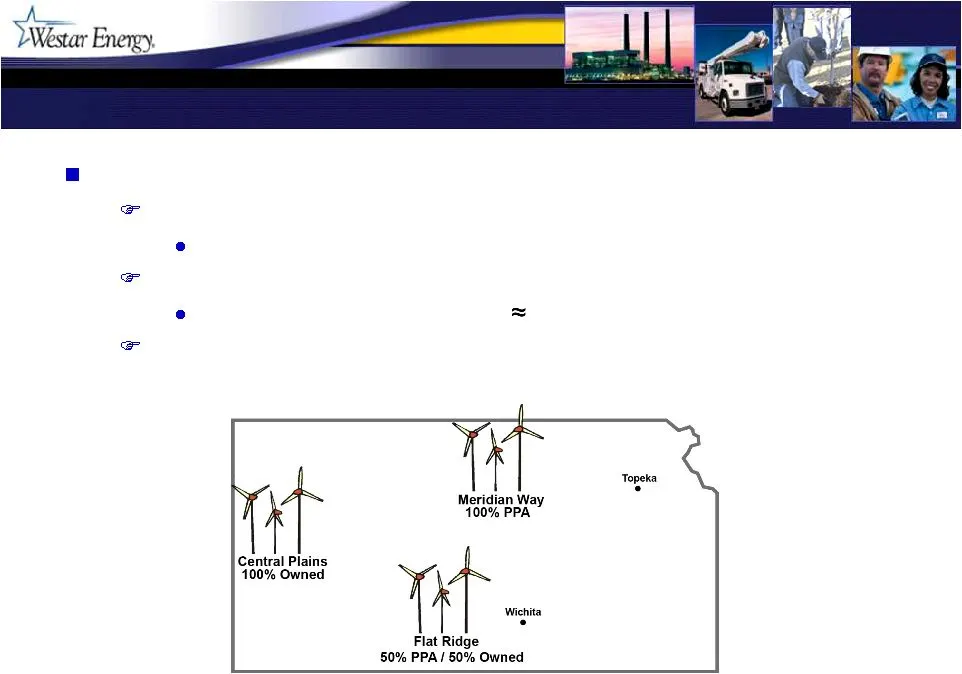
Investment in Renewable Energy Investment in Renewable Energy Developing 300 MW of wind generation KCC granted regulatory pre-approval late 2007 Half owned and half through PPAs Construction began early 2008 Estimated cost of owned projects $285 million All turbines planned to be in service by year
Slide 39: Kansas Energy Policy and Regulatory Mechanics
Kansas Energy Policy and Regulatory Mechanics Kansas Energy Policy and Regulatory Mechanics
Slide 40: Regulatory Approach
Regulatory Approach Regulatory Approach A sound regulatory and energy policy platform Stable, more predictable Collaborative, constructive approach Timely Benefits for customers: Minimize rate volatility A sound regulatory and energy policy platform Stable, more predictable Collaborative, constructi
Slide 41: Customer and Shareholder Benefits
Customer and Shareholder Benefits Customer and Shareholder Benefits Expect customers to benefit from: Continued access to low-cost, environmentally compliant generation Improved system reliability and operational flexibility Expect investors to benefit from: Earnings and dividend growth driven by in
Slide 42: Kansas Energy Policy
Kansas Energy Policy Kansas Energy Policy Legislature and governor understand importance of energy Evidence of this leadership includes: Support for predetermination of ratemaking principles Recognizing CWIP in rates Aggressively encouraging renewable resources Tax incentives Imposing clear statutor
Slide 43: Kansas Corporation Commission
Kansas Corporation Commission Kansas Corporation Commission Commission Three commissioners, by gubernatorial appointment Members serve staggered four-year terms Thomas Wright, (D) chairman, term through 3/15/2010 Joe Harkins, (D) term through 3/15/2011 Michael Moffet, (R) term through 3/15/2008 (tho
Slide 44: Methods of Cost Recovery for Westar
Methods of Cost Recovery for Westar Methods of Cost Recovery for Westar Revenue Requirement Method of Recovery Comment 1. Fuel, purchased power and environmental consumables Timely adjustment based on forecasted cost, with annual true- up to actual costs Allows recovery of actual fuel and purchased
Slide 45: Retail Energy Cost Adjustment (RECA)
Provides timely price adjustment for fuel and purchased power costs Has been monthly Rate case settlement changes to quarterly Retail rates based on forecast of fuel and purchased power costs and retail sales Difference between forecast and actual is accrued/deferred Quarterly approach should yield
Slide 46: Environmental Cost Recovery Rider Mechanics
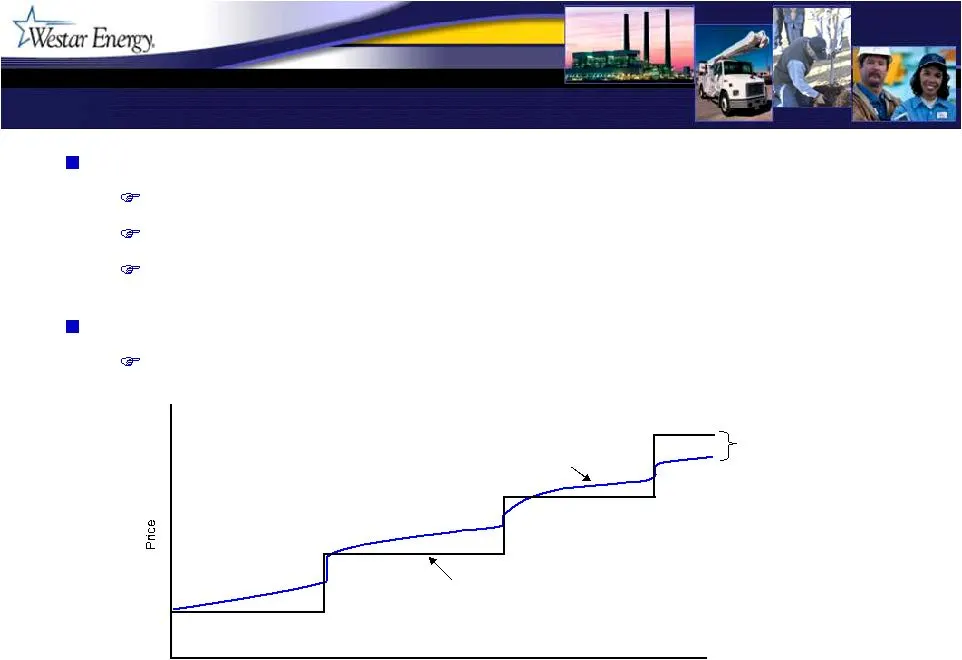
ECRR adjusts retail rates annually to reflect capital costs for emission controls Investment at December 31 begins recovery in rates following June Eliminates need to file a rate case to capture rate base additions Return of and on capital that is already in service Return on capital not yet placed
Slide 47: Illustrative ECRR Mechanics
Regulatory lag limited to months, rather than longer lag typical with traditional rate case filings Equipment investment not yet in-service receives the pretax return on investment until the project is complete, at which time it will then also receive a return of the investment (1) Illustration refl
Slide 48: Transmission Cost Recovery
FERC formula transmission rate Annual update of FERC transmission rate to reflect changes in the cost of service Tariff updated annually in October using projected test year • Forecasted capital expenditures • Forecasted O&M • Tariff is based on year end consolidated capital structure Allowed ROE 11
Slide 49: Statutes for Predetermination and CWIP
Predetermination Prior to construction of a generating facility, a utility may ask KCC to predetermine ratemaking principles that will apply to recovery of the investment over its expected useful life Received predetermination ruling on both Emporia Energy Center and wind additions Construction Work
Slide 50: Financial Overview/Profile
Financial Overview/Profile Financial Overview/Profile
Slide 51: b & § § &@ €& & &€ &@ $$ & & |
b & § § &@ €& & &€ &@ $$ & & |
Slide 52: Financial Highlights
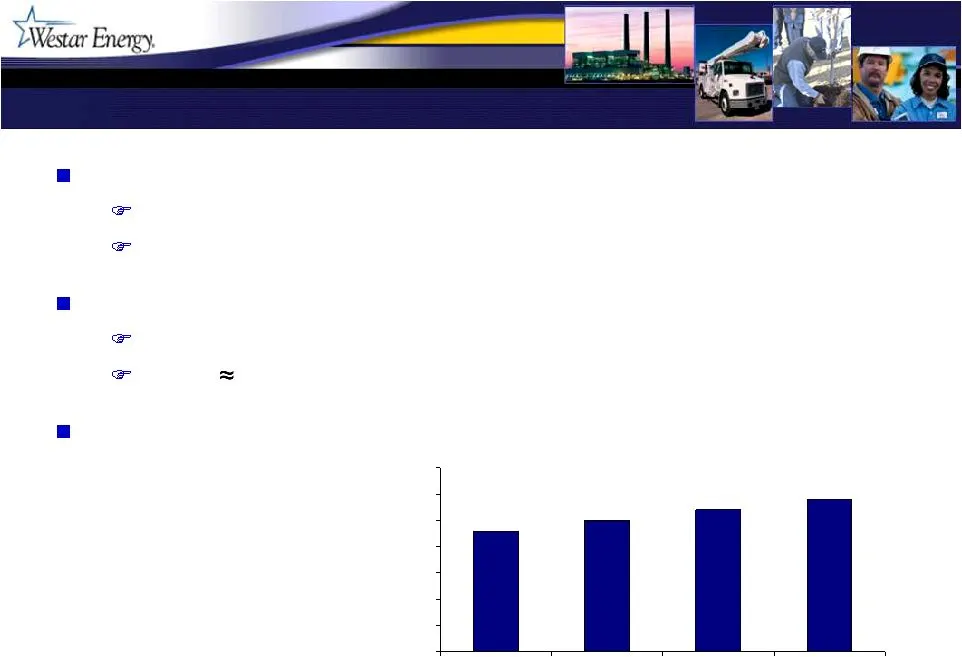
Financial Highlights Financial Highlights In October revised 2008 earnings guidance down to $1.35 - $1.45 Citing primarily cooler weather Excludes potential favorable tax settlement Fourth consecutive year of solid dividend growth Recent 7.4% increase Yield of 6% Dividend target payout 60% - 75% of
Slide 53: Financing Philosophy and Plans
Financing Philosophy and Plans Financing Philosophy and Plans Internal funds to finance dividends and replacement capital Fund growth plan, as necessary, with blend of debt and equity to maintain target capitalization Multiple equity channels available to increase flexibility and reduce risk and cos
Slide 54: Background
Background Background
Slide 55: Management and Organization Structure
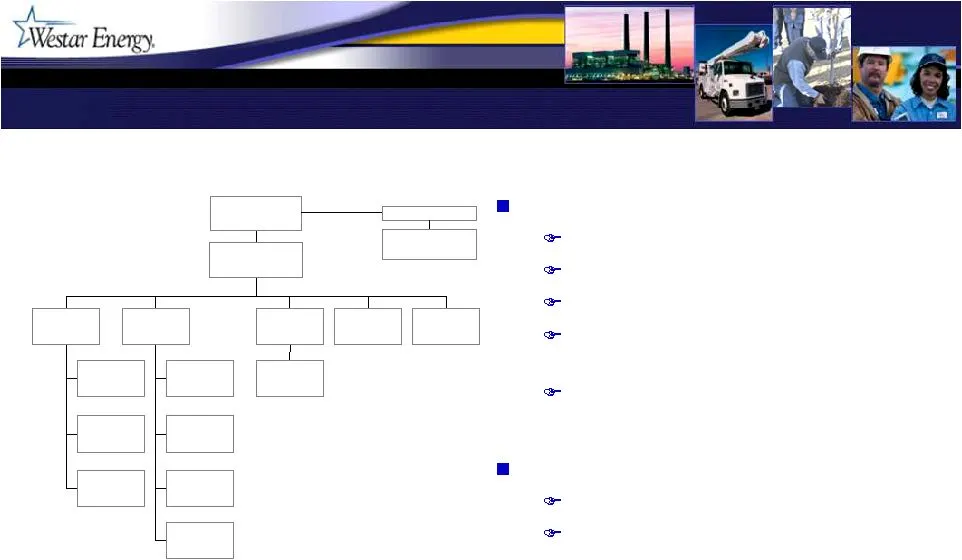
Management and Organization Structure Management and Organization Structure Executive Management President & CEO, Bill Moore EVP & COO, Doug Sterbenz EVP & CFO, Mark Ruelle EVP, Public Affairs / Consumer Services, Jim Ludwig Officers average [20+] years utility experience, largely with Westar Indepe
Slide 56: Westar Energy Legal Structure
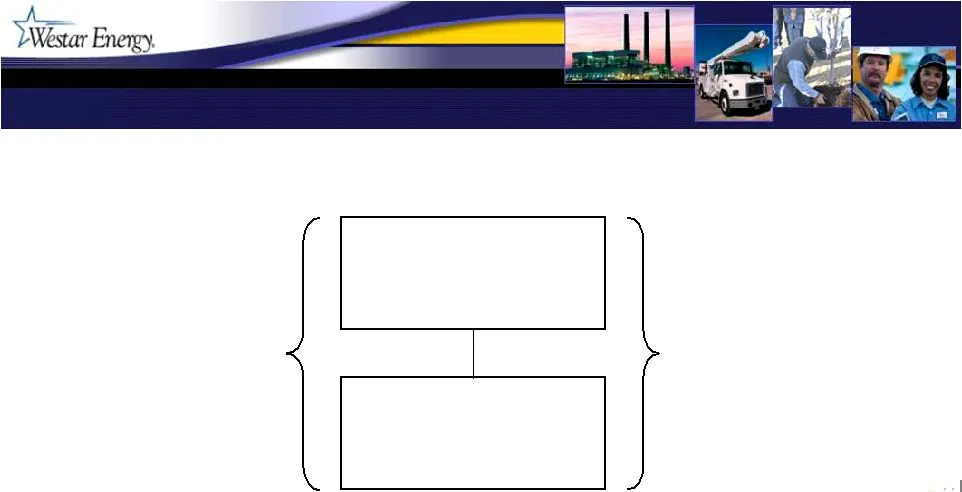
Westar Energy Legal Structure Westar Energy Legal Structure Kansas Gas and Electric Company Consolidated capital structure is used for ratemaking. (Rate regulated utility) (Rate regulated utility) Westar Energy, Inc. Parent Subsidiary Combined company does business under the name “Westar Energy”.
Slide 57: Wholesale Sales
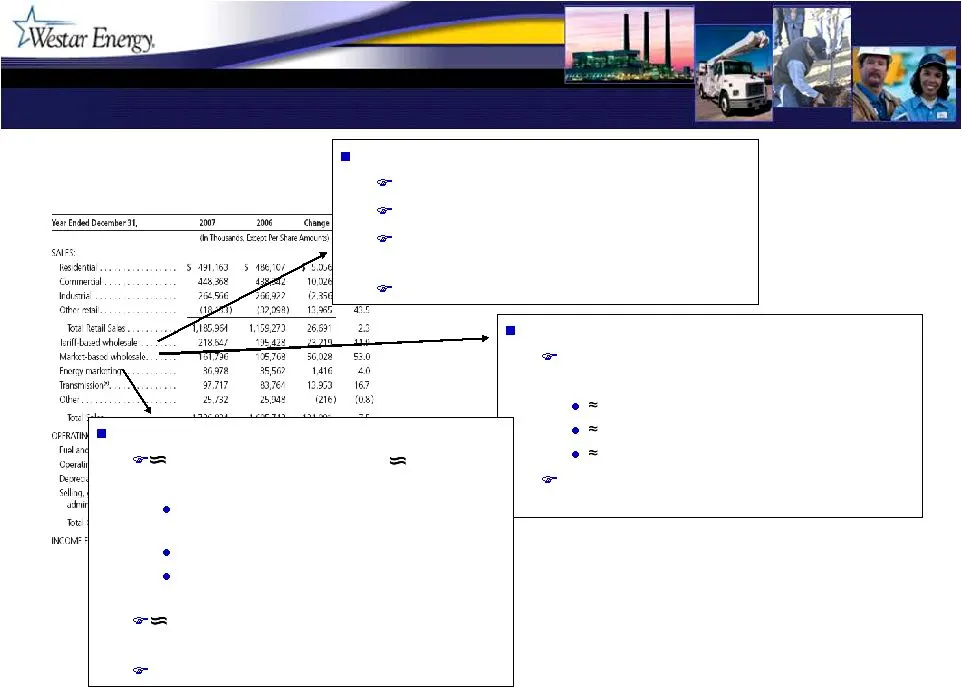
Wholesale Sales Wholesale Sales Market-based sales (asset-based margins) Opportunistic sales using as available capacity 1/3 short - real-time to month 1/3 mid - month up to 6 mos. 1/3 long - 6 mos. up to a 1 year Margins reflected in retail rates through RECA Energy marketing (non-asset margins) 60
Slide 58: Coal Supply
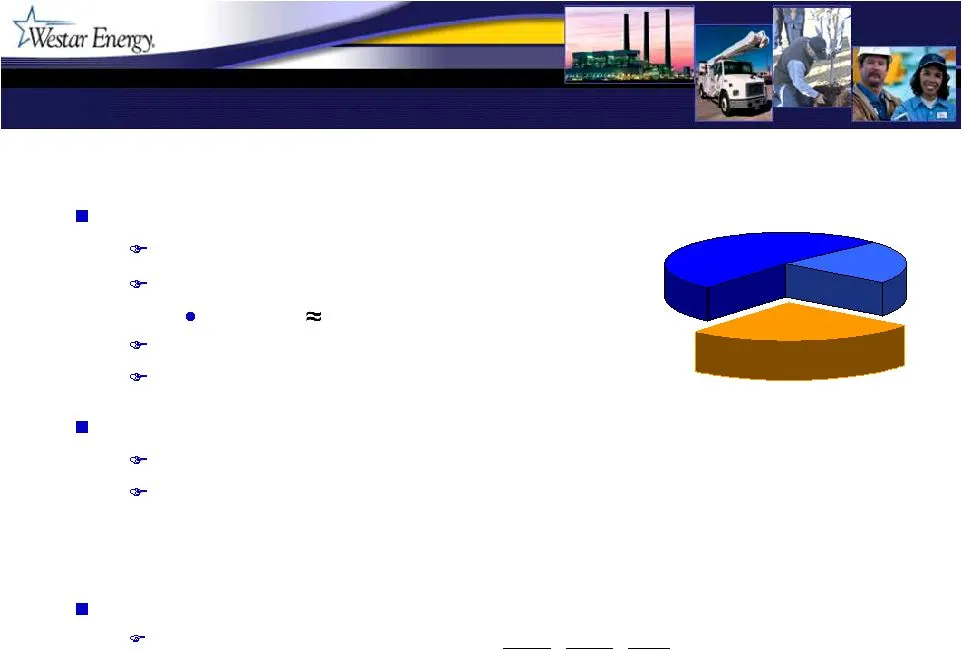
Coal Supply Coal Supply Westar-operated plant supply (80%) JEC supply under contract through 2020 (10+ MM tons/yr) 70% has no market openers 30% reopened on price every 5 years Repriced at $10 million/year increase January 2008 All volumes have cost escalators Rail contract through 2013 LEC/TEC supp
Slide 59: Westar Power Plants
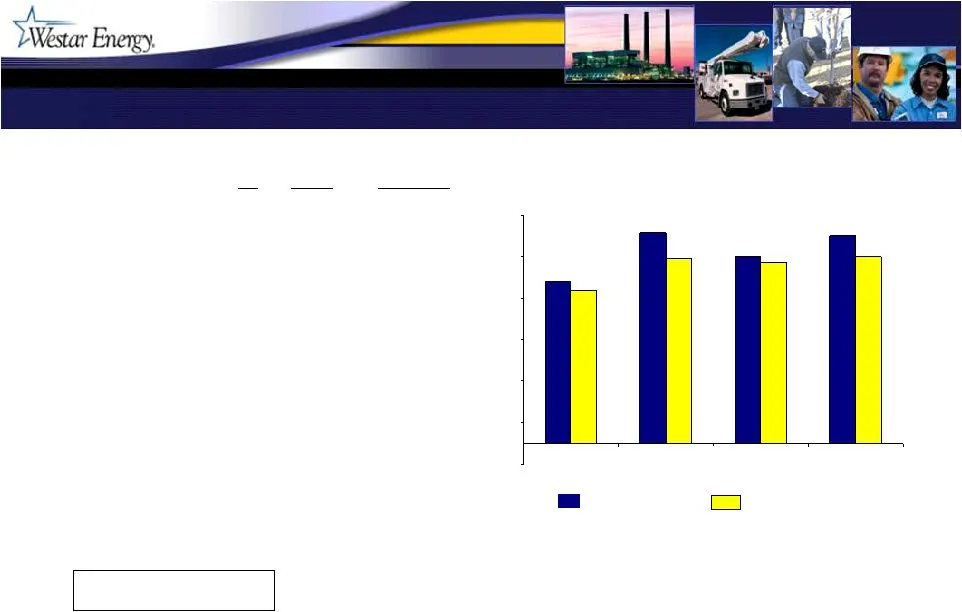
Westar Power Plants Westar Power Plants 77.7% 101.5% 90.3% 100.0% 73.7% 89.3% 90.1% 87.0% -10% 10% 30% 50% 70% 90% 110% Coal Capacity Factor Wolf Creek Capacity Factor Coal Availability Factor Nuclear Availability Factor Westar's MW Operator Years Installed Pulverized coal Jeffrey Energy Center 2,01
Slide 60: Wolf Creek Generating Station
Wolf Creek Generating Station Wolf Creek Generating Station Commercial operation in September 1985 1166 MW Westinghouse PWR Co-owners Westar Energy – 47% (548 MW) Great Plains Energy – 47% KEPCo – 6% Operated by Wolf Creek Nuclear Operating Corporation Separate and dedicated operating company Owned
Source: SEC EDGAR · 8-K filed Nov 7, 2008
More decks from Westar Energy Inc
 Merger or Acquisition (January 2018)27 slides · Jan 10, 2018
 Q3 2017 Earnings Presentation19 slides · Nov 3, 2017
 Q2 2017 Earnings Presentation20 slides · Aug 10, 2017
 Q3 2016 Earnings Presentation6 slides · Nov 1, 2016
 Merger or Acquisition (September 2016)29 slides · Sep 8, 2016
 Merger or Acquisition (August 2016)59 slides · Aug 22, 2016