Hi-Crush Partners LP — Investor Presentation (November 2013)
21 slides from Hi-Crush Partners LP's investor presentation, Nov 6, 2013
Slide 1: Investor Presentation November 2013
Investor Presentation November 2013
Slide 2: Forward Looking Statements
Forward Looking Statements Some of the information in this news release may contain forward-looking statements within the meaning of Section 27A of the Securities Act of 1933, as amended, and Section 21E of the Securities Exchange Act of 1934, as amended (the “Exchange Act”). Forward-looking stateme
Slide 3: Our Platform for Growth
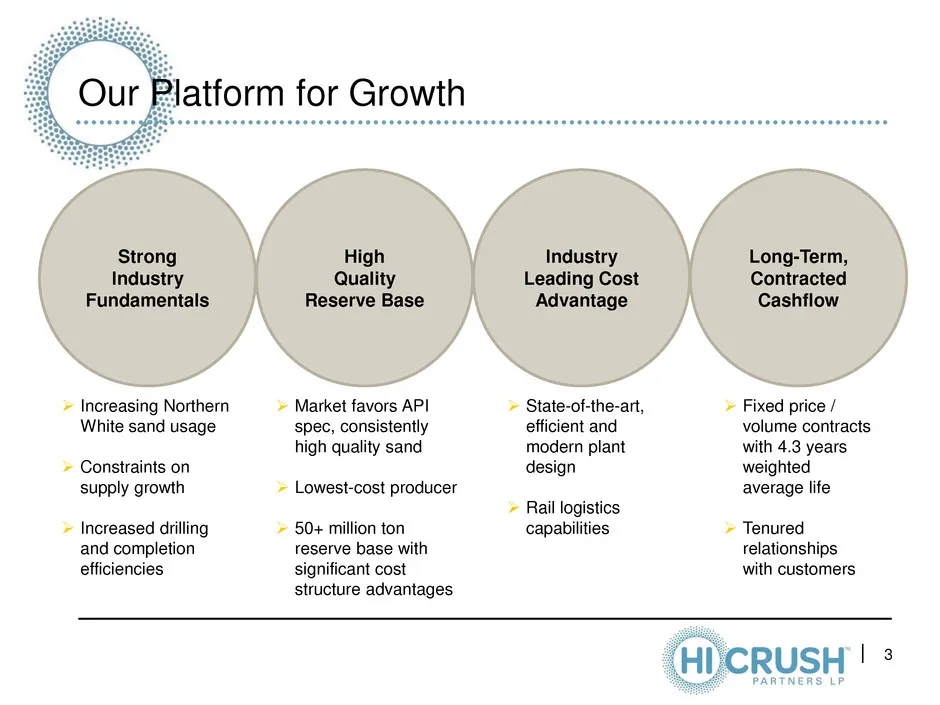
Our Platform for Growth 3 Increasing Northern White sand usage Constraints on supply growth Increased drilling and completion efficiencies Market favors API spec, consistently high quality sand Lowest-cost producer 50+ million ton reserve base with significant cost structure advantages
Slide 4: Maximizing Opportunities for Unit Holders
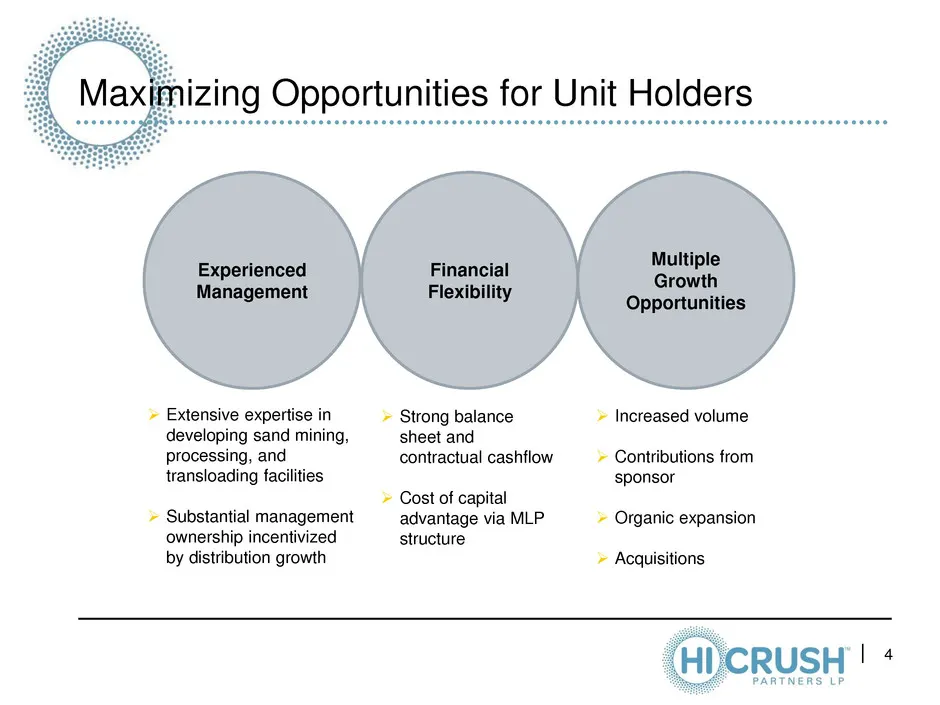
4 Extensive expertise in developing sand mining, processing, and transloading facilities Substantial management ownership incentivized by distribution growth Increased volume Contributions from sponsor Organic expansion Acquisitions Maximizing Opportunities for Unit Holders Multiple Grow
Slide 5: Leveraging Trends
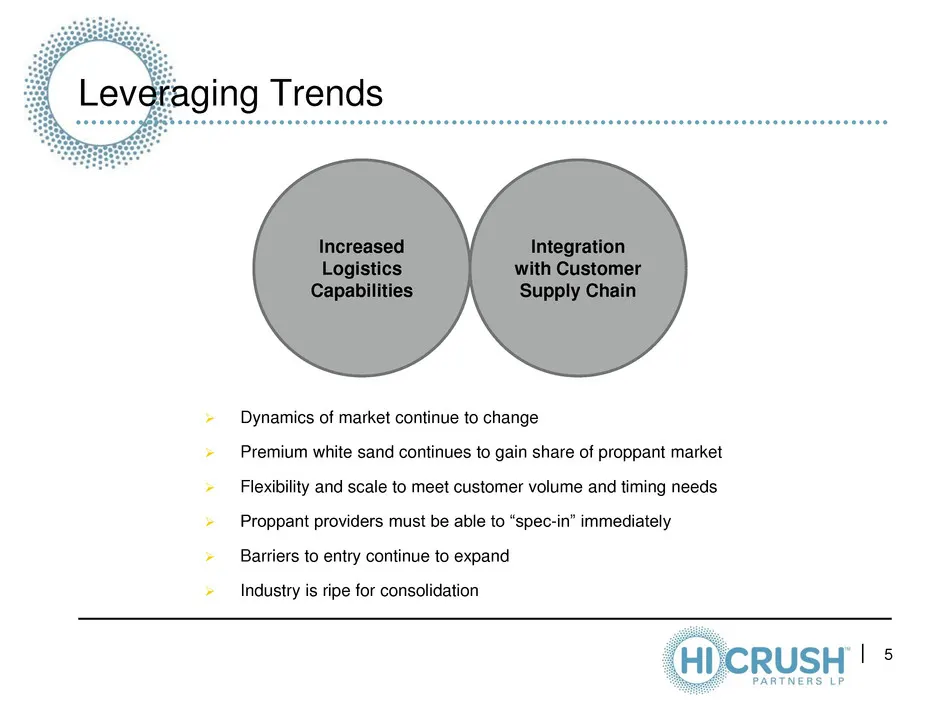
5 Leveraging Trends Integration with Customer Supply Chain Increased Logistics Capabilities Dynamics of market continue to change Premium white sand continues to gain share of proppant market Flexibility and scale to meet customer volume and timing needs Proppant providers must be able to “s
Slide 6: Platform for the Future
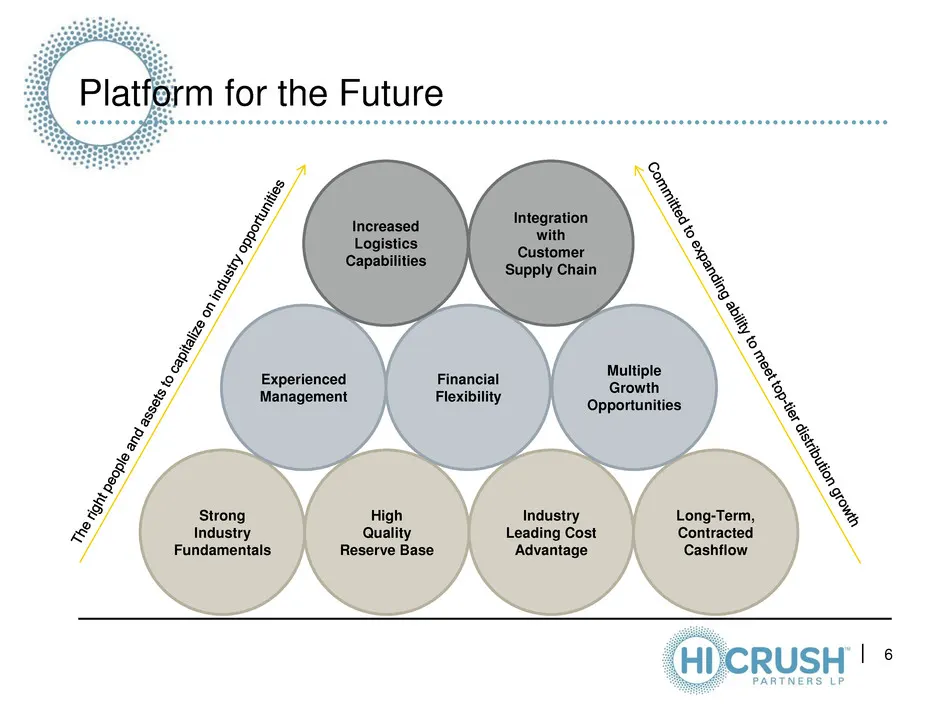
Platform for the Future 6 Long-Term, Contracted Cashflow High Quality Reserve Base Strong Industry Fundamentals Industry Leading Cost Advantage Multiple Growth Opportunities Experienced Management Financial Flexibility Integration with Customer Supply Chain Increased Logistics Capabilities
Slide 7: Distribution Growth
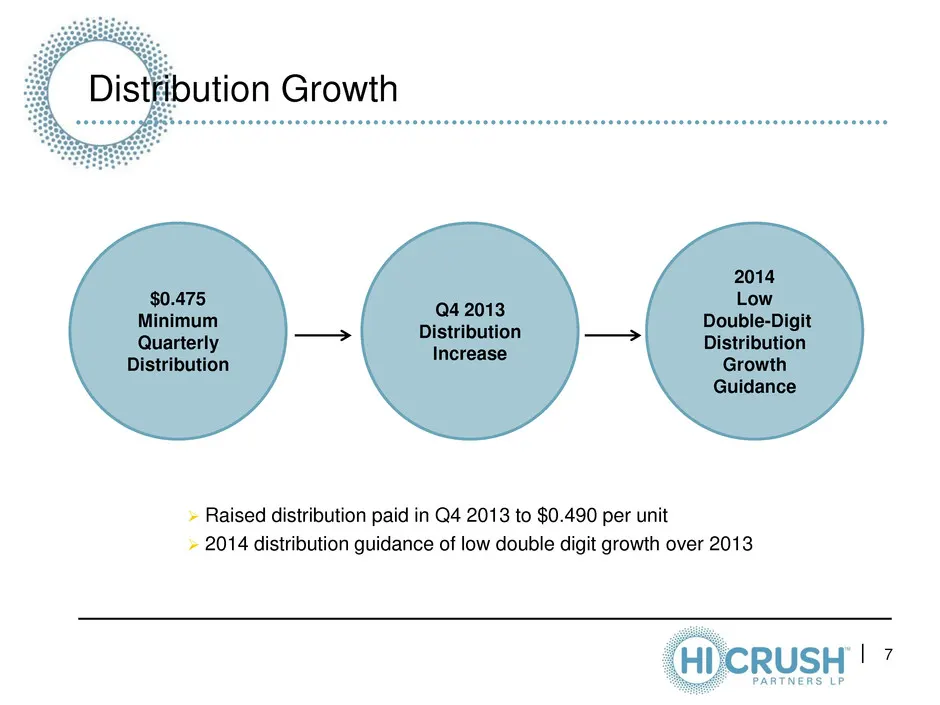
7 Distribution Growth Raised distribution paid in Q4 2013 to $0.490 per unit 2014 distribution guidance of low double digit growth over 2013 2014 Low Double-Digit Distribution Growth Guidance $0.475 Minimum Quarterly Distribution Q4 2013 Distribution Increase
Slide 8: Rapid Growth in Demand for Raw Sand
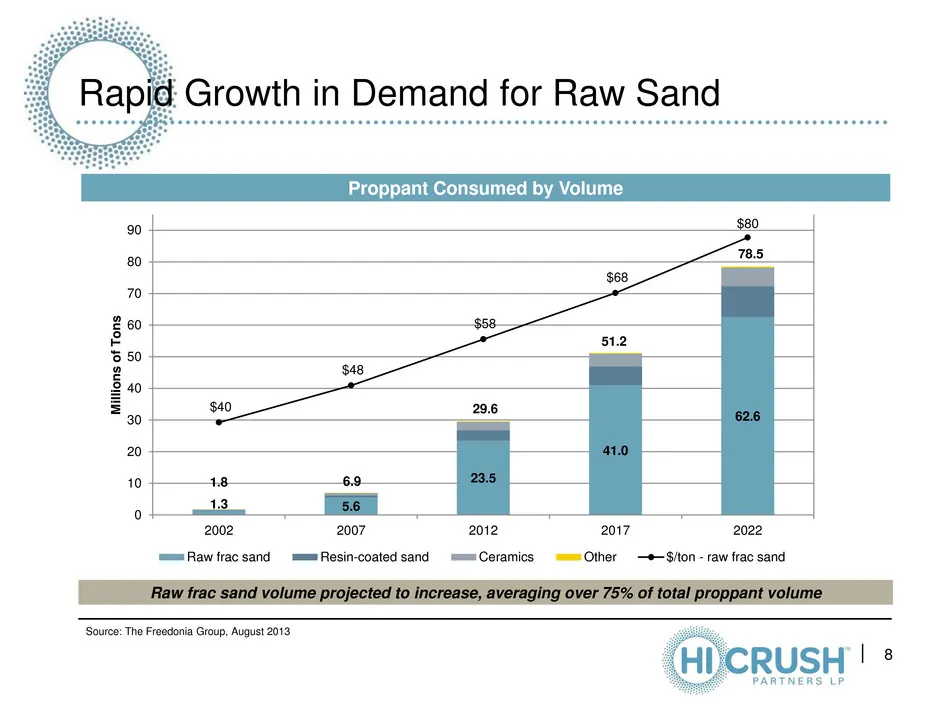
Rapid Growth in Demand for Raw Sand Proppant Consumed by Volume Source: The Freedonia Group, August 2013 Raw frac sand volume projected to increase, averaging over 75% of total proppant volume 8 1.3 5.6 23.5 41.0 62.6 $40 $48 $58 $68 $80 29.6 51.2 78.5 20 30 40 50 60 70 80 0 10 20 30 40 50 60 70 80
Slide 9: Increase in Proppant Intensity
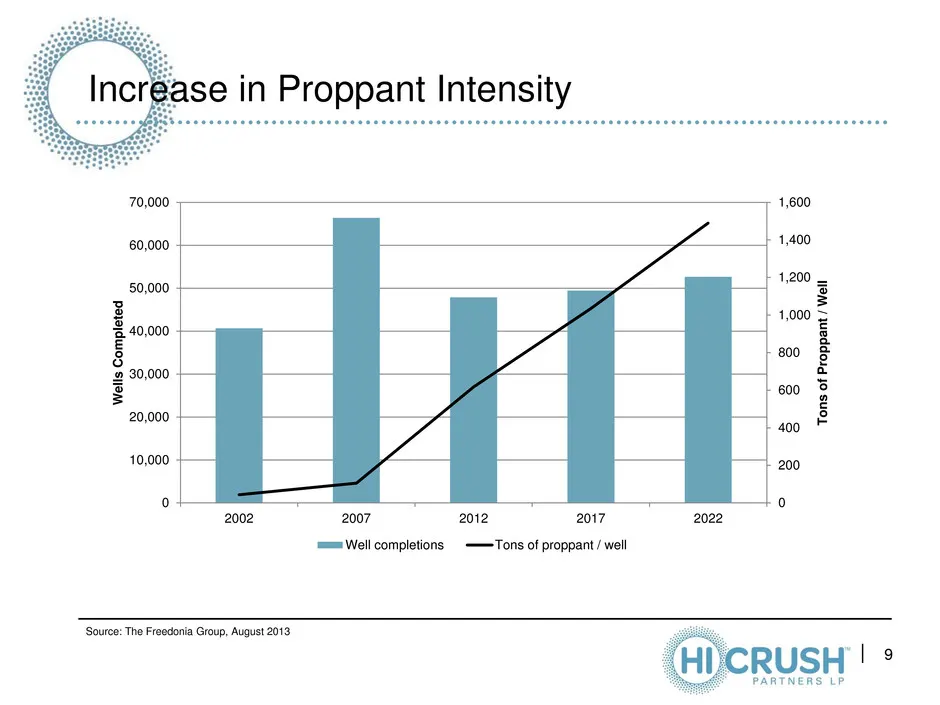
9 Increase in Proppant Intensity 0 200 400 600 800 1,000 1,200 1,400 1,600 0 10,000 20,000 30,000 40,000 50,000 60,000 70,000 2002 2007 2012 2017 2022 T o n s o f P ro p p an t / W el l W el ls C o m p lete d Well completions Tons of proppant / well Source: The Freedonia Group, August 2013
Slide 10: Marcellus Production Doubles 2011-2015
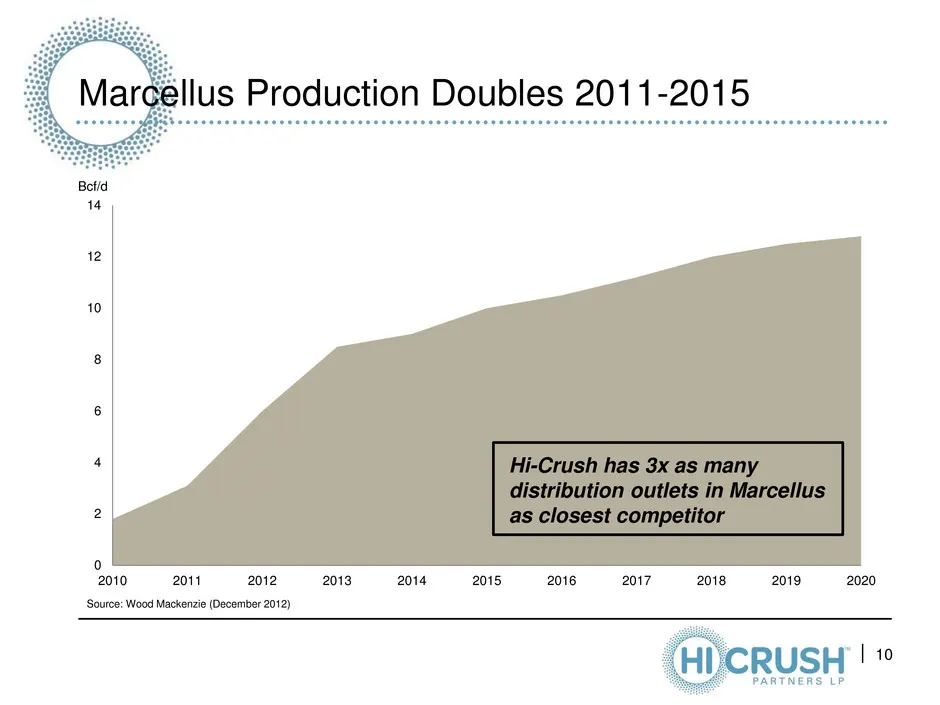
Marcellus Production Doubles 2011-2015 10 0 2 4 6 8 10 12 14 2010 2011 2012 2013 2014 2015 2016 2017 2018 2019 2020 Bcf/d Source: Wood Mackenzie (December 2012) Hi-Crush has 3x as many distribution outlets in Marcellus as closest competitor
Slide 11: Utica Permitting Accelerates
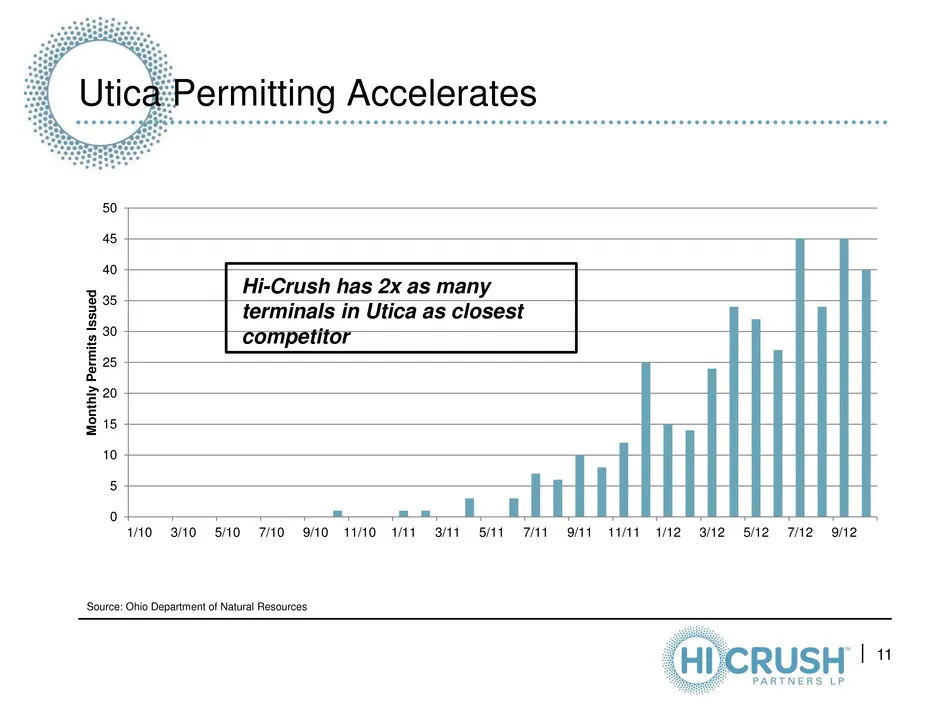
0 5 10 15 20 25 30 35 40 45 50 1/10 3/10 5/10 7/10 9/10 11/10 1/11 3/11 5/11 7/11 9/11 11/11 1/12 3/12 5/12 7/12 9/12 M o n th ly P e rm it s Is s u e d Utica Permitting Accelerates 11 Hi-Crush has 2x as many terminals in Utica as closest competitor Source: Ohio Department of Natural Resources
Slide 12: Logistics Flexibility Critical
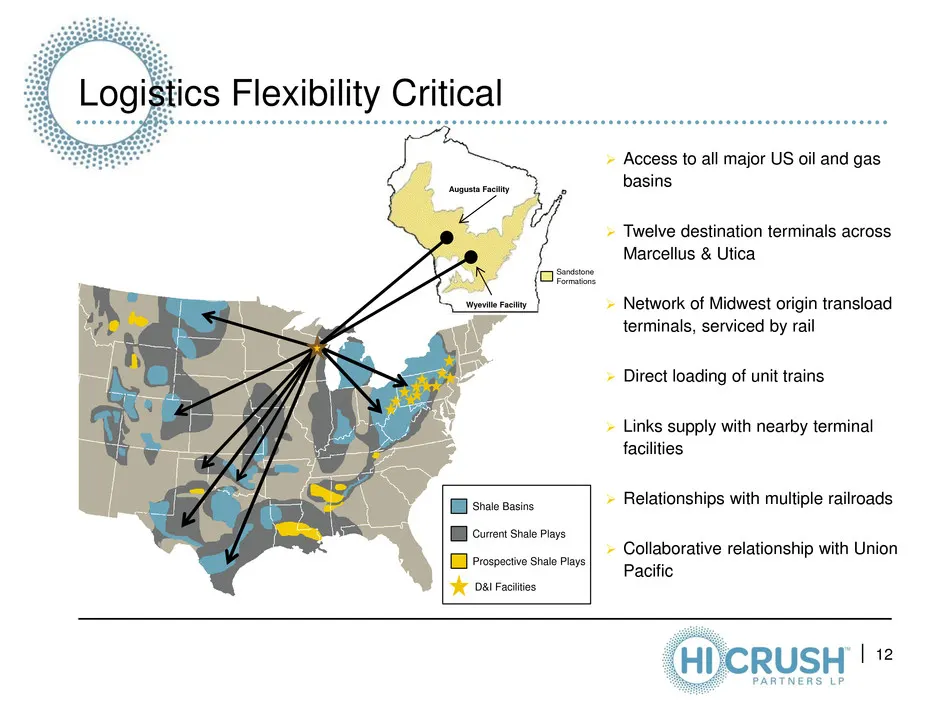
Logistics Flexibility Critical 12 Augusta Facility Wyeville Facility Sandstone Formations Access to all major US oil and gas basins Twelve destination terminals across Marcellus & Utica Network of Midwest origin transload terminals, serviced by rail Direct loading of unit trains Links supp
Slide 13: Leader in Low Production Costs
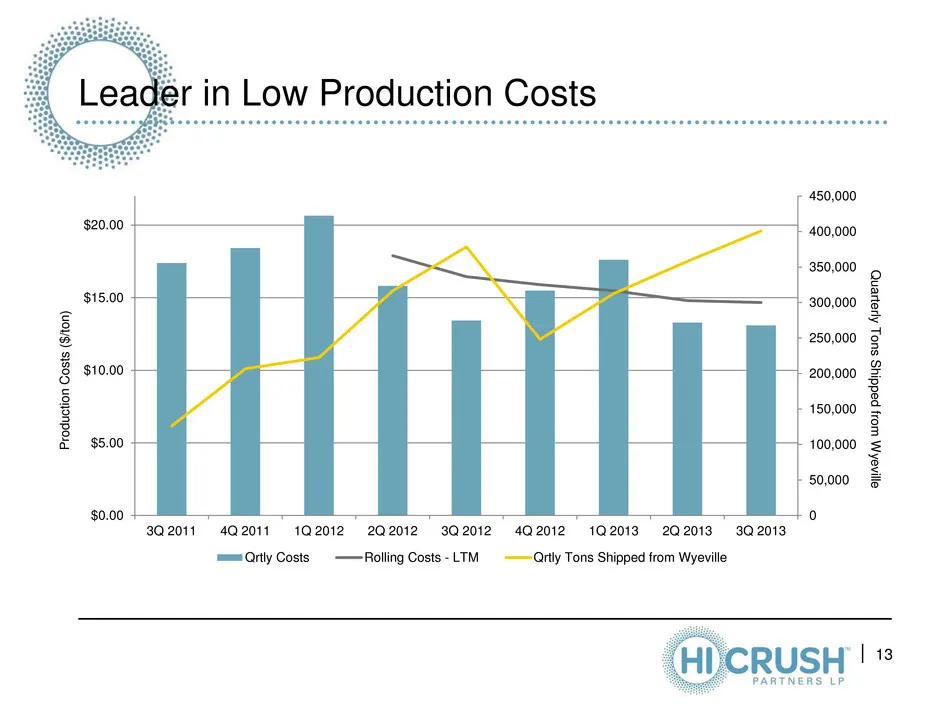
Leader in Low Production Costs 13 P ro d u c ti o n Co s ts ( $/ to n ) Q u a rter ly T o n s S h ip p e d fro m W ye v ille 0 50,000 100,000 150,000 200,000 250,000 300,000 350,000 400,000 450,000 $0.00 $5.00 $10.00 $15.00 $20.00 3Q 2011 4Q 2011 1Q 2012 2Q 2012 3Q 2012 4Q 2012 1Q 2013 2Q 2013 3Q 20
Slide 14: Delivering Benefits, Creating Value
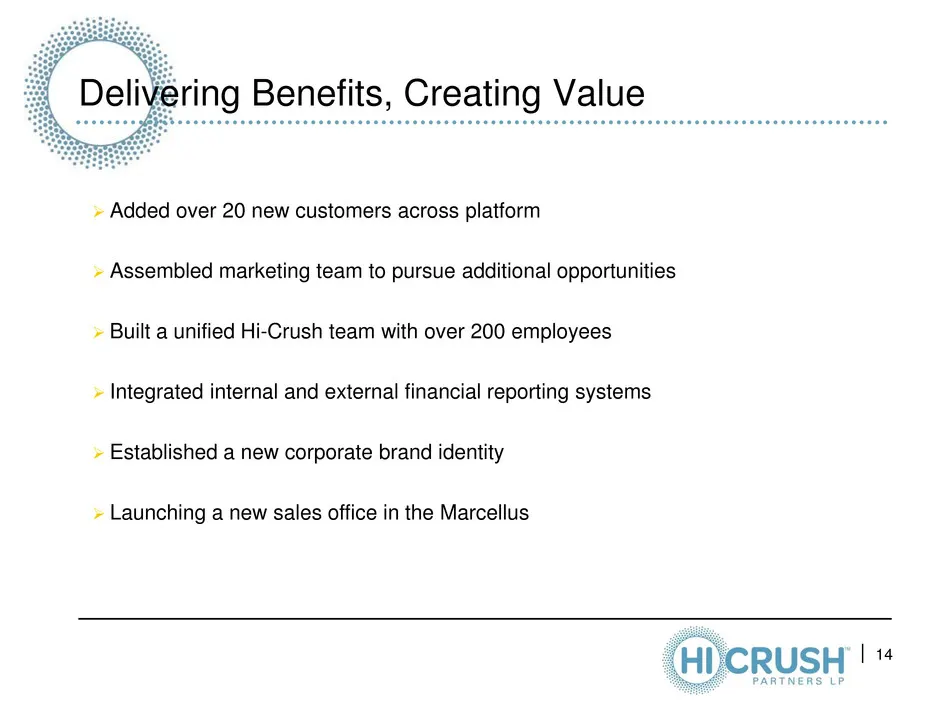
Delivering Benefits, Creating Value 14 Added over 20 new customers across platform Assembled marketing team to pursue additional opportunities Built a unified Hi-Crush team with over 200 employees Integrated internal and external financial reporting systems Established a new corporate bran
Slide 15: D&I Transaction Summary
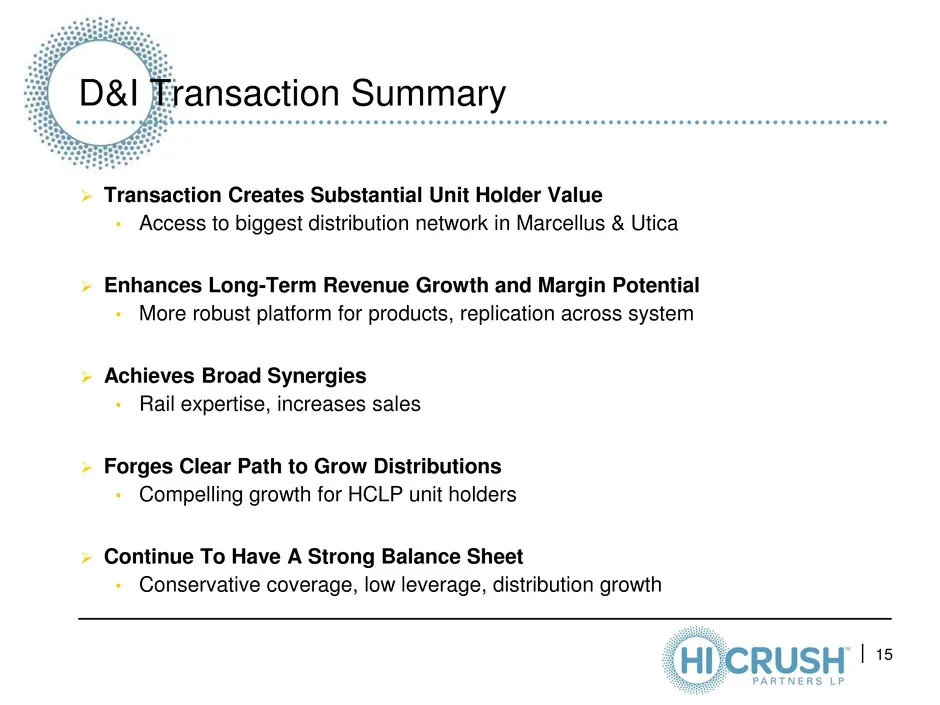
Transaction Creates Substantial Unit Holder Value • Access to biggest distribution network in Marcellus & Utica Enhances Long-Term Revenue Growth and Margin Potential • More robust platform for products, replication across system Achieves Broad Synergies • Rail expertise, increases sales For
Slide 16: Multiple Future Opportunities
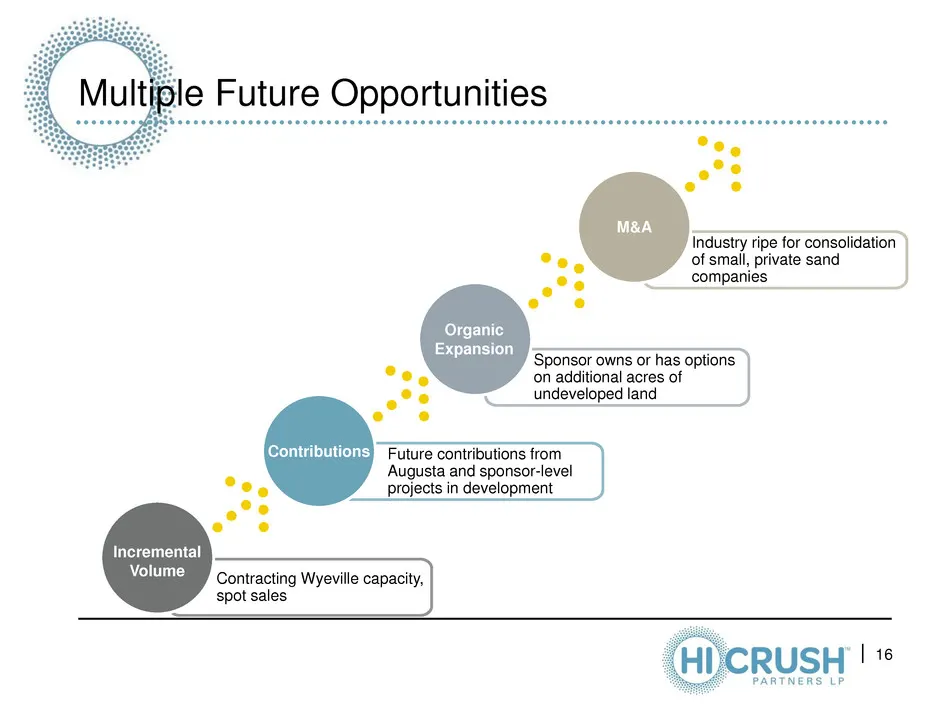
Multiple Future Opportunities 16 Contracting Wyeville capacity, spot sales Future contributions from Augusta and sponsor-level projects in development Sponsor owns or has options on additional acres of undeveloped land Industry ripe for consolidation of small, private sand companies Incremental Volu
Slide 17: Third Quarter 2013
Third Quarter 2013 (HI)cRUSH |”
Slide 18: Third Quarter Summary
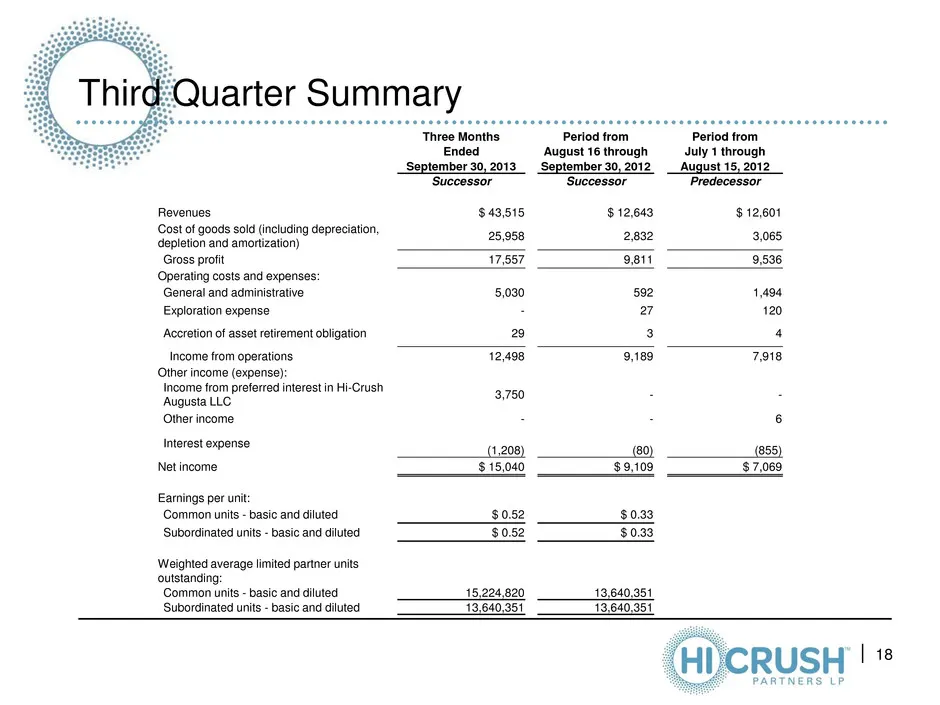
Third Quarter Summary 18 Three Months Period from Period from Ended August 16 through July 1 through September 30, 2013 September 30, 2012 August 15, 2012 Successor Successor Predecessor Revenues $ 43,515 $ 12,643 $ 12,601 Cost of goods sold (including depreciation, depletion and amortization) 25,95
Slide 19: Third Quarter Summary: EBITDA and Distributable Cash Flow Reconciliation
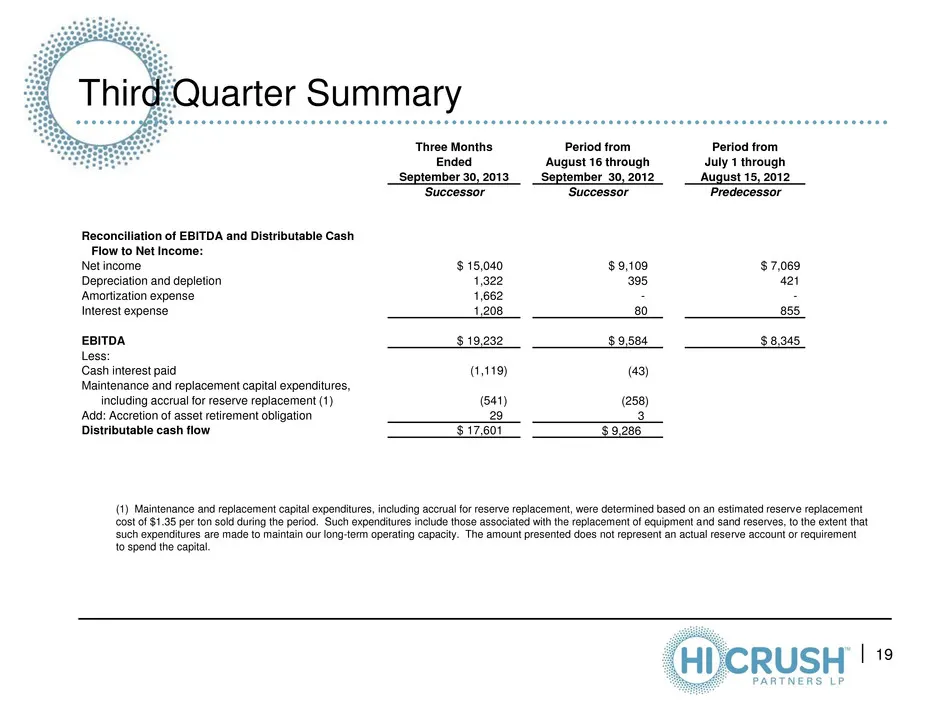
Third Quarter Summary 19 Three Months Period from Period from Ended August 16 through July 1 through September 30, 2013 September 30, 2012 August 15, 2012 Successor Successor Predecessor Reconciliation of EBITDA and Distributable Cash Flow to Net Income: Net income $ 15,040 $ 9,109 $ 7,069 Depreciat
Slide 20: Production Costs per Ton at Wyeville
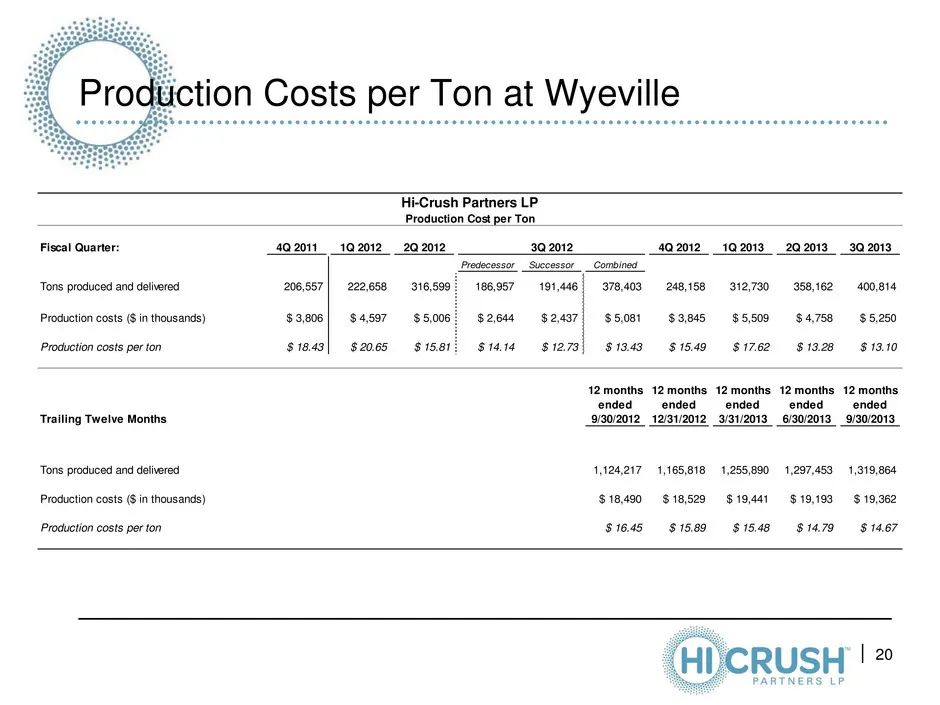
Production Costs per Ton at Wyeville 20 Hi-Crush Partners LP Production Cost per Ton Fiscal Quarter: 4Q 2011 1Q 2012 2Q 2012 3Q 2012 4Q 2012 1Q 2013 2Q 2013 3Q 2013 Predecessor Successor Combined Tons produced and delivered 206,557 222,658 316,599 186,957 191,446 378,403 248,158 312,730 358,162 400,
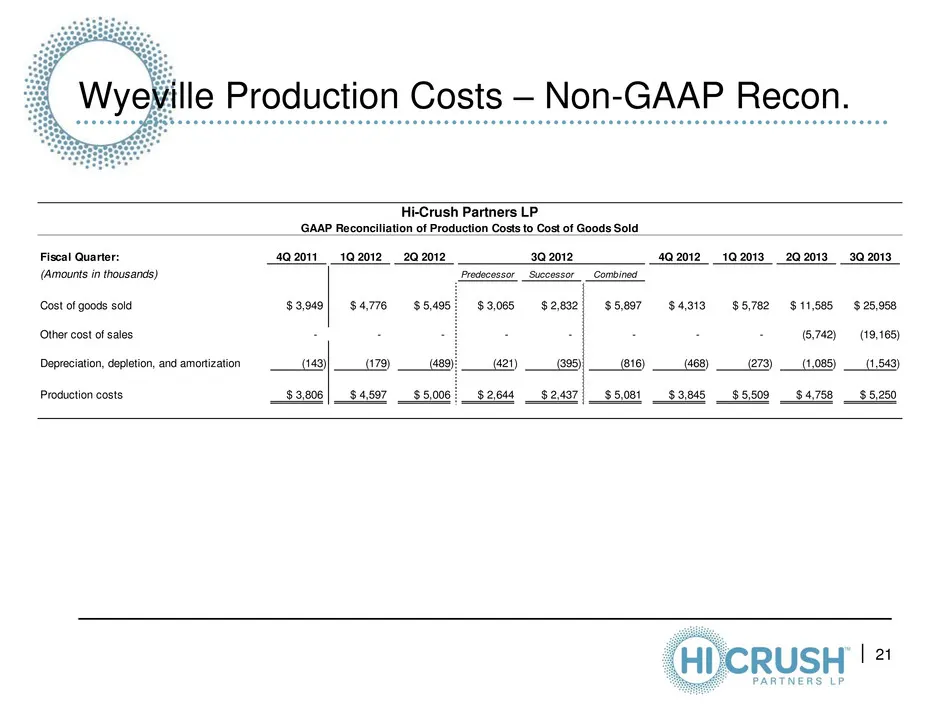
Slide 21: Wyeville Production Costs – Non-GAAP Recon.
Wyeville Production Costs – Non-GAAP Recon. 21 Hi-Crush Partners LP GAAP Reconciliation of Production Costs to Cost of Goods Sold Fiscal Quarter: 4Q 2011 1Q 2012 2Q 2012 4Q 2012 1Q 2013 2Q 2013 3Q 2013 (Amounts in thousands) Predecessor Successor Combined Cost f goods sold $ 3,949 $ 4,776 $ 5,495 $
Source: SEC EDGAR · 8-K filed Nov 6, 2013
More decks from Hi-Crush Partners LP
 Q4 2019 Earnings Presentation21 slides · Feb 19, 2020
 Q3 2019 Earnings Presentation19 slides · Nov 5, 2019
 Q2 2019 Earnings Presentation25 slides · Aug 7, 2019
 Q1 2019 Earnings Presentation21 slides · May 7, 2019
 Q4 2018 Earnings Presentation29 slides · Feb 5, 2019
 Investor Presentation (January 2019)21 slides · Jan 7, 2019