Capital Bank Financial — Q1 2013 Earnings Presentation
19 slides from Capital Bank Financial's earnings presentation, Apr 19, 2013
Slide 1: 2013 First Quarter Earnings
@® CAPITAL BANK FINANCIAL CORP 2013 First Quarter Earnings April 19, 2013
Slide 2: Safe Harbor Statement
@©@ Safe Harbor Statement Forward-Looking Statements Information in this presentation contains forward-looking statements. Any statements about our expectations, beliefs, plans, predictions, forecasts, objectives, assumptions or future events or performance are not historical facts and may be forwar
Slide 3: First Quarter Highlights
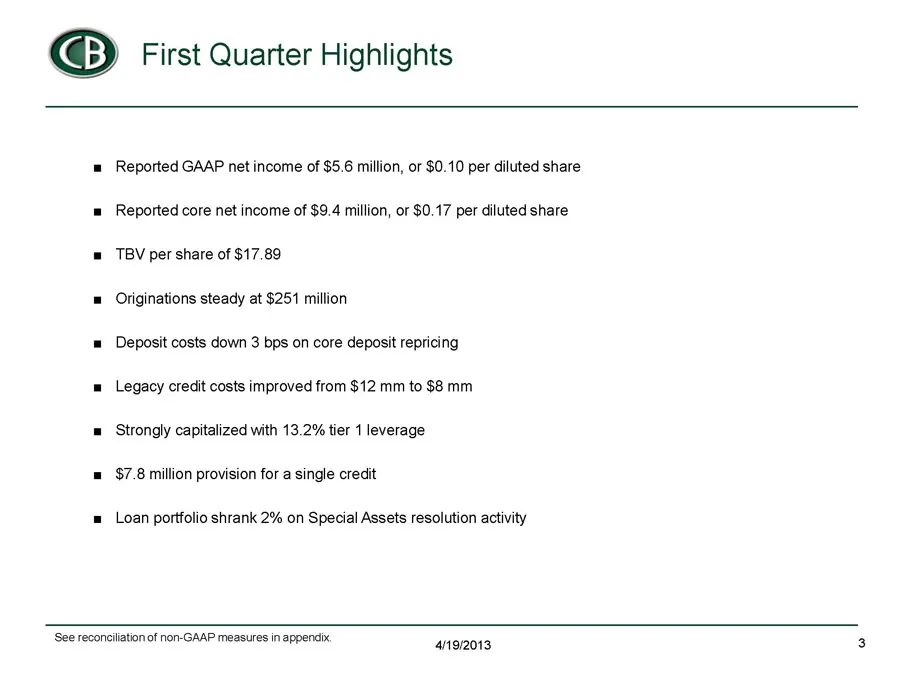
@©) First Quarter Highlights Reported GAAP net income of $5.6 million, or $0.10 per diluted share = Reported core net income of $9.4 million, or $0.17 per diluted share = TBV per share of $17.89 Originations steady at $251 million = Deposit costs down 3 bps on core deposit repricing = Legacy credit
Slide 4: First Quarter Core Earnings Summary
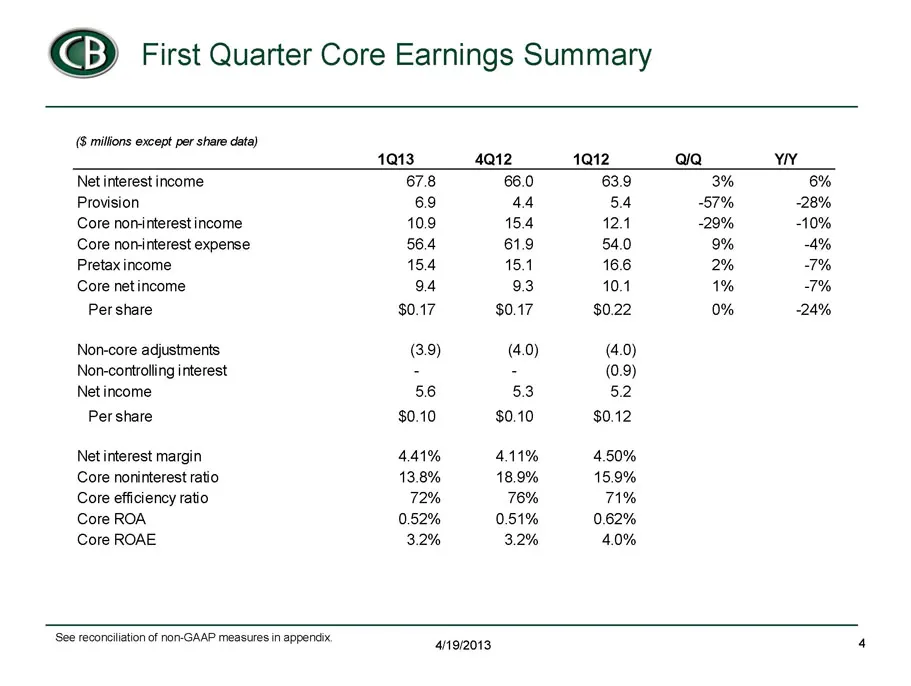
© First Quarter Core Earnings Summary (8 millions except per share data) 4013 4a12 1012 aa YN Net interest income 678 66.0 63.9 3% 6% Provision 69 44 54 57% 28% Cote noninterest income 109 15.4 12.4 29% “10% Cote noninterest expense 56.4 619 54.0 9% 4% Pretax income 15.4 15.1 16.6 2% 7% Core net inc
Slide 5: New Loan Production Steady with Record 4Q
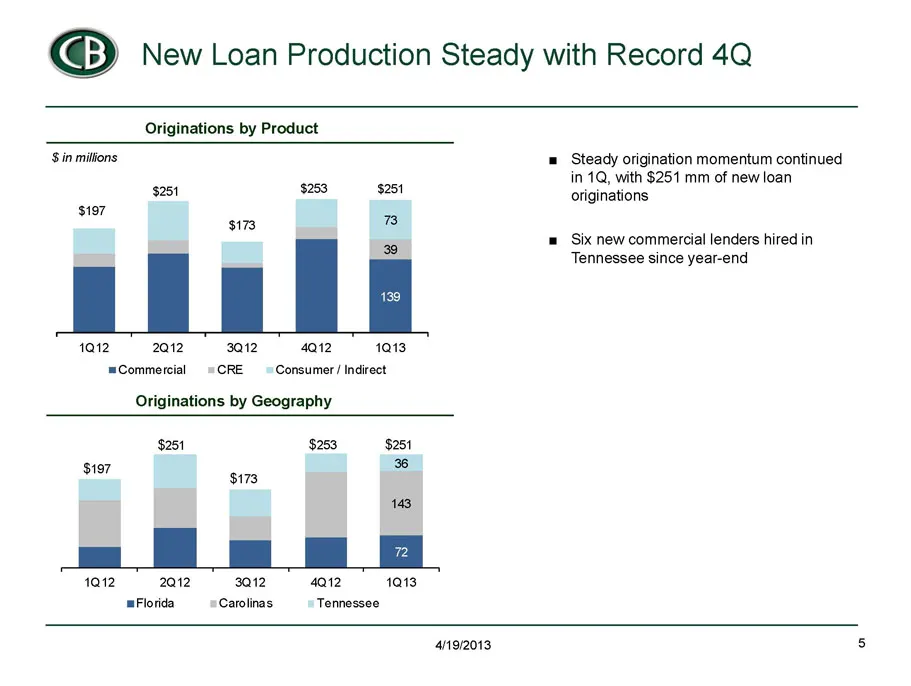
@© New Loan Production Steady with Record 4Q Originations by Product $in millions $251 $253 $251 $197 $173 © 39 faz ata 3at2 at 1013 = Commercial =CRE = Consumer/ Indirect Originations by Geography $251 $253. ‘$251 36 $197 $173 143 1012 2Q12 3Q12 4012 1013 Florida Carolinas Tennessee = Steady origin
Slide 6: Portfolio Growth Impacted by Resolution Activity
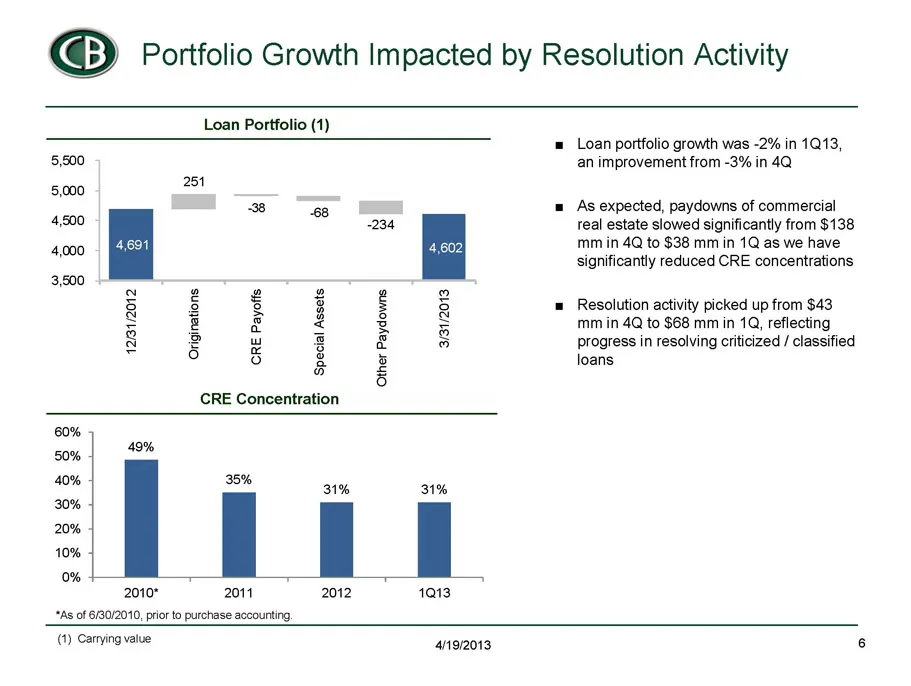
@© Portfolio Growth Impacted by Resolution Activity Loan Portfolio (1) = Loan portfolio growth was -2% in 1013, 5,500 an improvement from -3% in 4Q 5,000 251 = mAs expected, paydowns of commercial 4,500 234 real estate slowed significantly from $138 coo |, ed Agi mm in 4Q to $38 mmin 1Q as we have i
Slide 7: Core Repricing Drives Down Deposit Costs
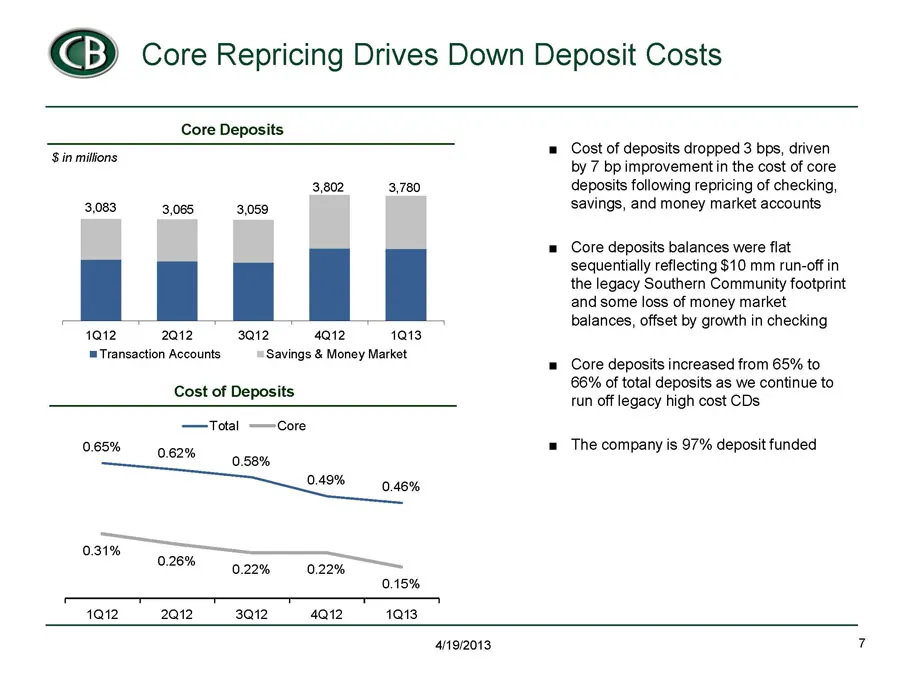
@© Core Repricing Drives Down Deposit Costs Core Deposits $in millions 3,802 3,780 3,083 3,065 3,059 1012 2012 3Q12 4Q12 1013 = Transaction Accounts ‘Savings & Money Market Cost of Deposits —Total —Core 0.65% 0.62% 5905 031% 0.26% : 0.22% 0.22% 0.15% 1012 2012 312 4a12 1013 Cost of deposits dropped
Slide 8: NIM Improves on Legacy Loan Accretion
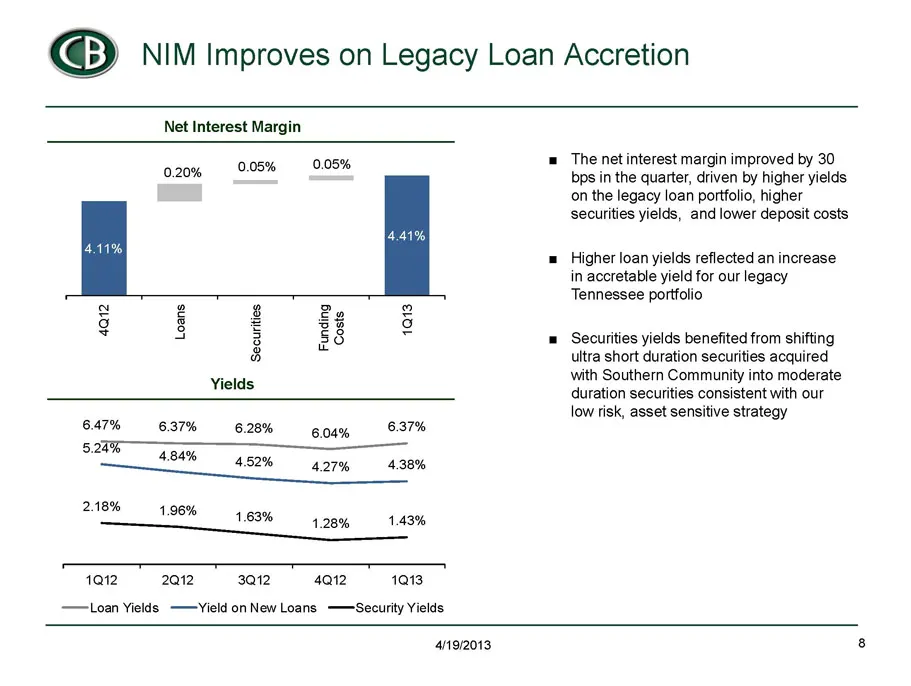
@© NIM Improves on Legacy Loan Accretion Net Interest Margin c1os% 0.08% = The net interest margin improved by 30 bps in the quarter, driven by higher yields on the legacy loan portfolio, higher securities yields, and lower deposit costs 0.20% = Higher loan yields reflected an increase in accretable
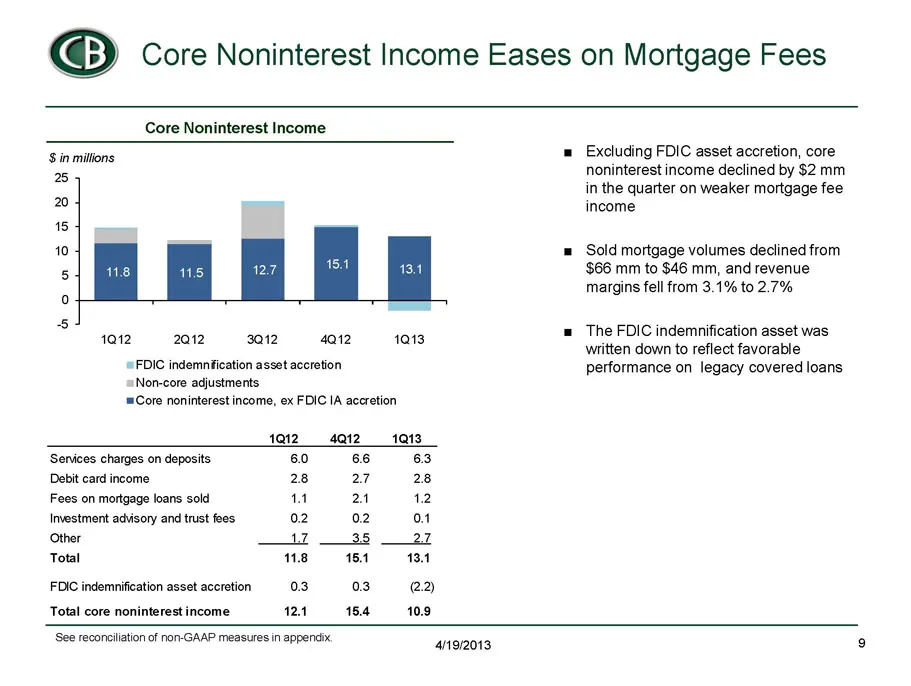
Slide 9: Core Noninterest Income Eases on Mortgage Fees
@© Core Noninterest Income Eases on Mortgage Fees Core Noninterest Income $ in milions 8 20 — 18 10 5 ° yar 2a 302421013. ‘= FDIC indemntication asset accretion Non-core adjustments "Core noninterest income, ex FDIC 1A accretion 1@12__agt2 1013 ‘Senices charges on deposits 60 66 63 Debit card income
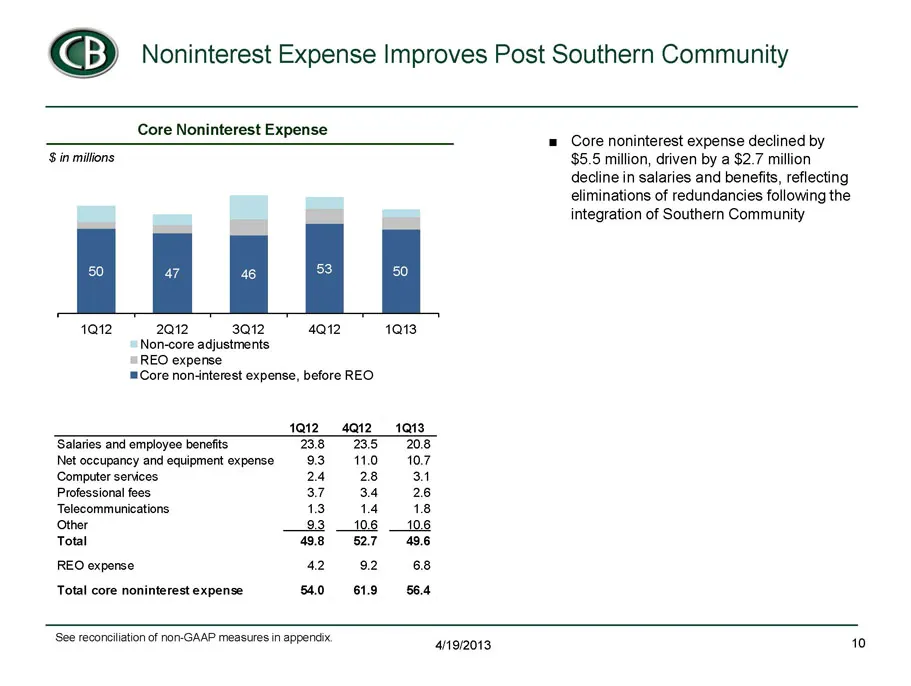
Slide 10: Noninterest Expense Improves Post Southern Community
@© Noninterest Expense Improves Post Southern Community Core Noninterest Expense $ in millions 1Q12 2Q12 3Q12 4Q12 1013 Non-core adjustments REO expense ™Core non-interest expense, before REO 1012 4Q12__ 113. ‘Salaries and employee benefits 23.8 23.5 20.8 Net occupancy and equipment expense 93 11.0
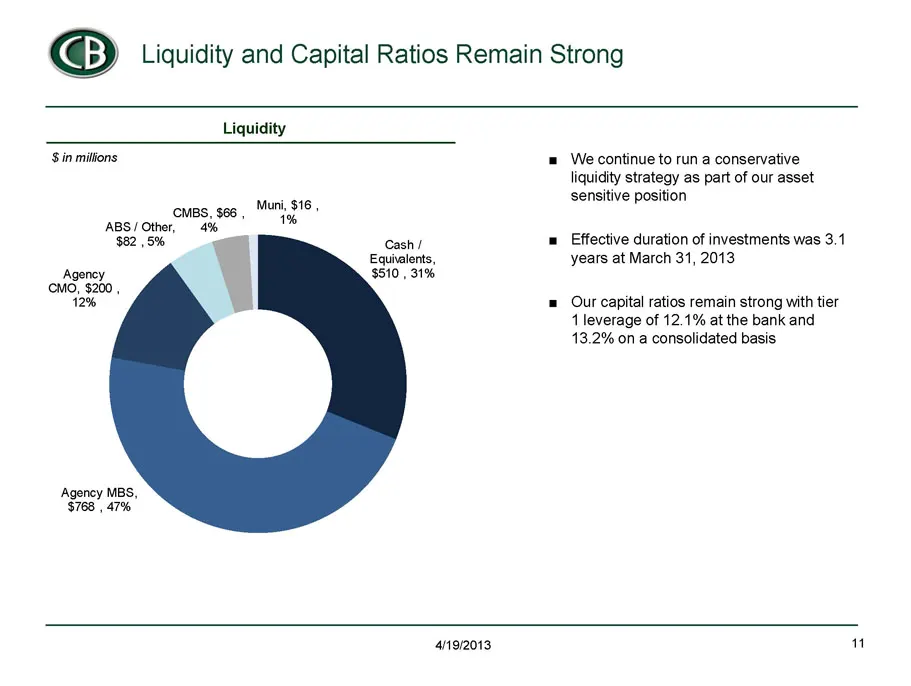
Slide 11: Liquidity and Capital Ratios Remain Strong
@© Liquidity and Capital Ratios Remain Strong Liquidity Sin millions ‘MBS, $66, ABS/ Other, — 4% Muni, $16 , 1% Cash / Equivalents, Agency $510, 31% CMO, $200 , 12% ‘Agency MBS, $768 , 47% = We continue to run a conservative liquidity strategy as part of our asset sensitive position = Effective dura
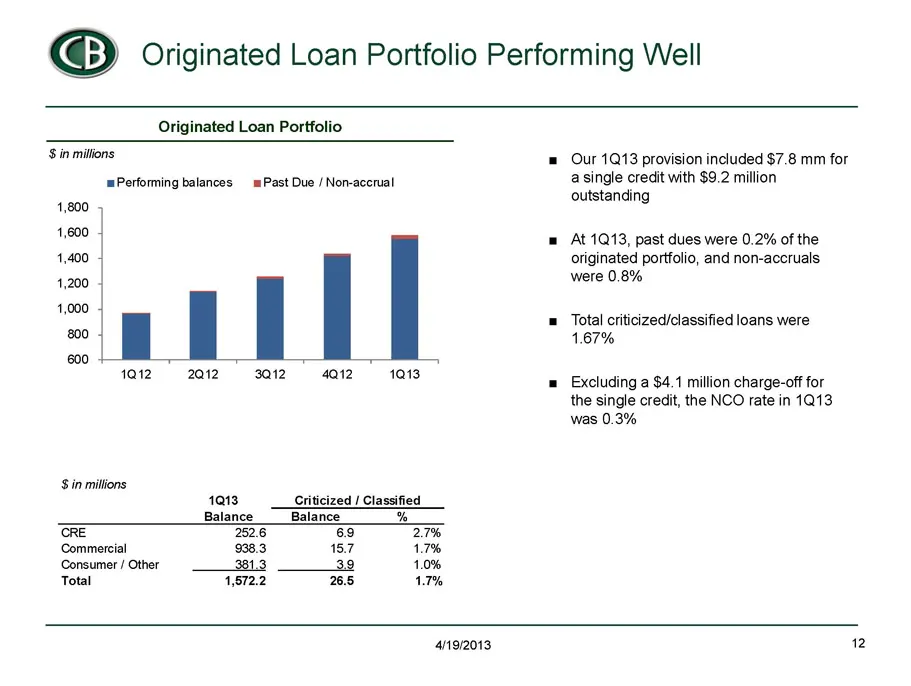
Slide 12: Originated Loan Portfolio Performing Well
@© Originated Loan Portfolio Performing Well Originated Loan Portfolio $ in millions Performing balances Past Due / Non-accrual 1,800 1,600 | 1,400 1,200 1,000 800 600 10122012, 3Qt2_--4Qt2-— 1013, $ in millions 1013 Criticized / Classified Balance _~ Balance % CRE 2526 69 27% ‘Commercial 938.3 187
Slide 13: Legacy Credit Expenses Improve
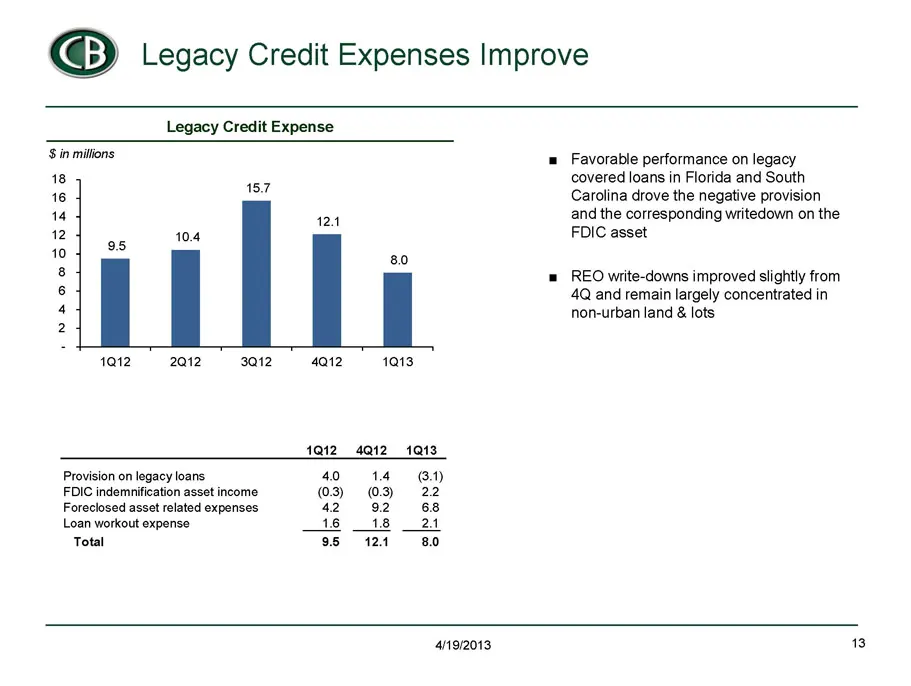
@© Legacy Credit Expenses Improve Legacy Credit Expense $ in millions 1012212 sai2 4ai2 1013 1Q12__4a12 1013 Provision on legacy loans 40 14 G4) FDIC indemnification asset income 03) @3) 22 Foreclosed asset related expenses 42 92 68 Loan workout expense 16 _418 __24 Total 95 121 80 Favorable perform
Slide 14: Strong Resolution Activity in First Quarter
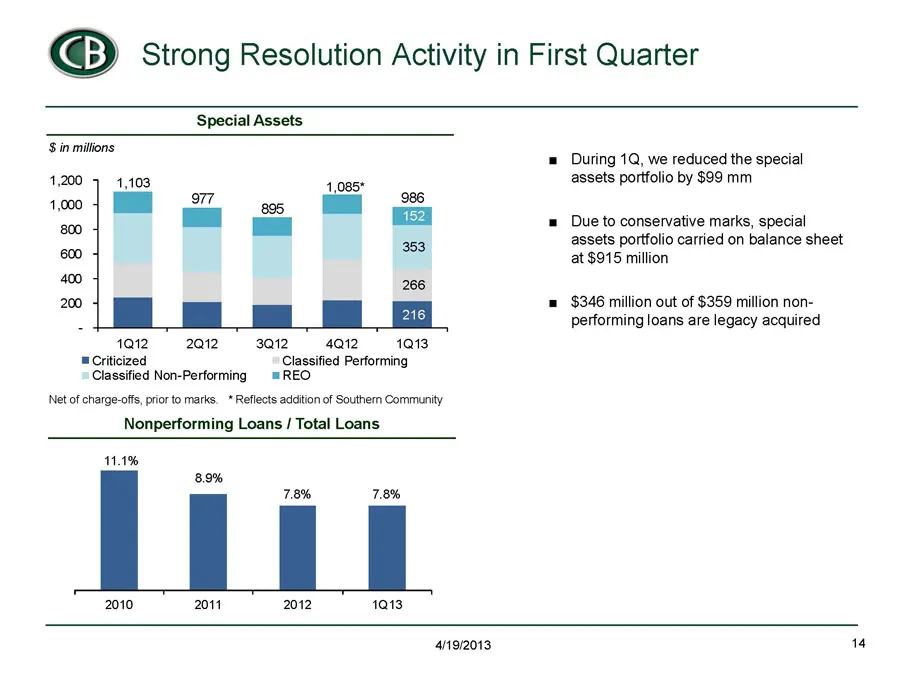
@© Strong Resolution Activity in First Quarter Special Assets 1012 -2Q12 3Q12_— 4Q2-— 1013 "Criticized Classified Performing Classified Non-Performing = REO Net of charge-offs, prior to marks, * Reflects addition of Southern Community Nonperforming Loans / Total Loans 11.1% 78% 7.8% 2010 2011 2012 1
Slide 15: Capital Bank Goals
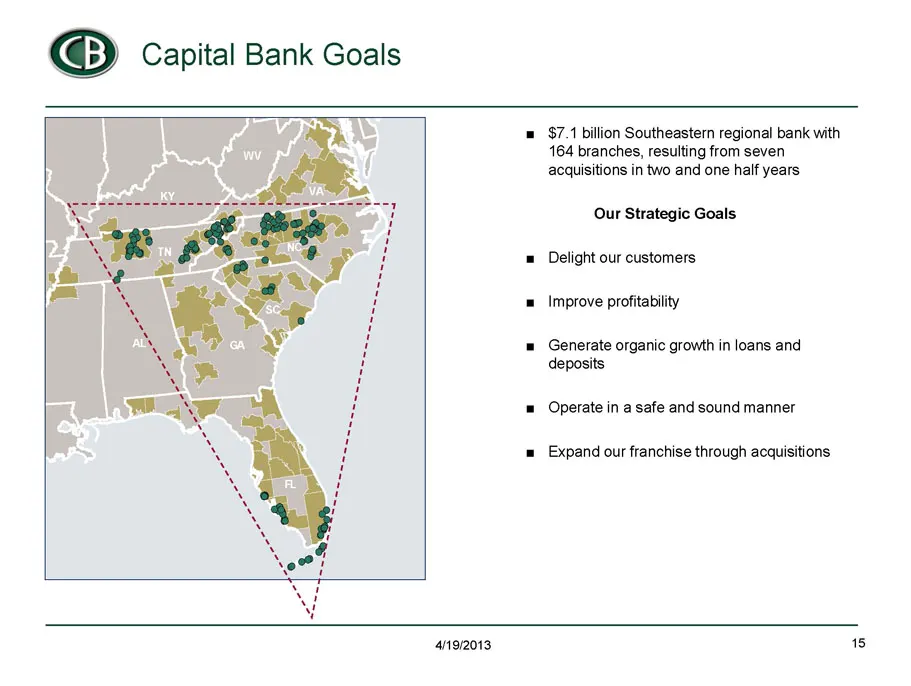
@© Capital Bank Goals = $7.1 billion Southeastern regional bank with 164 branches, resulting from seven acquisitions in two and one half years, Our Strategic Goals = Delight our customers = Improve profitability = Generate organic growth in loans and deposits = Operate in a safe and sound manner = E
Slide 16: Reconciliation of Core Net Income
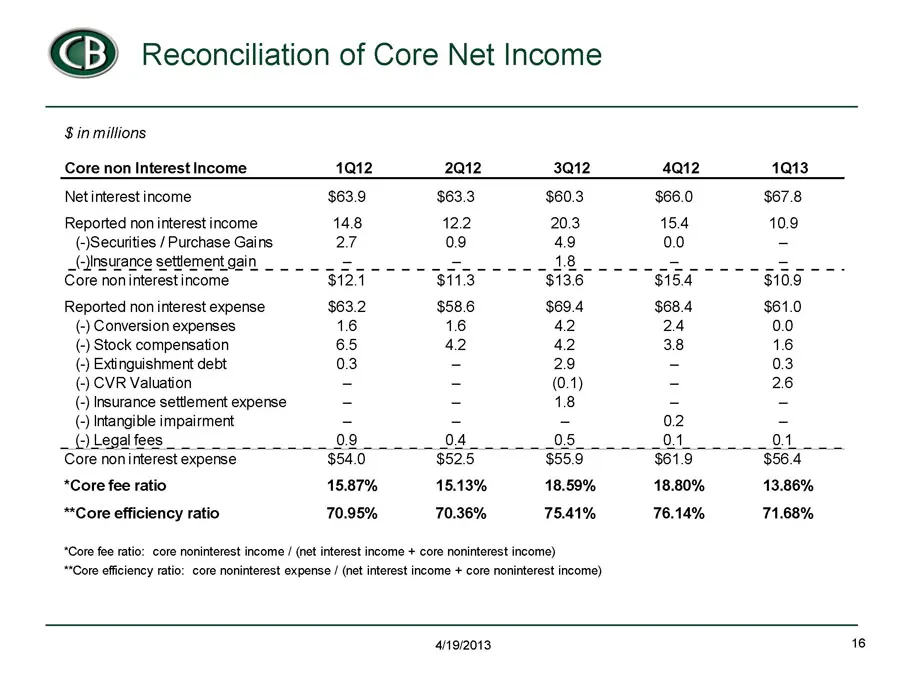
@©@ Reconciliation of Core Net Income $ in millions Core non Interest Income 1012 2012 3Q12 4012 1013 Netinterest income $63.9 $63.3 $60.3 $66.0 $67.8 Reported non interest income 148 12.2 20.3 15.4 10.9 (-)Securities / Purchase Gains 2r 09 49 0.0 - Core non interest income Reported non interest exp
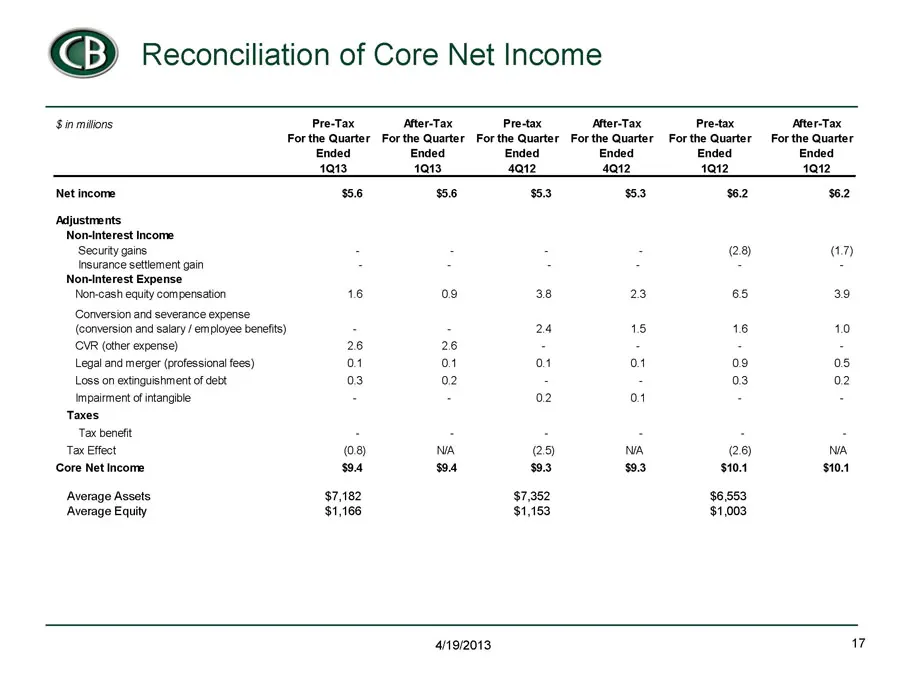
Slide 17: Reconciliation of Core Net Income
© Reconciliation of Core Net Income $inmillons Pre-Tax After-Tax. Pre-tax After-Tax. Pretax Ater-Tax Forthe Quarter For the Quarter Forthe Quarter For the Quarter For the Quarter For the Quarter Ended Ended Ended Ended Ended Ended 4013 1013 4a12 4a12 1012 1012 Net income $56 56 $53 $53 $62 $6.2 Adju
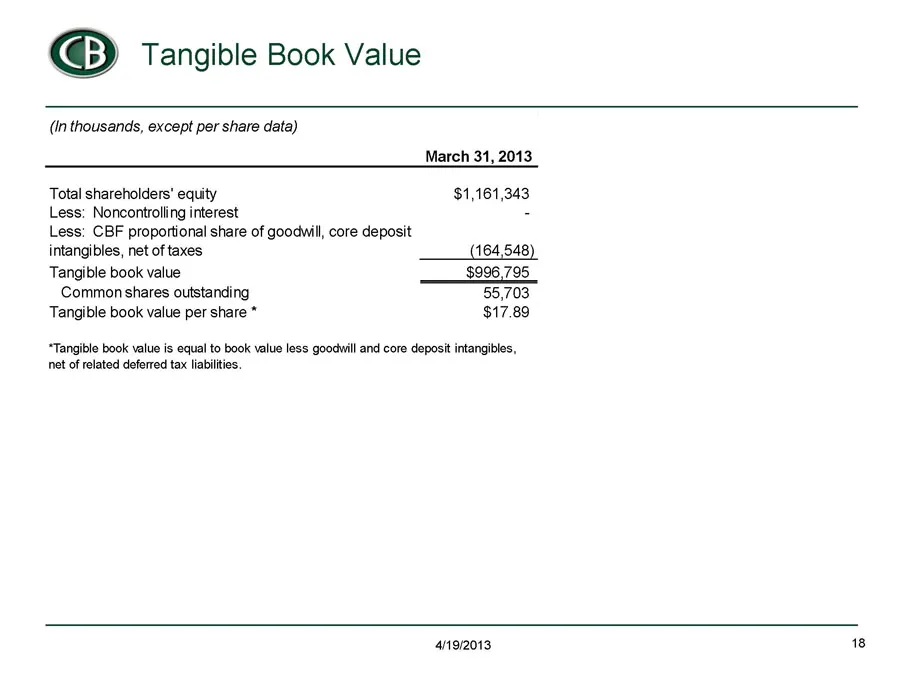
Slide 18: Tangible Book Value
© Tangible Book Value (in thousands, except per share data) March 31, 2013 Total shareholders’ equity $1,161,343 Less: Noncontrolling interest Less: CBF proportional share of goodwill, core deposit intangibles, net of taxes 164,548) Tangible book value $996,795 Common shares outstanding 55,703 Tangi
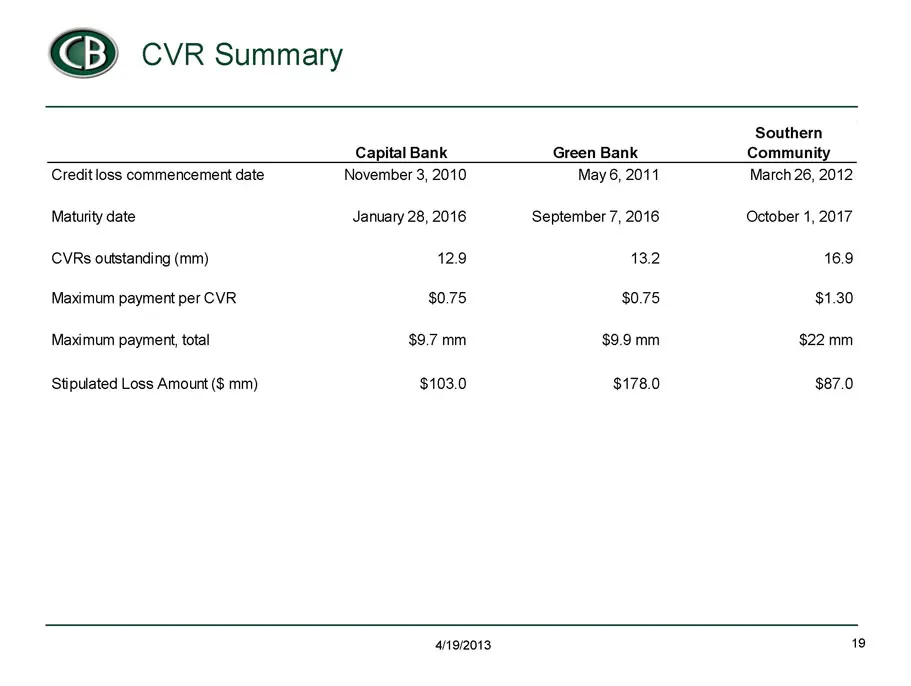
Slide 19: CVR Summary
@©@ CVR Summary Southern Capital Bank Green Bank Community Credit loss commencement date November 3, 2010 May 6, 2011 March 26, 2012 Maturity date CVRs outstanding (mm) Maximum payment per CVR Maximum payment, total Stipulated Loss Amount ($ mm) January 28, 2016 129 $0.75 $9.7 mm $103.0 September 7,
Source: SEC EDGAR · 8-K filed Apr 19, 2013
More decks from Capital Bank Financial Corp
 Q2 2017 Earnings Presentation22 slides · Jul 14, 2017
 Morgan Stanley Financial Services Conference 201715 slides · Jun 13, 2017
 Merger or Acquisition (June 2017)27 slides · Jun 6, 2017
 Merger or Acquisition (May 2017)17 slides · May 4, 2017
 Q1 2017 Earnings Presentation21 slides · Apr 21, 2017
 Q4 2016 Earnings Presentation25 slides · Jan 26, 2017