HCC Insurance — Q2 2014 Earnings Presentation
32 slides from HCC Insurance's earnings presentation, Aug 5, 2014
Slide 1: Second Quarter 2014 Investor Presentation
Second Quarter 2014 Investor Presentation August 5, 2014
Slide 2: Notice About This Presentation
See Notice About This Presentation Notice About This Presentation ABOUT FORWARD-LOOKING STATEMENTS: This presentation contains certain “forward-looking statements” within the meaning of Section 27A of the Securities Act of 1933 and Section 21E of the Securities Exchange Act of 1934, which are intend
Slide 3: A Proven Track Record
See Notice About This Presentation A Proven Track Record 3 40 years of sustained, profitable growth

Slide 4: HCC Overview
See Notice About This Presentation 4 HCC Overview
Slide 5: What Is HCC? Specialty Insurance Underwriter
See Notice About This Presentation What Is HCC? Specialty Insurance Underwriter 5
Slide 6: Over 100 Specialty Lines
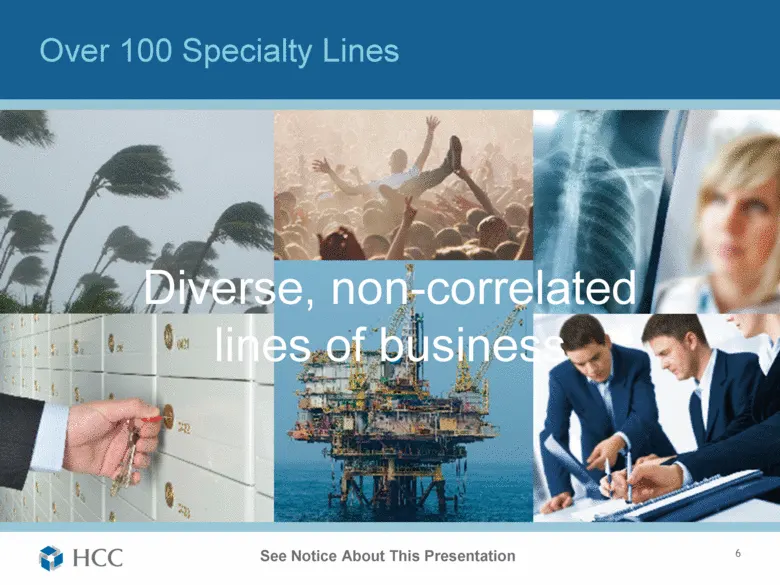
Over 100 Specialty Lines Diverse, non-correlated lines of business See Notice About This Presentation 6
Slide 7: Performance Through Cycles
See Notice About This Presentation Performance Through Cycles Consistent, top-tier financial results and value creation regardless of market cycles 7
Slide 8: Strong Balance Sheet
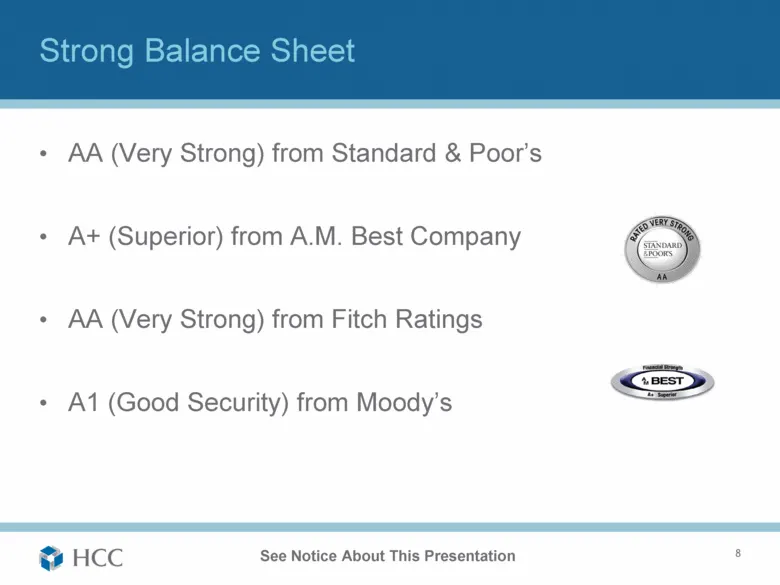
See Notice About This Presentation Strong Balance Sheet AA (Very Strong) from Standard & Poor’s A+ (Superior) from A.M. Best Company AA (Very Strong) from Fitch Ratings A1 (Good Security) from Moody’s 8
Slide 9: Consistent, Profitable Growth
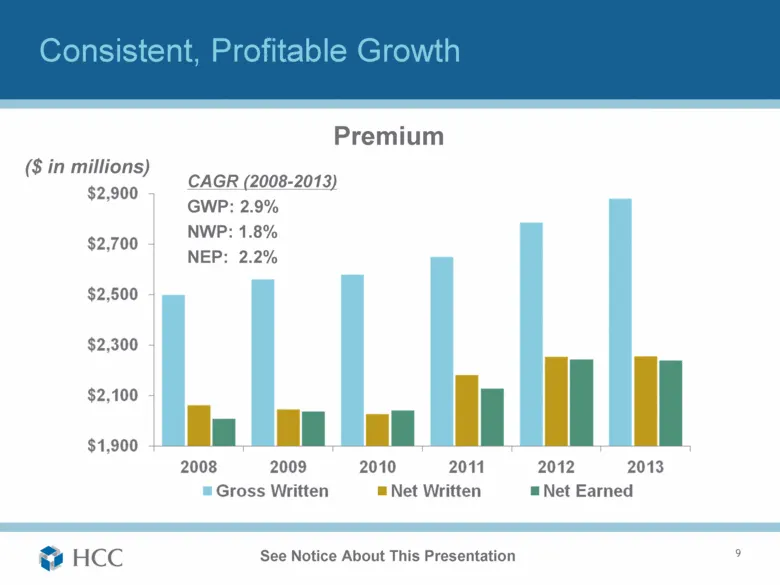
Consistent, Profitable Growth 9 Premium See Notice About This Presentation ($ in millions) CAGR (2008-2013) GWP: 2.9% NWP: 1.8% NEP: 2.2%
Slide 10: Underwriting Focus
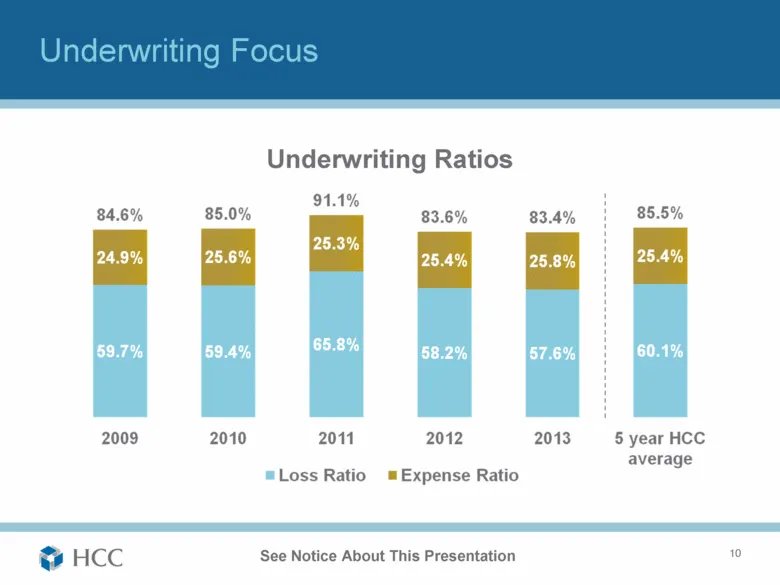
Underwriting Focus 10 Underwriting Ratios See Notice About This Presentation
Slide 11: Effective Catastrophe Management
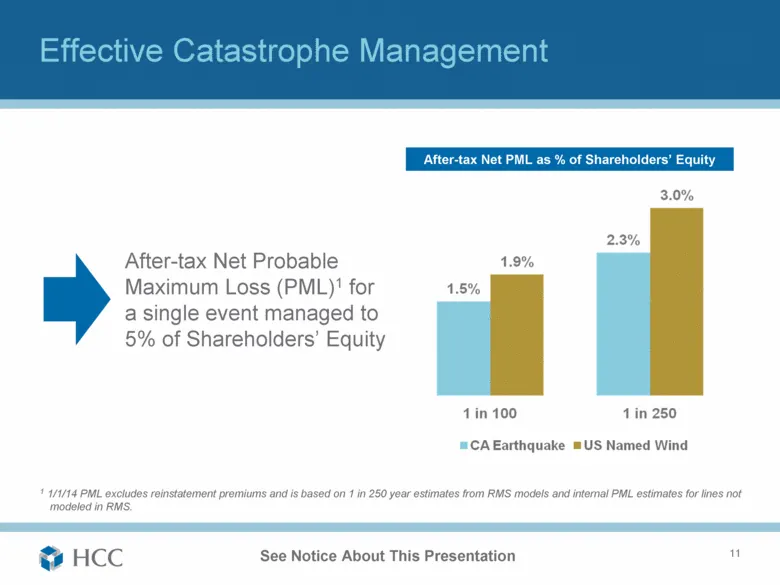
See Notice About This Presentation Effective Catastrophe Management 11 1 1/1/14 PML excludes reinstatement premiums and is based on 1 in 250 year estimates from RMS models and internal PML estimates for lines not modeled in RMS. After-tax Net Probable Maximum Loss (PML)1 for a single event managed t
Slide 12: Earnings Per Share
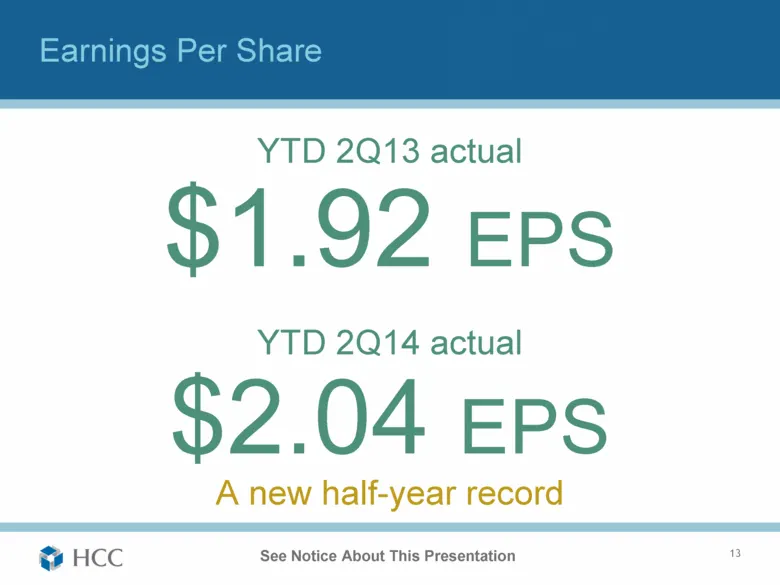
See Notice About This Presentation Earnings Per Share 13 YTD 2Q13 actual $1.92 EPS YTD 2Q14 actual $2.04 EPS A new half-year record
Slide 13: Book Value Growth
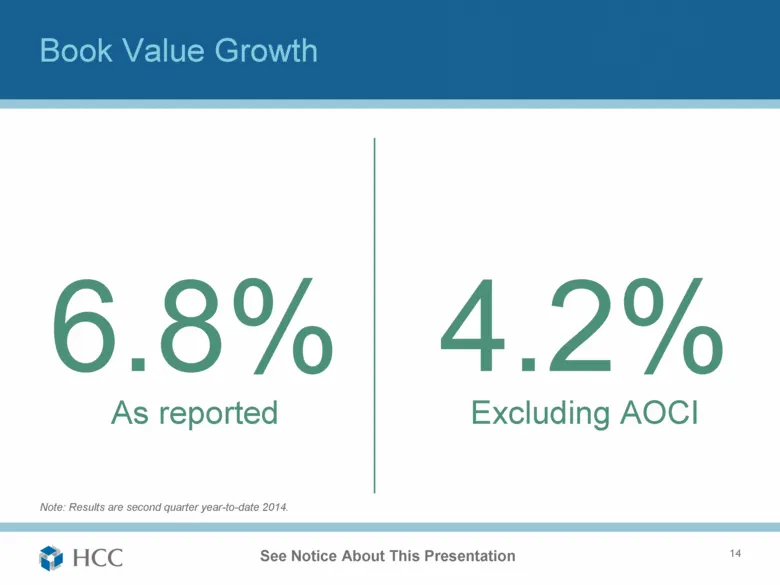
See Notice About This Presentation Book Value Growth 14 Note: Results are second quarter year-to-date 2014. 6.8% As reported 4.2% Excluding AOCI
Slide 14: Combined Ratio
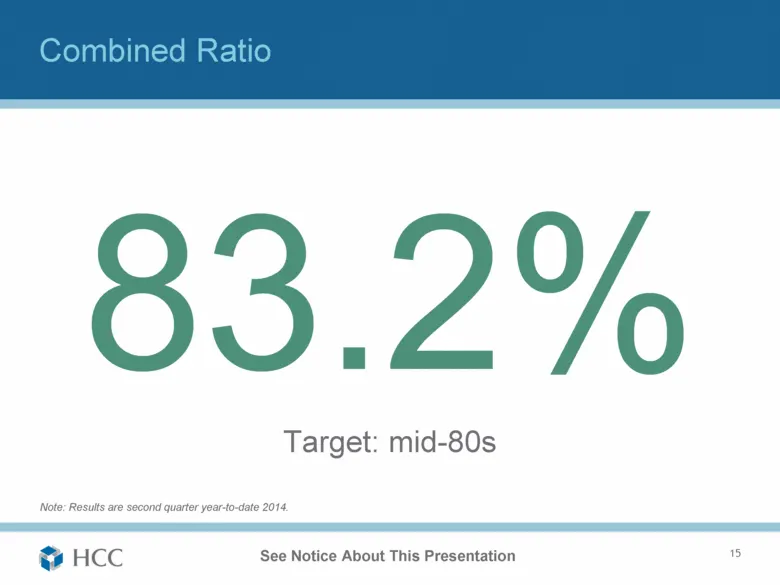
See Notice About This Presentation Combined Ratio 15 83.2% Target: mid-80s Note: Results are second quarter year-to-date 2014.
Slide 15: Expense Ratio
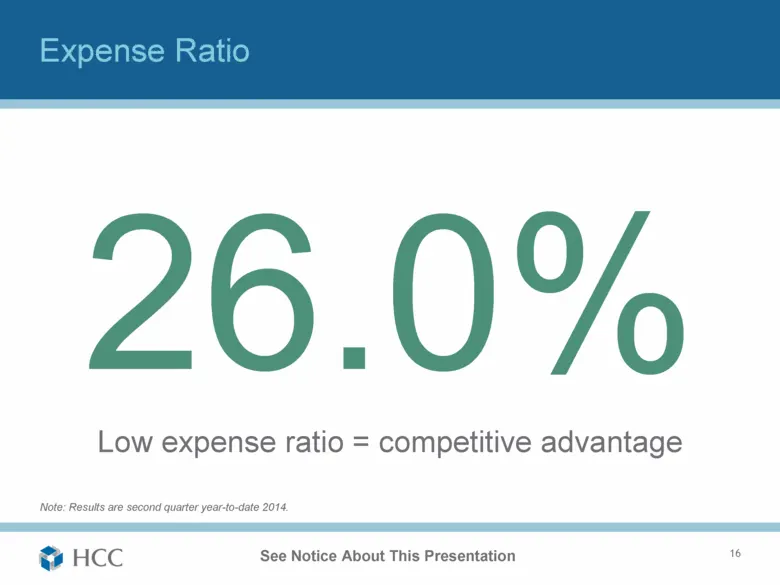
See Notice About This Presentation Expense Ratio Low expense ratio = competitive advantage 16 26.0% Note: Results are second quarter year-to-date 2014.
Slide 16: Operating Return on Equity
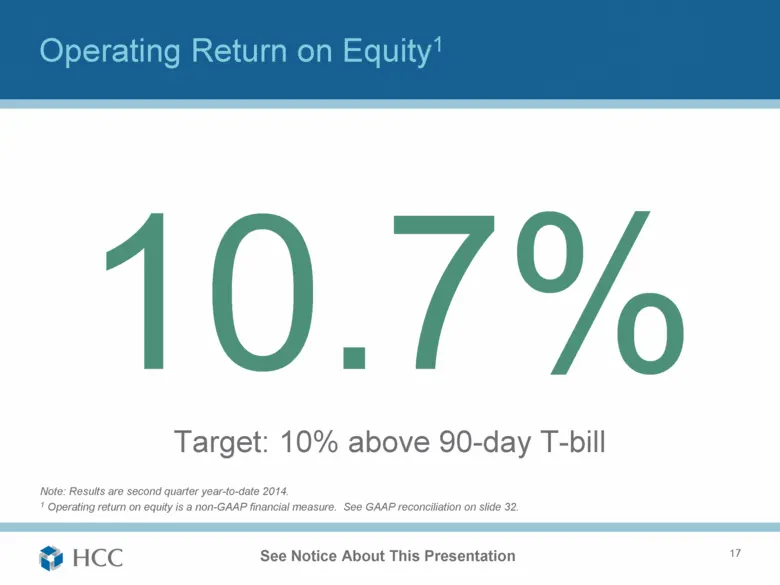
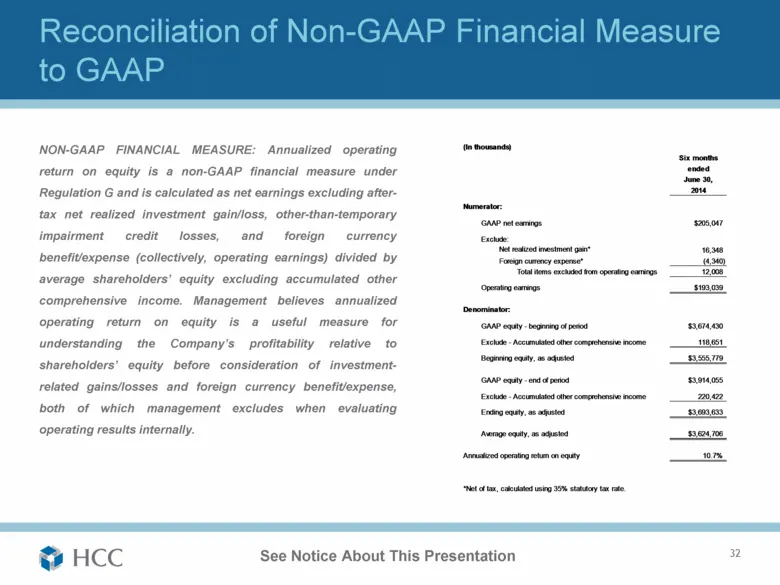
Note: Results are second quarter year-to-date 2014. 1 Operating return on equity is a non-GAAP financial measure. See GAAP reconciliation on slide 32. See Notice About This Presentation Operating Return on Equity1 17 10.7% Target: 10% above 90-day T-bill
Slide 17: Segment Results
See Notice About This Presentation 18 Segment Results
Slide 18: Underwriting Segment Overview
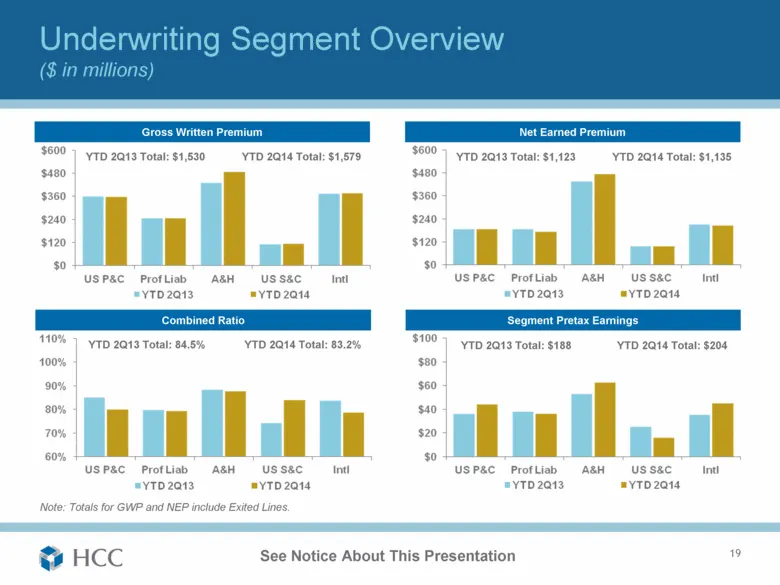
Underwriting Segment Overview ($ in millions) 19 See Notice About This Presentation Gross Written Premium Net Earned Premium Combined Ratio YTD 2Q13 Total: $1,530 YTD 2Q14 Total: $1,579 YTD 2Q13 Total: $1,123 YTD 2Q14 Total: $1,135 YTD 2Q13 Total: 84.5% YTD 2Q14 Total: 83.2% Segment Pretax Earnings
Slide 19: U.S. Property & Casualty
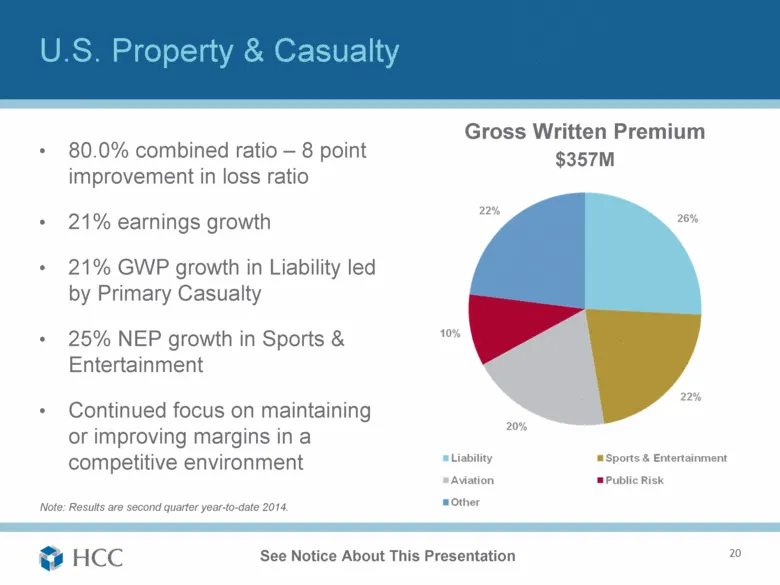
See Notice About This Presentation U.S. Property & Casualty 20 Note: Results are second quarter year-to-date 2014. 80.0% combined ratio – 8 point improvement in loss ratio 21% earnings growth 21% GWP growth in Liability led by Primary Casualty 25% NEP growth in Sports & Entertainment Continued focus
Slide 20: Professional Liability
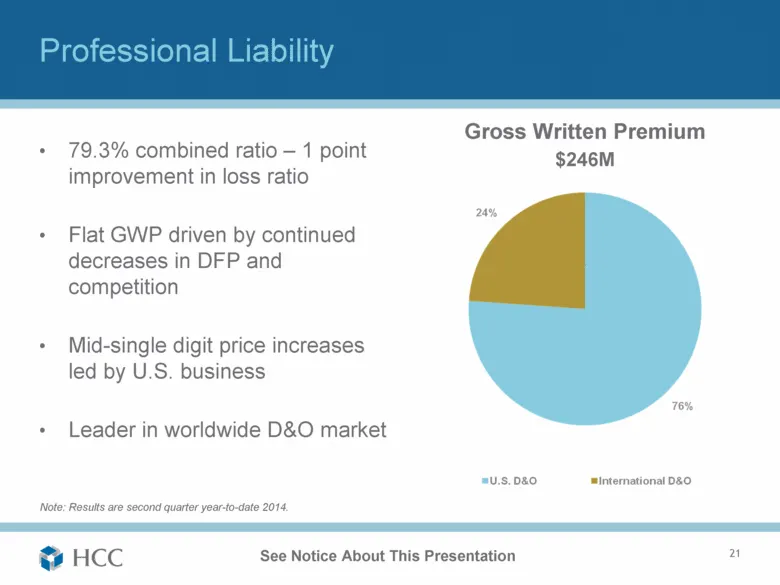
See Notice About This Presentation Professional Liability 21 79.3% combined ratio – 1 point improvement in loss ratio Flat GWP driven by continued decreases in DFP and competition Mid-single digit price increases led by U.S. business Leader in worldwide D&O market Gross Written Premium $246M Note: R
Slide 21: Accident & Health
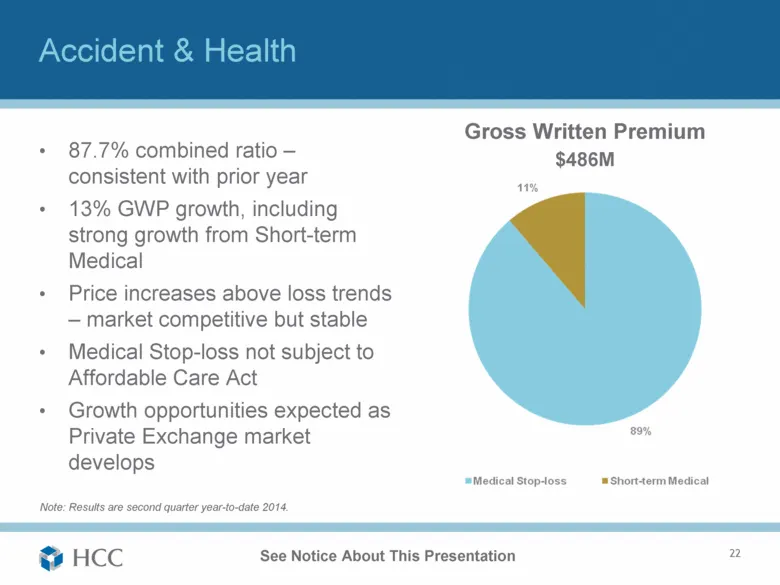
See Notice About This Presentation Accident & Health 22 87.7% combined ratio – consistent with prior year 13% GWP growth, including strong growth from Short-term Medical Price increases above loss trends – market competitive but stable Medical Stop-loss not subject to Affordable Care Act Growth oppo
Slide 22: U.S. Surety & Credit
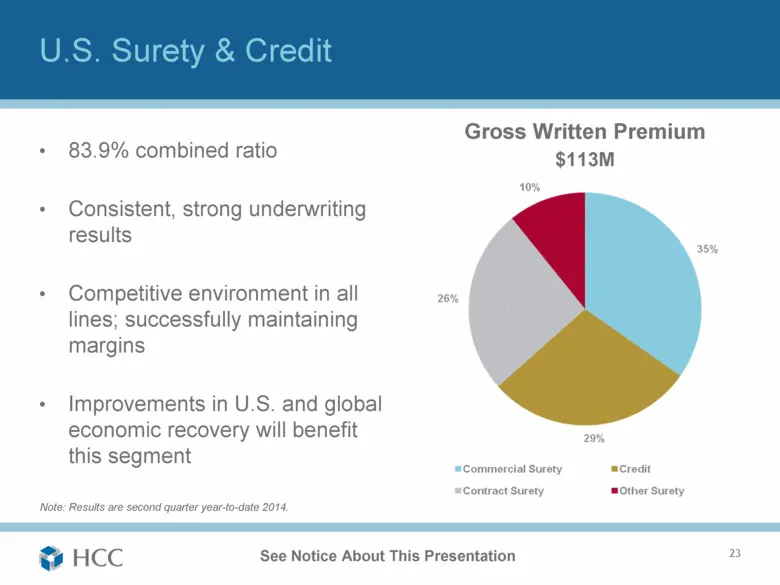
See Notice About This Presentation U.S. Surety & Credit 23 83.9% combined ratio Consistent, strong underwriting results Competitive environment in all lines; successfully maintaining margins Improvements in U.S. and global economic recovery will benefit this segment Gross Written Premium $113M Note:
Slide 23: International
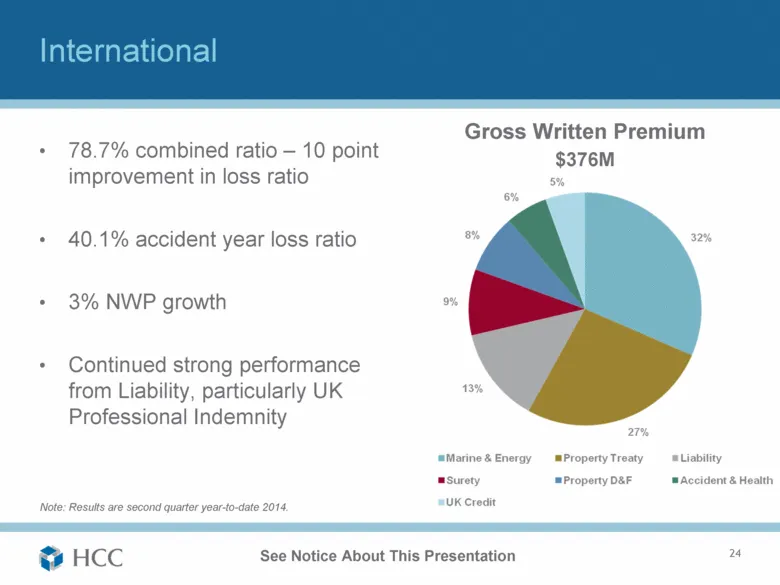
See Notice About This Presentation International 24 78.7% combined ratio – 10 point improvement in loss ratio 40.1% accident year loss ratio 3% NWP growth Continued strong performance from Liability, particularly UK Professional Indemnity Gross Written Premium $376M Note: Results are second quarter
Slide 24: Investments
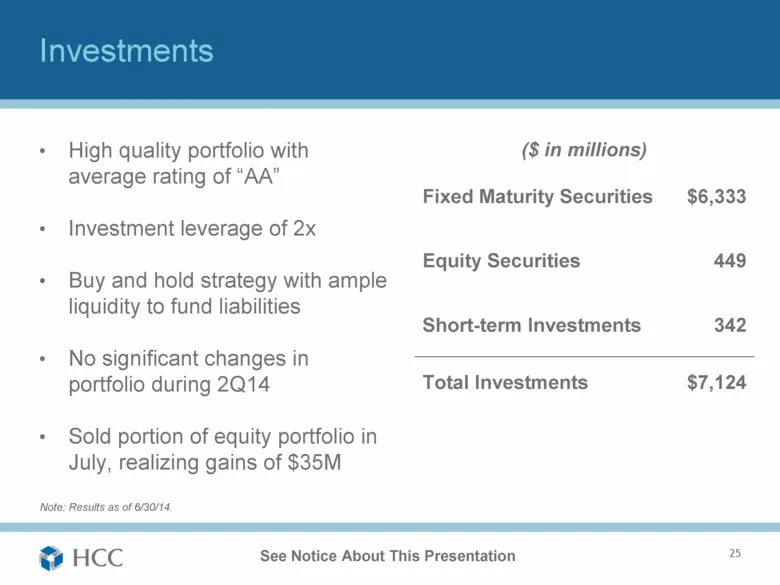
See Notice About This Presentation Investments 25 High quality portfolio with average rating of “AA” Investment leverage of 2x Buy and hold strategy with ample liquidity to fund liabilities No significant changes in portfolio during 2Q14 Sold portion of equity portfolio in July, realizing gains of $
Slide 25: Investment Portfolio
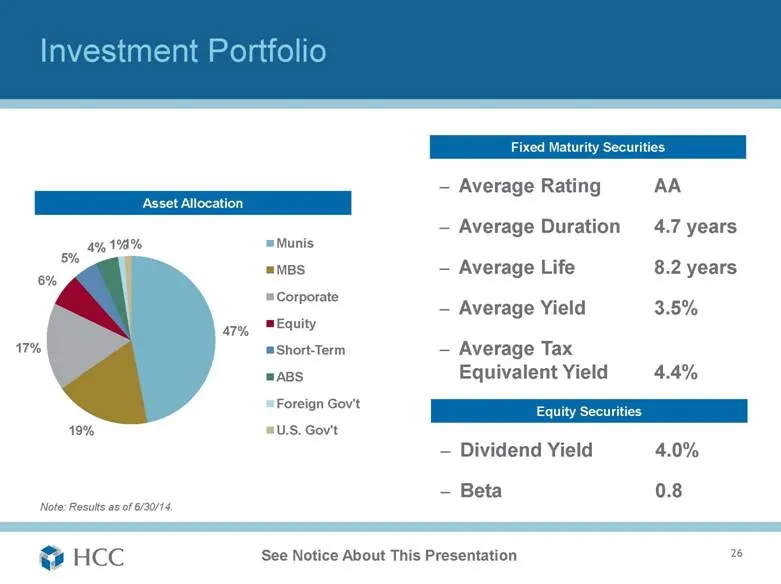
See Notice About This Presentation Investment Portfolio 26 Average Rating AA Average Duration 4.7 years Average Life 8.2 years Average Yield 3.5% Average Tax Equivalent Yield 4.4% Fixed Maturity Securities Asset Allocation Dividend Yield 4.0% Beta 0.8 Equity Securities Note: Results as of 6/30/14.
Slide 26: Peer Comparison
See Notice About This Presentation 27 Peer Comparison
Slide 27: Total Value Creation
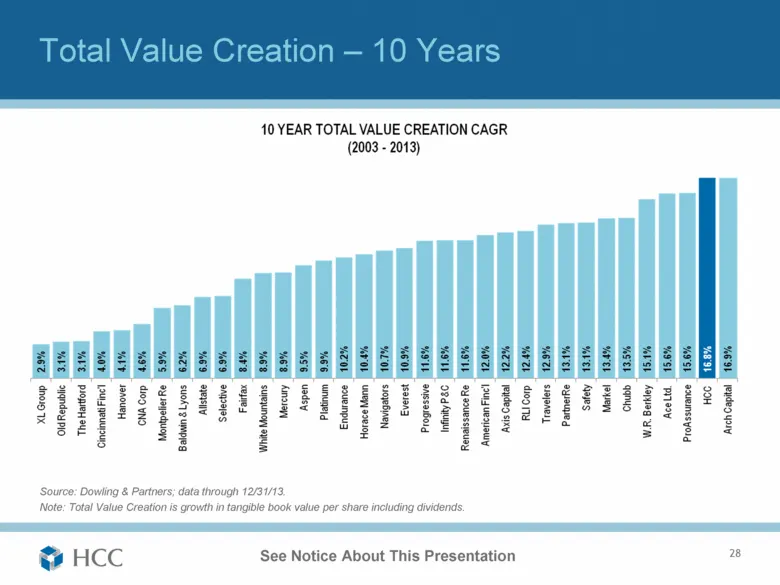
28 Total Value Creation – 10 Years Source: Dowling & Partners; data through 12/31/13. Note: Total Value Creation is growth in tangible book value per share including dividends. See Notice About This Presentation
Slide 28: Outperformance with Low Volatility
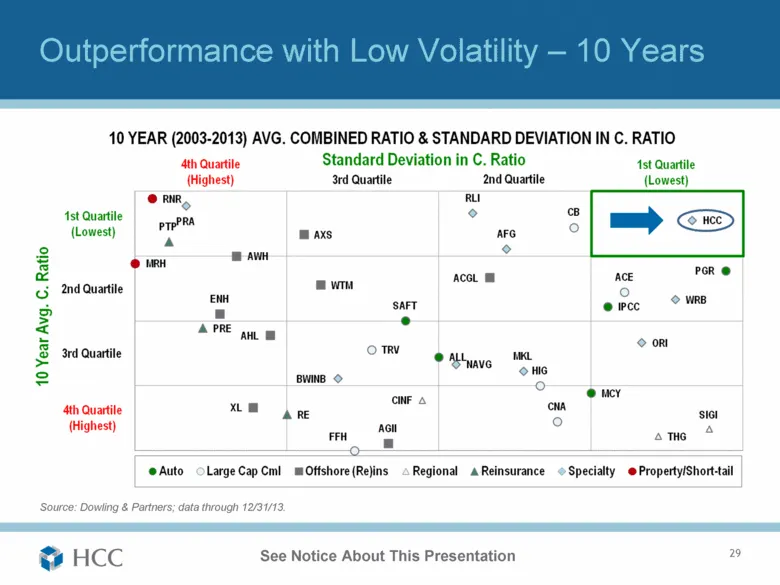
See Notice About This Presentation Outperformance with Low Volatility – 10 Years 29 Source: Dowling & Partners; data through 12/31/13.
Slide 29: Combined Ratio – HCC versus Peer Group
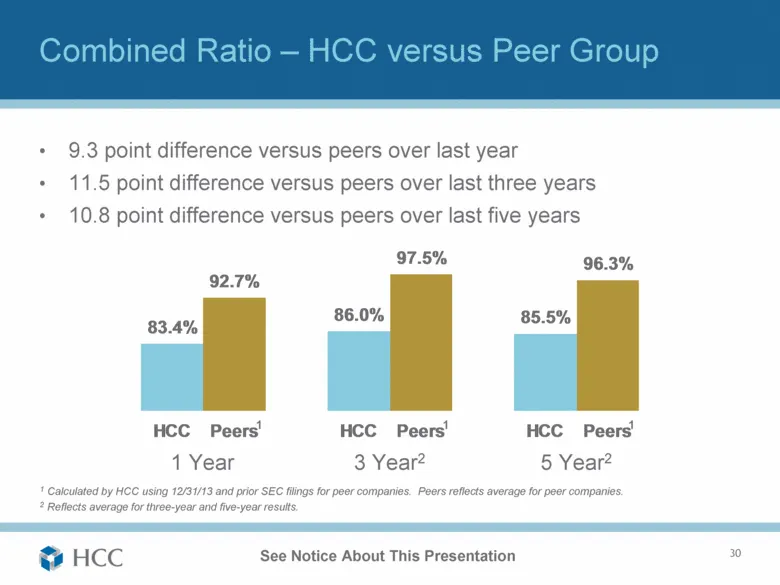
9.3 point difference versus peers over last year 11.5 point difference versus peers over last three years 10.8 point difference versus peers over last five years See Notice About This Presentation Combined Ratio – HCC versus Peer Group 30 1 Year 3 Year2 5 Year2 1 Calculated by HCC using 12/31/13 and
Slide 30: HCC's Value Proposition
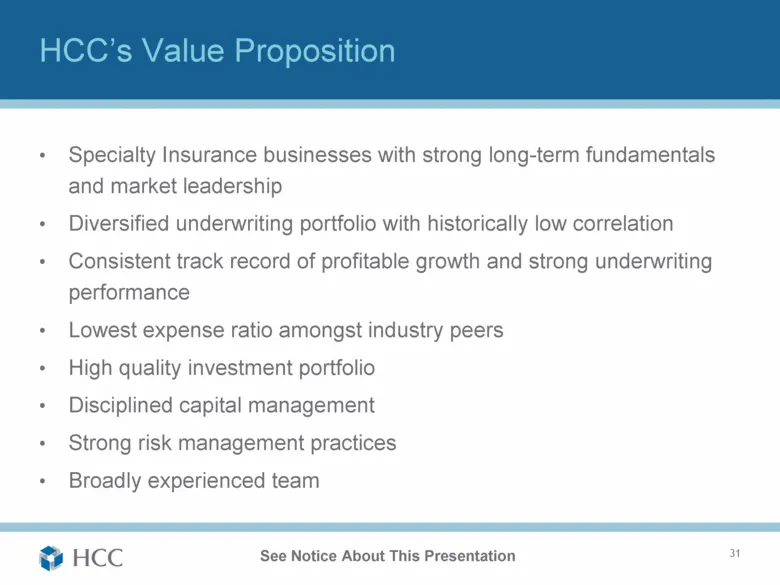
See Notice About This Presentation HCC’s Value Proposition Specialty Insurance businesses with strong long-term fundamentals and market leadership Diversified underwriting portfolio with historically low correlation Consistent track record of profitable growth and strong underwriting performance Low
Slide 31: Reconciliation of Non-GAAP Financial Measure to GAAP
See Notice About This Presentation Reconciliation of Non-GAAP Financial Measure to GAAP NON-GAAP FINANCIAL MEASURE: Annualized operating return on equity is a non-GAAP financial measure under Regulation G and is calculated as net earnings excluding after-tax net realized investment gain/loss, other-

Slide 32: See Notice About This Presentation 33
See Notice About This Presentation 33
Source: SEC EDGAR · 8-K filed Aug 5, 2014
More decks from HCC Insurance Holdings Inc
 Q2 2015 Earnings Presentation31 slides · Aug 14, 2015
 Merger or Acquisition (June 2015)22 slides · Jun 23, 2015
 Merger or Acquisition (June 2015)10 slides · Jun 10, 2015
 Merger or Acquisition (June 2015)30 slides · Jun 10, 2015
 Q1 2015 Earnings Presentation35 slides · May 21, 2015
 36th Annual Raymond James Institutional Investors Conference (February 2015)36 slides · Feb 27, 2015