Consumer Portfolio Services, Inc. · NASDAQ:CPSS
Consumer Portfolio Services — Investor Presentation (November 2026)
20 slides from Consumer Portfolio Services's investor presentation, Nov 13, 2026

Slide 1: Leaders in Auto Finance Since 1991
Leaders in Auto Finance Since 1991 Company Overview and Investor Presentation - September 2026 Consumer Portfolio Services, Inc.
Slide 2: Safe Harbor Statement
SAFE HARBOR STATEMENT Forward - looking statements in this presentation include the Company’s expectations of growth and the Company's allowances for credit losses, fair value estimates, provision for credit losses, and related figures. In each case, such figures are forward - looking statements bec
Slide 3: Company Overview & Scale
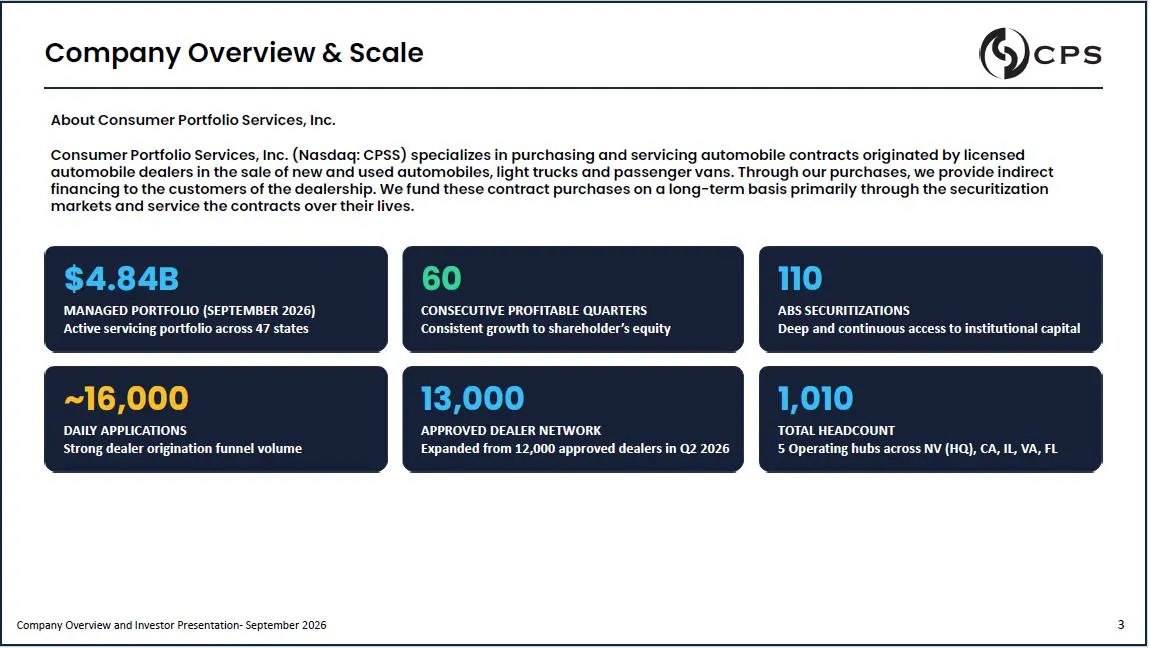
$4.84B MANAGED PORTFOLIO (SEPTEMBER 2026) Active servicing portfolio across 47 states 60 CONSECUTIVE PROFITABLE QUARTERS Consistent growth to shareholder’s equity 110 ABS SECURITIZATIONS Deep and continuous access to institutional capital ~16,000 DAILY APPLICATIONS Strong dealer origination funnel v
Slide 4: The CPS Advantage: Core Pillars
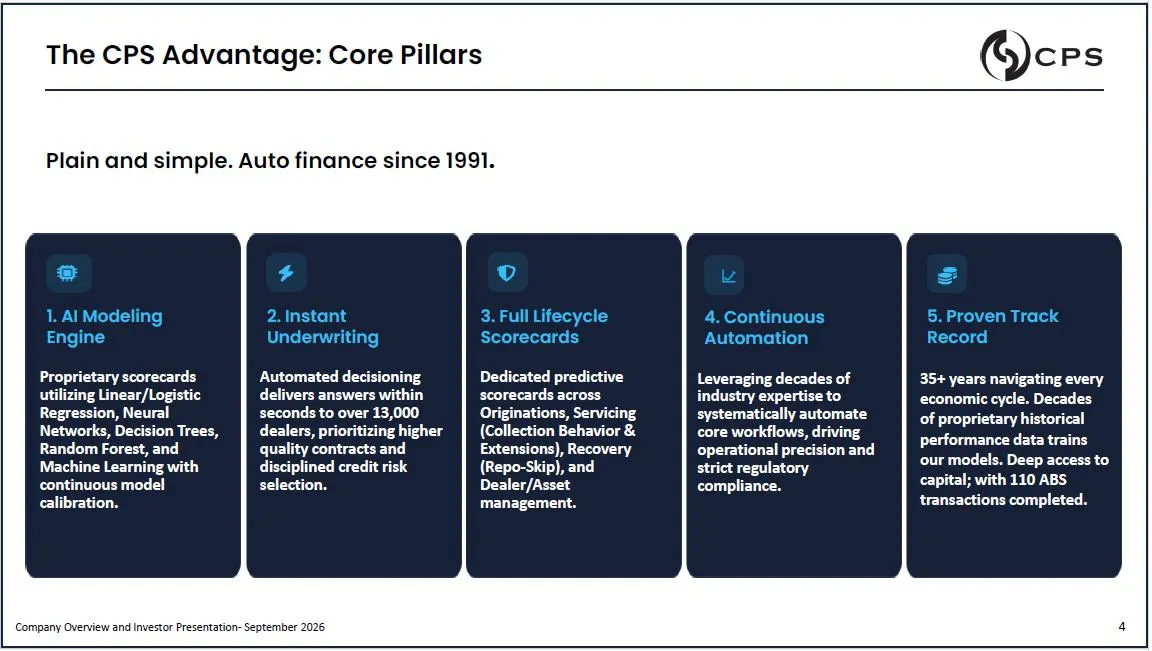
1. AI Modeling Engine Proprietary scorecards utilizing Linear/Logistic Regression, Neural Networks, Decision Trees, Random Forest, and Machine Learning with continuous model calibration. 2. Instant Underwriting Automated decisioning delivers answers within seconds to over 13,000 dealers, prioritizin
Slide 5: Executive Leadership Team
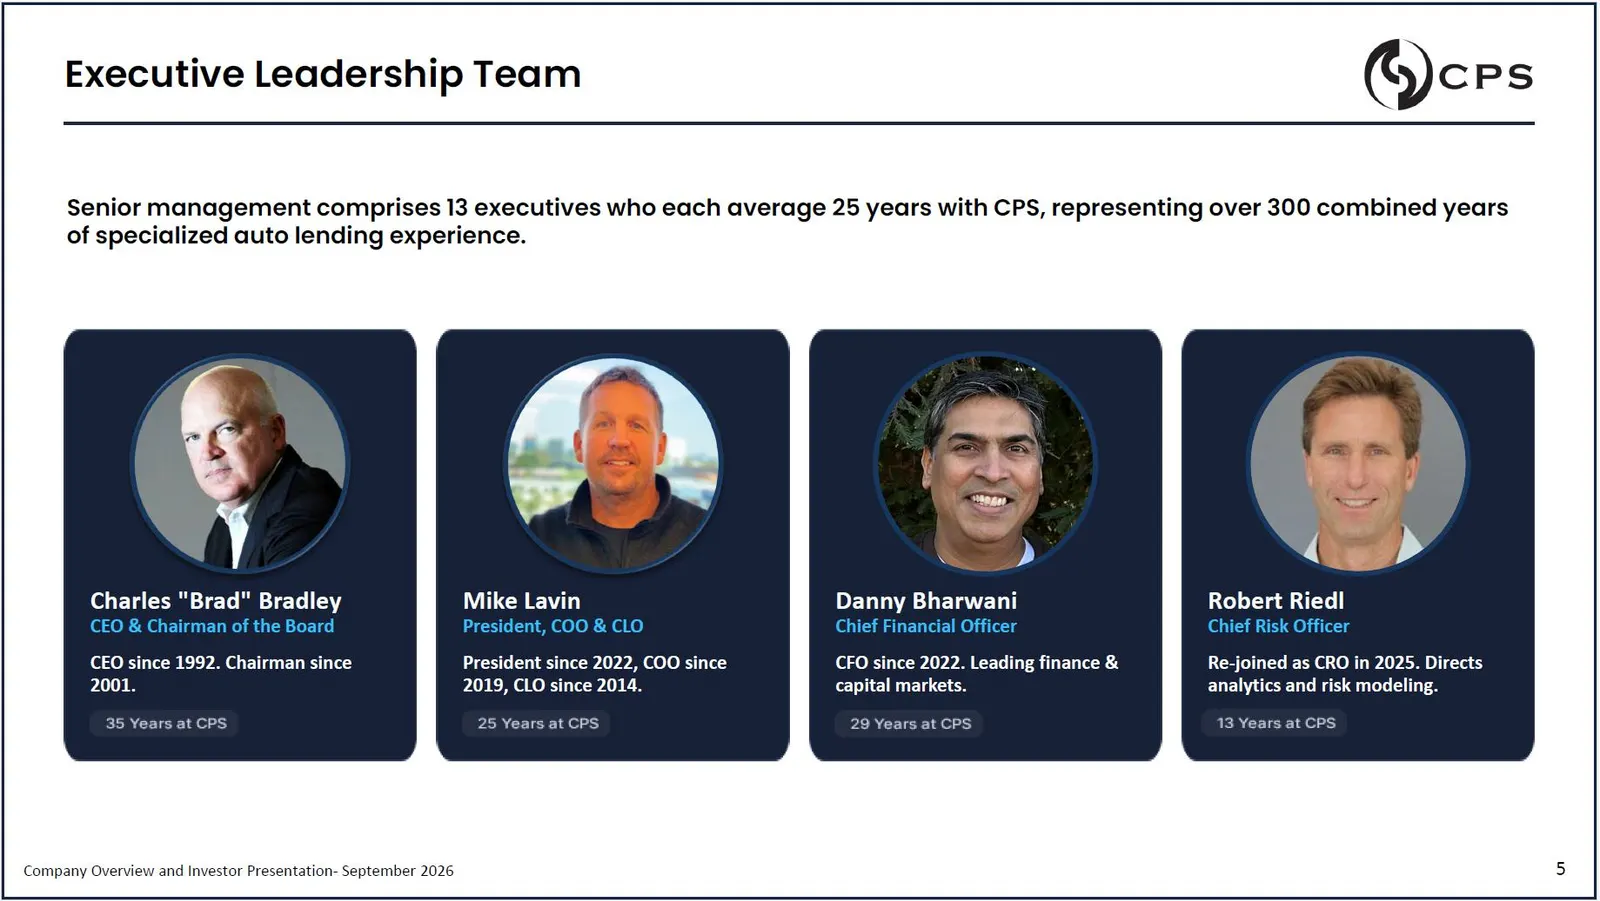
Charles "Brad" Bradley CEO & Chairman of the Board CEO since 1992. Chairman since 2001. Mike Lavin President, COO & CLO President since 2022, COO since 2019, CLO since 2014. Danny Bharwani Chief Financial Officer CFO since 2022. Leading finance & capital markets. Robert Riedl Chief Risk Officer Re -
Slide 6: Market Opportunity
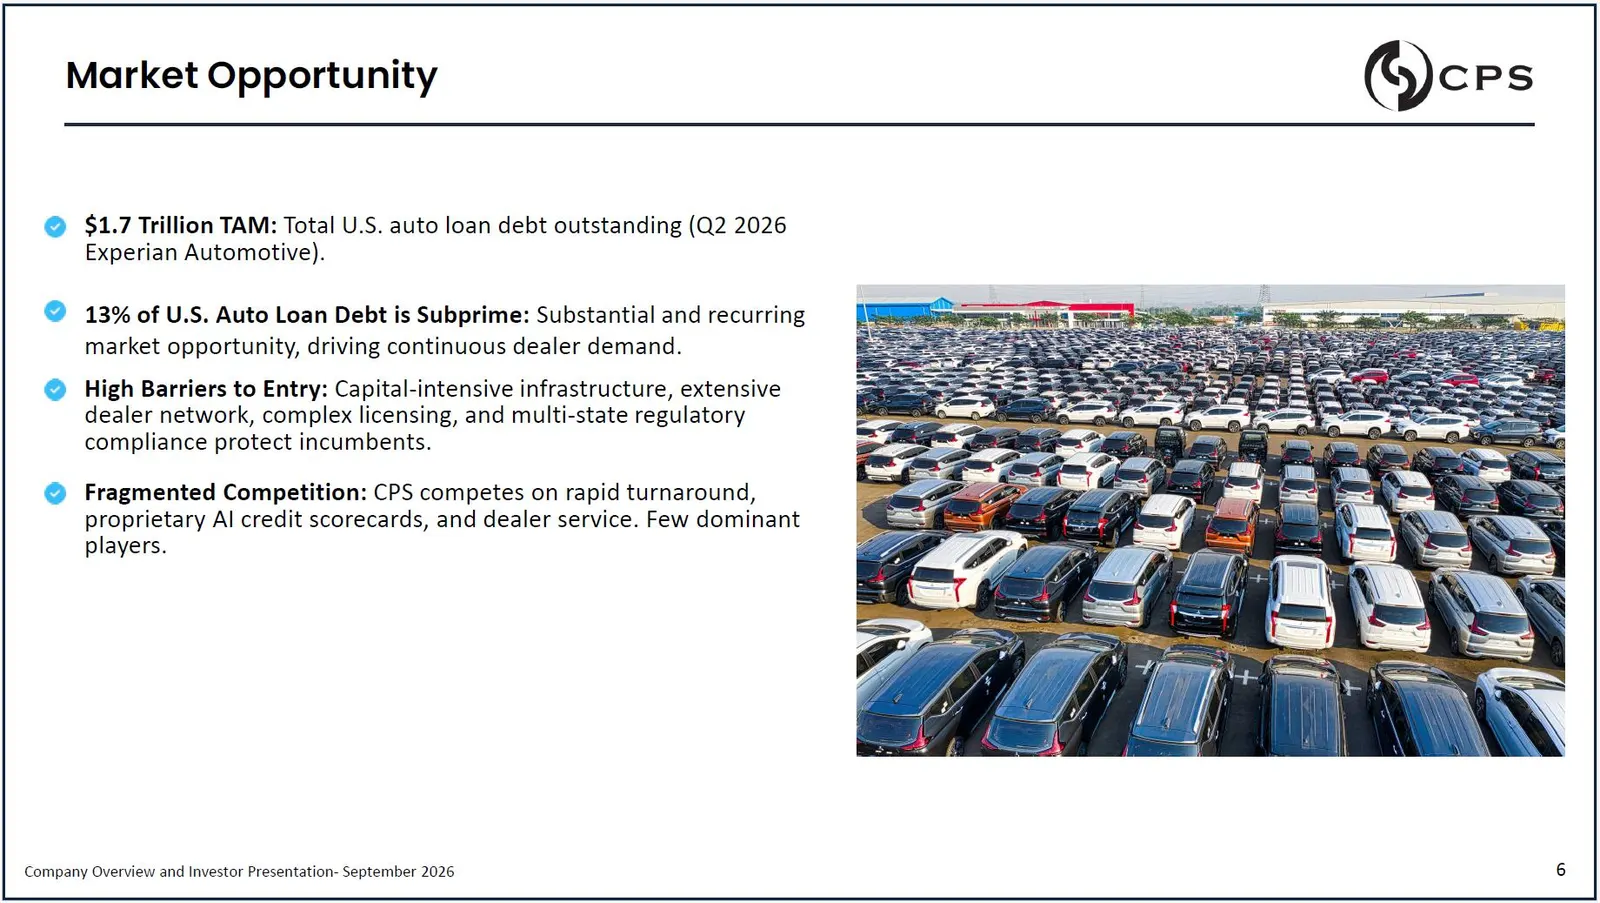
$1.7 Trillion TAM: Total U.S. auto loan debt outstanding (Q2 2026 Experian Automotive). 13% of U.S. Auto Loan Debt is Subprime: Substantial and recurring market opportunity, driving continuous dealer demand. High Barriers to Entry: Capital - intensive infrastructure, extensive dealer network, comple
Slide 7: Geographic Footprint & Reach
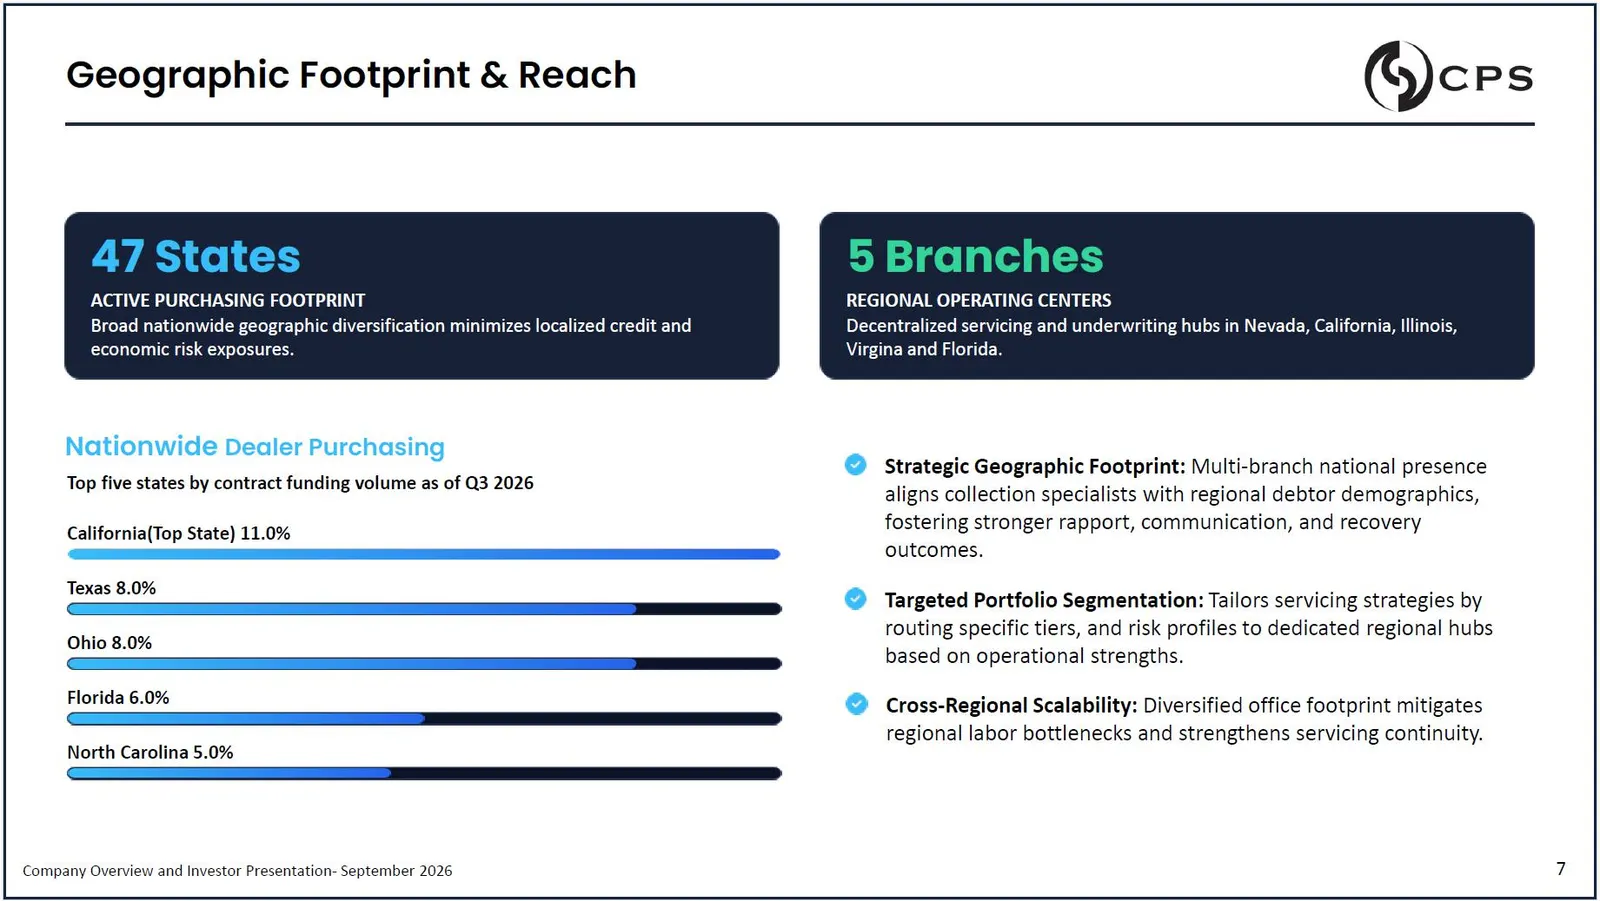
47 States ACTIVE PURCHASING FOOTPRINT Broad nationwide geographic diversification minimizes localized credit and economic risk exposures. 5 Branches REGIONAL OPERATING CENTERS Decentralized servicing and underwriting hubs in Nevada, California, Illinois, Virgina and Florida. Nationwide Dealer Purcha
Slide 8: Product Offering Matrix
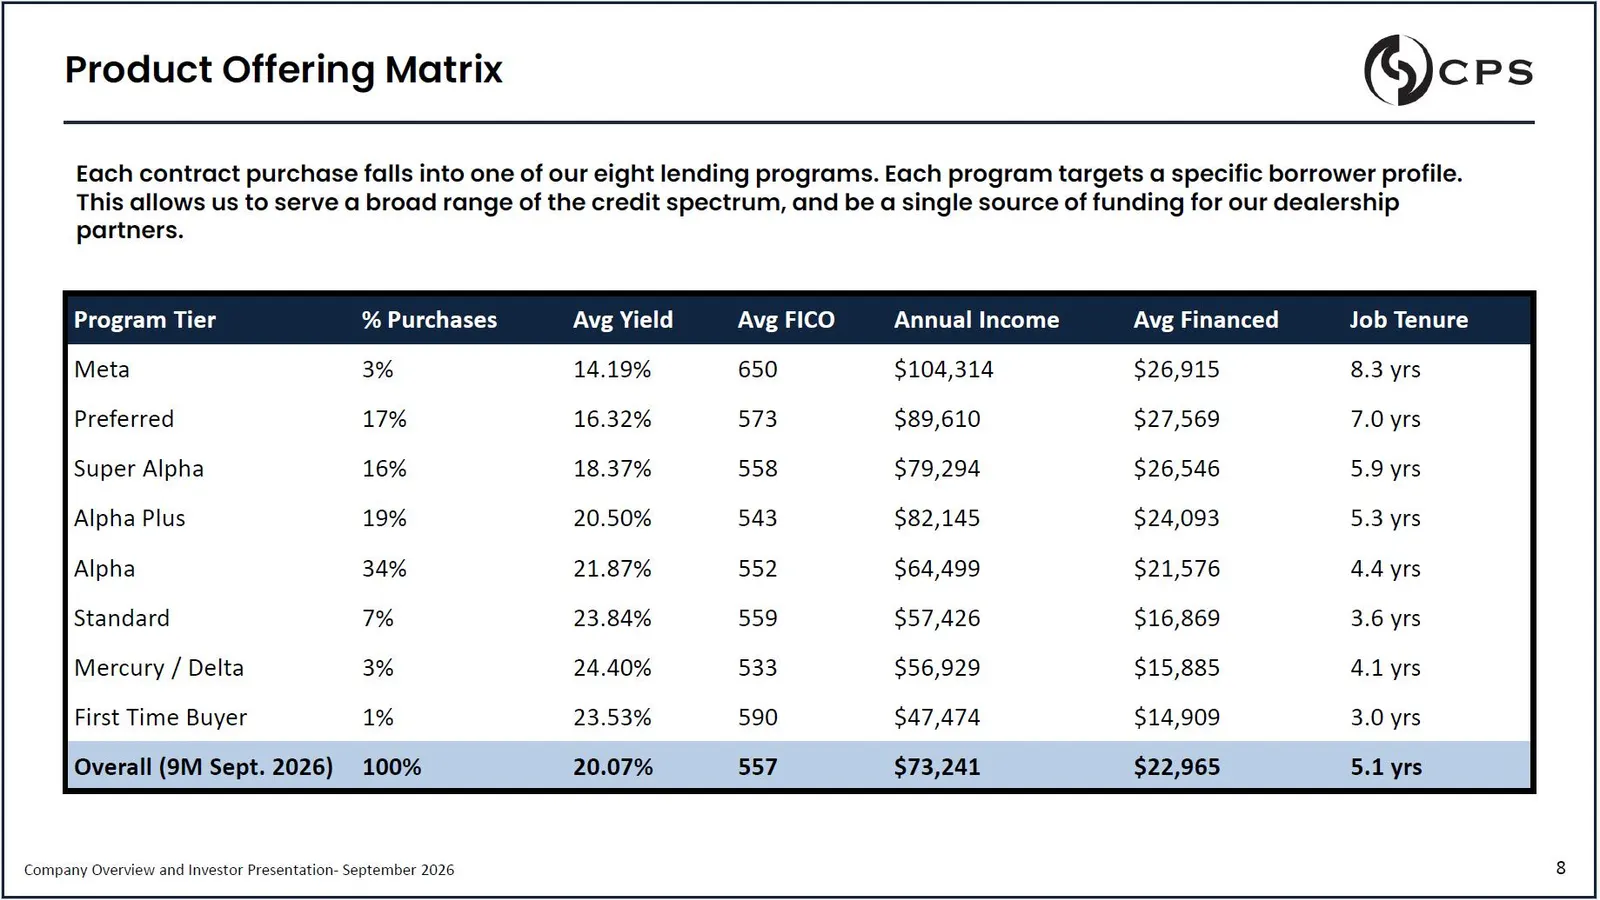
Job Tenure Avg Financed Annual Income Avg FICO Avg Yield % Purchases Program Tier 8.3 yrs $26,915 $104,314 650 14.19% 3% Meta 7.0 yrs $27,569 $89,610 573 16.32% 17% Preferred 5.9 yrs $26,546 $79,294 558 18.37% 16% Super Alpha 5.3 yrs $24,093 $82,145 543 20.50% 19% Alpha Plus 4.4 yrs $21,576 $64,499
Slide 9: Borrower Demographics
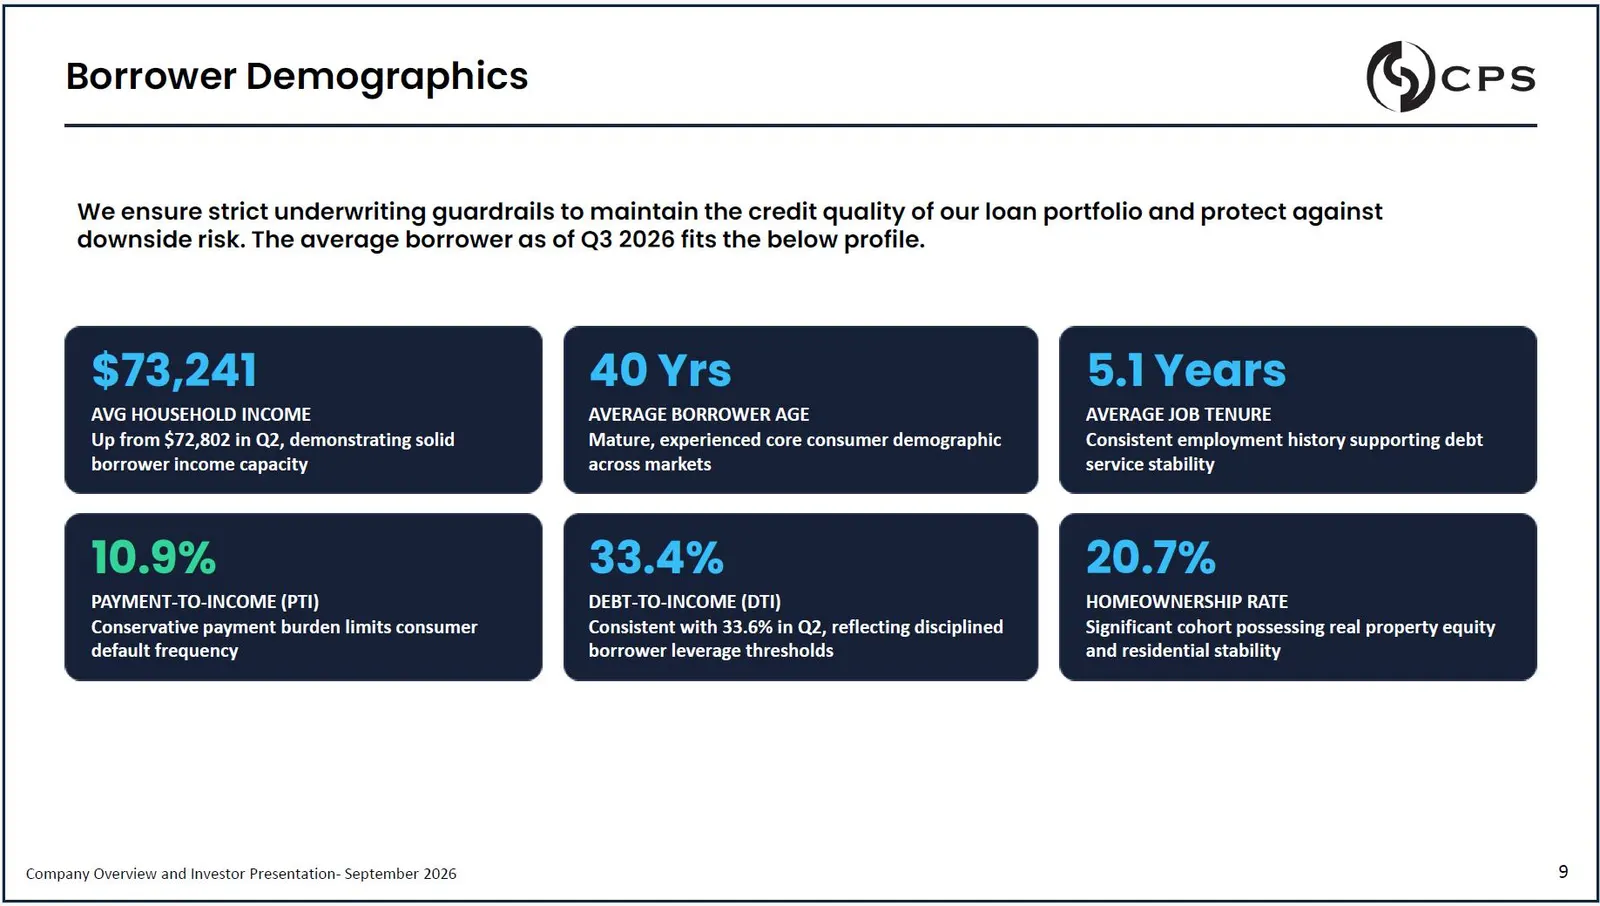
$73,241 AVG HOUSEHOLD INCOME Up from $72,802 in Q2, demonstrating solid borrower income capacity 40 Yrs AVERAGE BORROWER AGE Mature, experienced core consumer demographic across markets 5.1 Years AVERAGE JOB TENURE Consistent employment history supporting debt service stability 10.9% PAYMENT - TO -
Slide 10: Vehicle & Dealership Mix
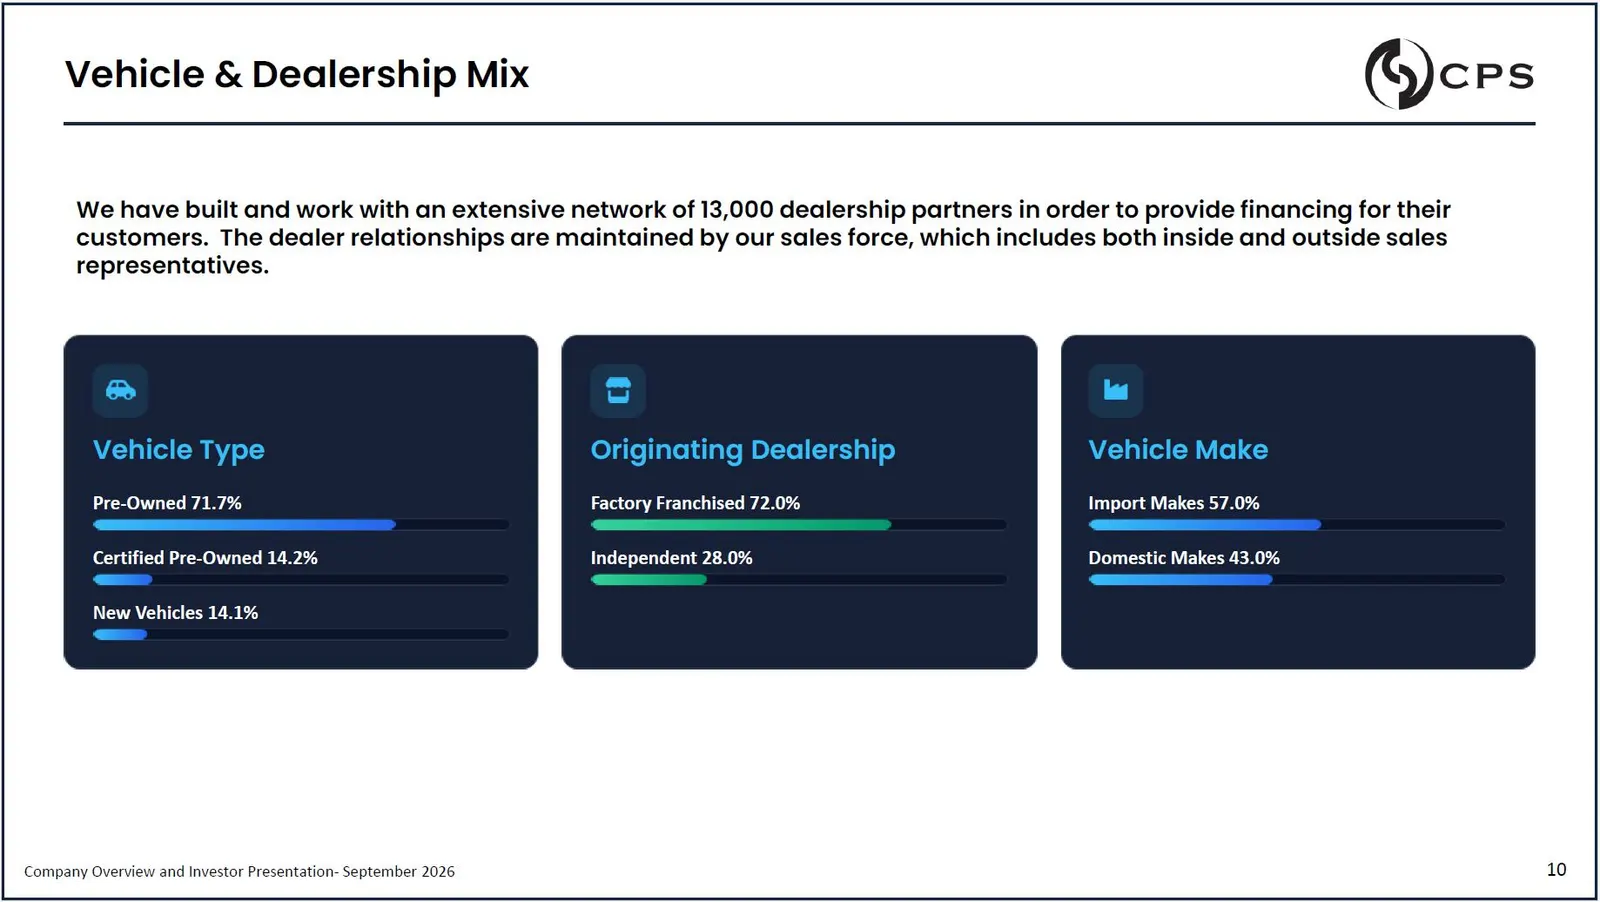
Vehicle Type Pre - Owned 71.7% Certified Pre - Owned 14.2% New Vehicles 14.1% Originating Dealership Factory Franchised 72.0% Independent 28.0% Vehicle Make Import Makes 57.0% Domestic Makes 43.0% Vehicle & Dealership Mix We have built and work with an extensive network of 13 , 000 dealership partne
Slide 11: Contract Purchase Characteristics
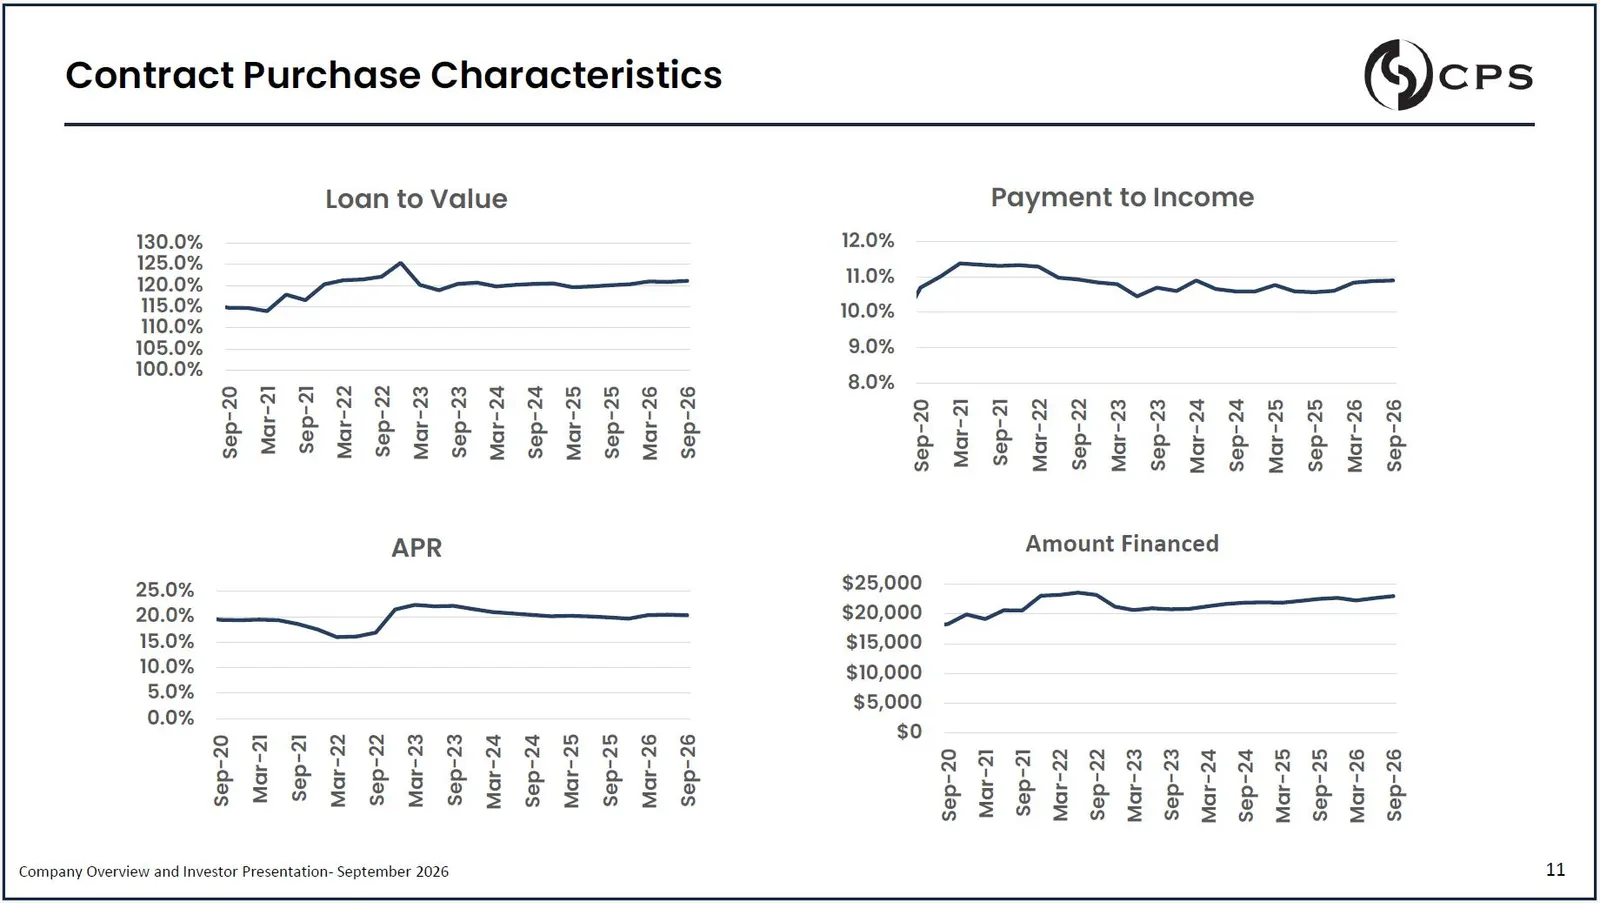
Contract Purchase Characteristics 130.0% 125.0% 120.0% 115.0% 110.0% 105.0% 100.0% Sep - 20 Mar - 21 Sep - 21 Mar - 22 Sep - 22 Mar - 23 Sep - 23 Mar - 24 Sep - 24 Mar - 25 Sep - 25 Mar - 26 Sep - 26 Loan to Value 12.0% 11.0% 10.0% 9.0% 8.0% 11 Company Overview and Investor Presentation - September
Slide 12: Portfolio Performance
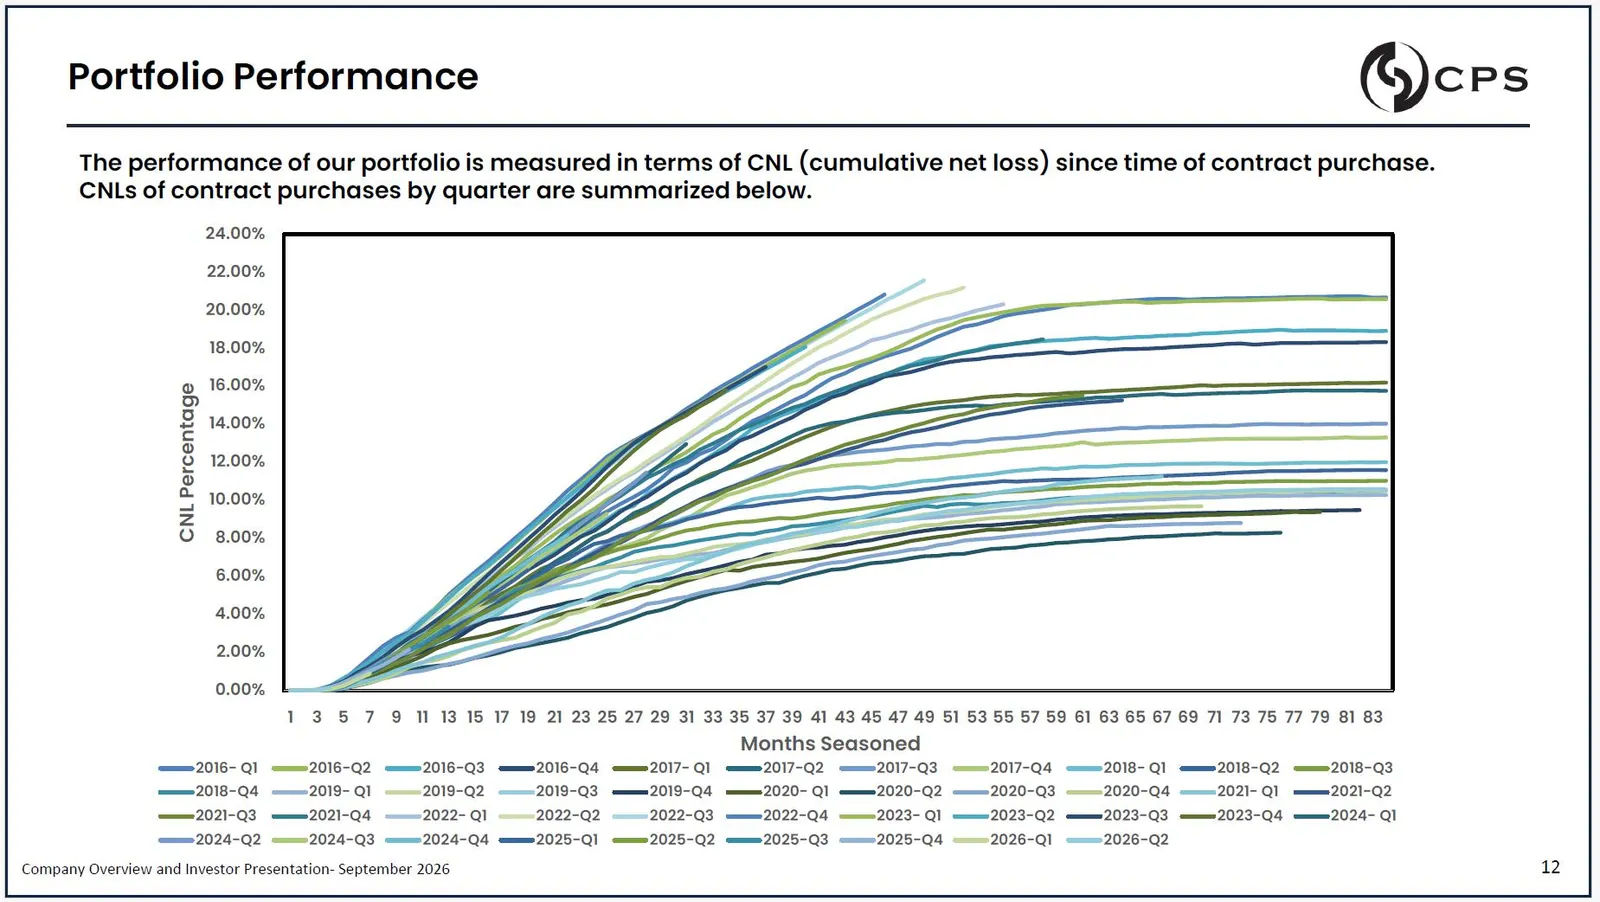
Portfolio Performance CNL Percentage 2018 - Q2 2021 - Q1 2023 - Q4 2018 - Q3 2021 - Q2 2024 - Q1 2016 - Q1 2018 - Q4 2021 - Q3 2024 - Q2 2016 - Q2 2019 - Q1 2021 - Q4 2024 - Q3 2016 - Q3 2019 - Q2 2022 - Q1 2024 - Q4 2016 - Q4 2019 - Q3 2022 - Q2 2025 - Q1 2017 - Q1 2019 - Q4 2022 - Q3 2025 - Q2 201
Slide 13: Economic Model & Margins
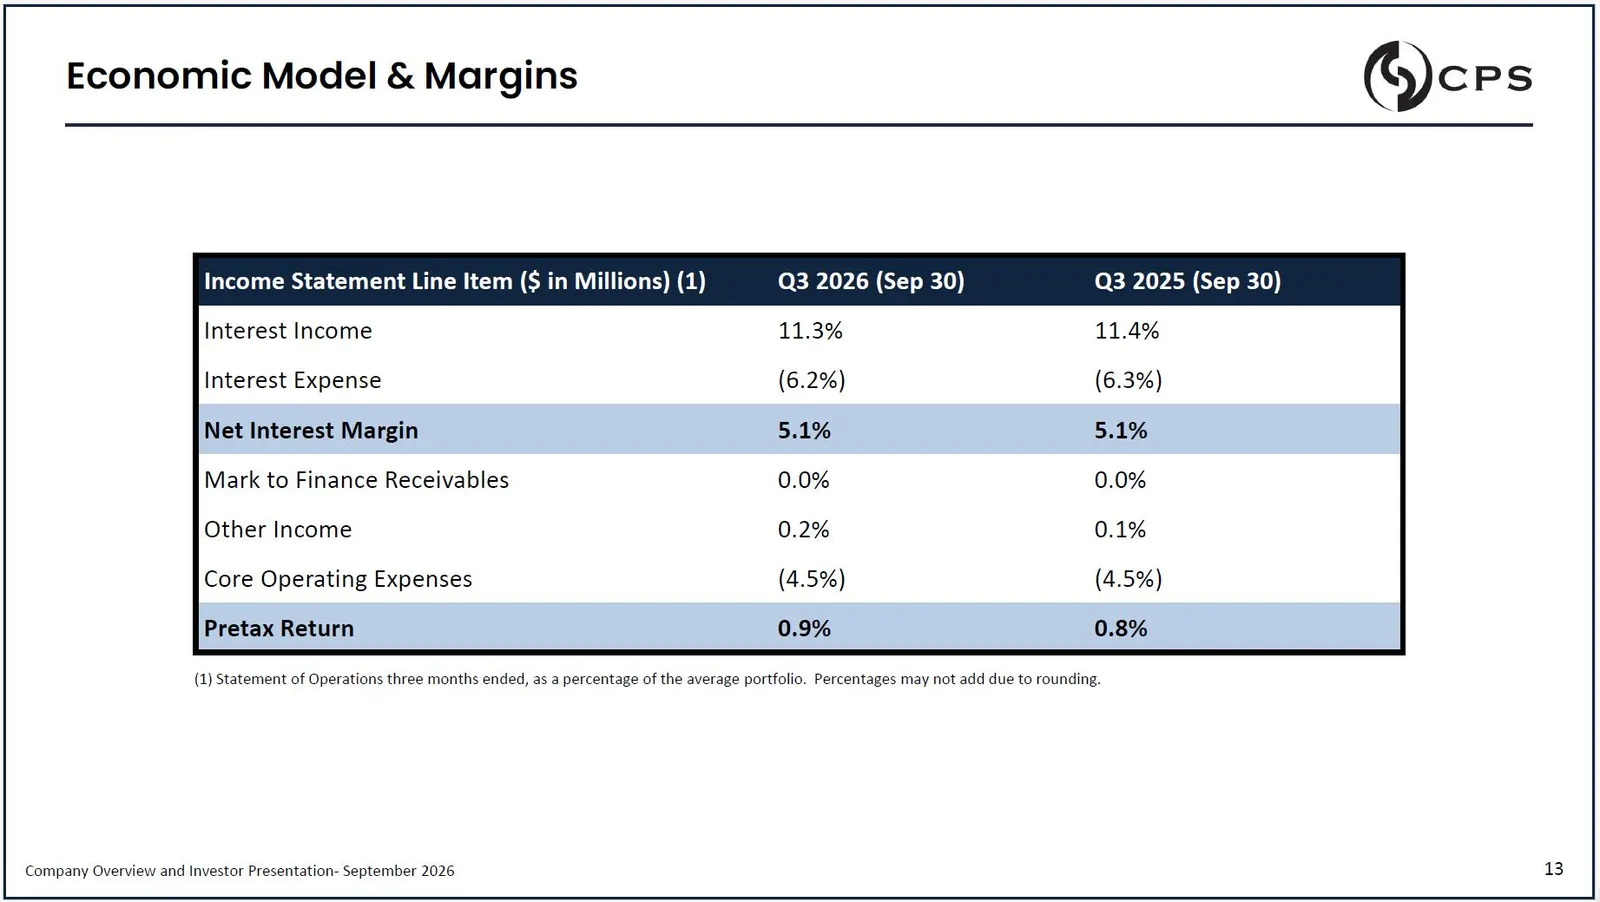
Economic Model & Margins (1) Statement of Operations three months ended, as a percentage of the average portfolio. Percentages may not add due to rounding. 13 Company Overview and Investor Presentation - September 2026 Q3 2025 (Sep 30) Q3 2026 (Sep 30) Income Statement Line Item ($ in Millions) (1)
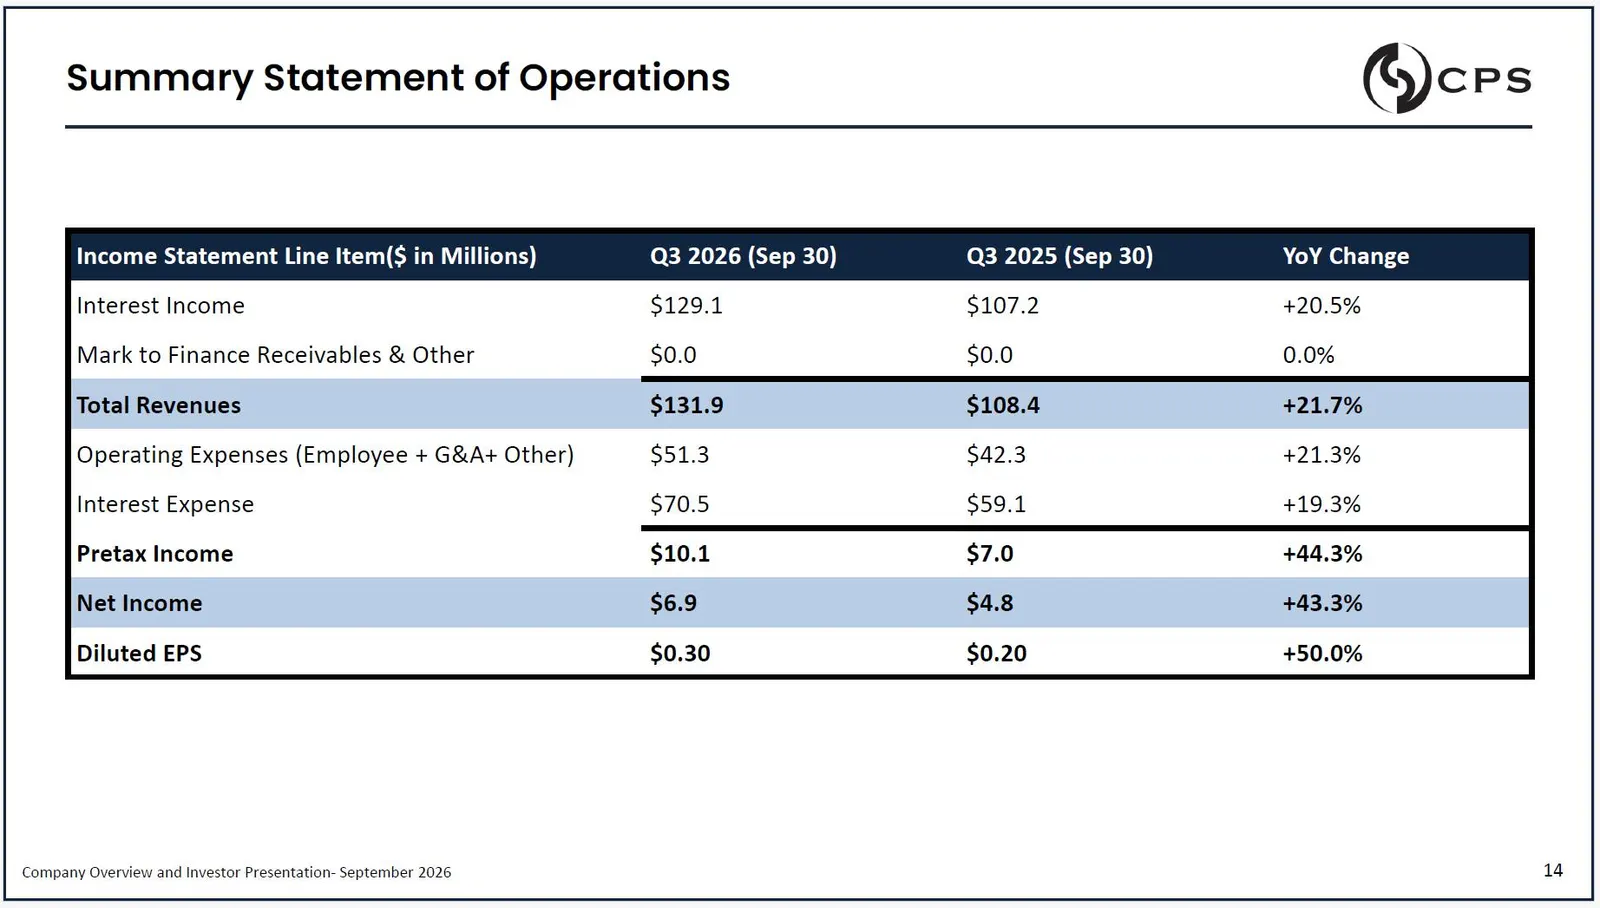
Slide 14: Summary Statement of Operations
YoY Change Q3 2025 (Sep 30) Q3 2026 (Sep 30) Income Statement Line Item($ in Millions) +20.5% $107.2 $129.1 Interest Income 0.0% $0.0 $0.0 Mark to Finance Receivables & Other +21.7% $108.4 $131.9 Total Revenues +21.3% $42.3 $51.3 Operating Expenses (Employee + G&A+ Other) +19.3% $59.1 $70.5 Interest
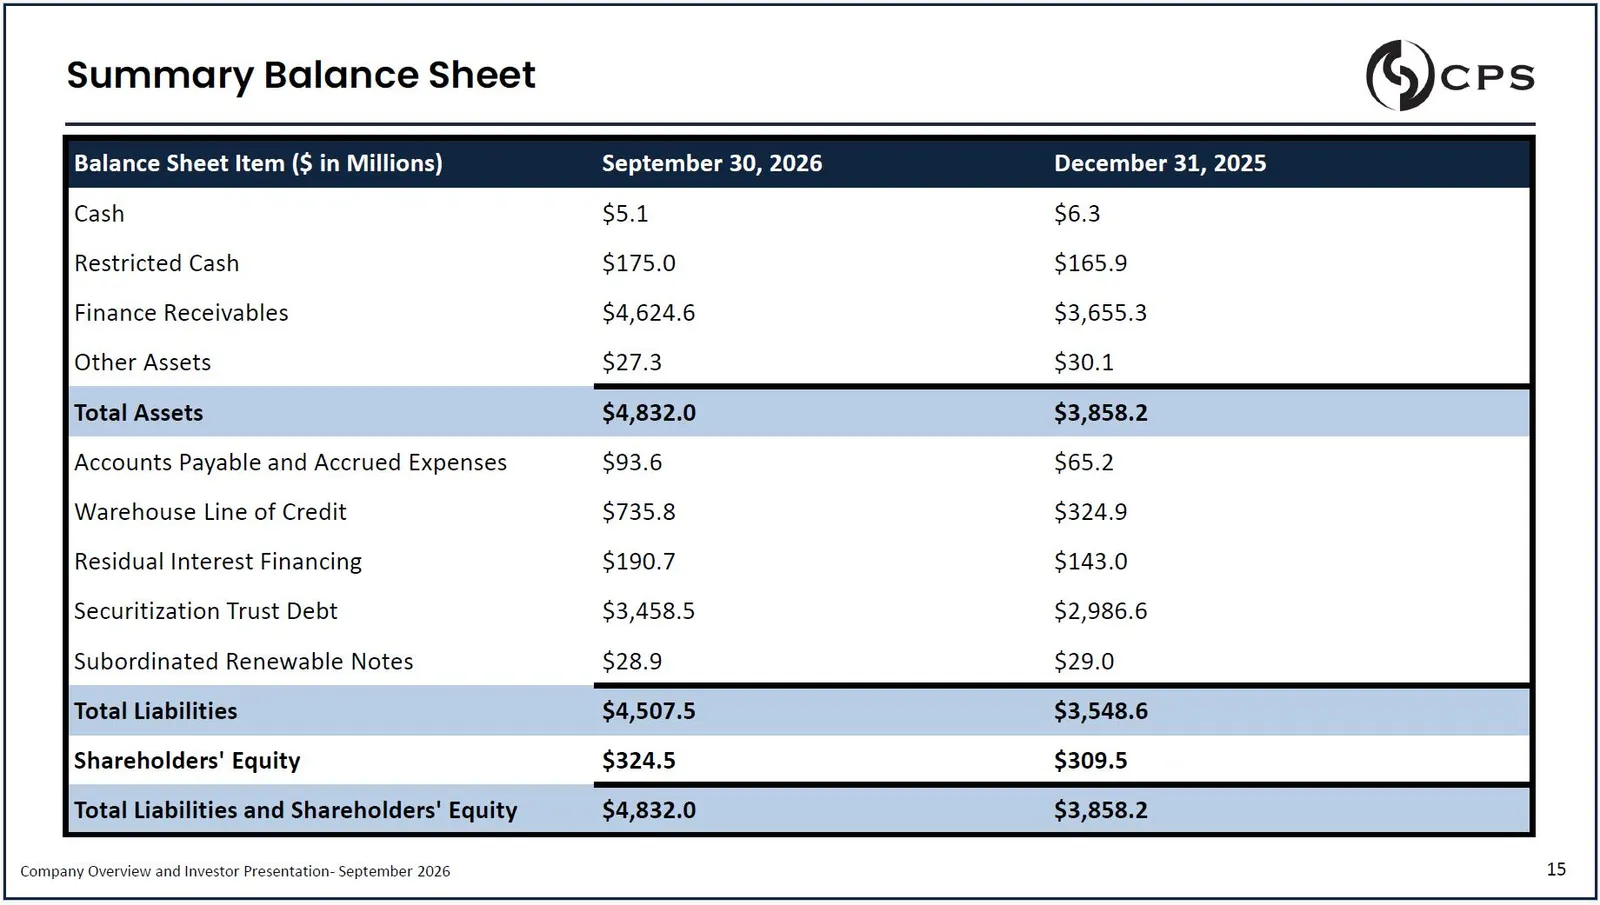
Slide 15: Summary Balance Sheet
December 31, 2025 September 30, 2026 Balance Sheet Item ($ in Millions) $6.3 $5.1 Cash $165.9 $175.0 Restricted Cash $3,655.3 $4,624.6 Finance Receivables $30.1 $27.3 Other Assets $3,858.2 $4,832.0 Total Assets $65.2 $93.6 Accounts Payable and Accrued Expenses $324.9 $735.8 Warehouse Line of Credit
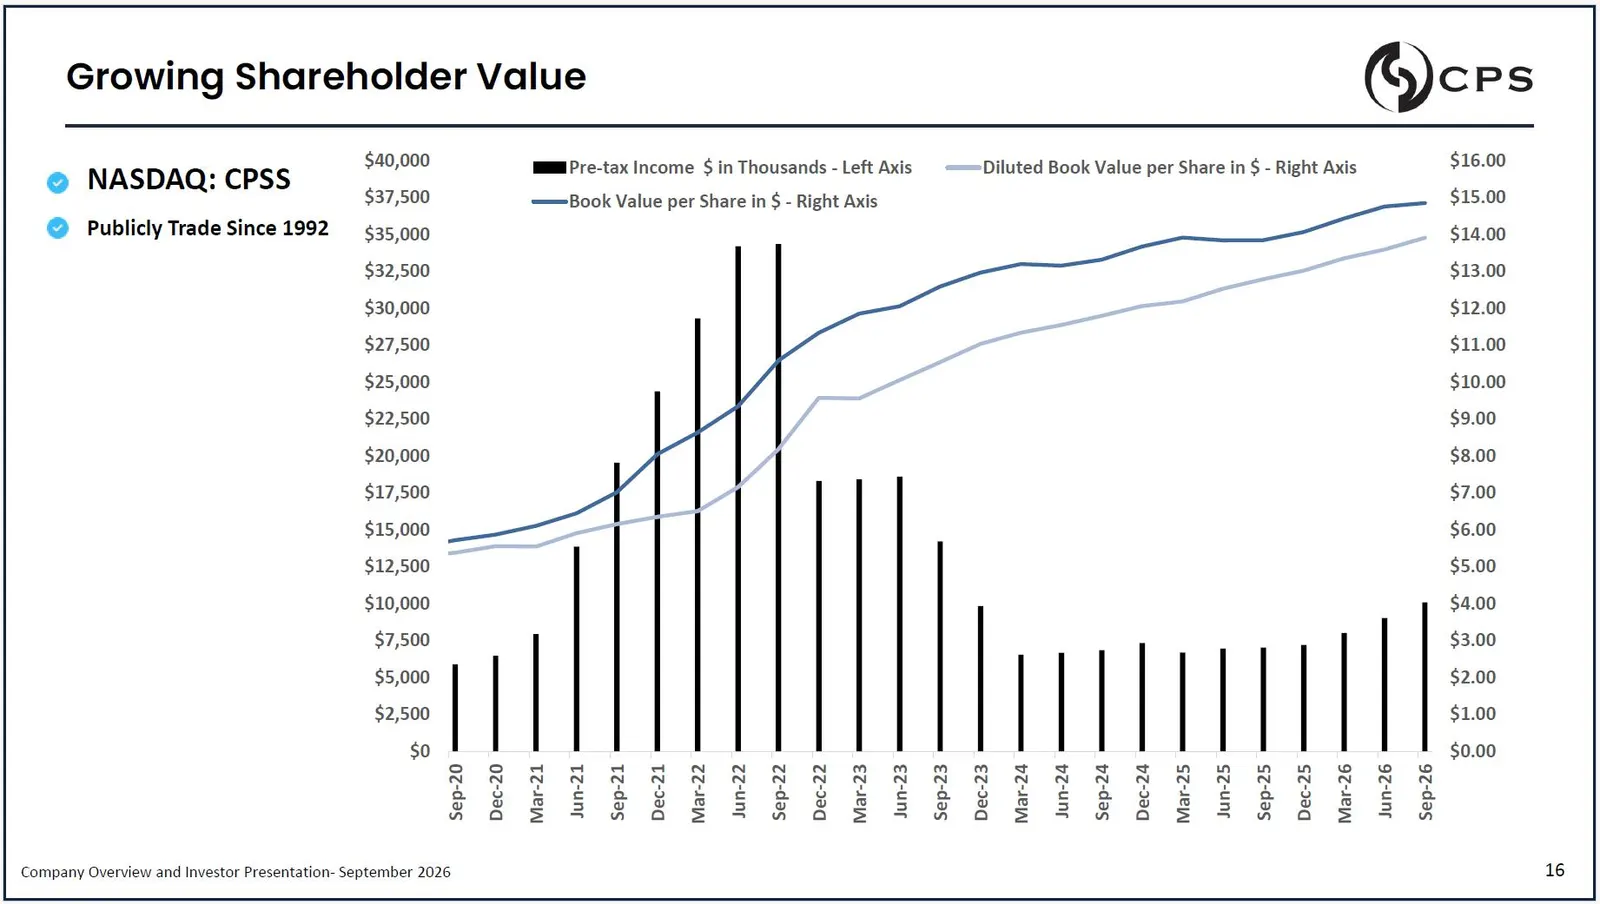
Slide 16: Growing Shareholder Value
Growing Shareholder Value $5,000 $2,500 $0 $7,500 $15,000 $12,500 $10,000 $17,500 $25,000 $22,500 $20,000 $27,500 $35,000 $32,500 $30,000 $37,500 $40,000 Sep - 20 Dec - 20 Mar - 21 Jun - 21 Sep - 21 Dec - 21 Mar - 22 Jun - 22 Sep - 22 Dec - 22 Mar - 23 Jun - 23 Sep - 23 Dec - 23 Mar - 24 Jun - 24 Se
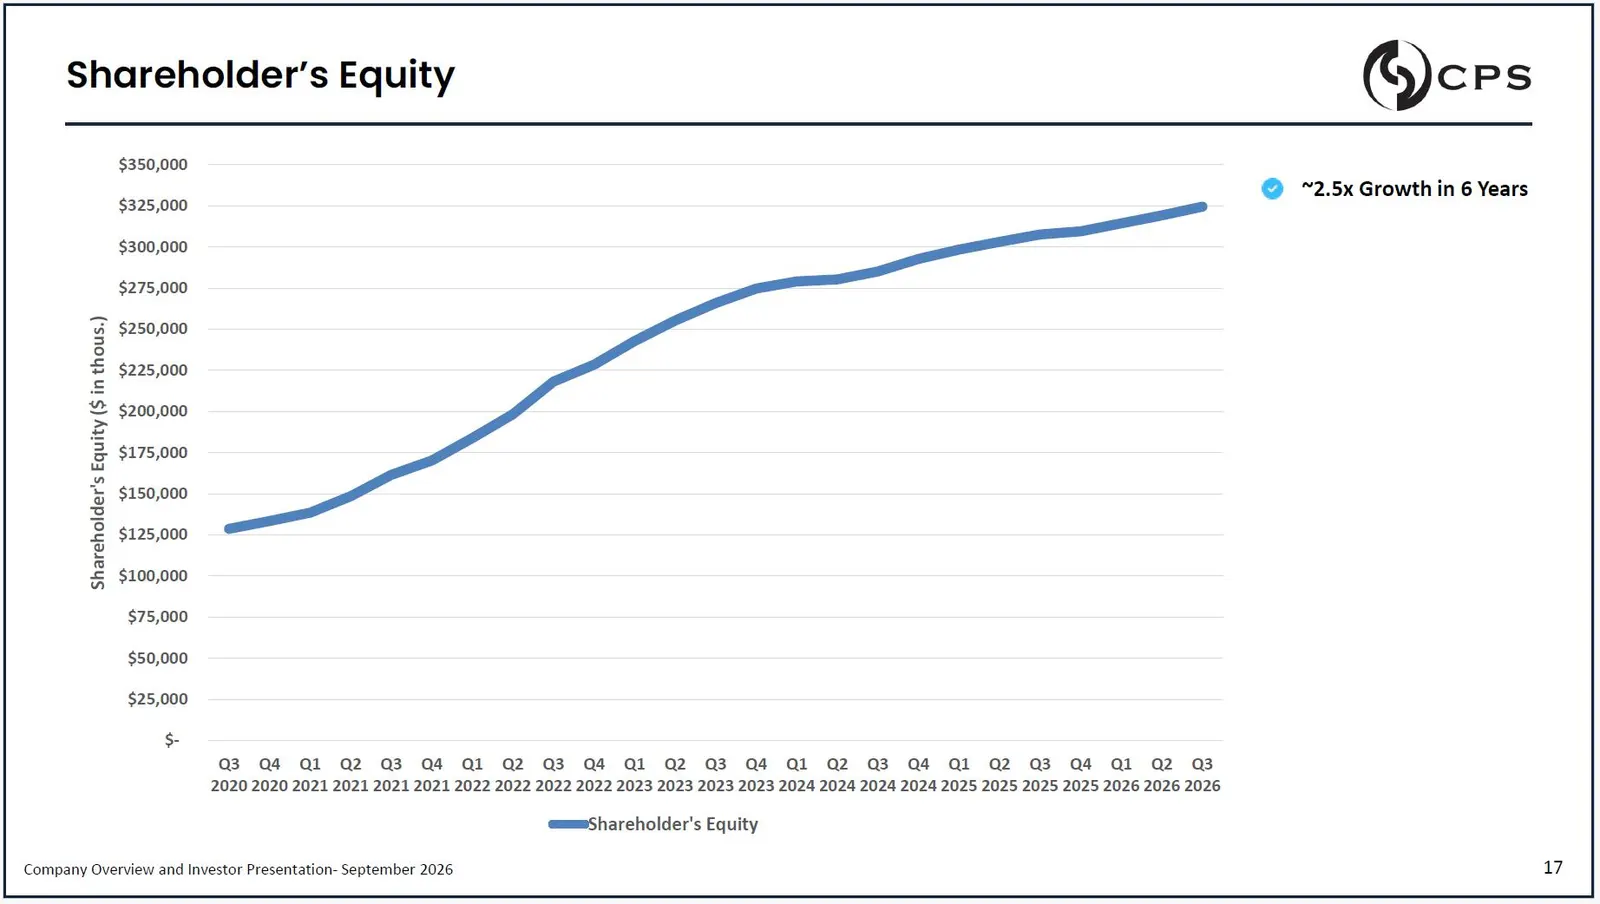
Slide 17: Shareholder's Equity
Shareholder’s Equity $325,000 $350,000 Shareholder's Equity ($ in thous.) $300,000 $275,000 $250,000 $225,000 $200,000 $175,000 $150,000 $125,000 $100,000 $75,000 $50,000 $25,000 $ - Q3 Q4 Q1 Q2 Q3 Q4 Q1 Q2 Q3 Q4 Q1 Q2 Q3 Q4 Q1 Q2 Q3 Q4 Q1 Q2 Q3 Q4 Q1 Q2 Q3 2020 2020 2021 2021 2021 2021 2022 2022 20
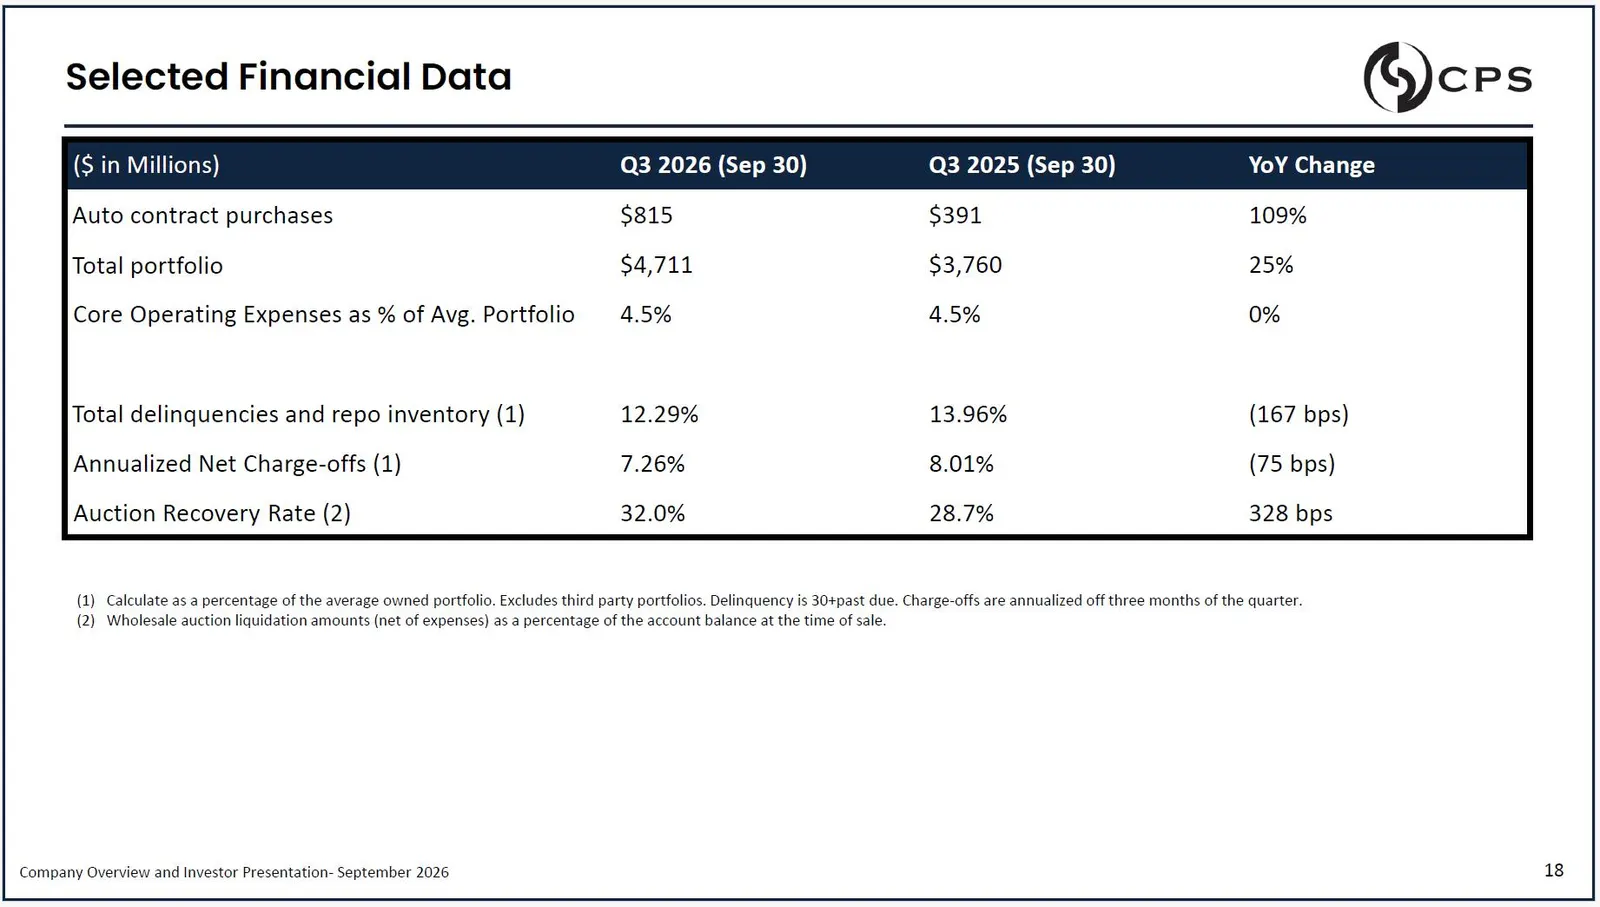
Slide 18: Selected Financial Data
YoY Change Q3 2025 (Sep 30) Q3 2026 (Sep 30) ($ in Millions) 109% $391 $815 Auto contract purchases 25% $3,760 $4,711 Total portfolio 0% 4.5% 4.5% Core Operating Expenses as % of Avg. Portfolio (167 bps) 13.96% 12.29% Total delinquencies and repo inventory (1) (75 bps) 8.01% 7.26% Annualized Net Cha
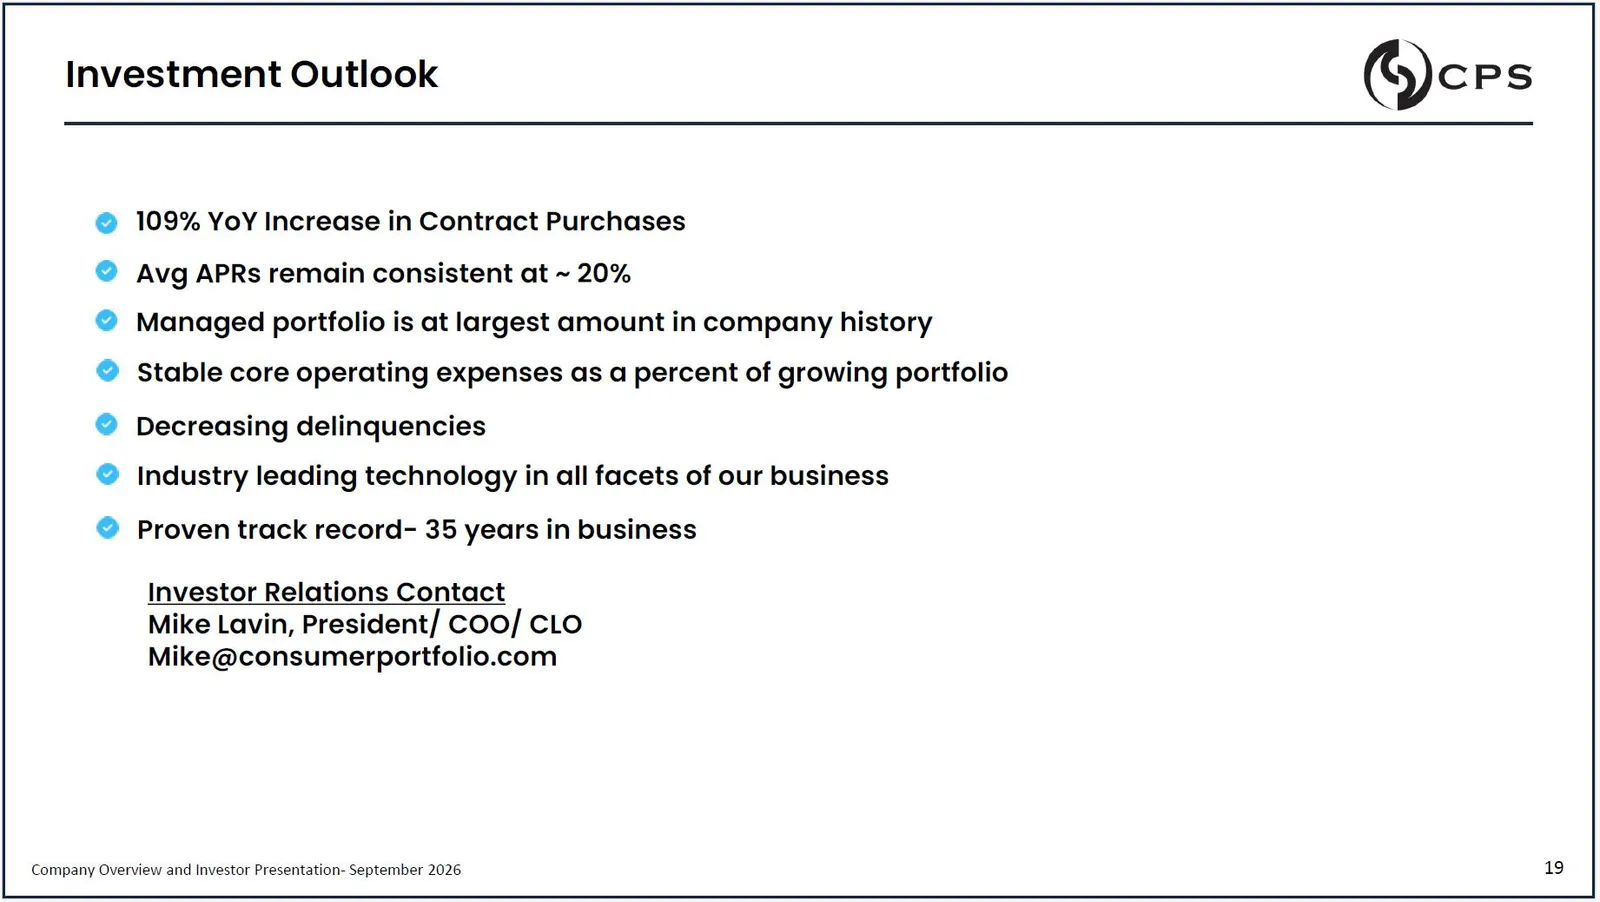
Slide 19: Investment Outlook
Investment Outlook 109% YoY Increase in Contract Purchases Avg APRs remain consistent at ~ 20% Managed portfolio is at largest amount in company history Stable core operating expenses as a percent of growing portfolio Decreasing delinquencies Industry leading technology in all facets of our business
Slide 20: Reference to Public Reports
REFERENCE TO PUBLIC REPORTS Any person considering an investment in securities issued by CPS is urged to review the materials filed by CPS with the U.S. Securities and Exchange Commission ("Commission"). Such materials may be found by inquiring of the Commission‘s EDGAR search page www.sec.gov/edgar
Source: SEC EDGAR · 8-K filed Nov 13, 2026
More decks from Consumer Portfolio Services, Inc.
 Investor Presentation (August 2026)20 slides · Aug 25, 2026
 Q2 2026 Earnings Presentation20 slides · June 2026
 Investor Presentation (May 2026)20 slides · May 20, 2026
 Investor Presentation (March 2026)19 slides · Mar 24, 2026
 Investor Presentation (March 2026)20 slides · March 2026
 Investor Presentation (December 2025)19 slides · December 2025