Lagardere SA · EURONEXT:MMB
Lagardere SA — Lagardère SCA — Investor Presentation (April 2019)
55 slides from Lagardere SA's investor presentation, April 2019
Slide 1: Investor Presentation April 2019
INVESTOR PRESENTATION APRIL 2019
Slide 2: Disclaimer
DISCLAIMER Certain statements contained in this document are forward-looking statements (including objectives and trends), which address our vision of the financial condition, results of operations, strategy, expected future business and financial performance of Lagardère SCA. These data do not repr
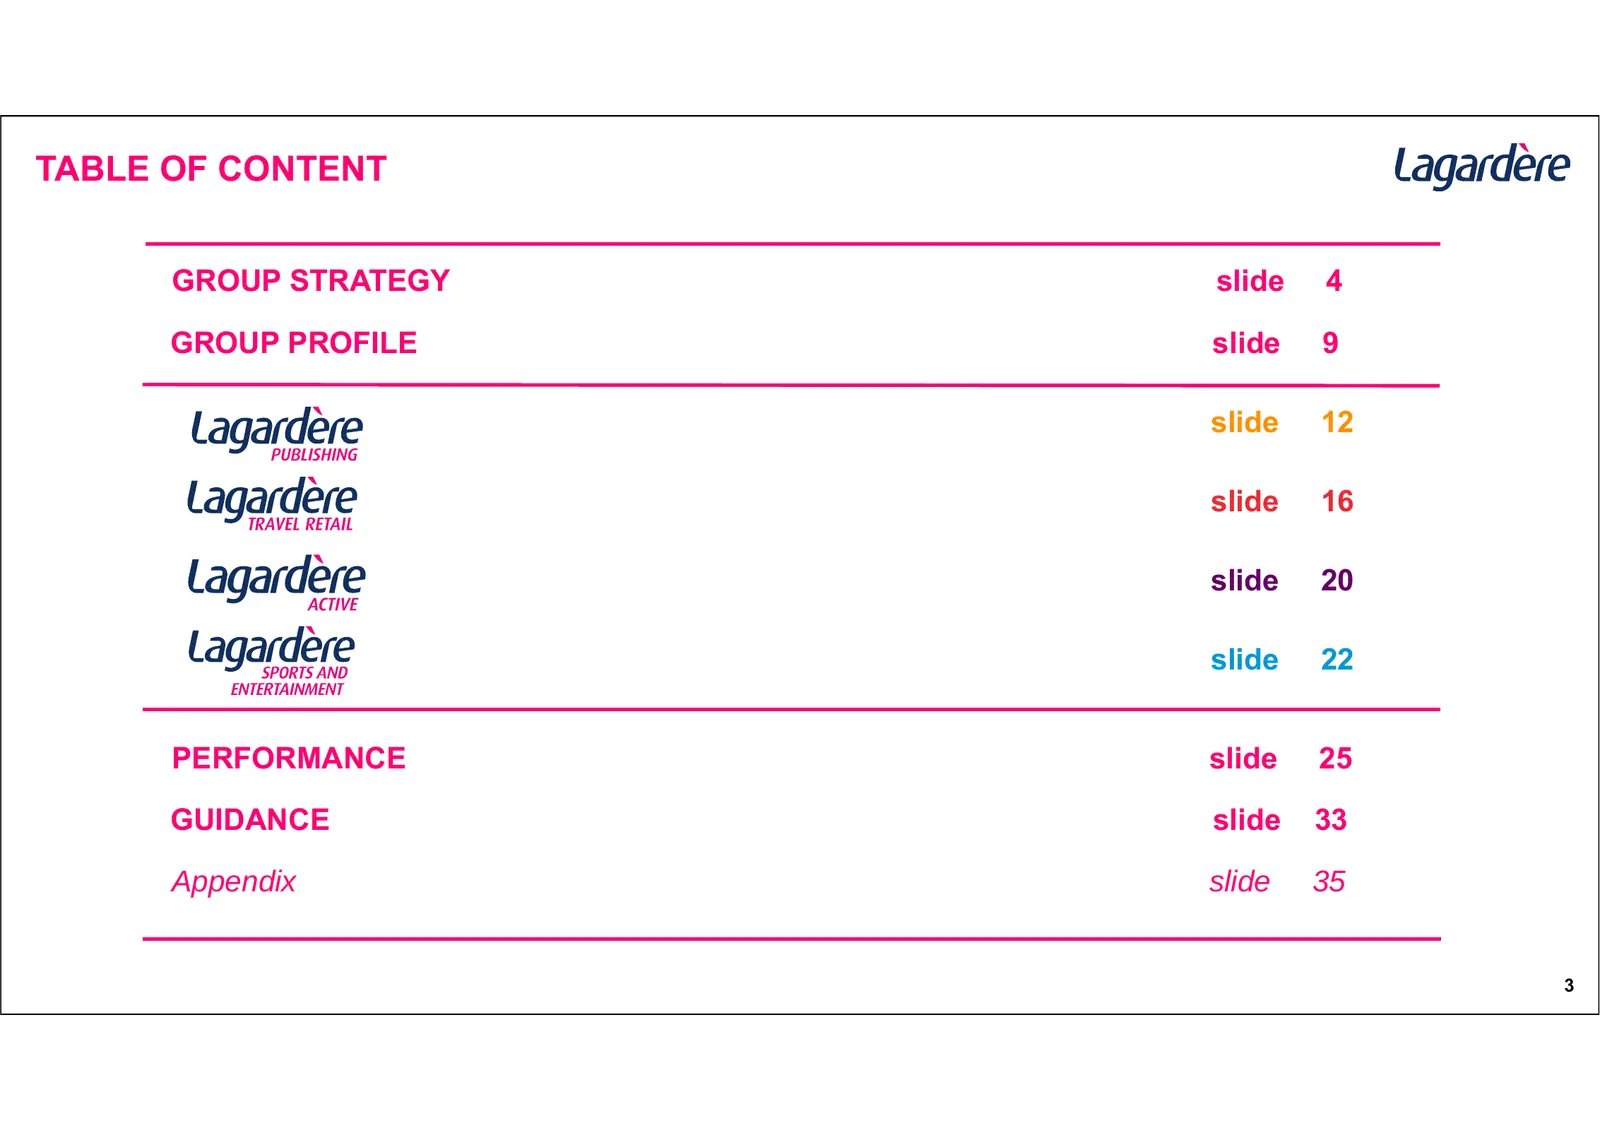
Slide 3: Table of Content
TABLE OF CONTENT GROUP STRATEGY slide 4 GROUP PROFILE slide 9 slide 12 slide 16 slide 20 slide 22 PERFORMANCE slide 25 GUIDANCE slide 33 Appendix slide 35 3

Slide 4: Group Strategy
Lagardere GROUP STRATEGY MICHAEL J GONNELEY
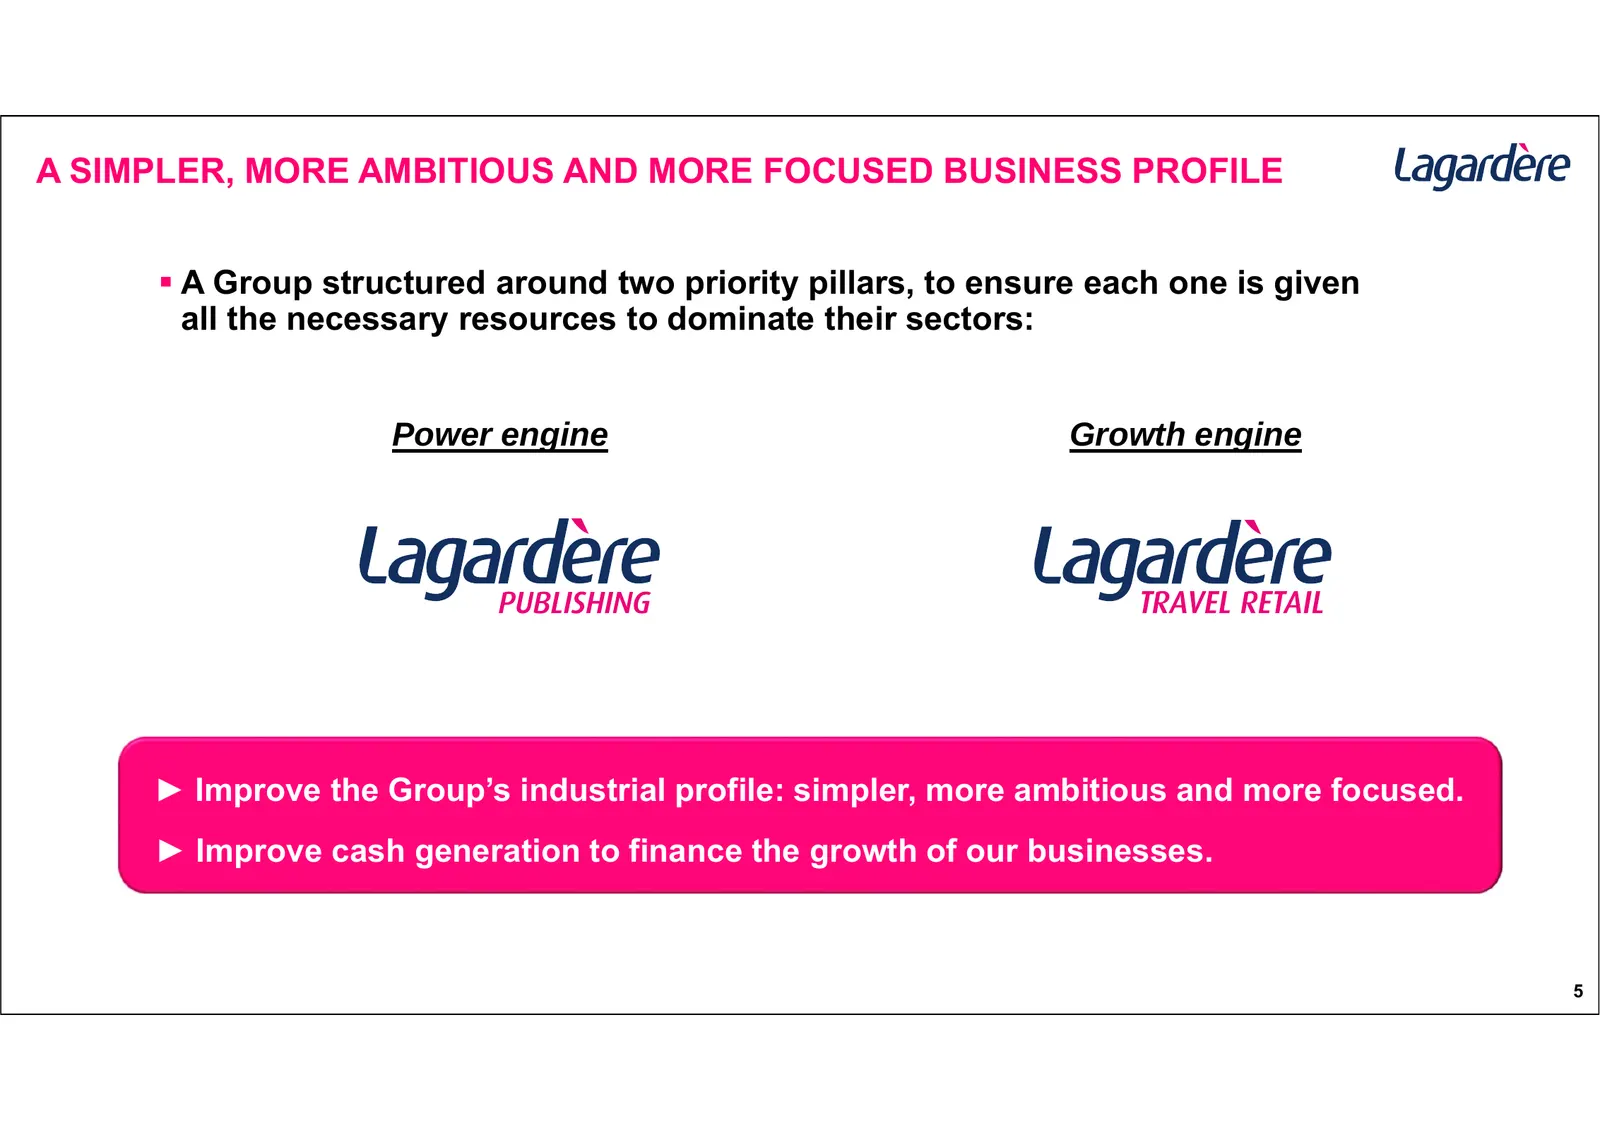
Slide 5: A simpler, more ambitious and more focused business profile
A SIMPLER, MORE AMBITIOUS AND MORE FOCUSED BUSINESS PROFILE A Group structured around two priority pillars, to ensure each one is given all the necessary resources to dominate their sectors: Power engine Growth engine ► Improve the Group’s industrial profile: simpler, more ambitious and more focus
Slide 6: 2018, the year of the strategic refocusing roll out
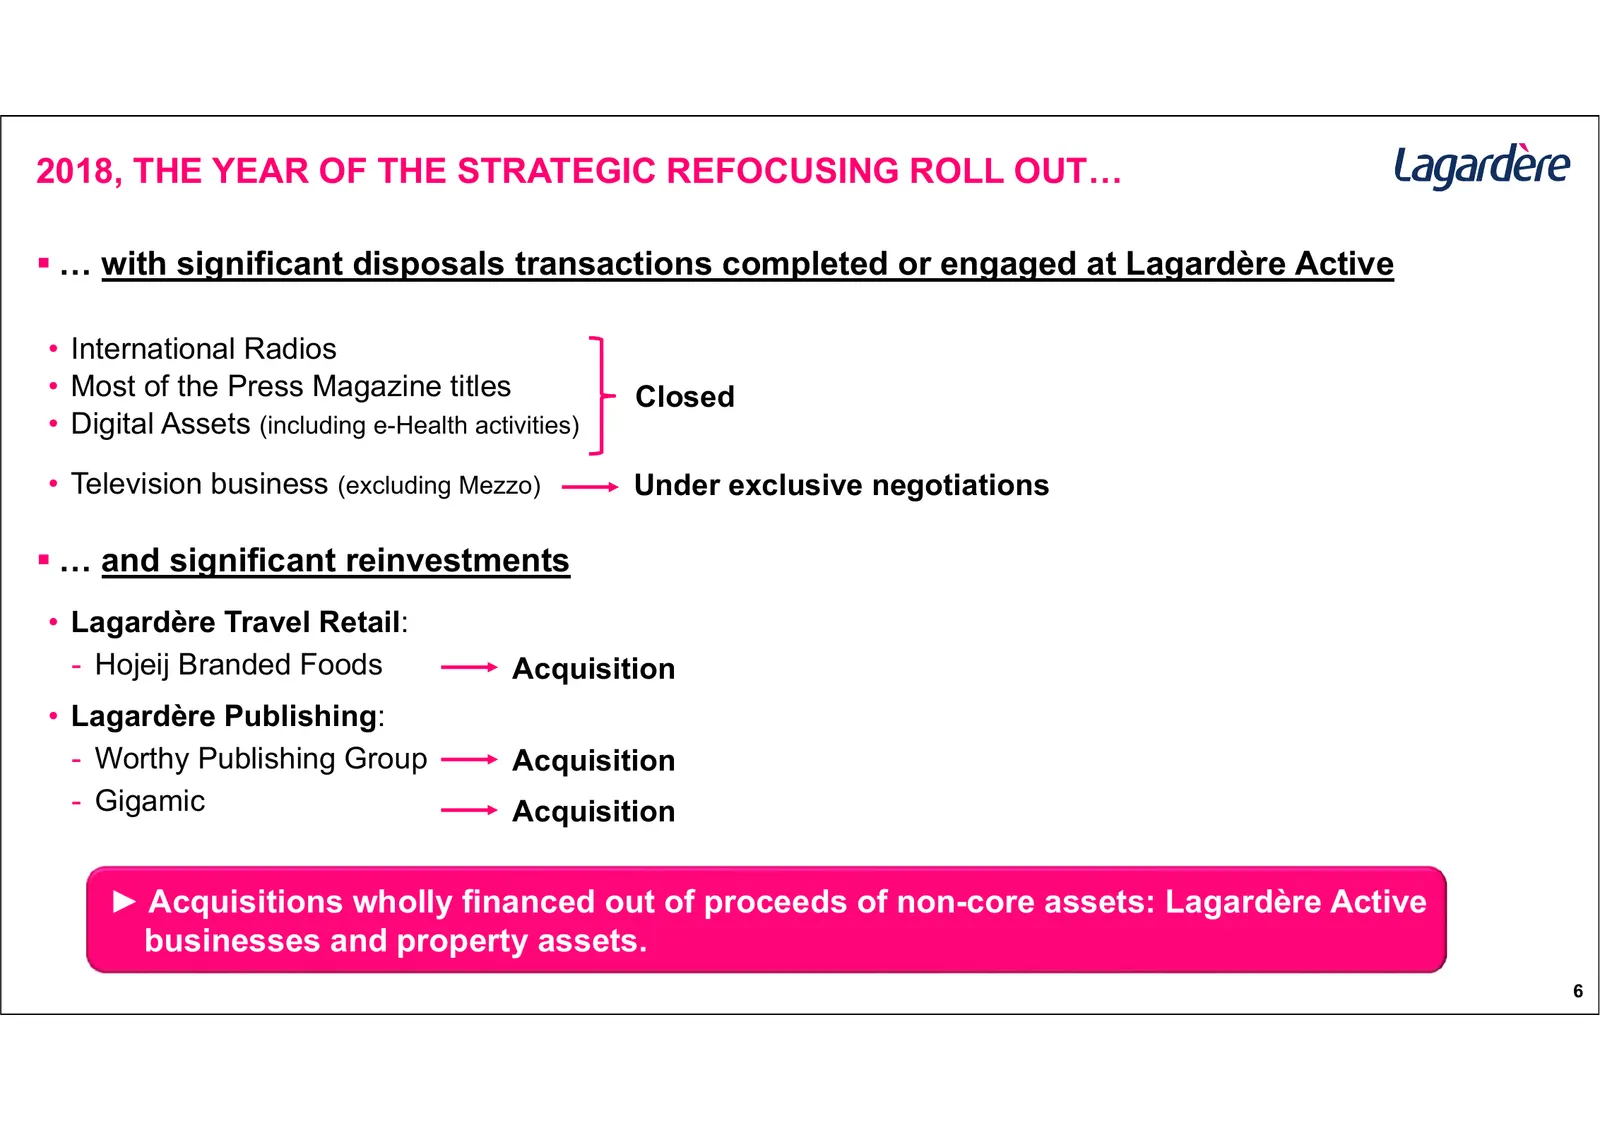
2018, THE YEAR OF THE STRATEGIC REFOCUSING ROLL OUT… … with significant disposals transactions completed or engaged at Lagardère Active • International Radios • Most of the Press Magazine titles Closed • Digital Assets (including e-Health activities) • Television business (excluding Mezzo) Under e
Slide 7: 2019, a transitioning year to follow up on strategic refocusing
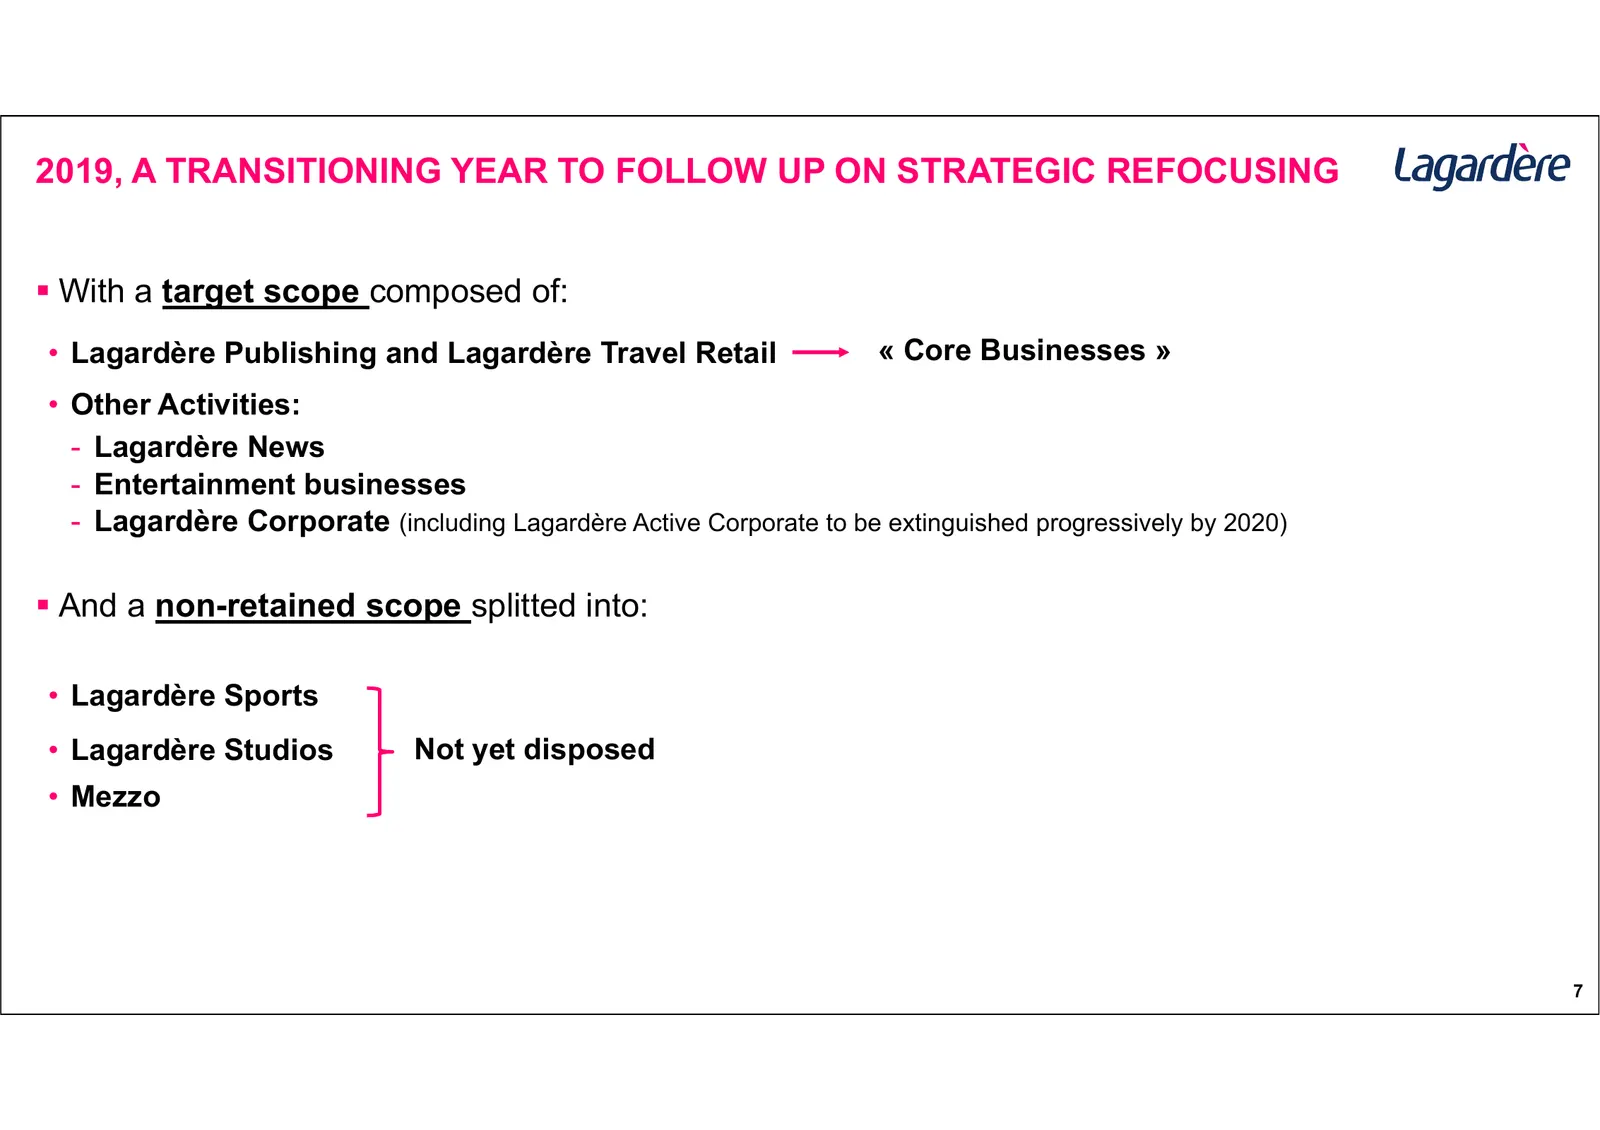
2019, A TRANSITIONING YEAR TO FOLLOW UP ON STRATEGIC REFOCUSING With a target scope composed of: • Lagardère Publishing and Lagardère Travel Retail « Core Businesses » • Other Activities: - Lagardère News - Entertainment businesses - Lagardère Corporate (including Lagardère Active Corporate to be
Slide 8: Successful reinvestments in core businesses to create value
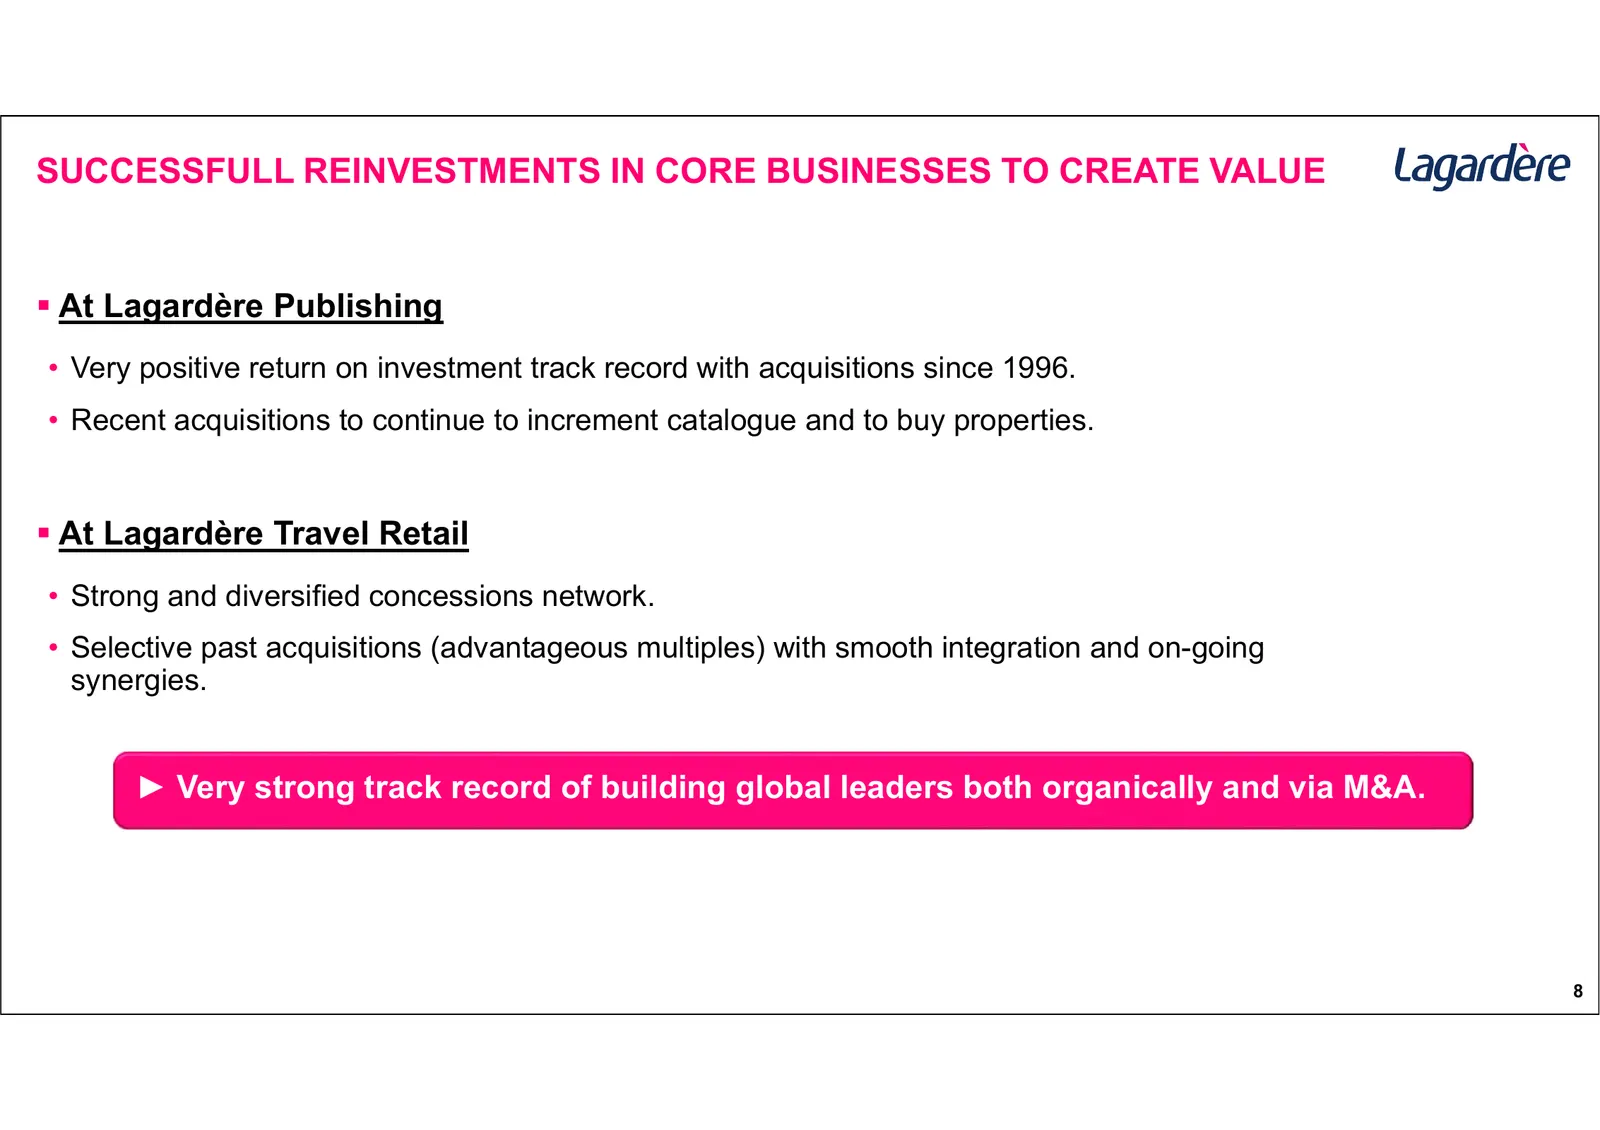
SUCCESSFULL REINVESTMENTS IN CORE BUSINESSES TO CREATE VALUE At Lagardère Publishing • Very positive return on investment track record with acquisitions since 1996. • Recent acquisitions to continue to increment catalogue and to buy properties. At Lagardère Travel Retail • Strong and diversified

Slide 9: Group Profile
Lagardere GROUP PROFILE MICHAEL J GONNELEY
Slide 10: A diversified group with leading brands and market positions
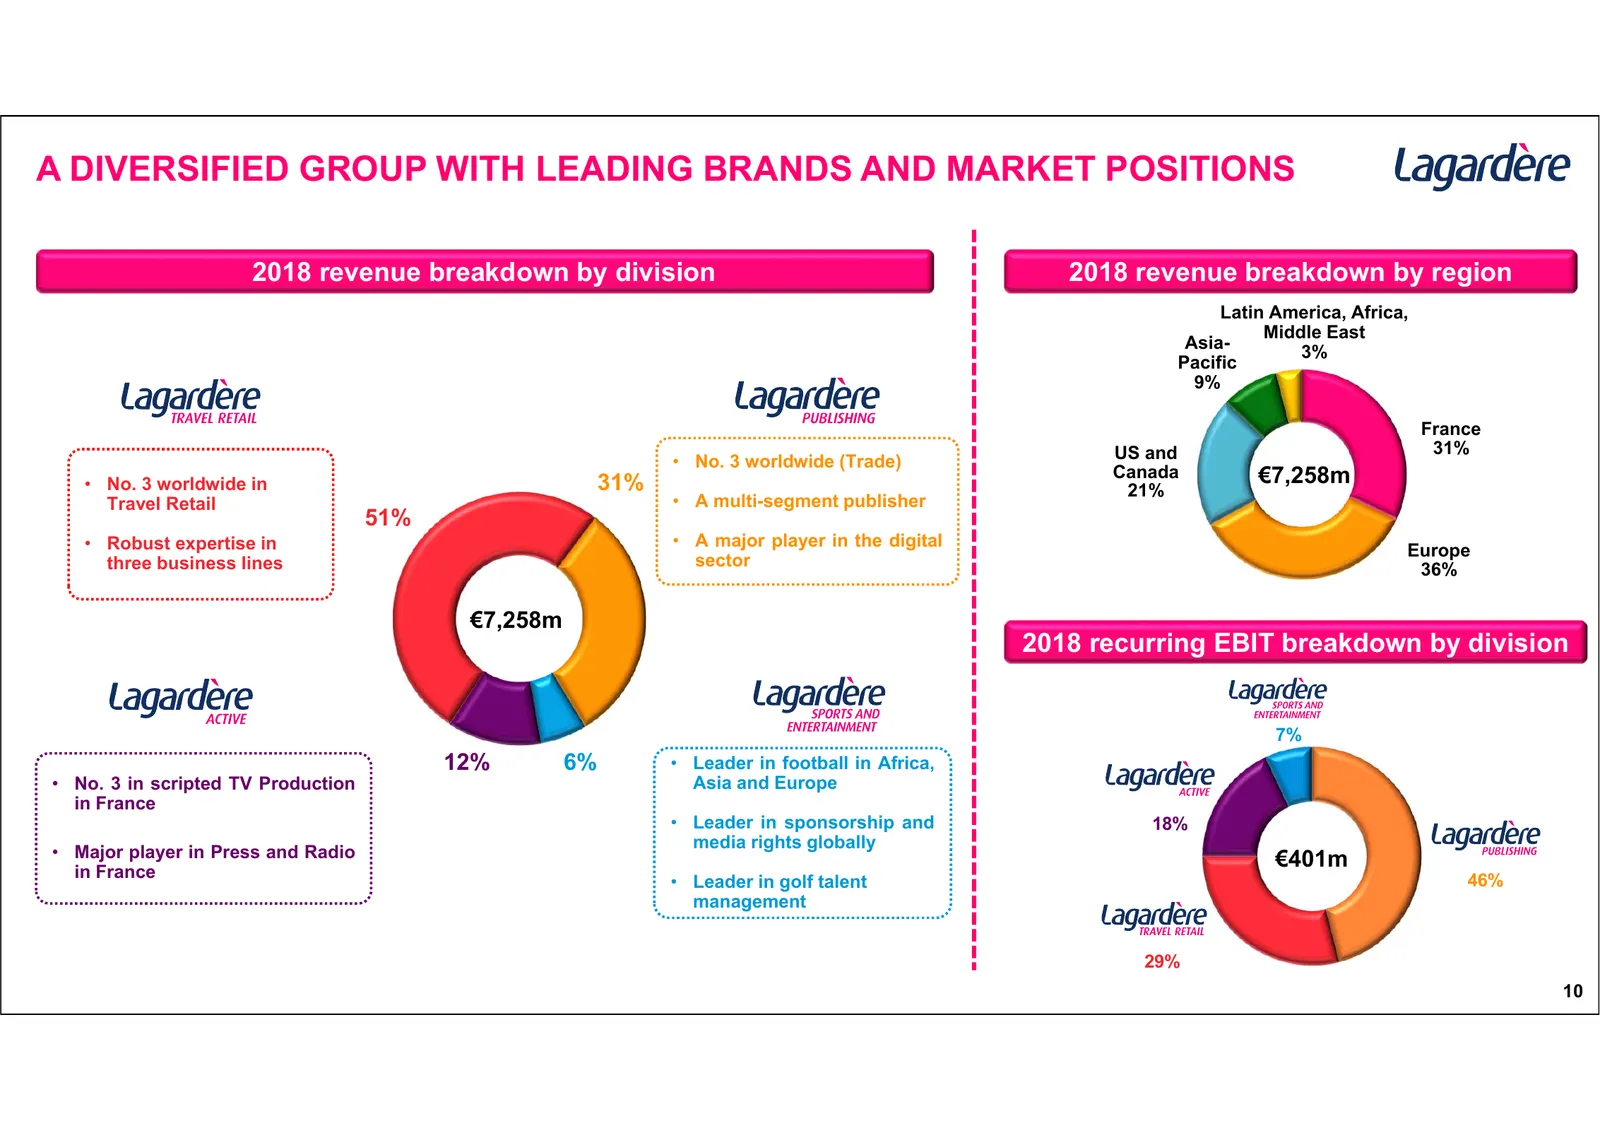
A DIVERSIFIED GROUP WITH LEADING BRANDS AND MARKET POSITIONS 2018 revenue breakdown by division 2018 revenue breakdown by region Latin America, Africa, Middle East Asia- 3% Pacific 9% France US and 31% • No. 3 worldwide (Trade) Canada €7,258m • No. 3 worldwide in 31% 21% Travel Retail • A multi-segm
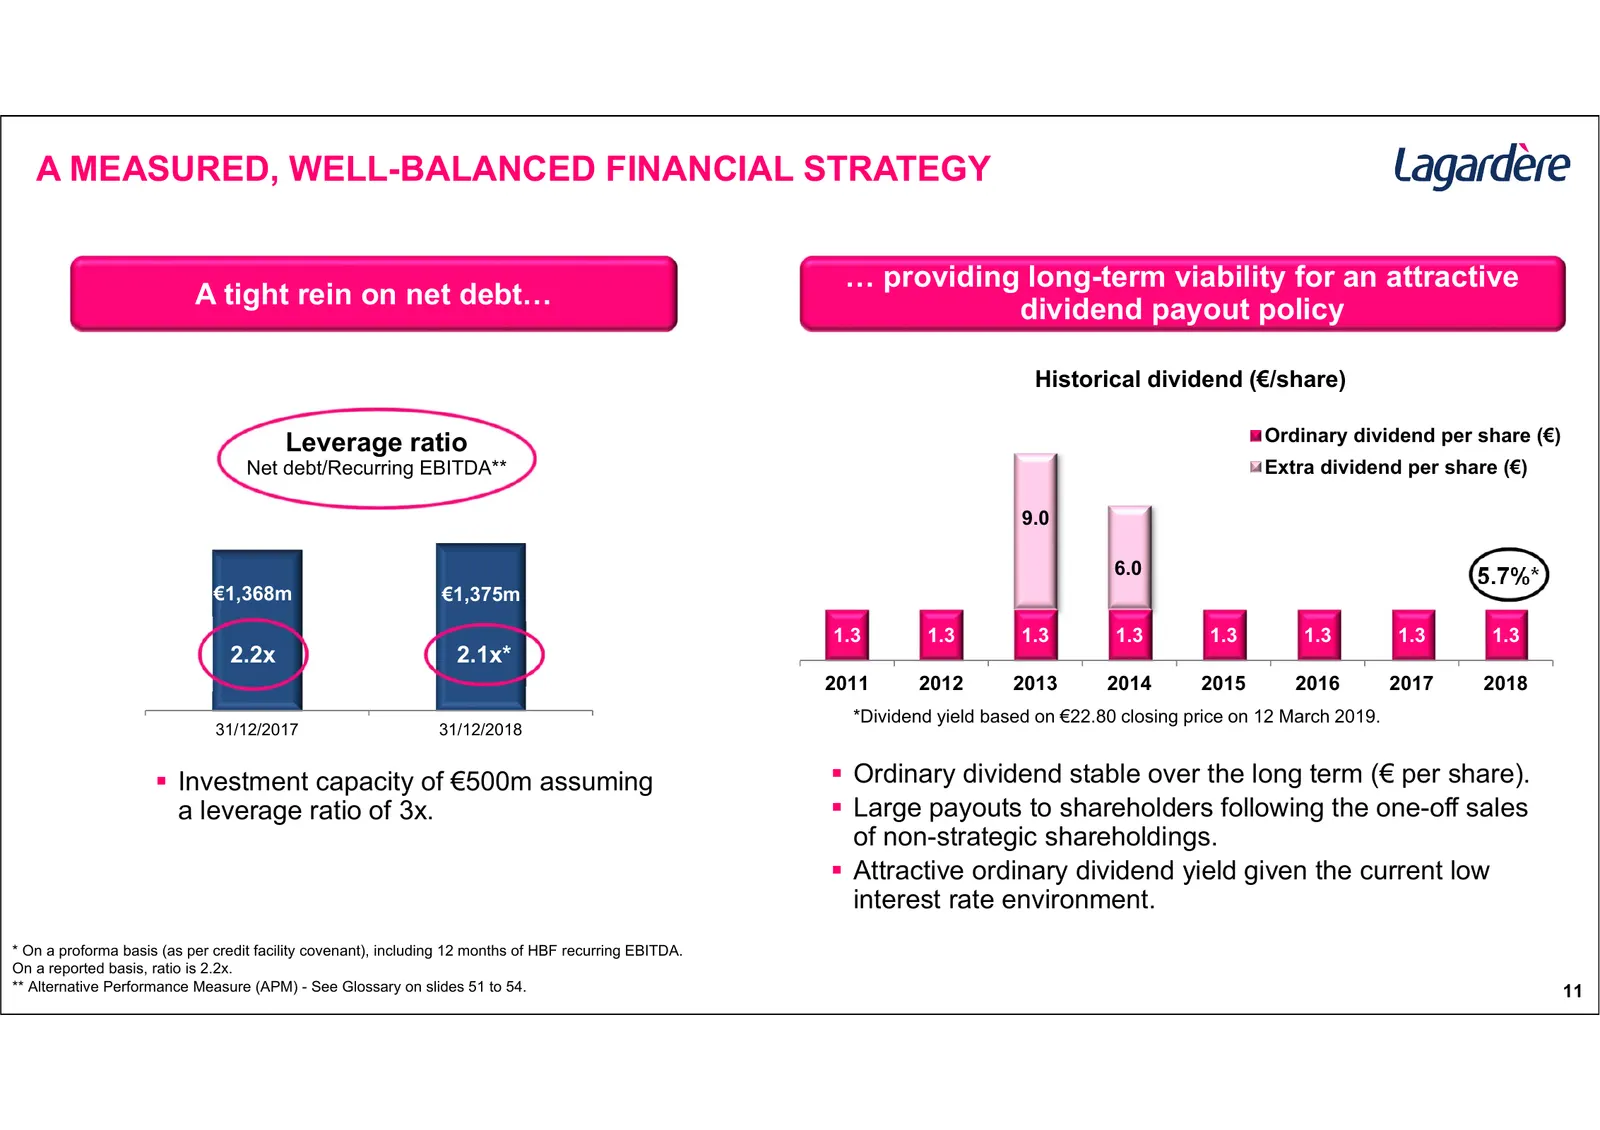
Slide 11: A measured, well-balanced financial strategy
A MEASURED, WELL-BALANCED FINANCIAL STRATEGY … providing long-term viability for an attractive A tight rein on net debt… dividend payout policy Historical dividend (€/share) Leverage ratio Ordinary dividend per share (€) Net debt/Recurring EBITDA** Extra dividend per share (€) 9.0 6.0 5.7%* €1,368m

Slide 12: Lagardère Publishing
Guillaume Lagardere PUBLISHING
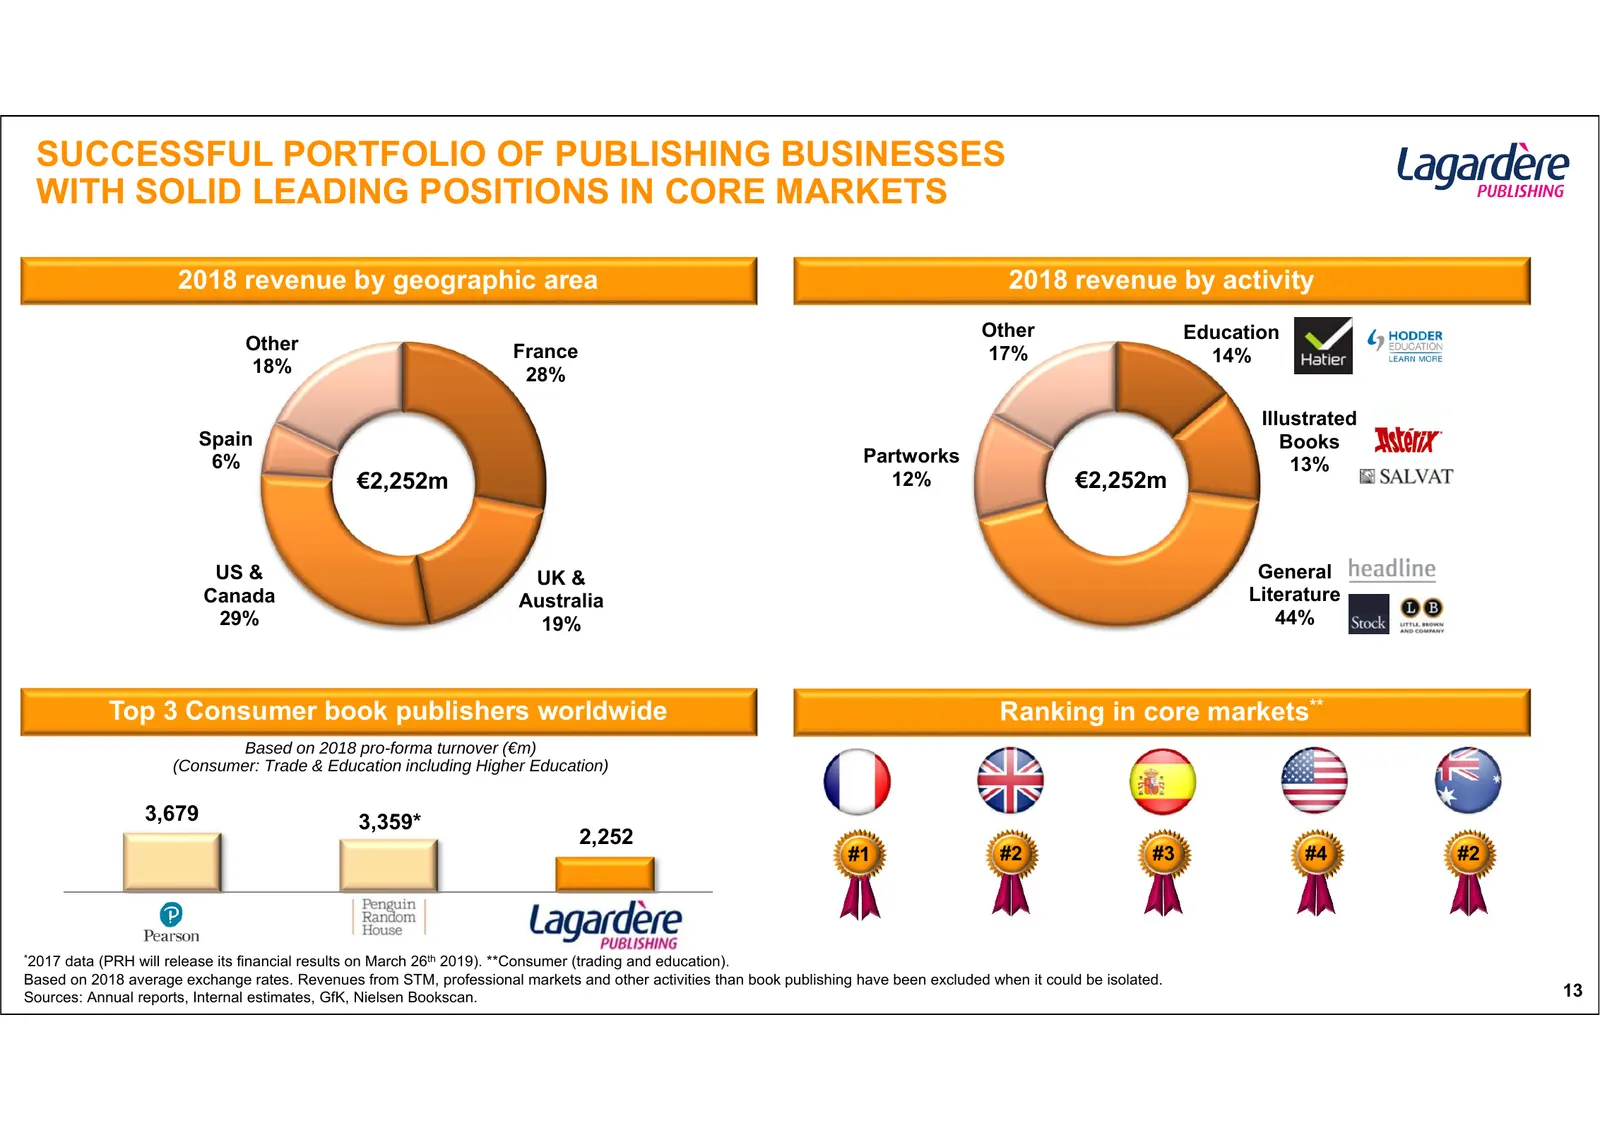
Slide 13: Successful portfolio of publishing businesses with solid leading positions
SUCCESSFUL PORTFOLIO OF PUBLISHING BUSINESSES WITH SOLID LEADING POSITIONS IN CORE MARKETS 2018 revenue by geographic area 2018 revenue by activity Other Education Other France 17% 14% 18% 28% Illustrated Spain Books 6% Partworks 13% €2,252m 12% €2,252m US & UK & General Canada Australia Literature
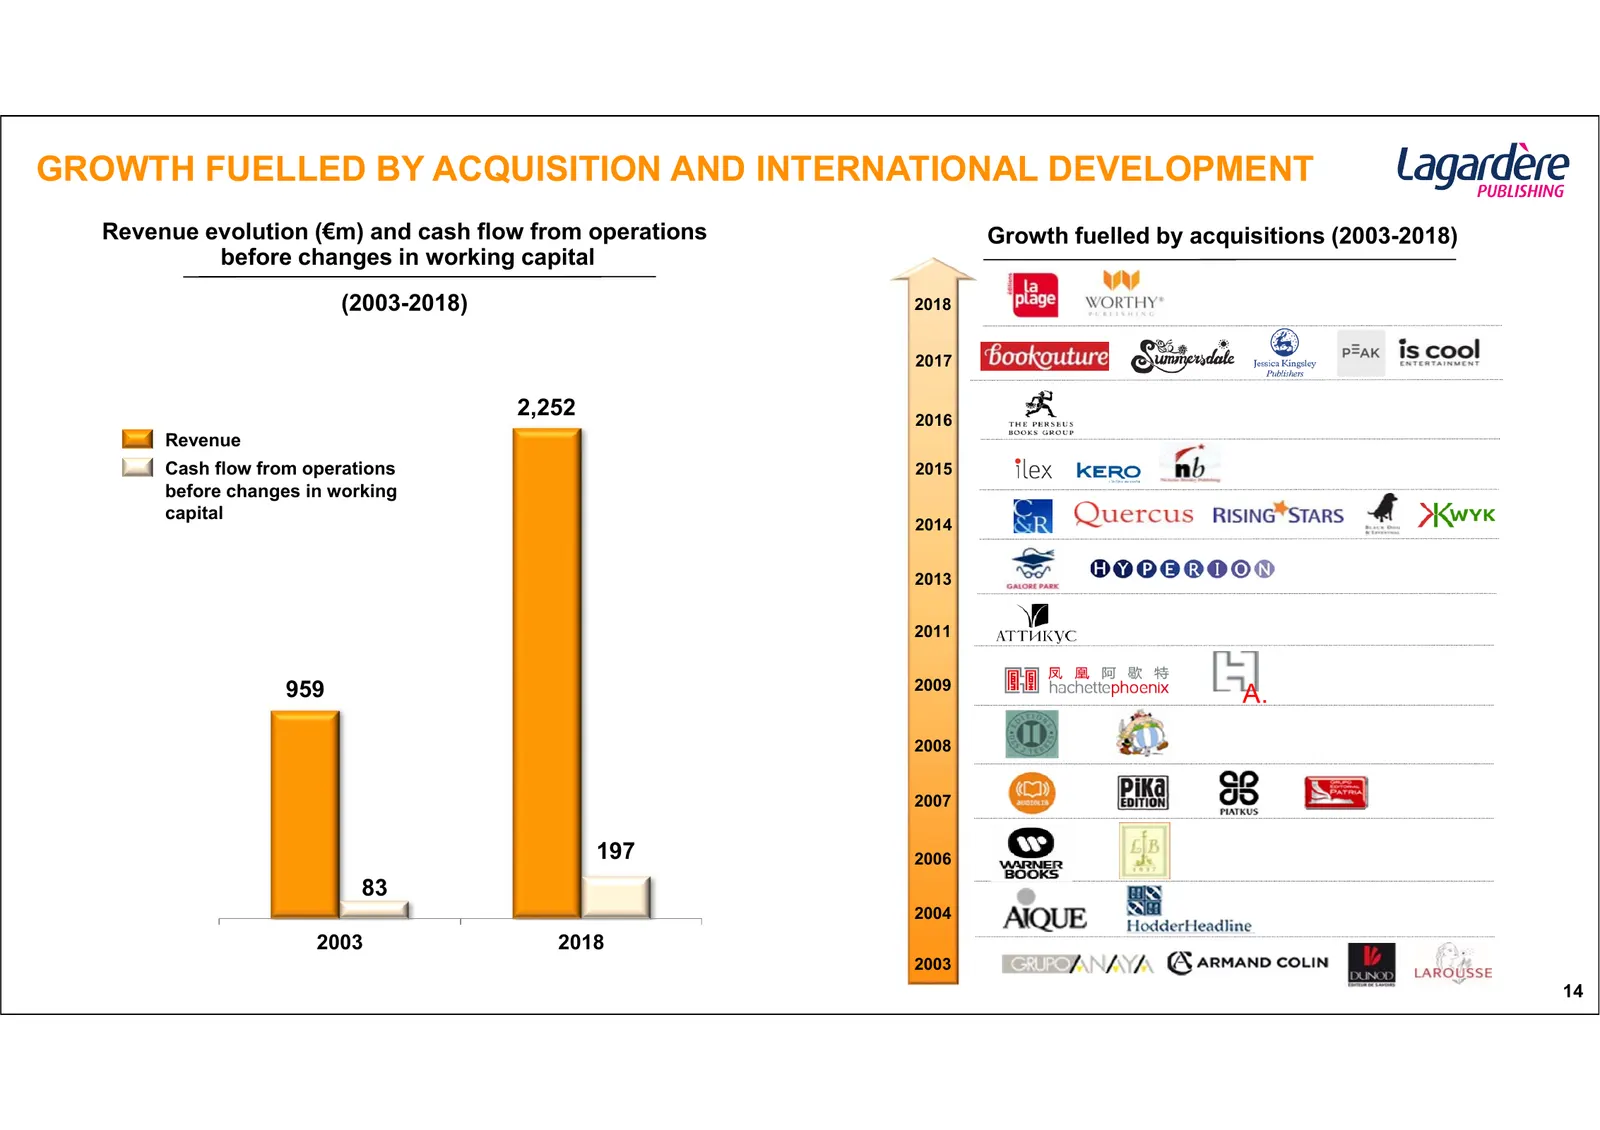
Slide 14: Growth fuelled by acquisition and international development
GROWTH FUELLED BY ACQUISITION AND INTERNATIONAL DEVELOPMENT Revenue evolution (€m) and cash flow from operations Growth fuelled by acquisitions (2003-2018) before changes in working capital (2003-2018) 2018 2017 2,252 2016 Revenue Cash flow from operations 2015 before changes in working capital 2014
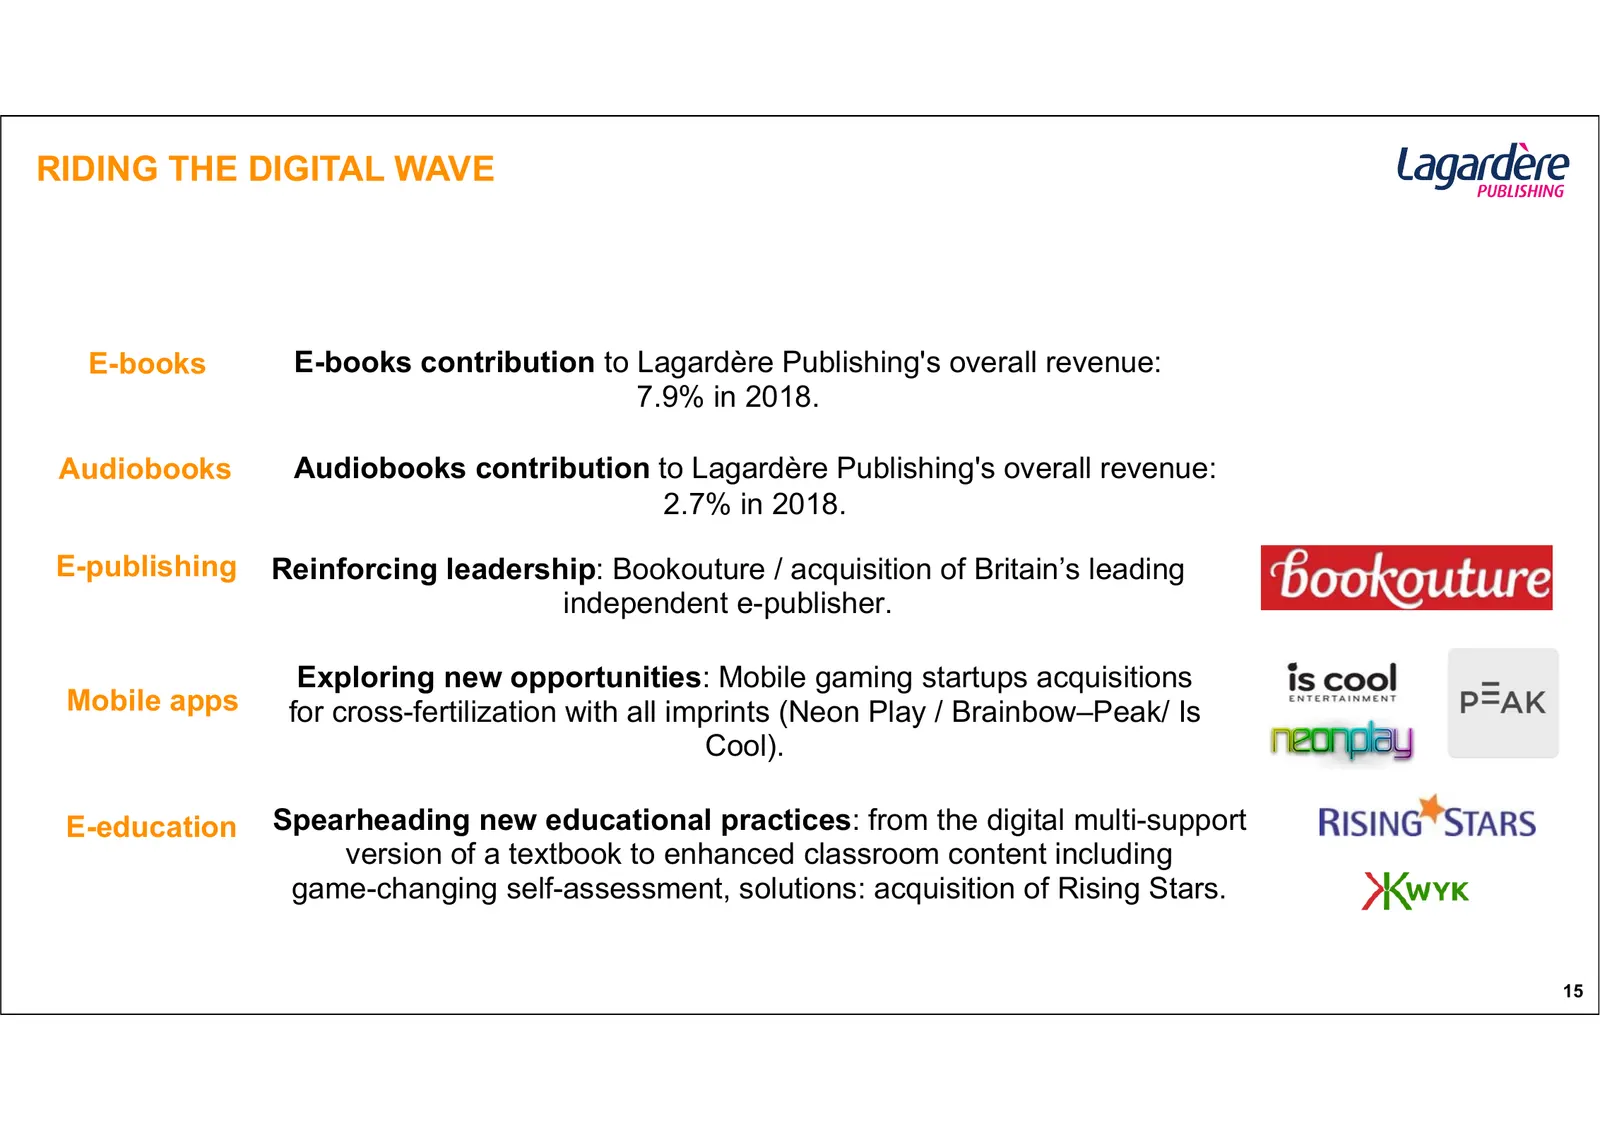
Slide 15: Riding the digital wave
RIDING THE DIGITAL WAVE E-books E-books contribution to Lagardère Publishing's overall revenue: 7.9% in 2018. Audiobooks Audiobooks contribution to Lagardère Publishing's overall revenue: 2.7% in 2018. E-publishing Reinforcing leadership: Bookouture / acquisition of Britain’s leading independent e-p
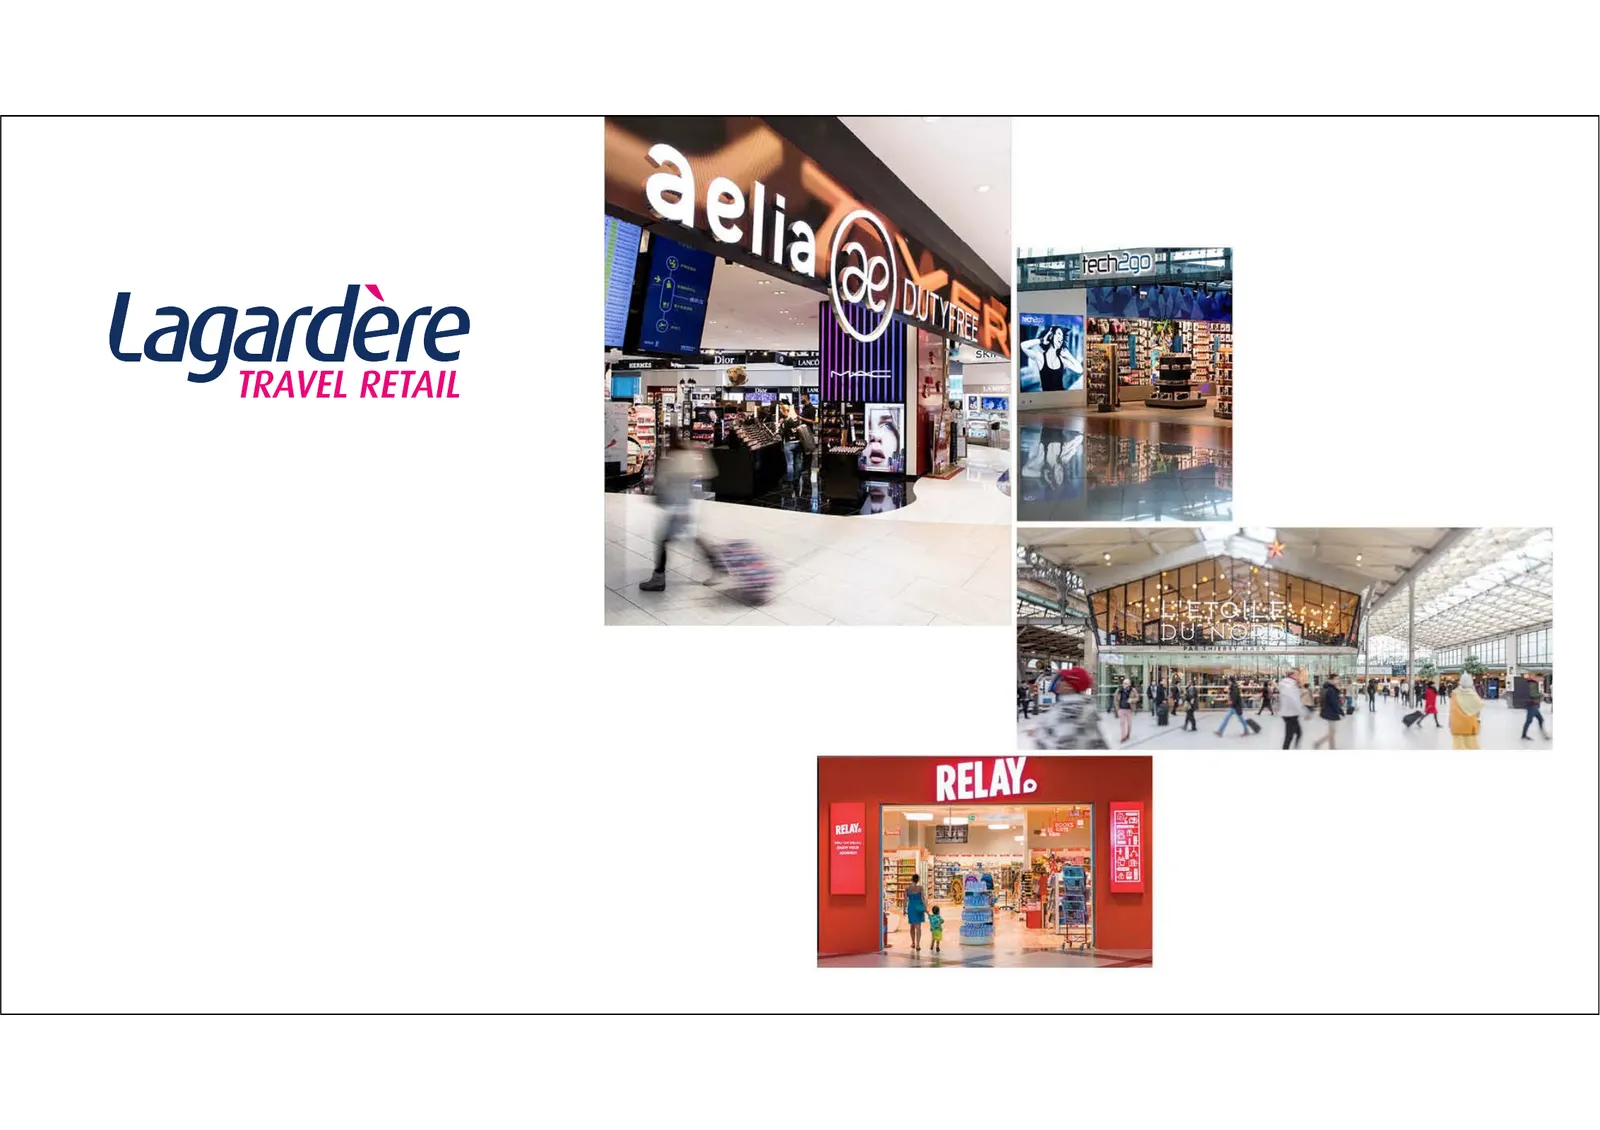
Slide 16: Lagardère Travel Retail
Lagardere TRAVEL RETAIL
Slide 17: High growth business with leading positions in its segments
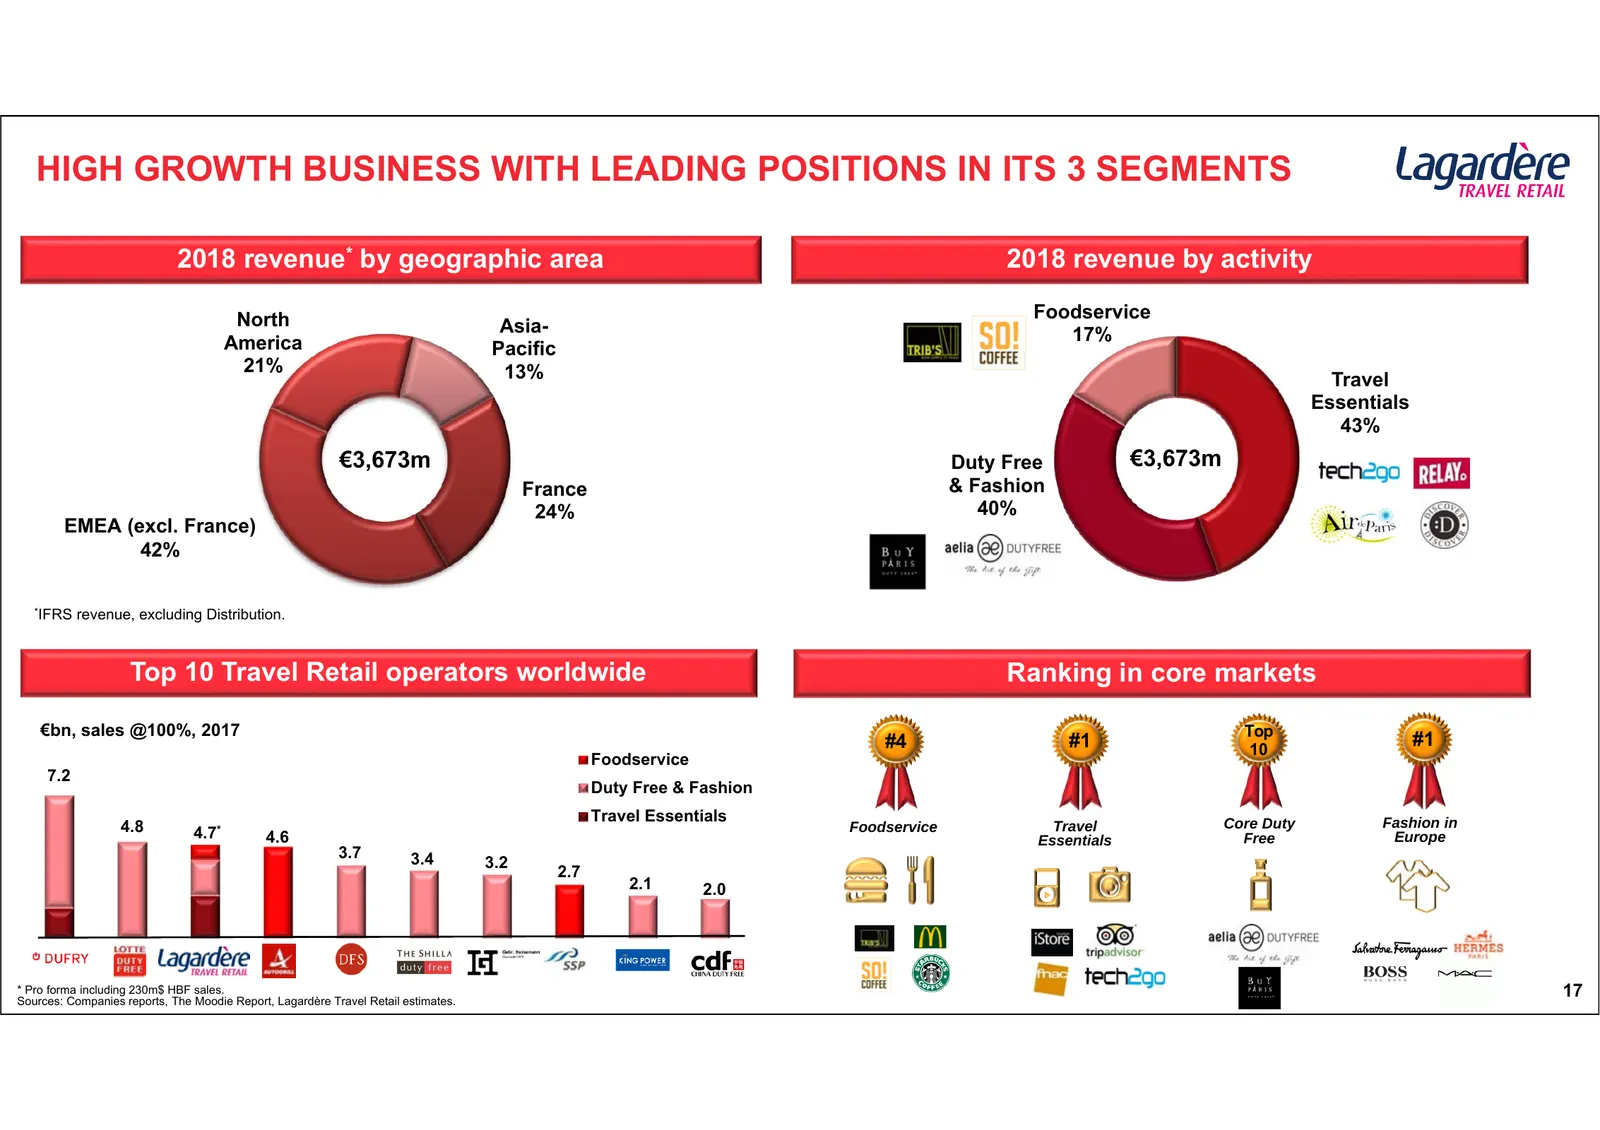
HIGH GROWTH BUSINESS WITH LEADING POSITIONS IN ITS 3 SEGMENTS 2018 revenue* by geographic area 2018 revenue by activity North Foodservice Asia- 17% America Pacific 21% 13% Travel Essentials 43% €3,673m Duty Free €3,673m France & Fashion 24% 40% EMEA (excl. France) 42% *IFRS revenue, excluding Distri
Slide 18: Diversified growth paths
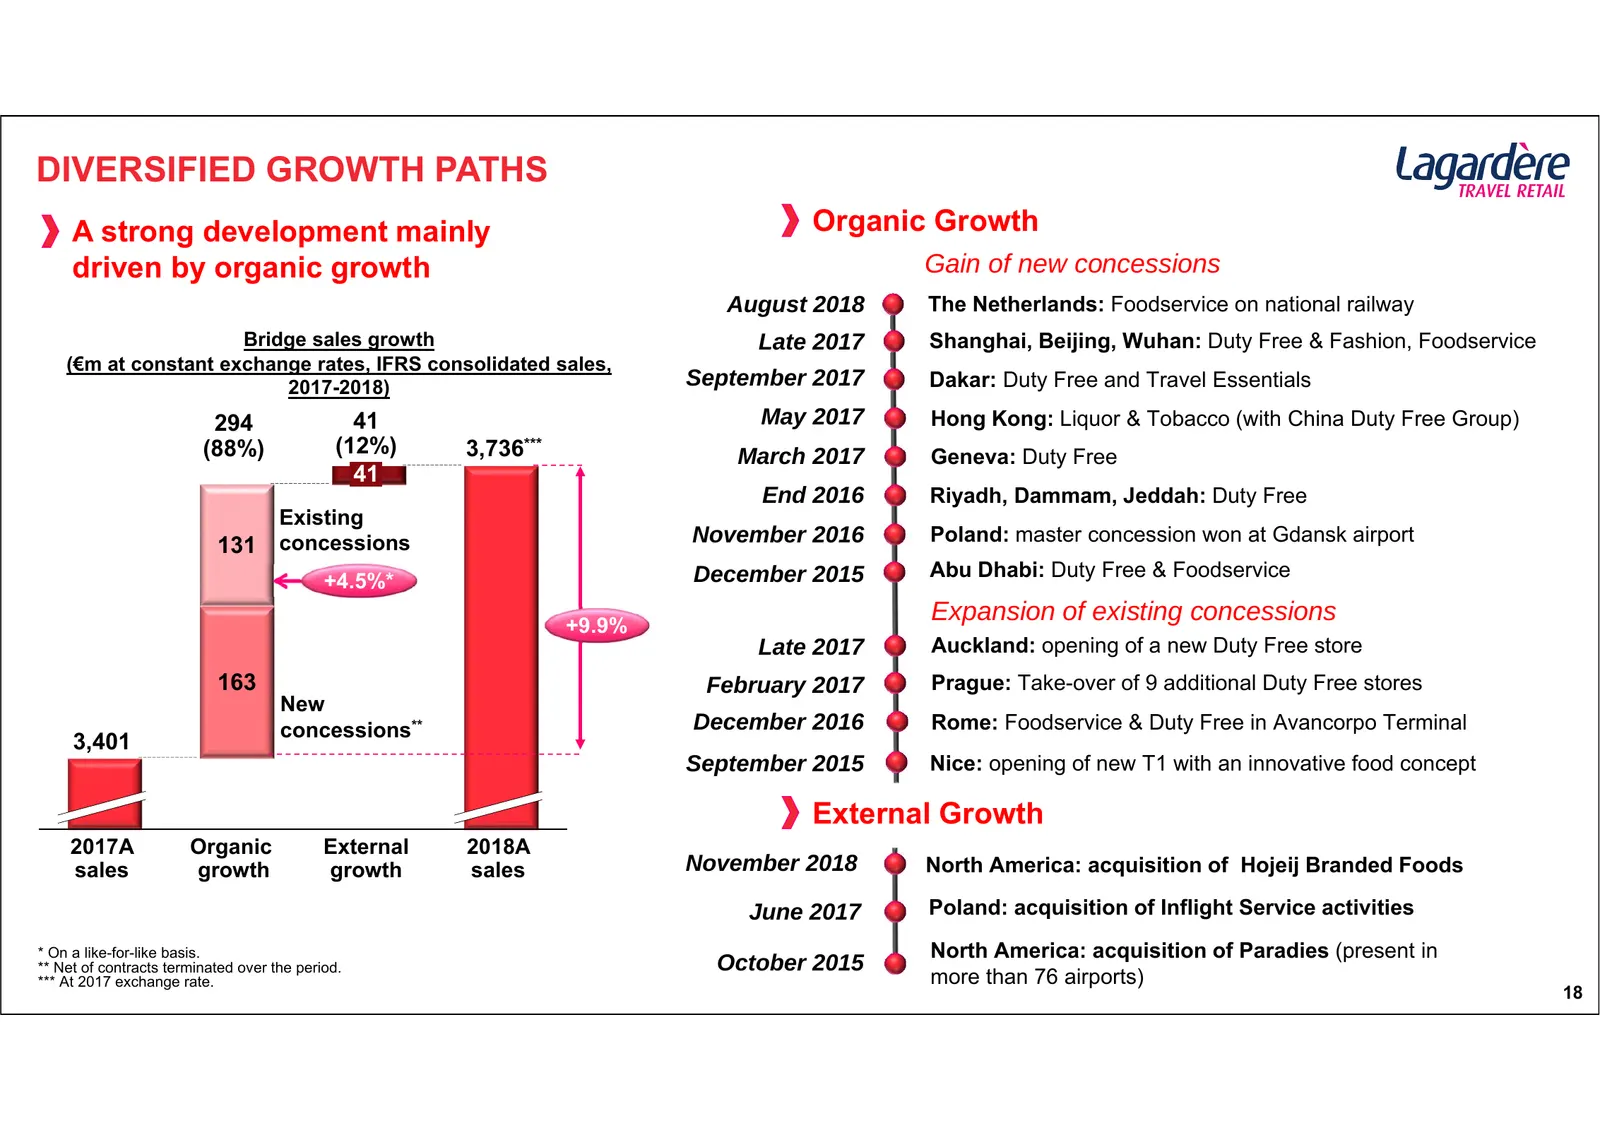
DIVERSIFIED GROWTH PATHS A strong development mainly Organic Growth driven by organic growth Gain of new concessions August 2018 The Netherlands: Foodservice on national railway Bridge sales growth Late 2017 Shanghai, Beijing, Wuhan: Duty Free & Fashion, Foodservice (€m at constant exchange rates, I
Slide 19: Improvement of cash generation backed by a resilient business model
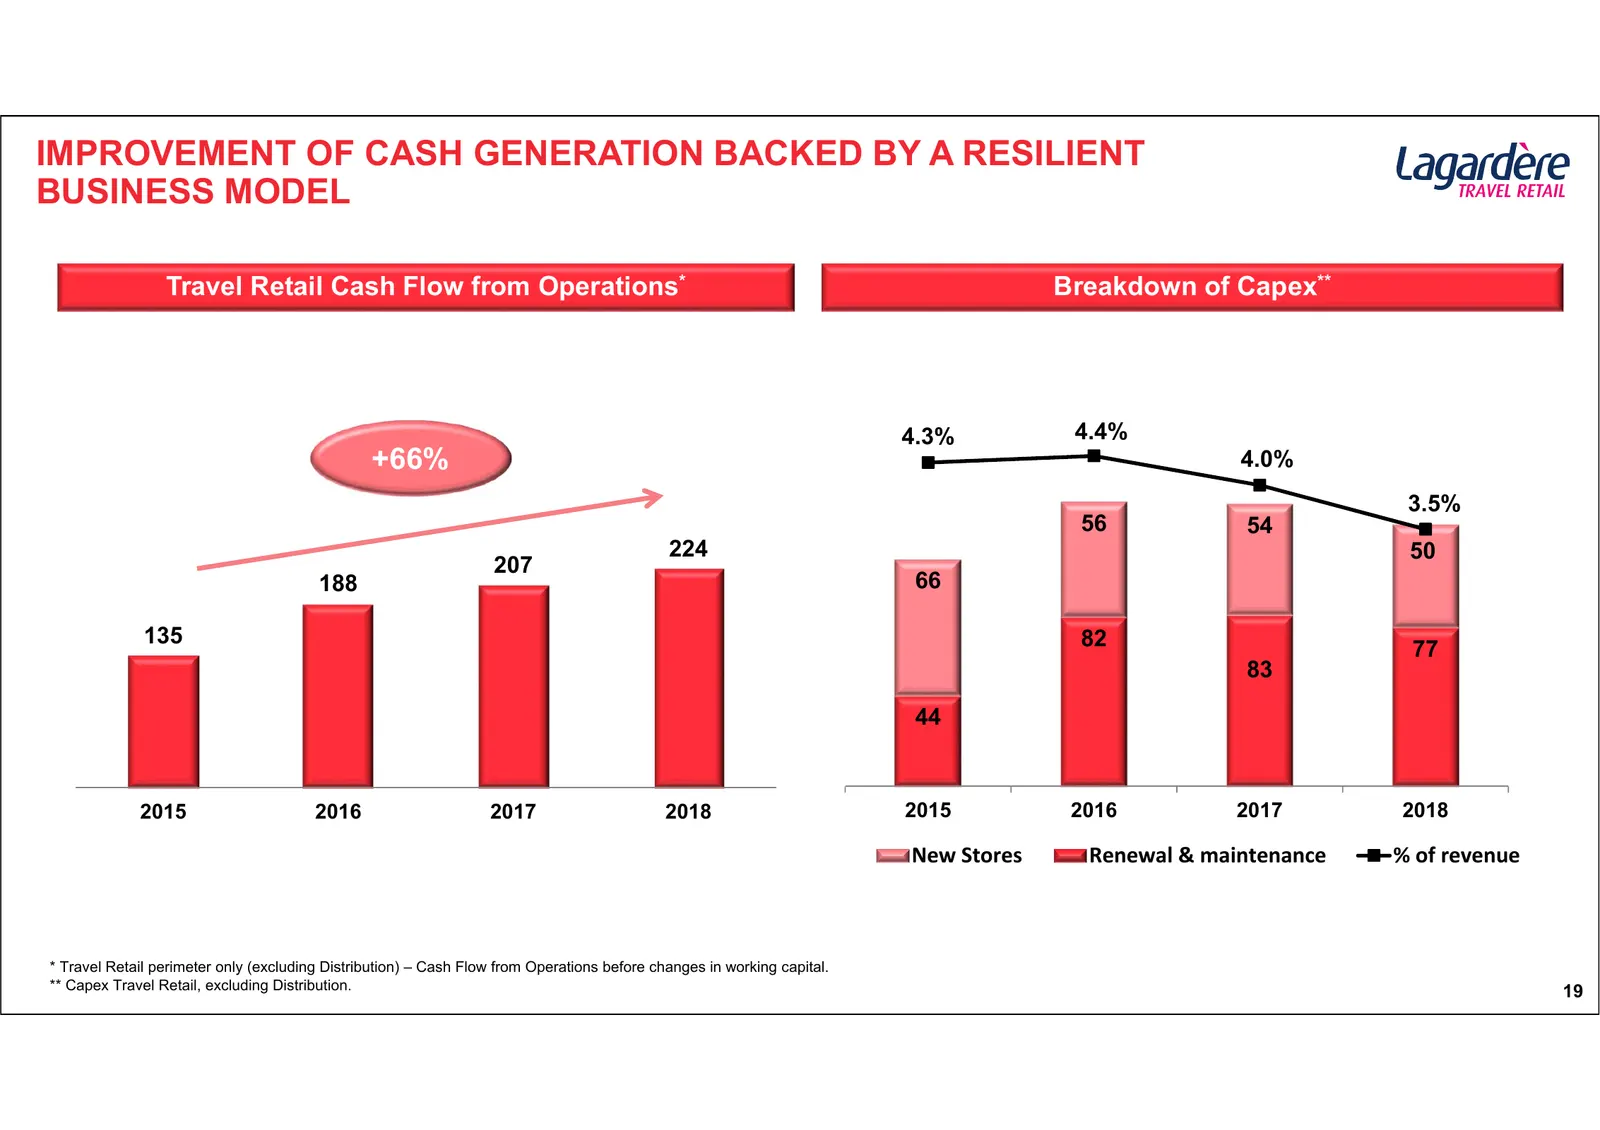
IMPROVEMENT OF CASH GENERATION BACKED BY A RESILIENT BUSINESS MODEL Travel Retail Cash Flow from Operations* Breakdown of Capex** 175 4.3% 4.4% +66% 155 4.0% 4,0% 135 3.5% 56 54 224 115 50 207 3,0% 188 95 66 135 75 82 2,0% 77 55 83 35 44 1,0% 15 ‐5 0,0% 2015 2016 2017 2018 2015 2016 2017 2018 New St
Slide 20: Lagardère Active
Lagardere ACTIVE
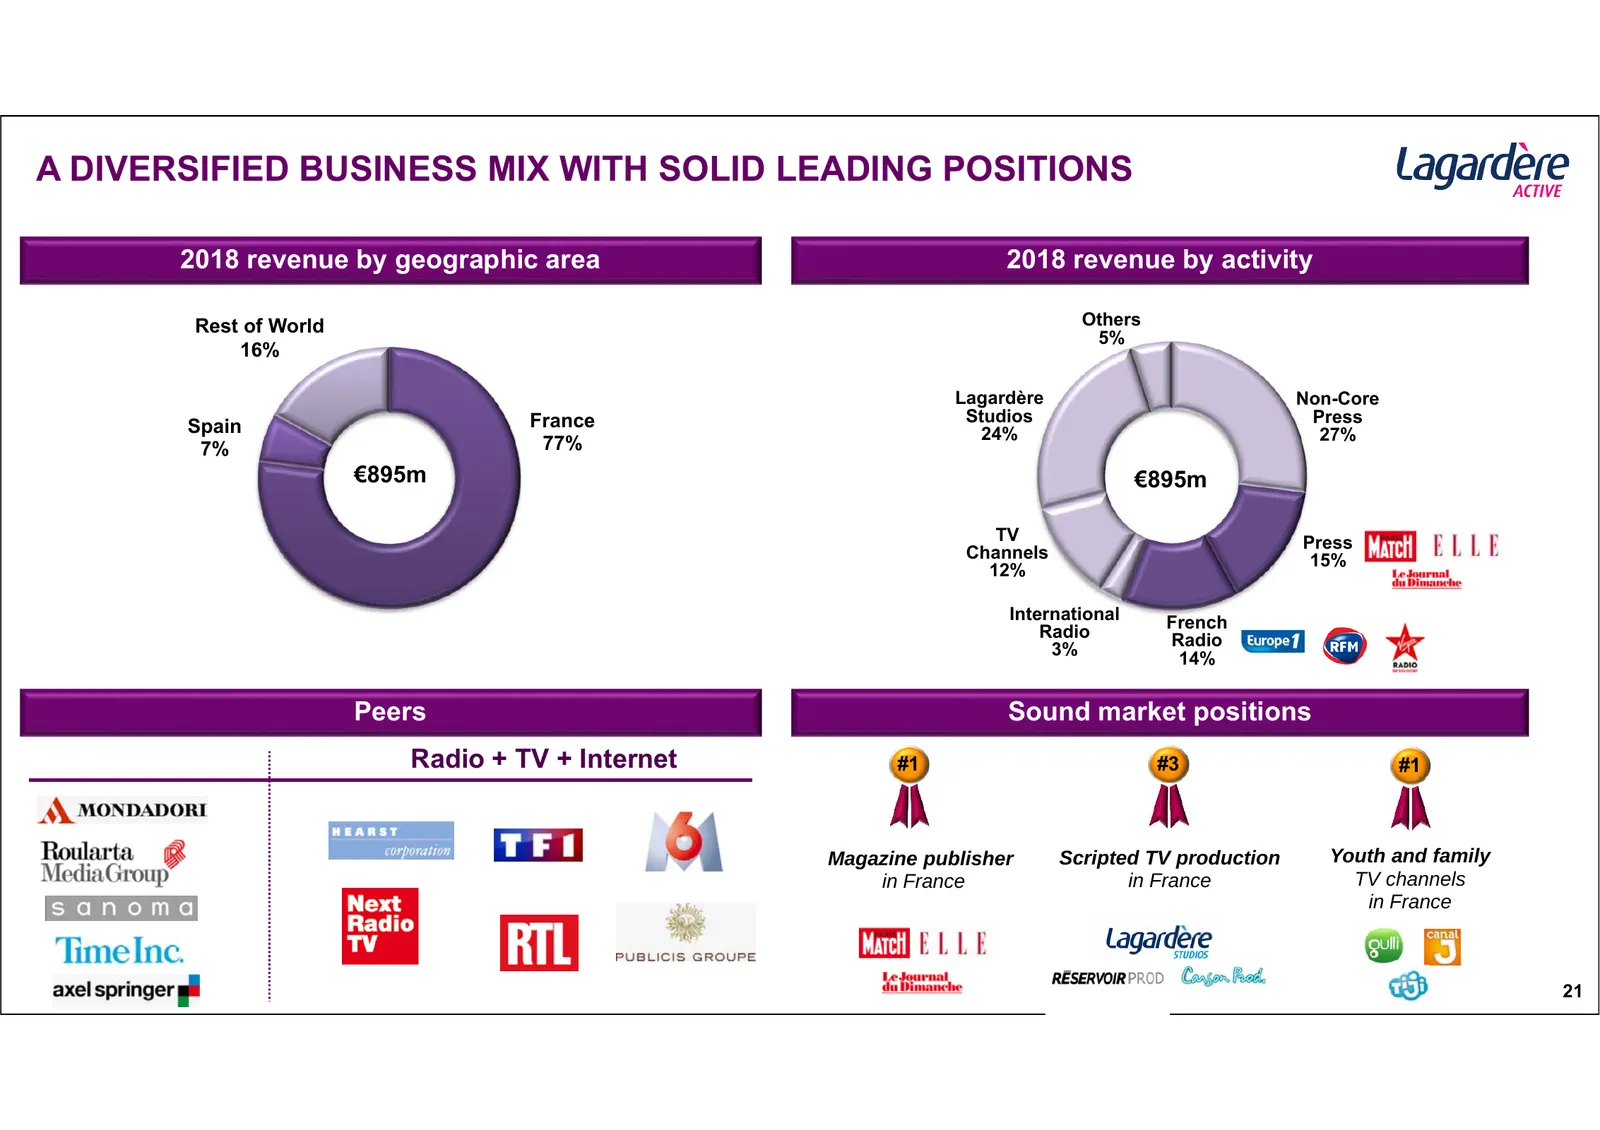
Slide 21: A diversified business mix with solid leading positions
A DIVERSIFIED BUSINESS MIX WITH SOLID LEADING POSITIONS 2018 revenue by geographic area 2018 revenue by activity Rest of World Others 5% 16% Lagardère Non-Core France Studios Press Spain 24% 27% 7% 77% €895m €895m TV Press Channels 15% 12% International French Radio Radio 3% 14% Peers Sound market p
Slide 22: Sports and Entertainment
Lagardere SPORTS AND ENTERTAINMENT
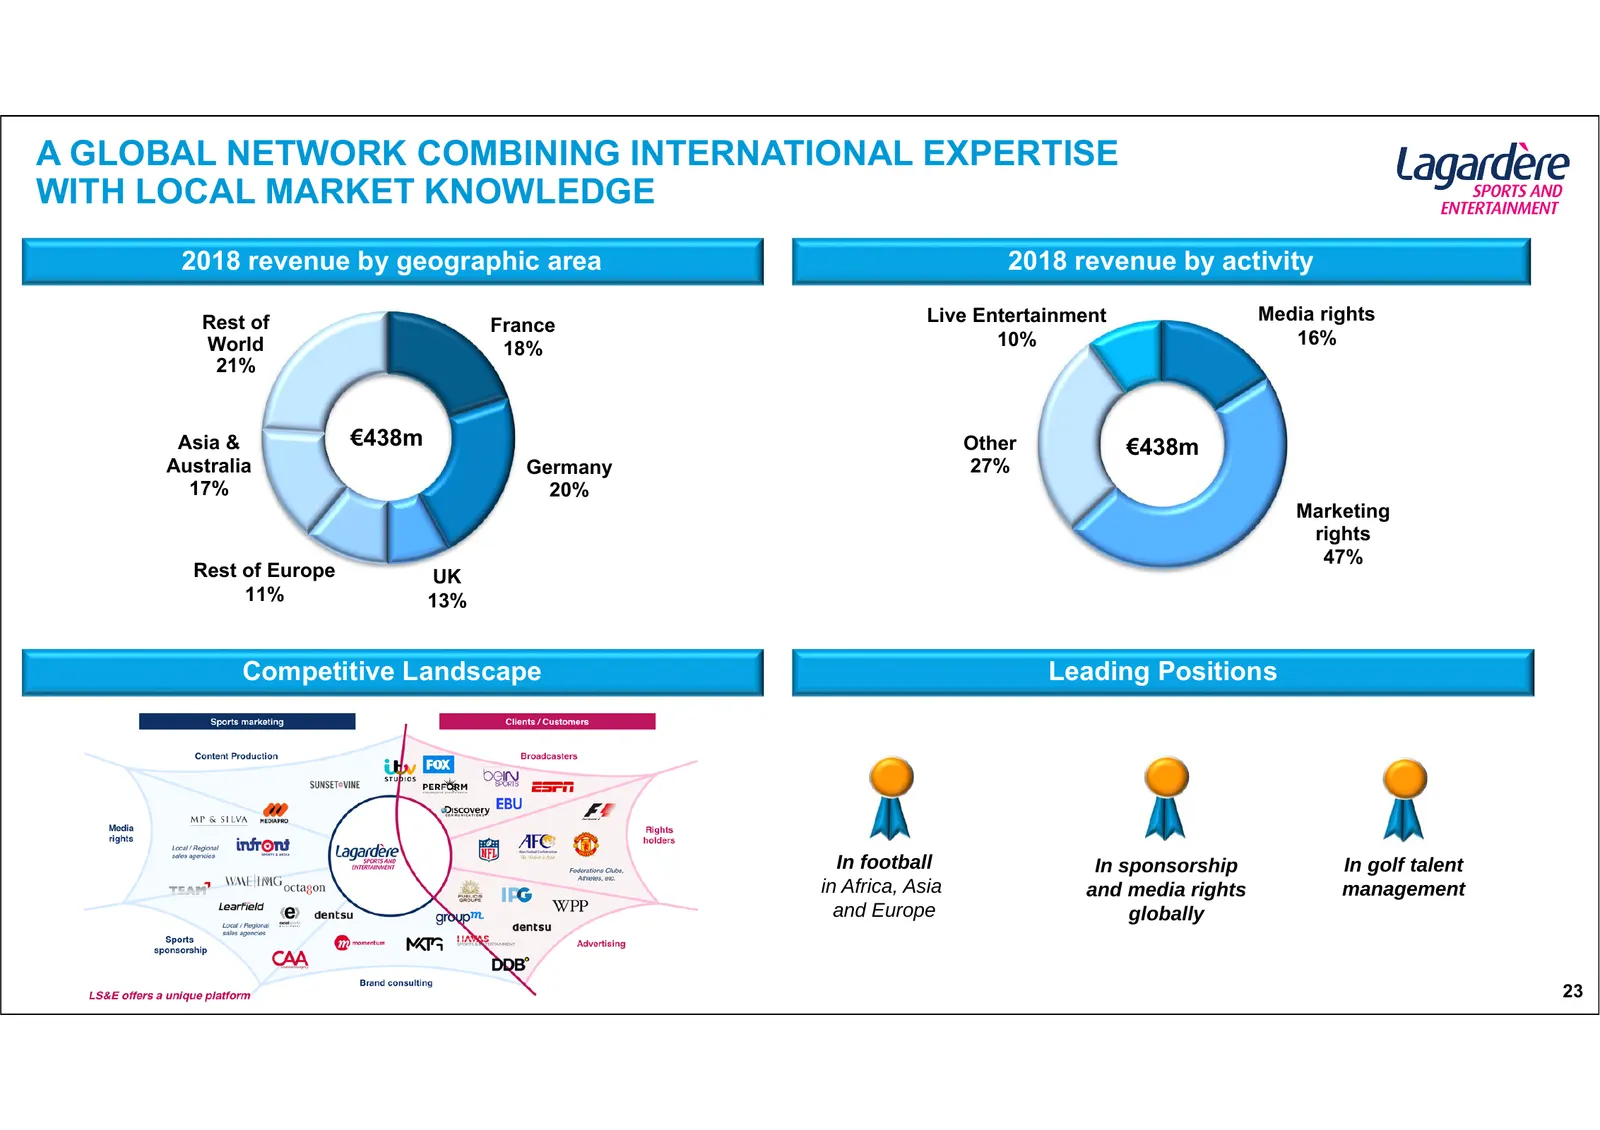
Slide 23: A global network combining international expertise with local market knowledge
A GLOBAL NETWORK COMBINING INTERNATIONAL EXPERTISE WITH LOCAL MARKET KNOWLEDGE 2018 revenue by geographic area 2018 revenue by activity Rest of Live Entertainment Media rights France World 10% 16% 18% 21% Asia & €438m Other €438m Australia Germany 27% 17% 20% Marketing rights 47% Rest of Europe UK 1
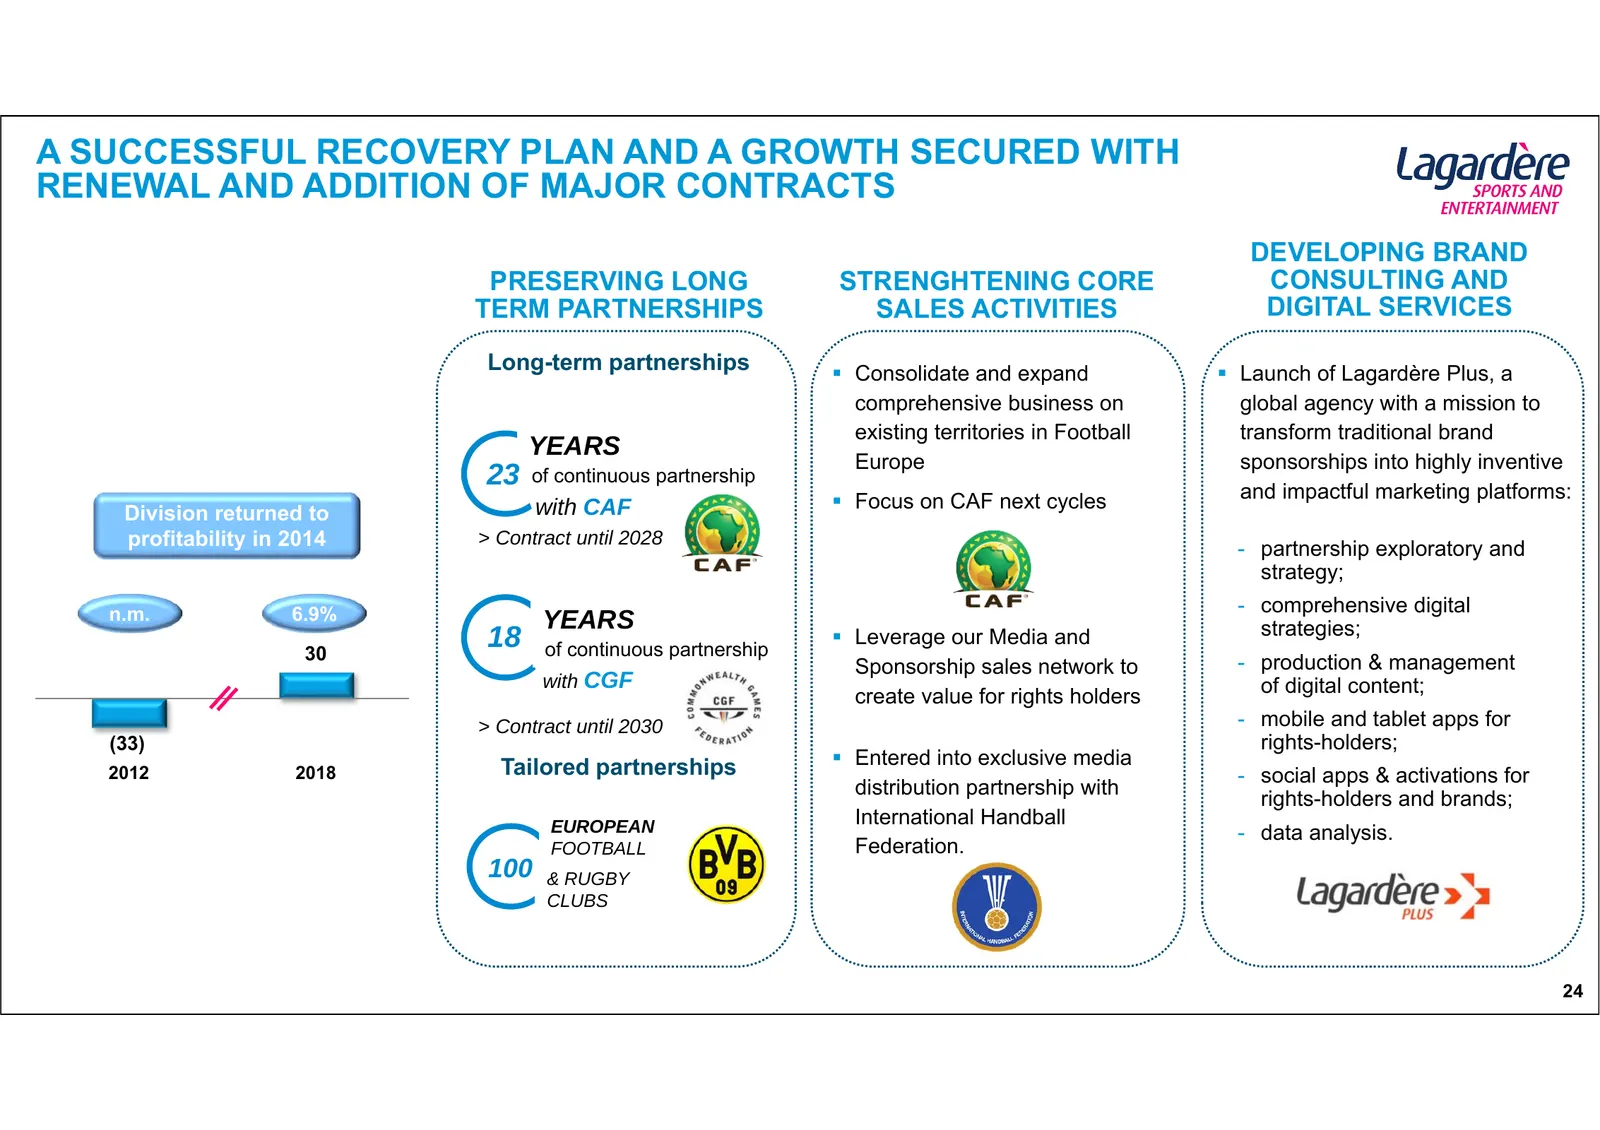
Slide 24: A successful recovery plan and growth secured with renewal of major contracts
A SUCCESSFUL RECOVERY PLAN AND A GROWTH SECURED WITH RENEWAL AND ADDITION OF MAJOR CONTRACTS DEVELOPING BRAND PRESERVING LONG STRENGHTENING CORE CONSULTING AND TERM PARTNERSHIPS SALES ACTIVITIES DIGITAL SERVICES Long-term partnerships Consolidate and expand Launch of Lagardère Plus, a comprehens

Slide 25: Group Performance in 2018
MICHAEL } ; CONNELLY at GROUP PERFORMANCE IN 2018
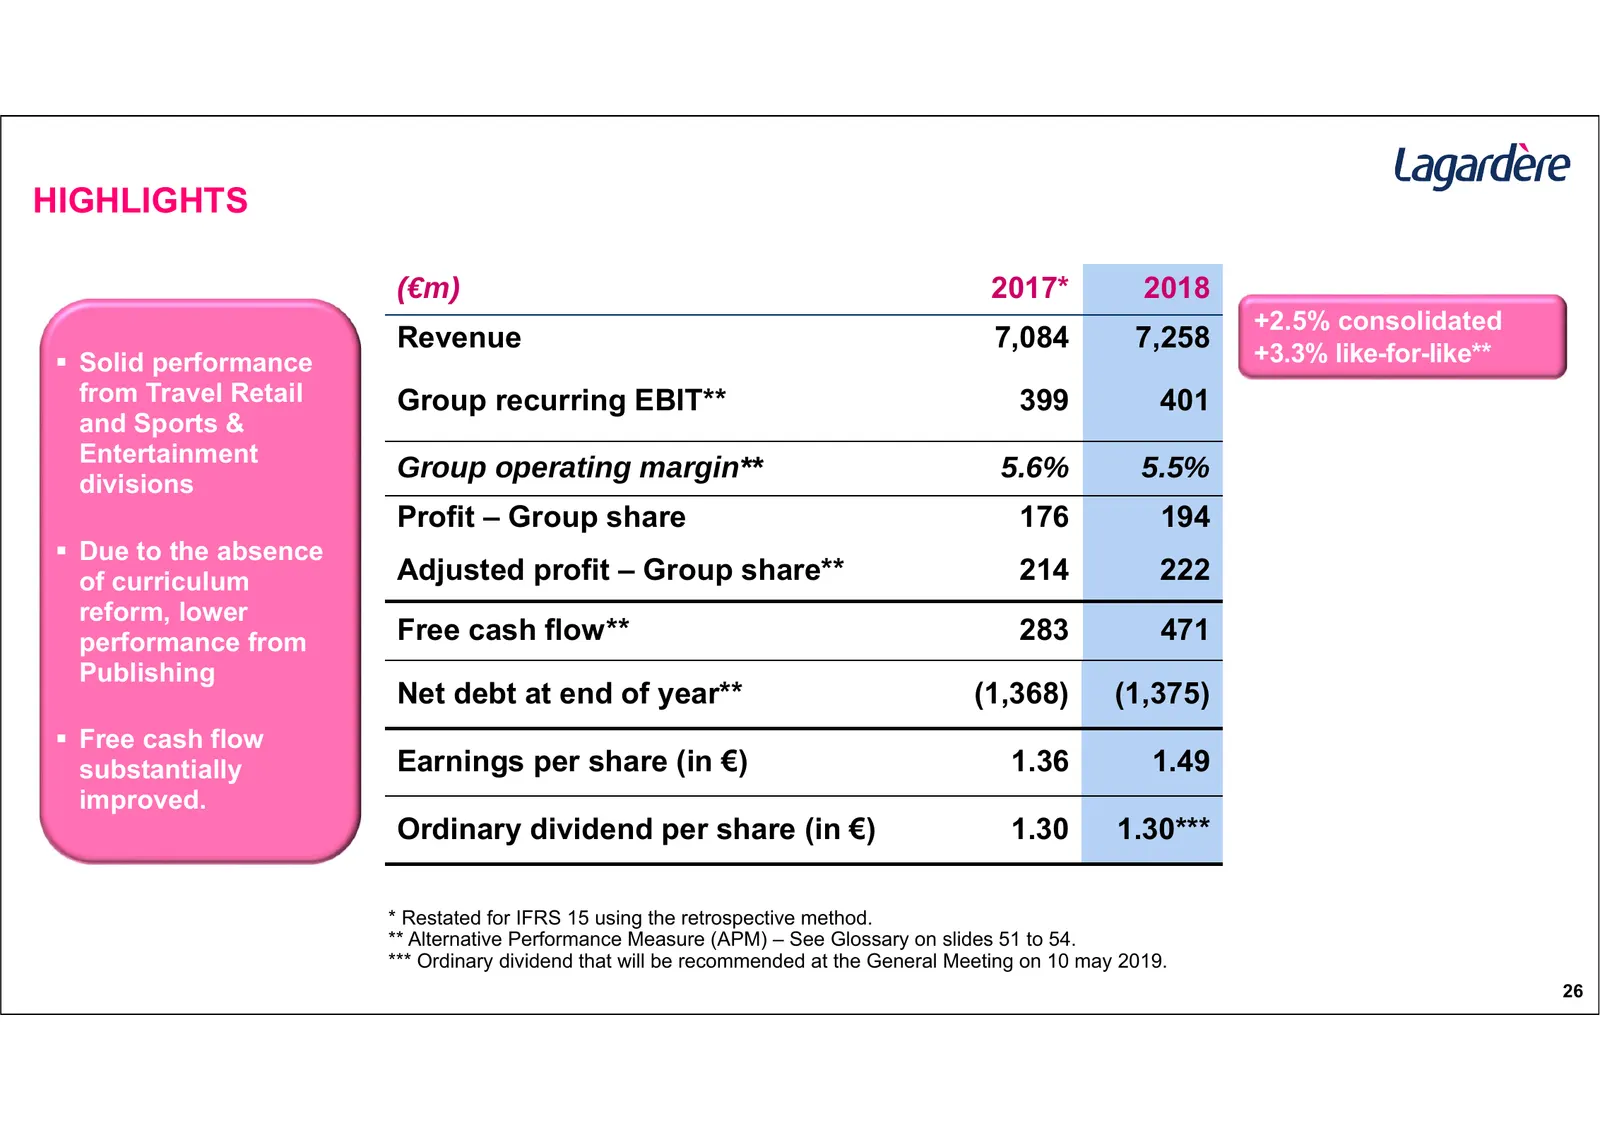
Slide 26: Highlights
HIGHLIGHTS (€m) 2017* 2018 +2.5% consolidated Revenue 7,084 7,258 +3.3% like-for-like** Solid performance from Travel Retail Group recurring EBIT** 399 401 and Sports & Entertainment Group operating margin** 5.6% 5.5% divisions Profit – Group share 176 194 Due to the absence of curriculum Adjust
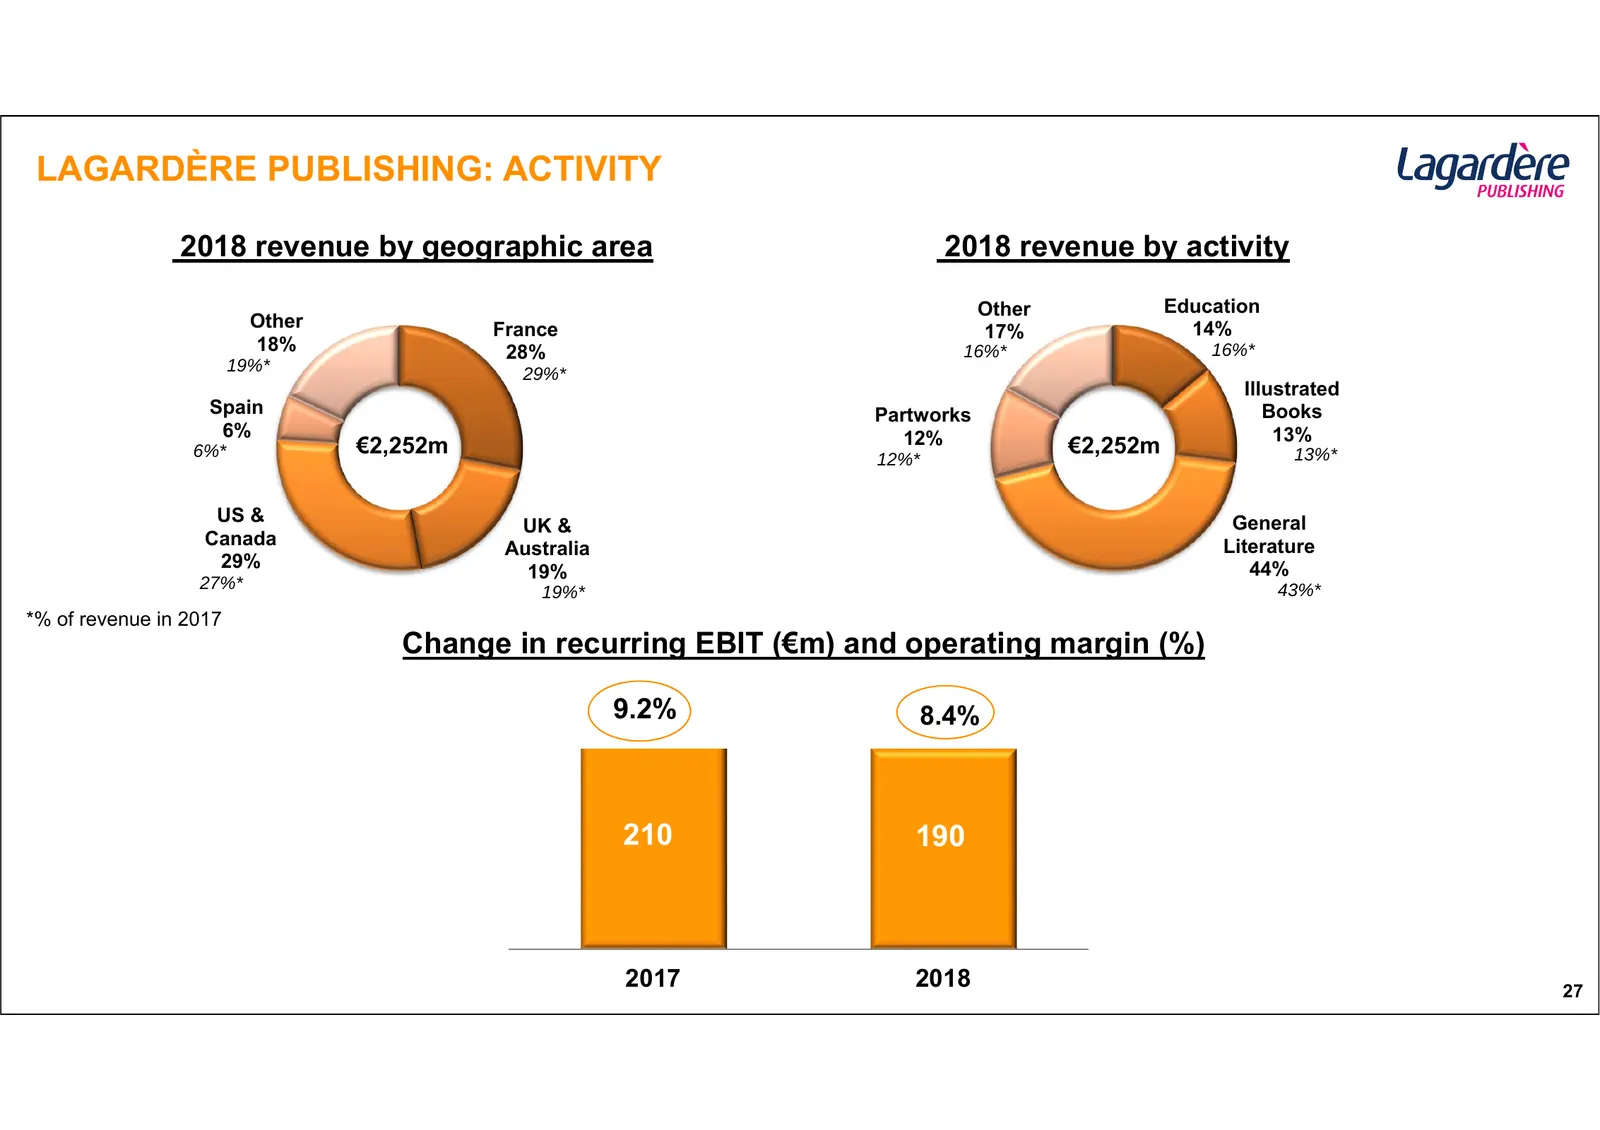
Slide 27: Lagardère Publishing: Activity
LAGARDÈRE PUBLISHING: ACTIVITY 2018 revenue by geographic area 2018 revenue by activity Other Education Other France 14% 17% 18% 28% 16%* 16%* 19%* 29%* Illustrated Spain Partworks Books 6% 12% 13% 6%* €2,252m €2,252m 13%* 12%* US & General UK & Canada Literature Australia 29% 44% 19% 27%* 19%* 43%*
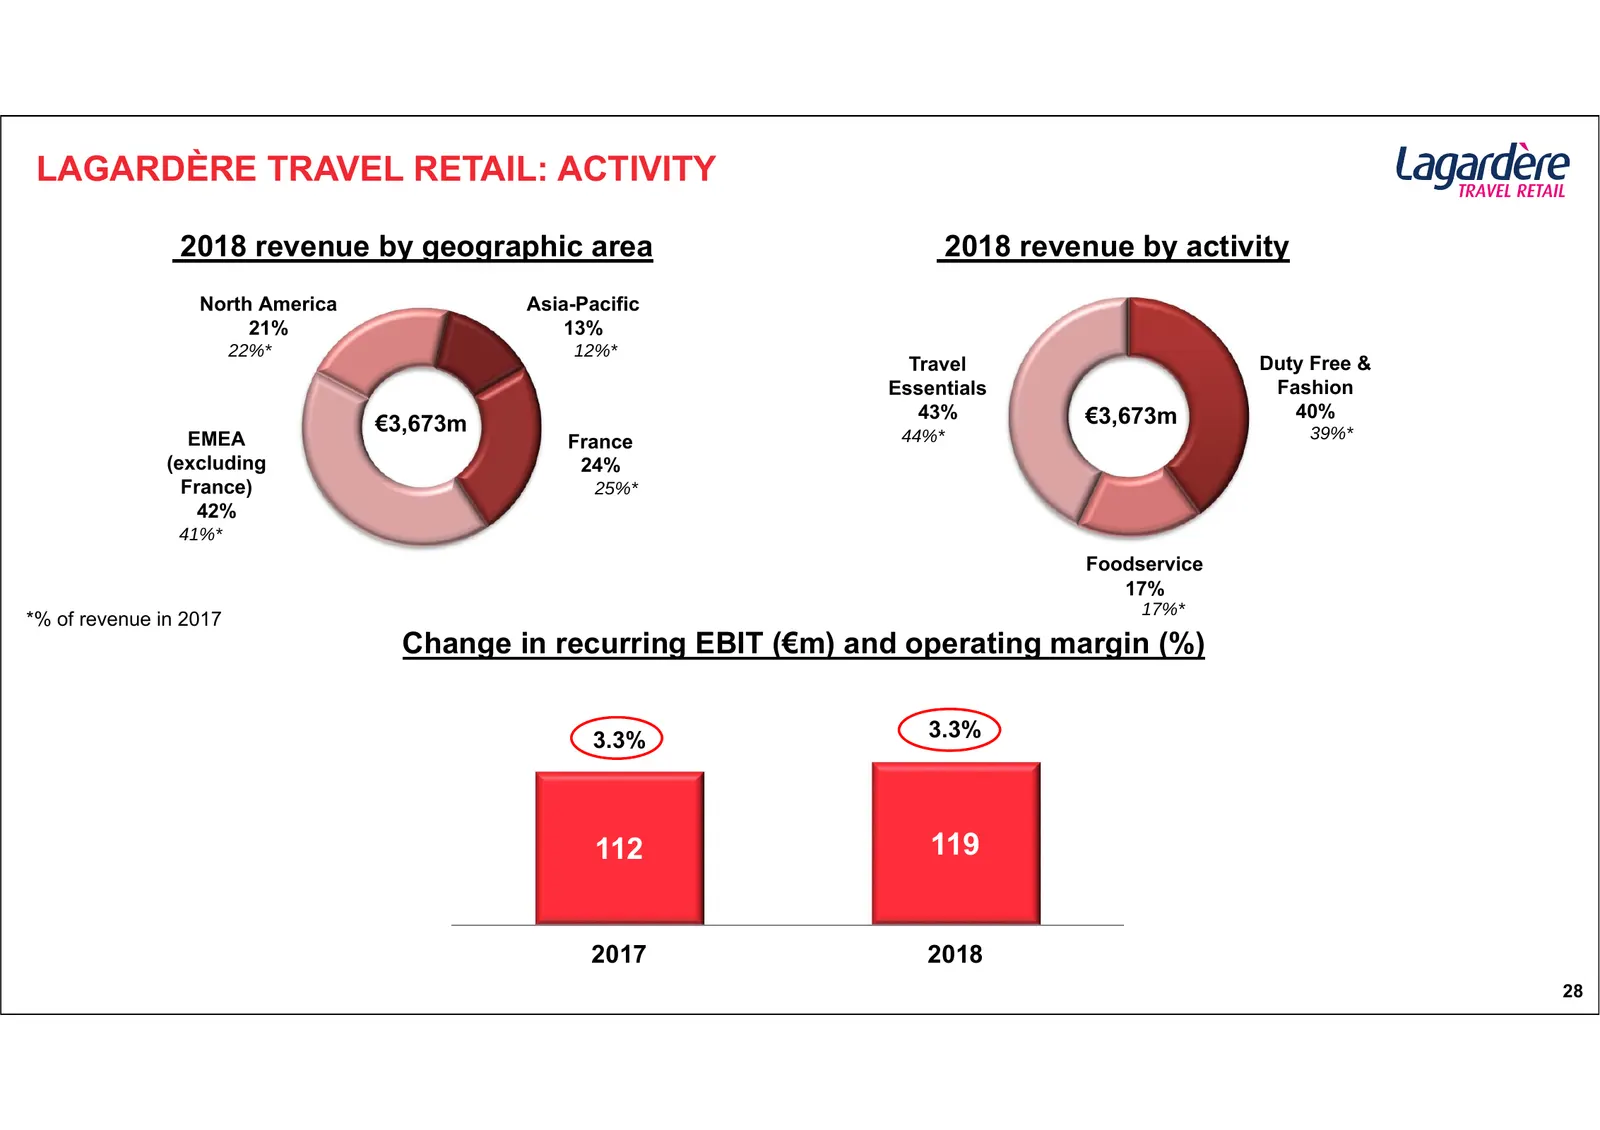
Slide 28: Lagardère Travel Retail: Activity
LAGARDÈRE TRAVEL RETAIL: ACTIVITY 2018 revenue by geographic area 2018 revenue by activity North America Asia-Pacific 21% 13% 22%* 12%* Travel Duty Free & Essentials Fashion 43% €3,673m 40% €3,673m 39%* EMEA France 44%* (excluding 24% France) 25%* 42% 41%* Foodservice 17% 17%* *% of revenue in 2017
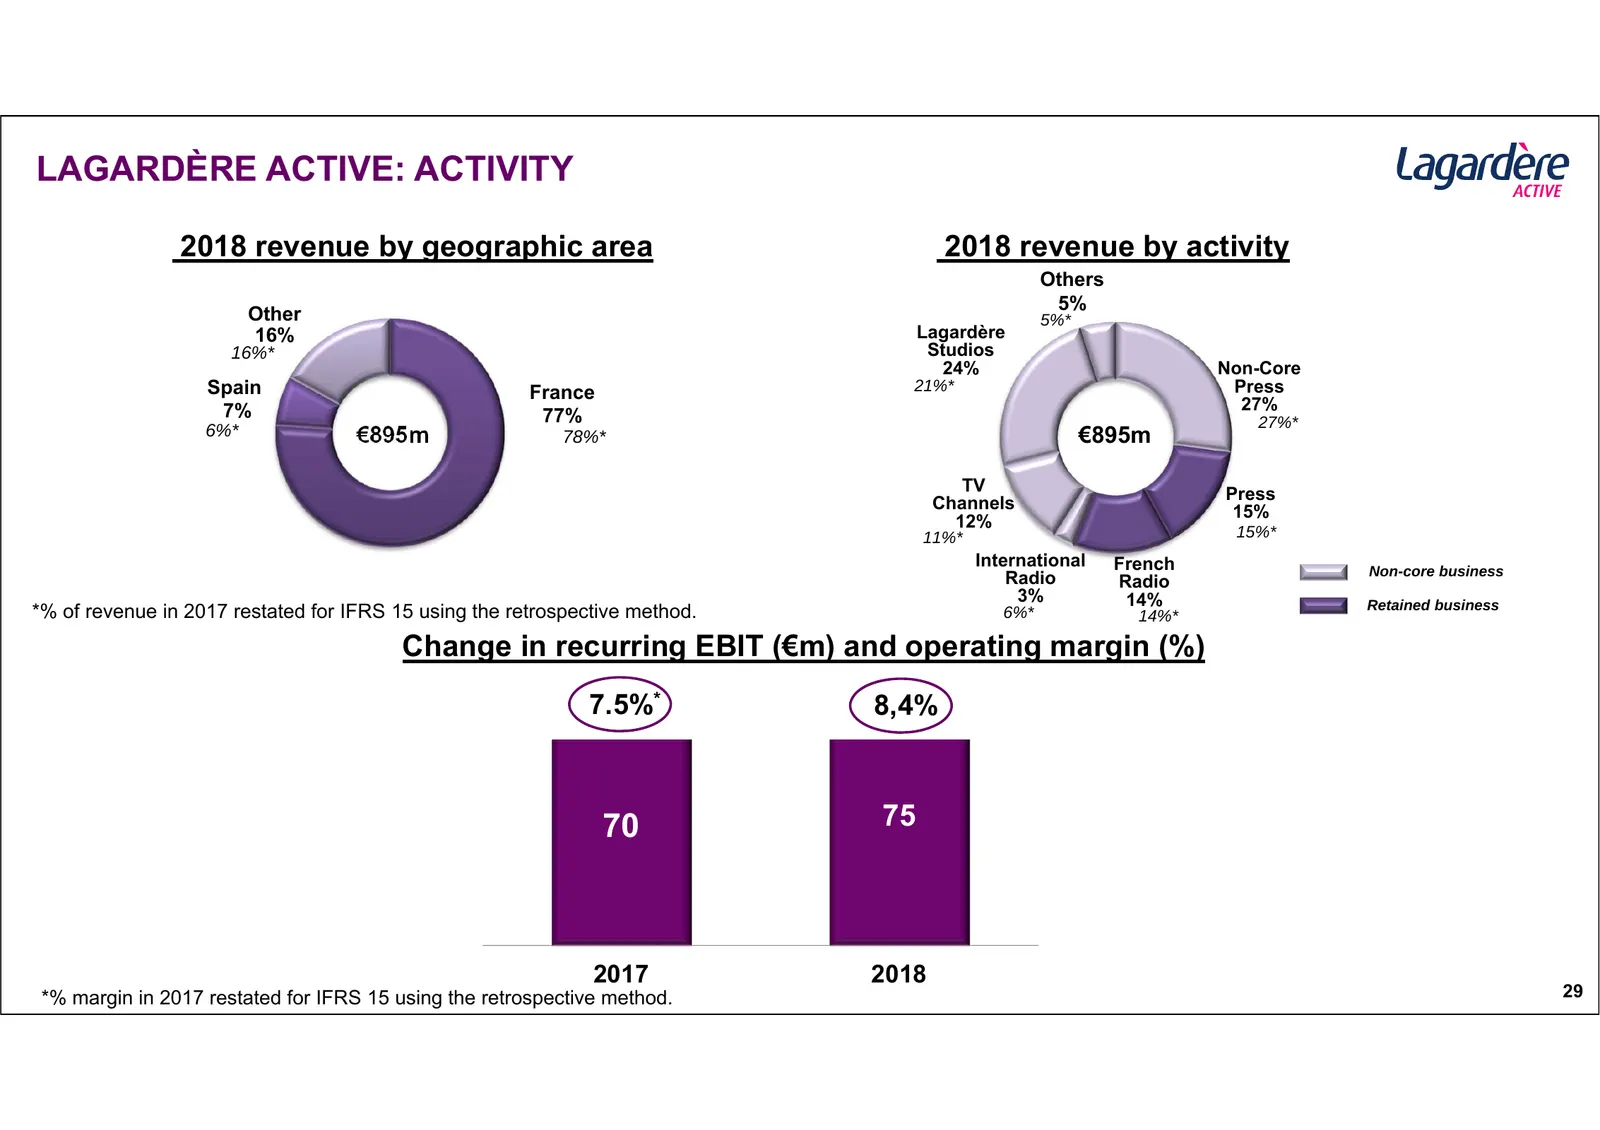
Slide 29: Lagardère Active: Activity
LAGARDÈRE ACTIVE: ACTIVITY 2018 revenue by geographic area 2018 revenue by activity Others 5% Other 5%* 16% Lagardère 16%* Studios 24% Non-Core Spain France 21%* Press 7% 27% 77% 27%* 6%* €895m 78%* €895m TV Press Channels 15% 12% 11%* 15%* International French Non-core business Radio Radio 3% 14% R
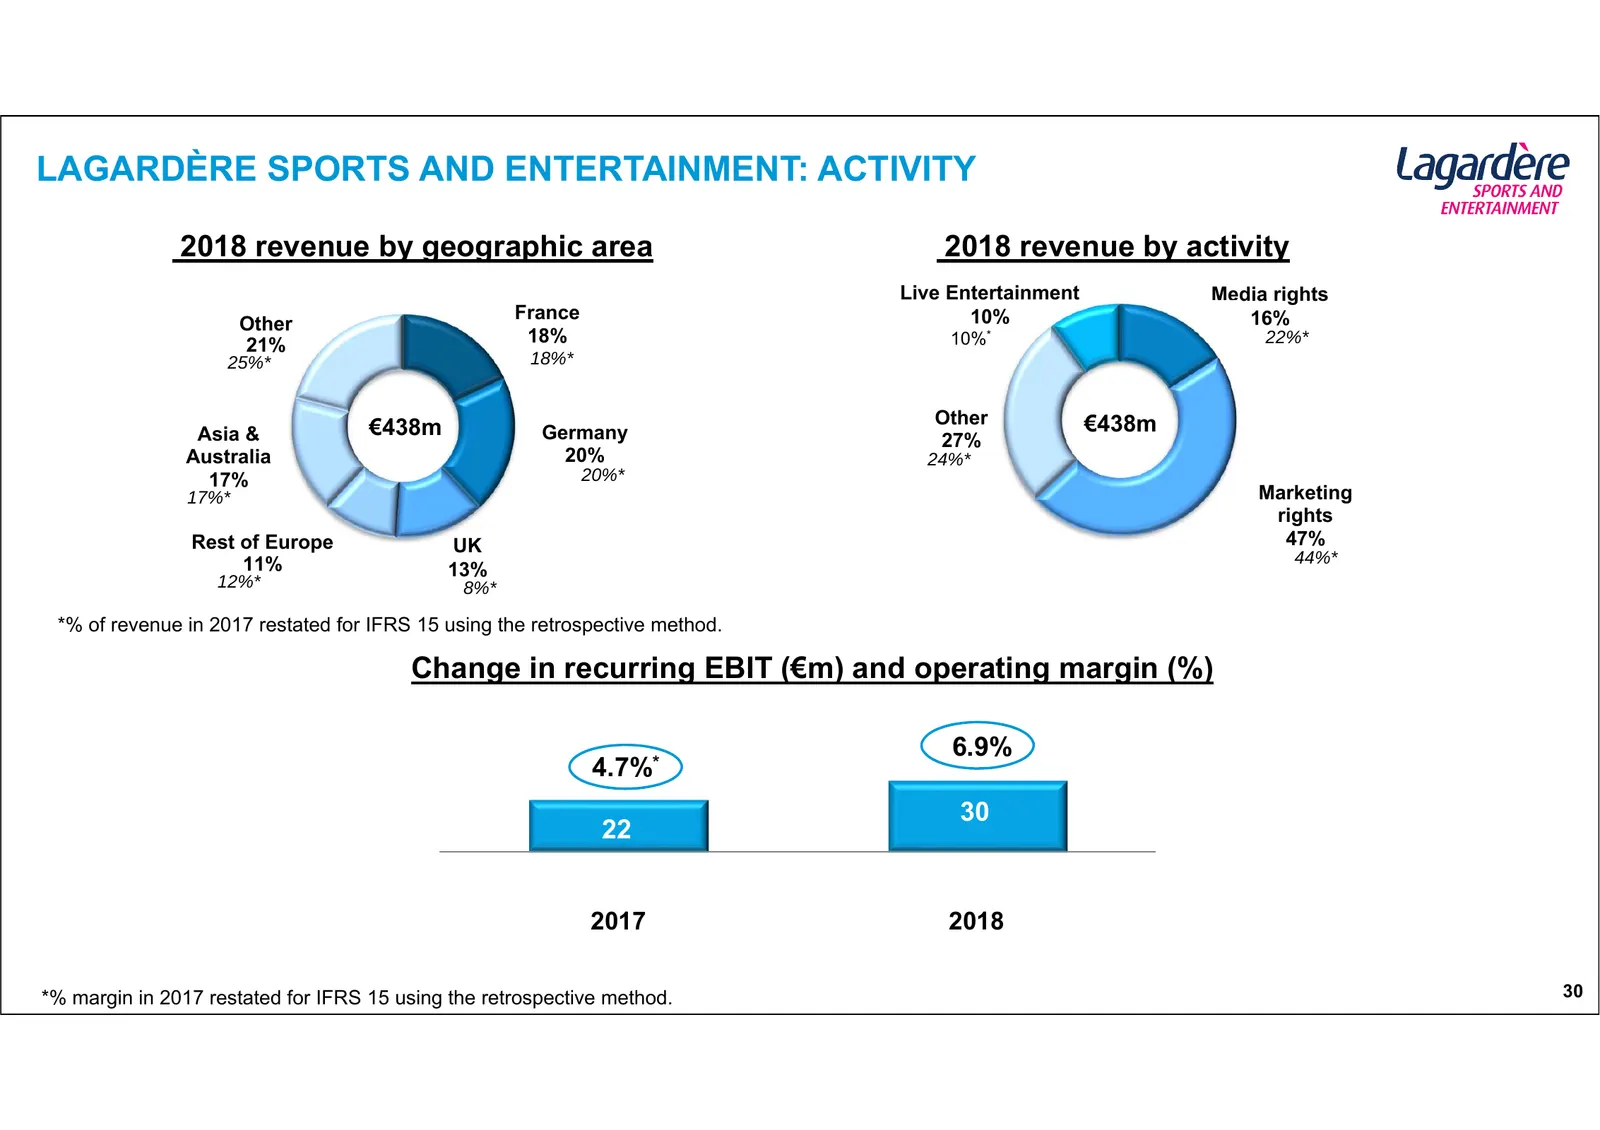
Slide 30: Lagardère Sports and Entertainment: Activity
LAGARDÈRE SPORTS AND ENTERTAINMENT: ACTIVITY 2018 revenue by geographic area 2018 revenue by activity Live Entertainment Media rights France 10% 16% Other 21% 18% 10%* 22%* 25%* 18%* Other €438m Asia & €438m Germany 27% Australia 20% 24%* 17% 20%* 17%* Marketing rights Rest of Europe UK 47% 11% 44%*
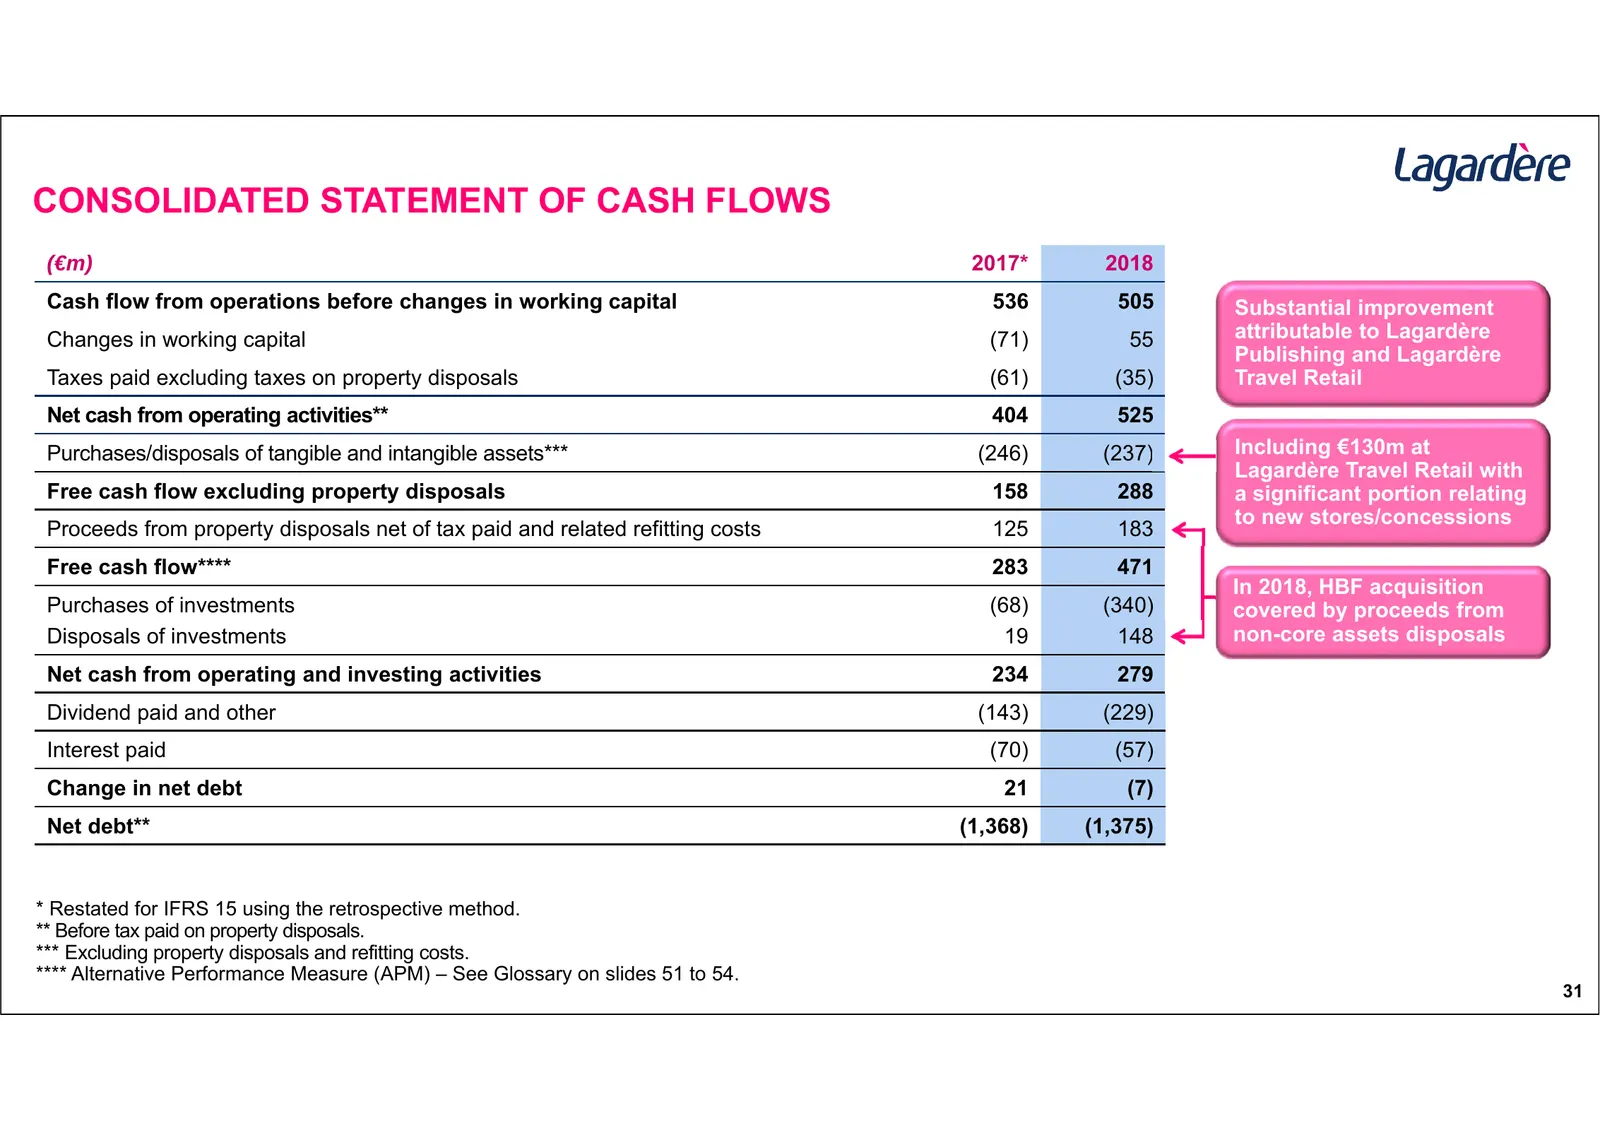
Slide 31: Consolidated statement of cash flows
CONSOLIDATED STATEMENT OF CASH FLOWS (€m) 2017* 2018 Cash flow from operations before changes in working capital 536 505 Substantial improvement Changes in working capital (71) 55 attributable to Lagardère Publishing and Lagardère Taxes paid excluding taxes on property disposals (61) (35) Travel Ret
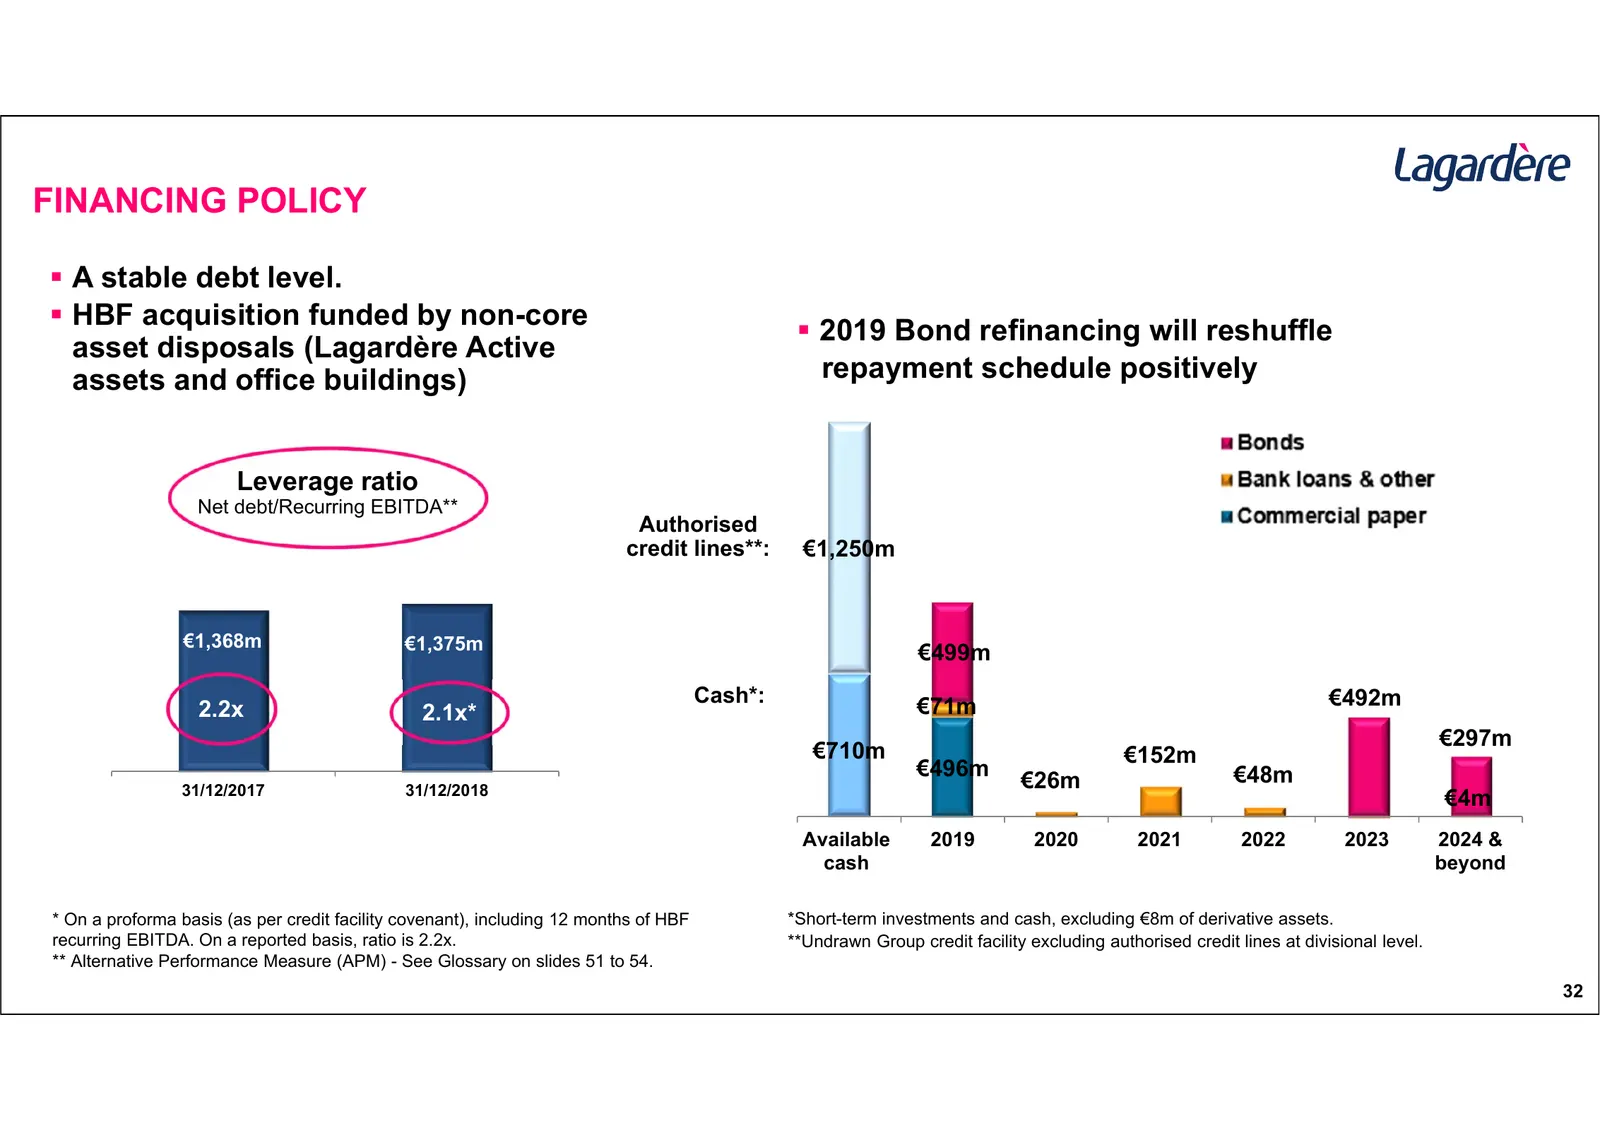
Slide 32: Financing policy
FINANCING POLICY A stable debt level. HBF acquisition funded by non-core 2019 Bond refinancing will reshuffle asset disposals (Lagardère Active assets and office buildings) repayment schedule positively Leverage ratio Net debt/Recurring EBITDA** Authorised credit lines**: €1,250m €1,368m €1,37

Slide 33: Guidance
MICHAEL | a NNEC Lagardere GUIDANCE
Slide 34: Guidance 2019
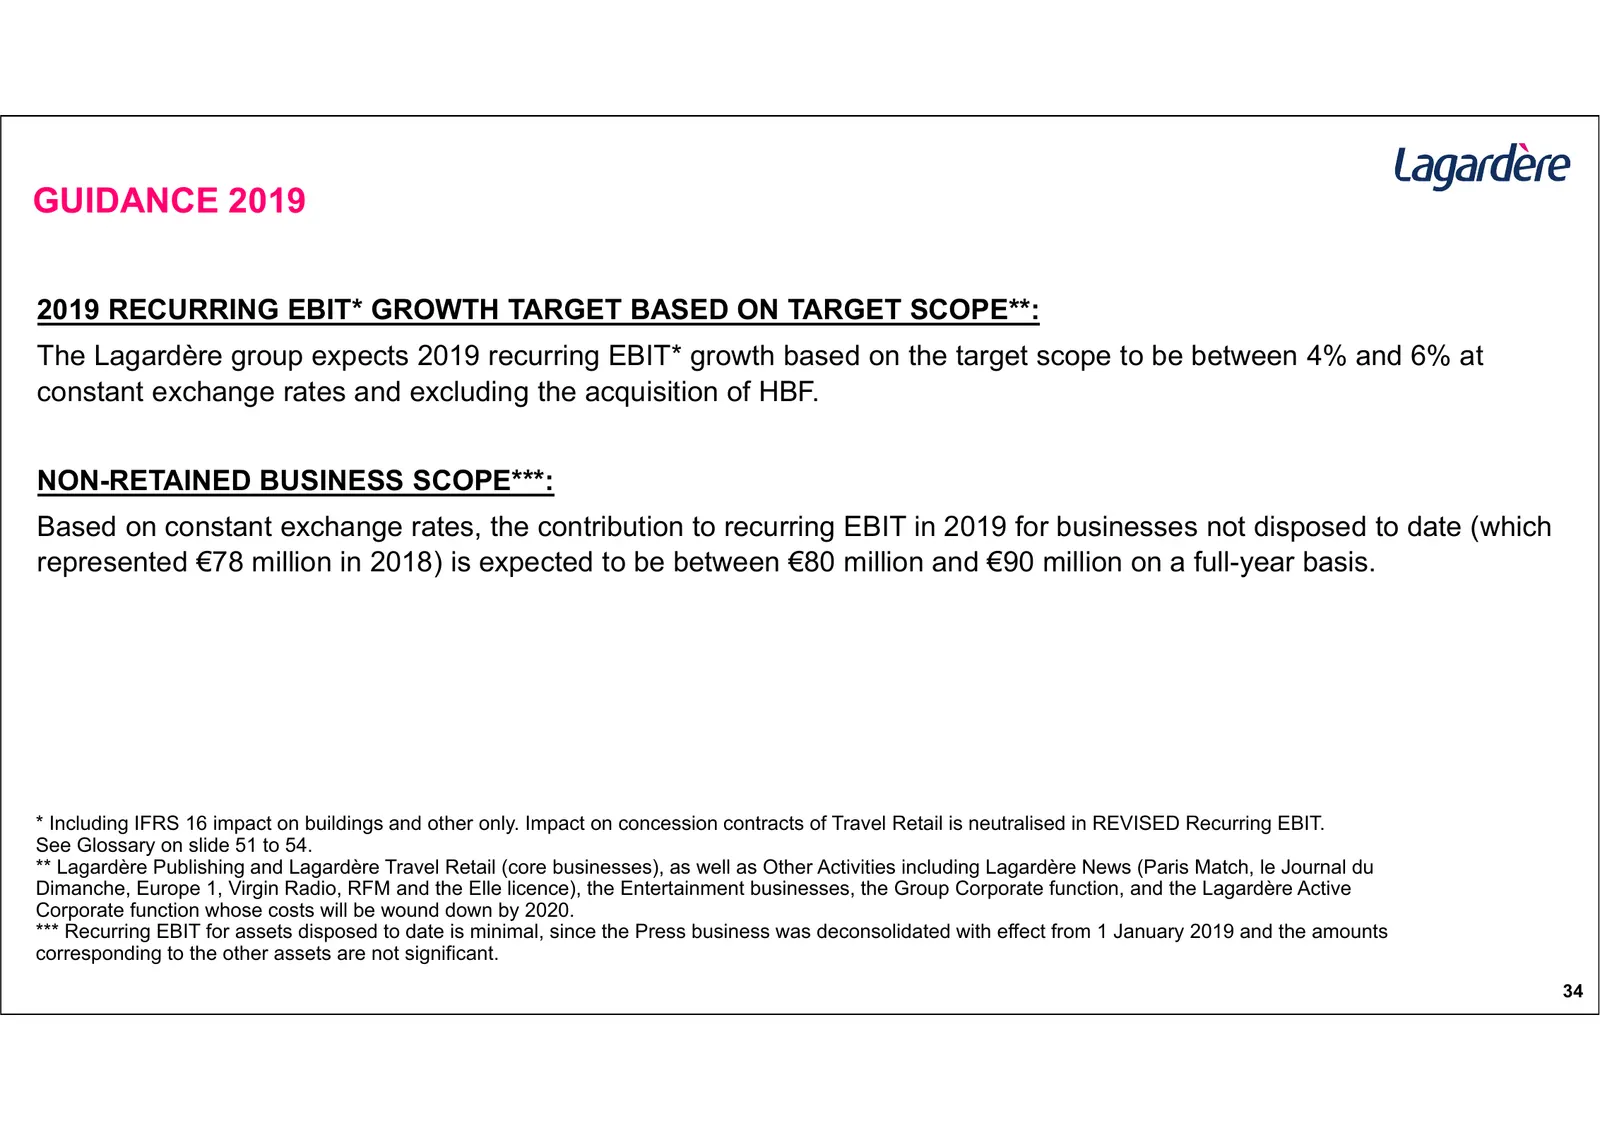
GUIDANCE 2019 2019 RECURRING EBIT* GROWTH TARGET BASED ON TARGET SCOPE**: The Lagardère group expects 2019 recurring EBIT* growth based on the target scope to be between 4% and 6% at constant exchange rates and excluding the acquisition of HBF. NON-RETAINED BUSINESS SCOPE***: Based on constant excha

Slide 35: Appendix: Business Updates
MICHAEL } ; CONNELLY at APPENDIX: BUSINESS UPDATES
Slide 36: Transformation method
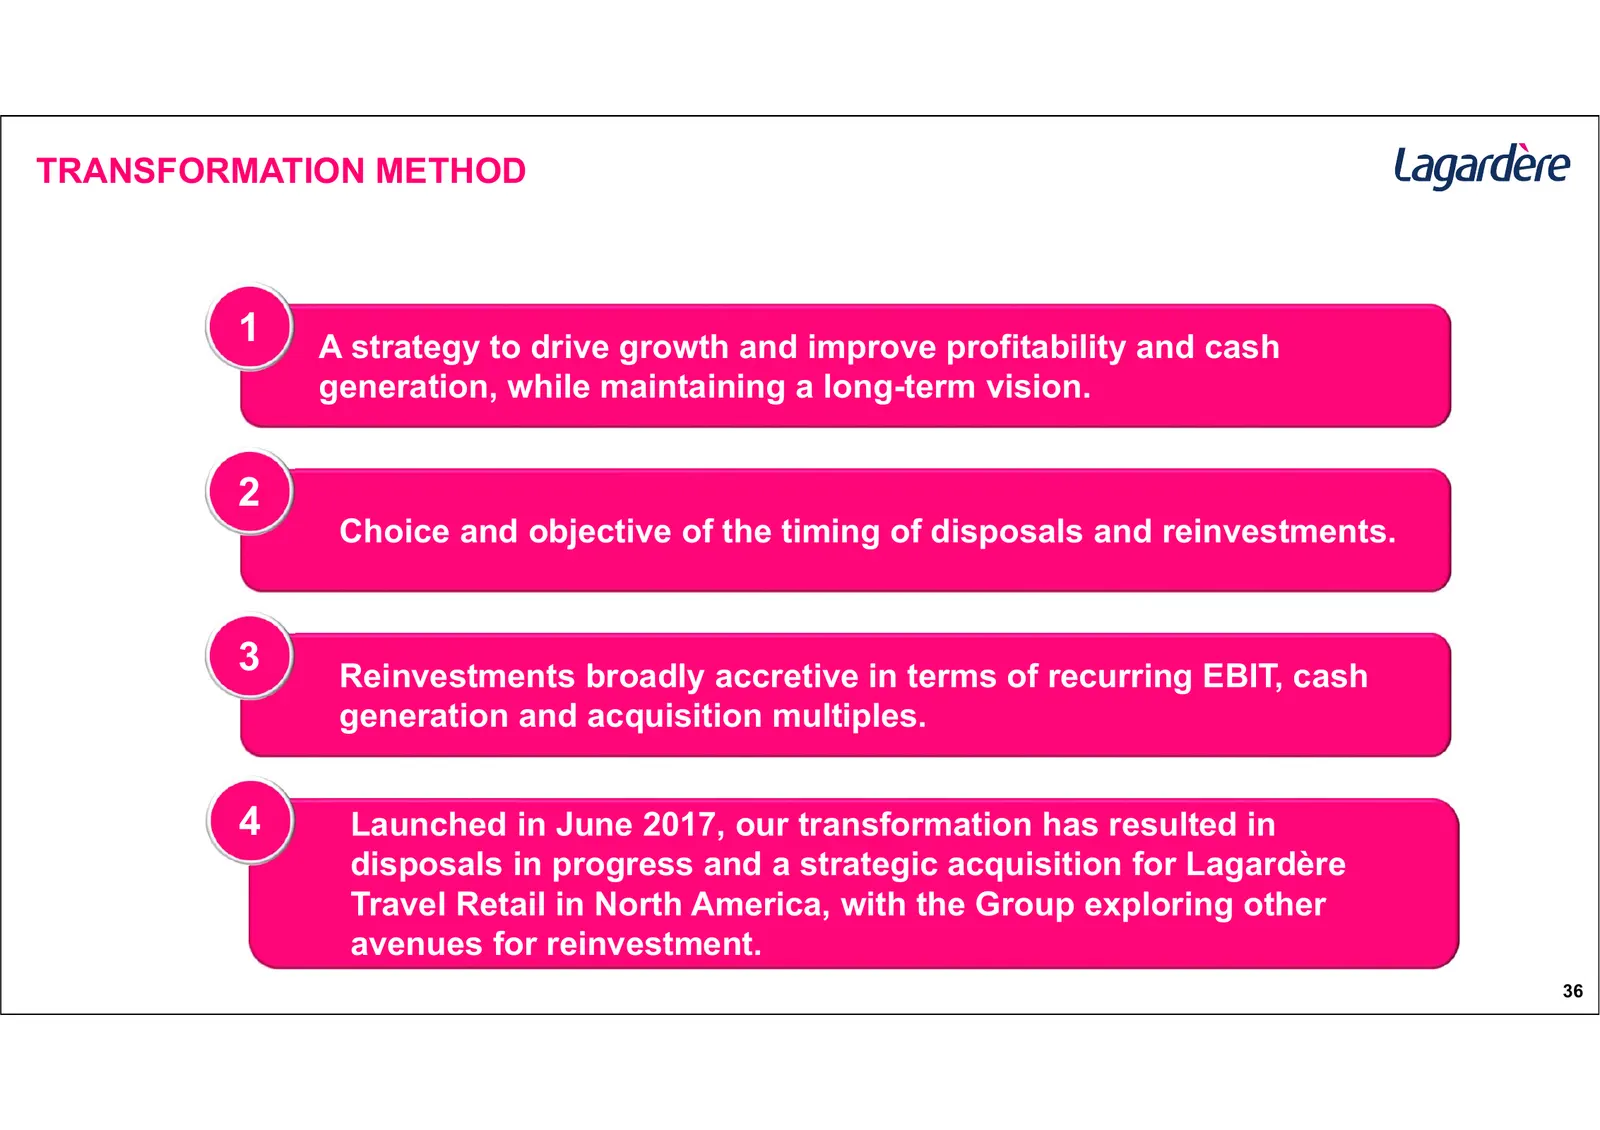
TRANSFORMATION METHOD 1 A strategy to drive growth and improve profitability and cash generation, while maintaining a long-term vision. 2 Choice and objective of the timing of disposals and reinvestments. 3 Reinvestments broadly accretive in terms of recurring EBIT, cash generation and acquisition m
Slide 37: Perseus acquisition
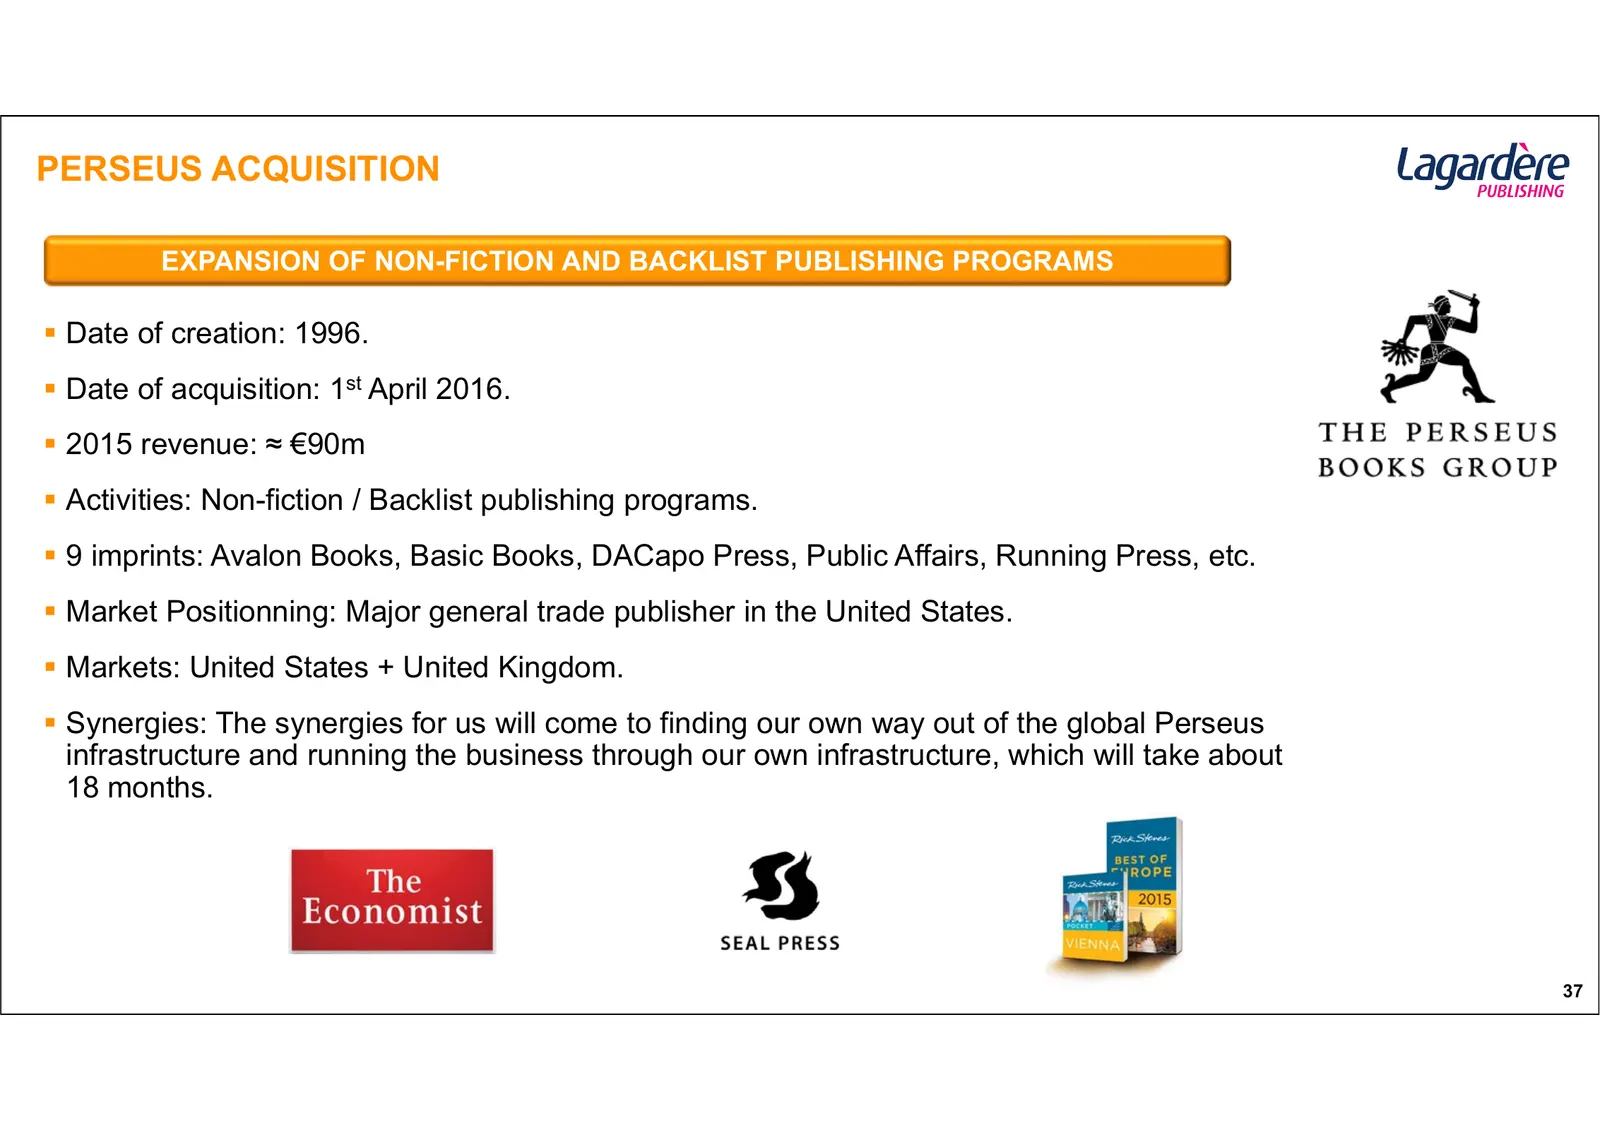
PERSEUS ACQUISITION EXPANSION OF NON-FICTION AND BACKLIST PUBLISHING PROGRAMS Date of creation: 1996. Date of acquisition: 1st April 2016. 2015 revenue: ≈ €90m Activities: Non-fiction / Backlist publishing programs. 9 imprints: Avalon Books, Basic Books, DACapo Press, Public Affairs, Runni
Slide 38: Travel retail organic growth drivers
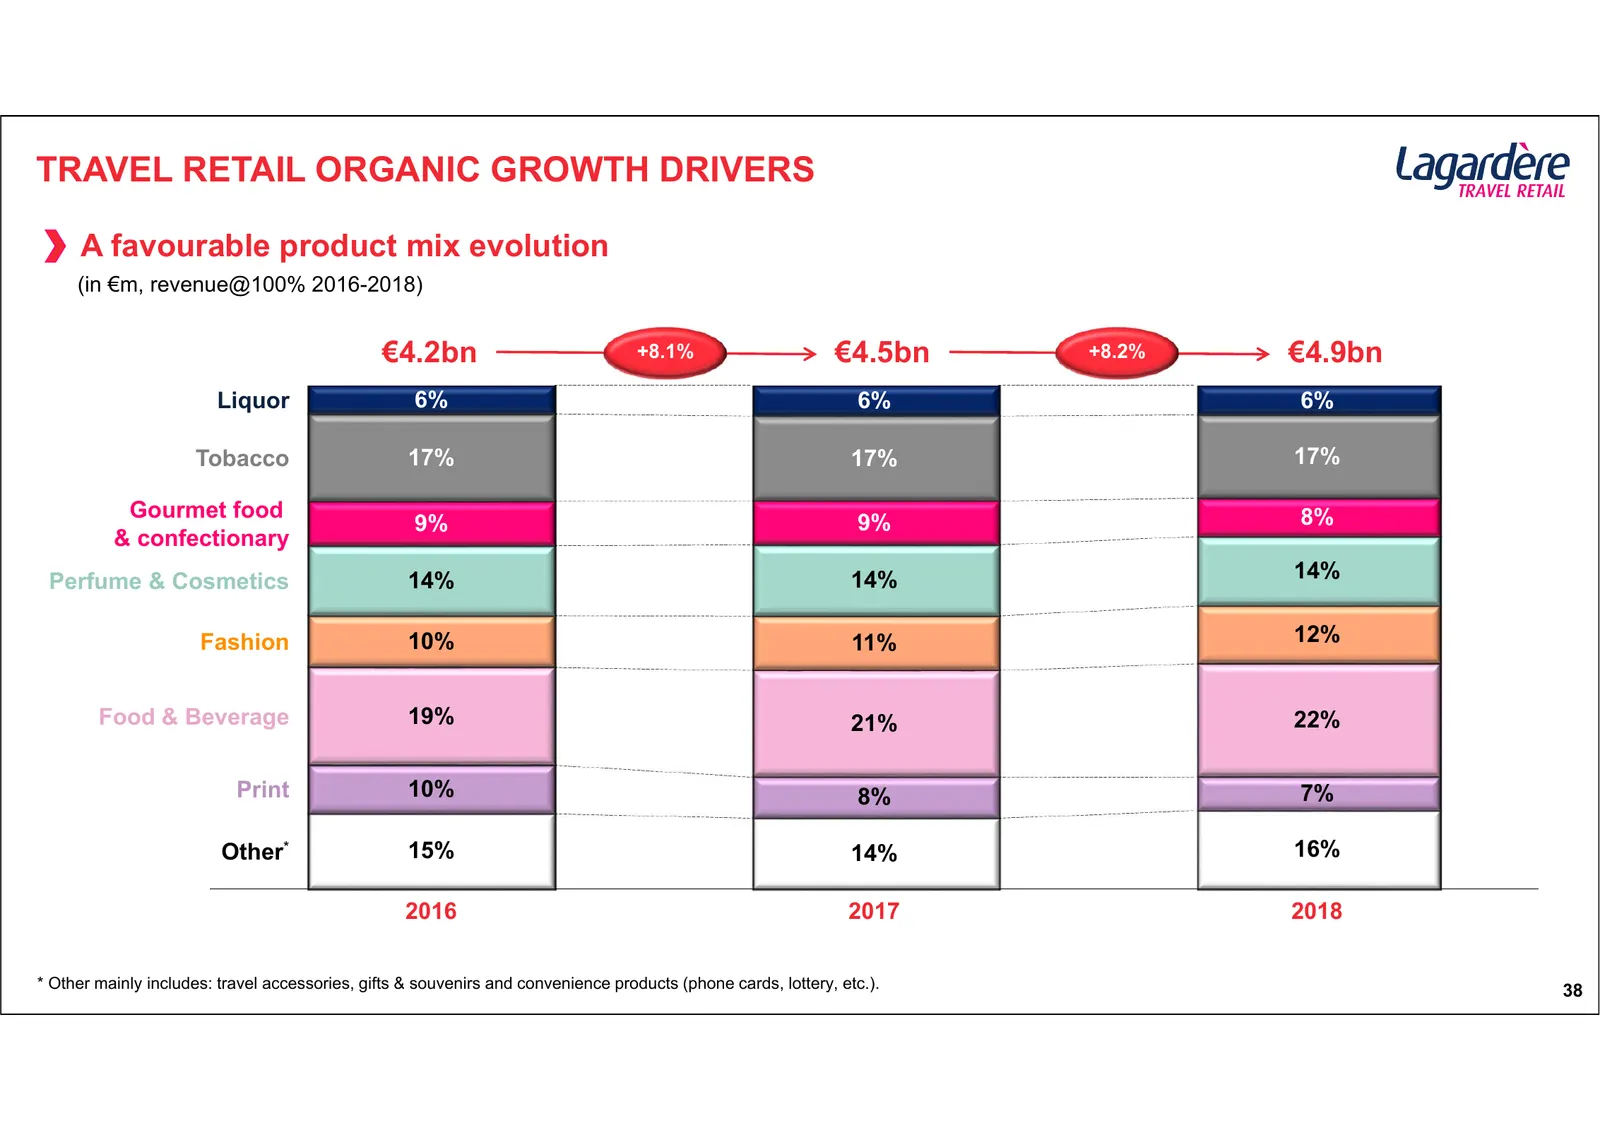
TRAVEL RETAIL ORGANIC GROWTH DRIVERS A favourable product mix evolution (in €m, revenue@100% 2016-2018) €4.2bn +8.1% €4.5bn +8.2% €4.9bn Liquor 6% 6% 6% Tobacco 17% 17% 17% Gourmet food 8% 9% 9% & confectionary Perfume & Cosmetics 14% 14% 14% Fashion 10% 11% 12% Food & Beverage 19% 21% 22% Print 10%
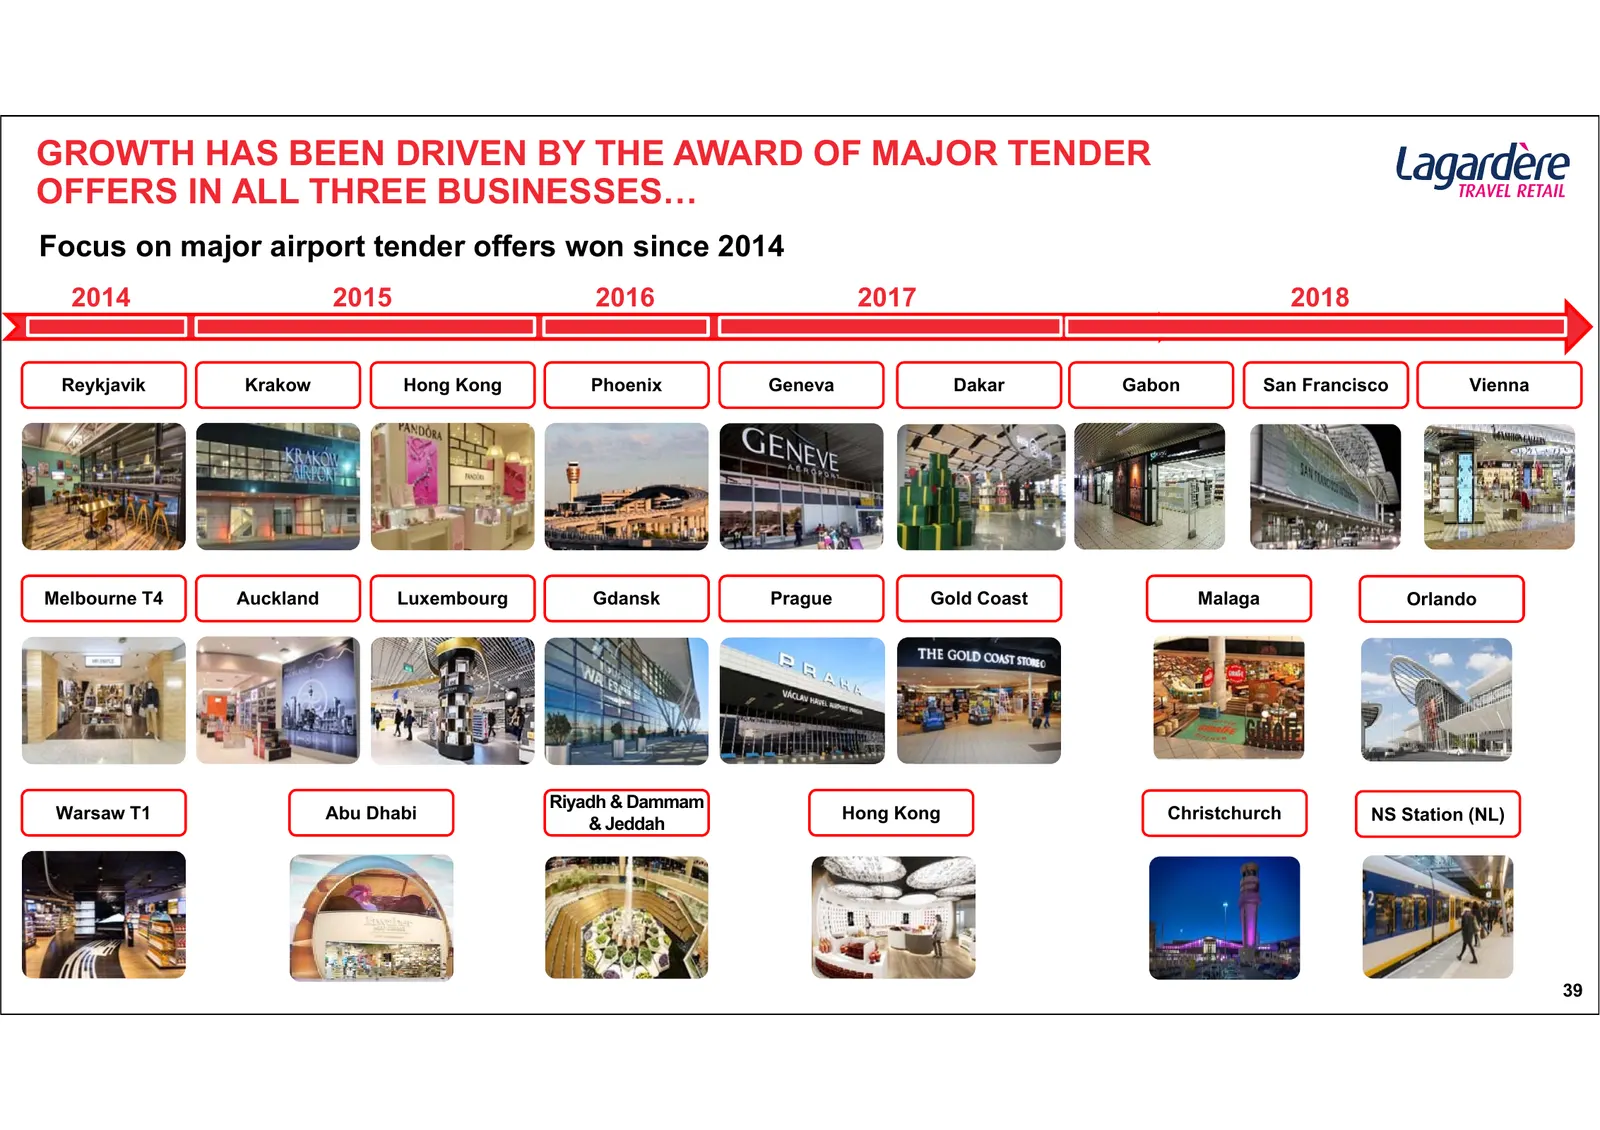
Slide 39: Growth driven by award of major tender offers in all three businesses
GROWTH HAS BEEN DRIVEN BY THE AWARD OF MAJOR TENDER OFFERS IN ALL THREE BUSINESSES… Focus on major airport tender offers won since 2014 2014 2015 2016 2017 2018 Reykjavik Krakow Hong Kong Phoenix Geneva Dakar Gabon San Francisco Vienna Melbourne T4 Auckland Luxembourg Gdansk Prague Gold Coast Malaga
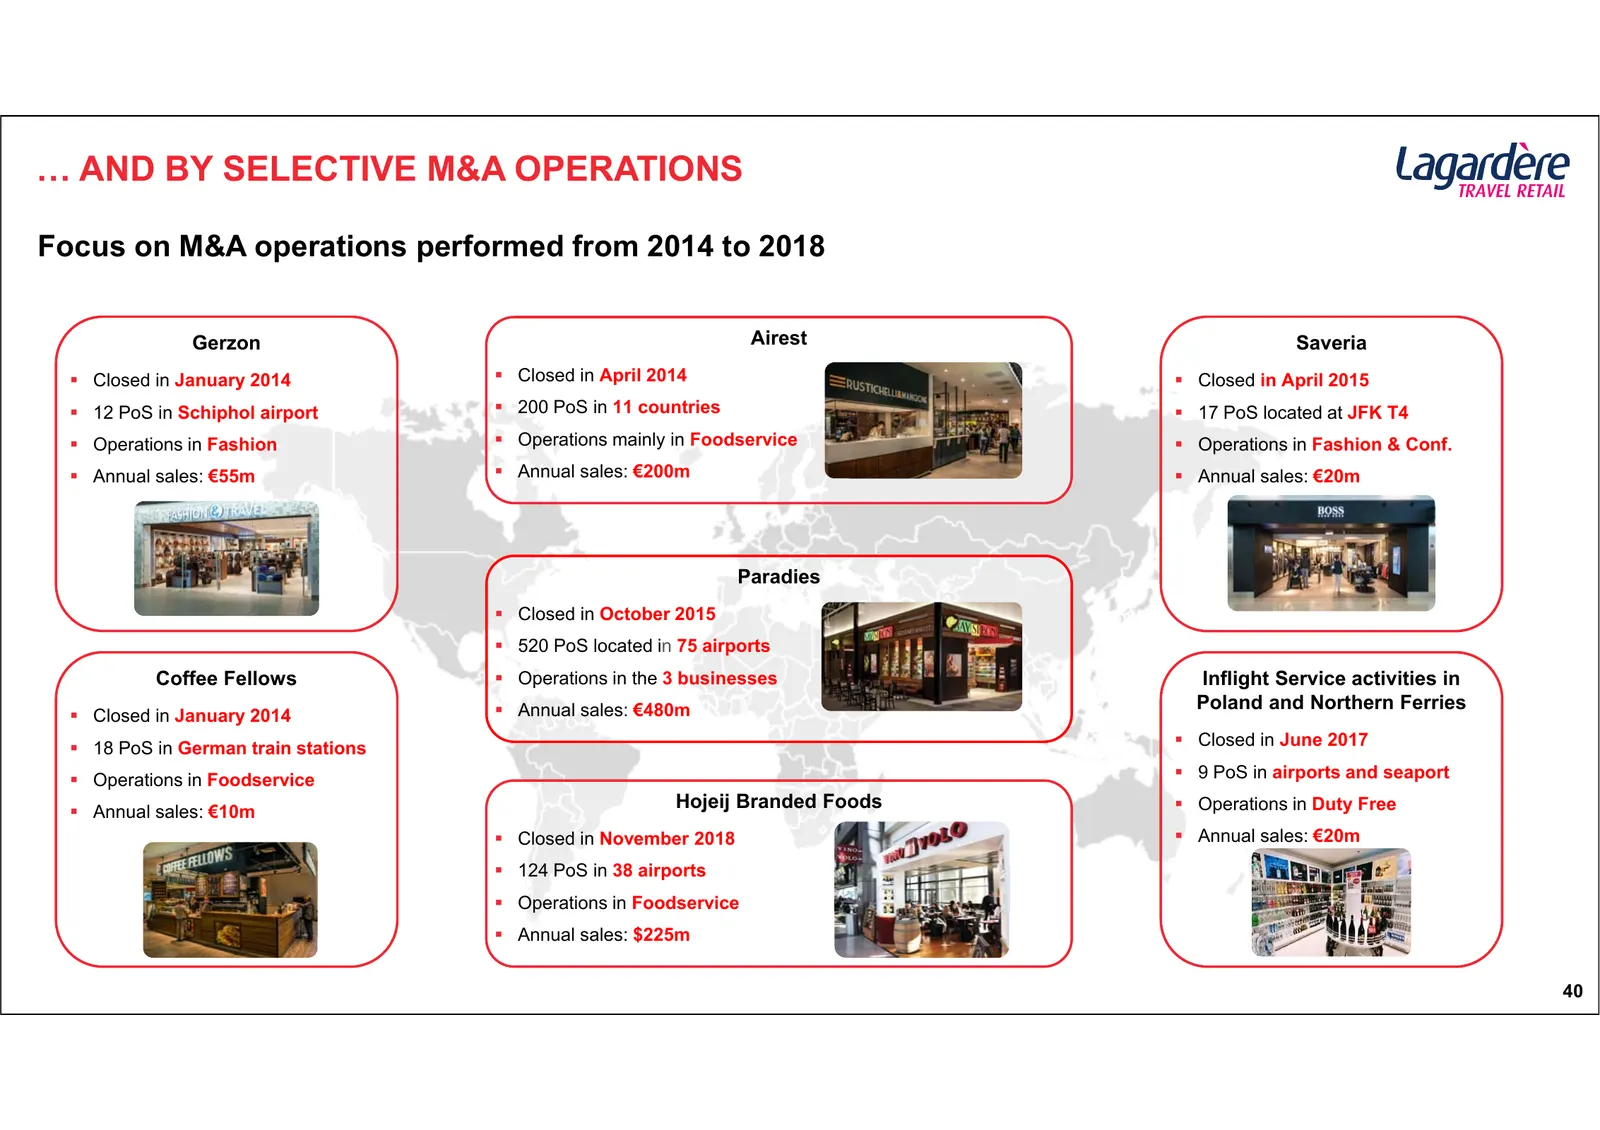
Slide 40: … and by selective M&A operations
… AND BY SELECTIVE M&A OPERATIONS Focus on M&A operations performed from 2014 to 2018 Gerzon Airest Saveria Closed in January 2014 Closed in April 2014 Closed in April 2015 12 PoS in Schiphol airport 200 PoS in 11 countries 17 PoS located at JFK T4 Operations in Fashion Operations ma
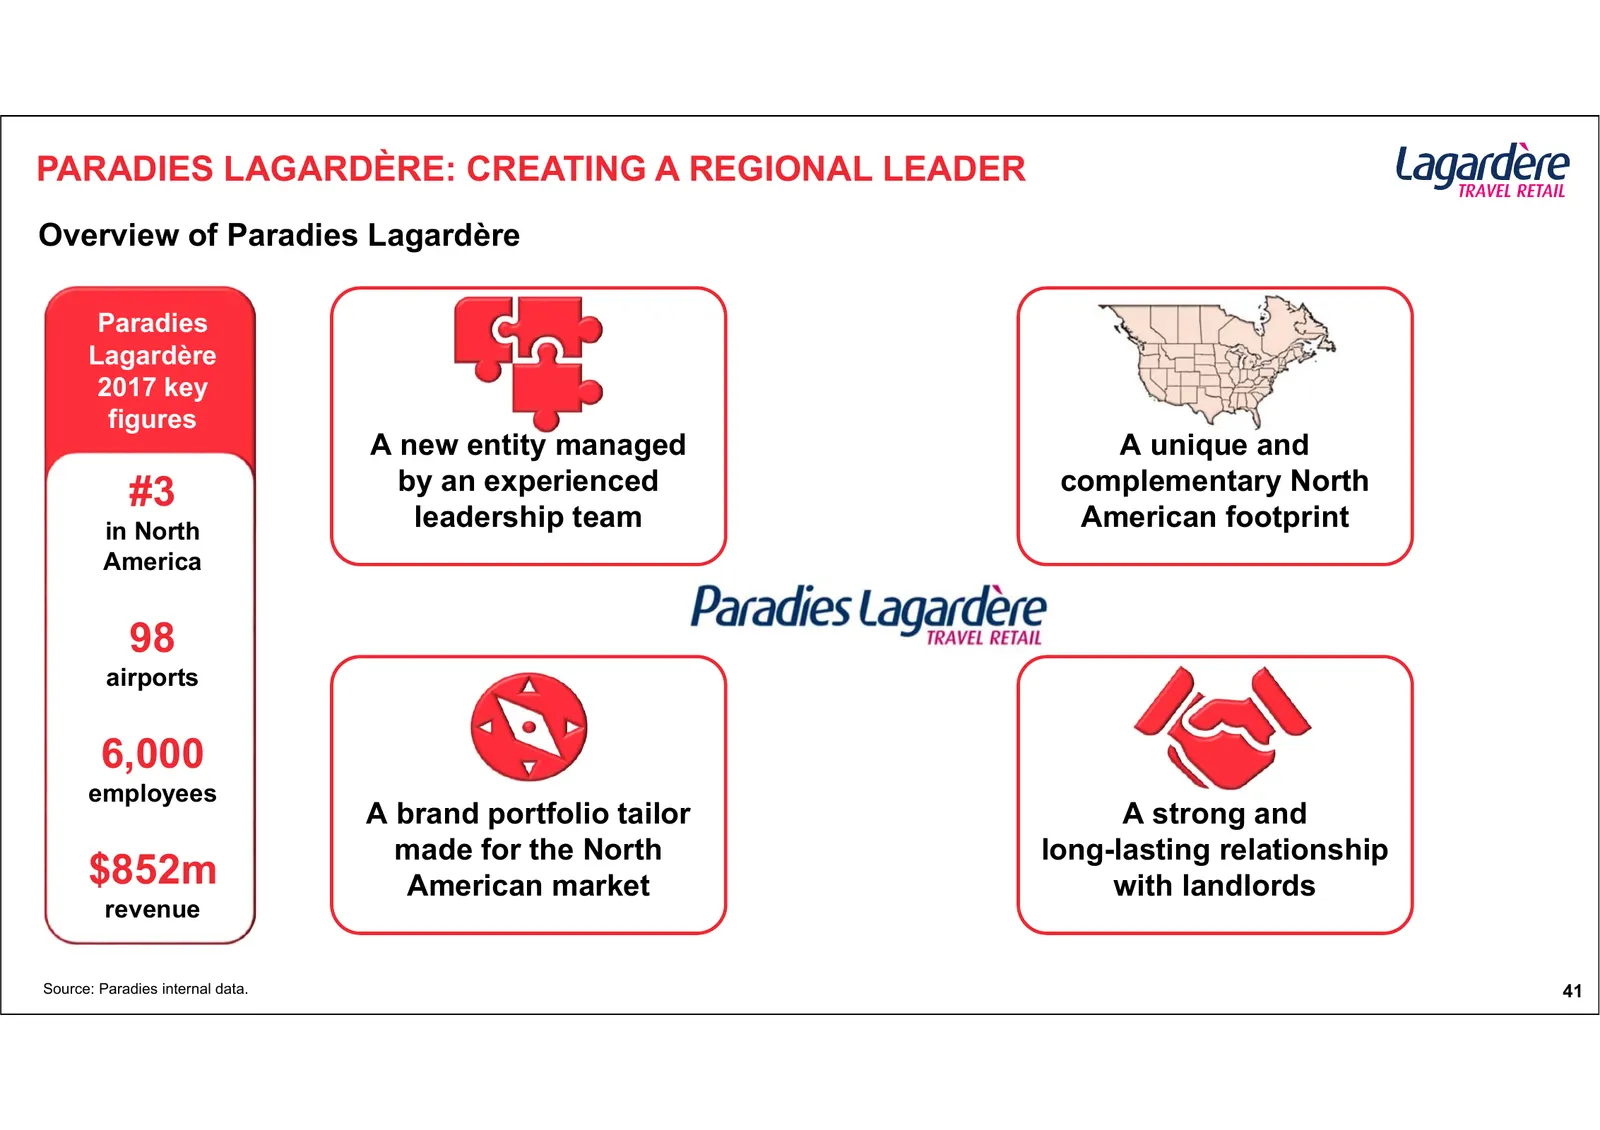
Slide 41: Paradies Lagardère: creating a regional leader
PARADIES LAGARDÈRE: CREATING A REGIONAL LEADER Overview of Paradies Lagardère Paradies Lagardère 2017 key figures A new entity managed A unique and #3 by an experienced complementary North in North leadership team American footprint America 98 airports 6,000 employees A brand portfolio tailor A stro
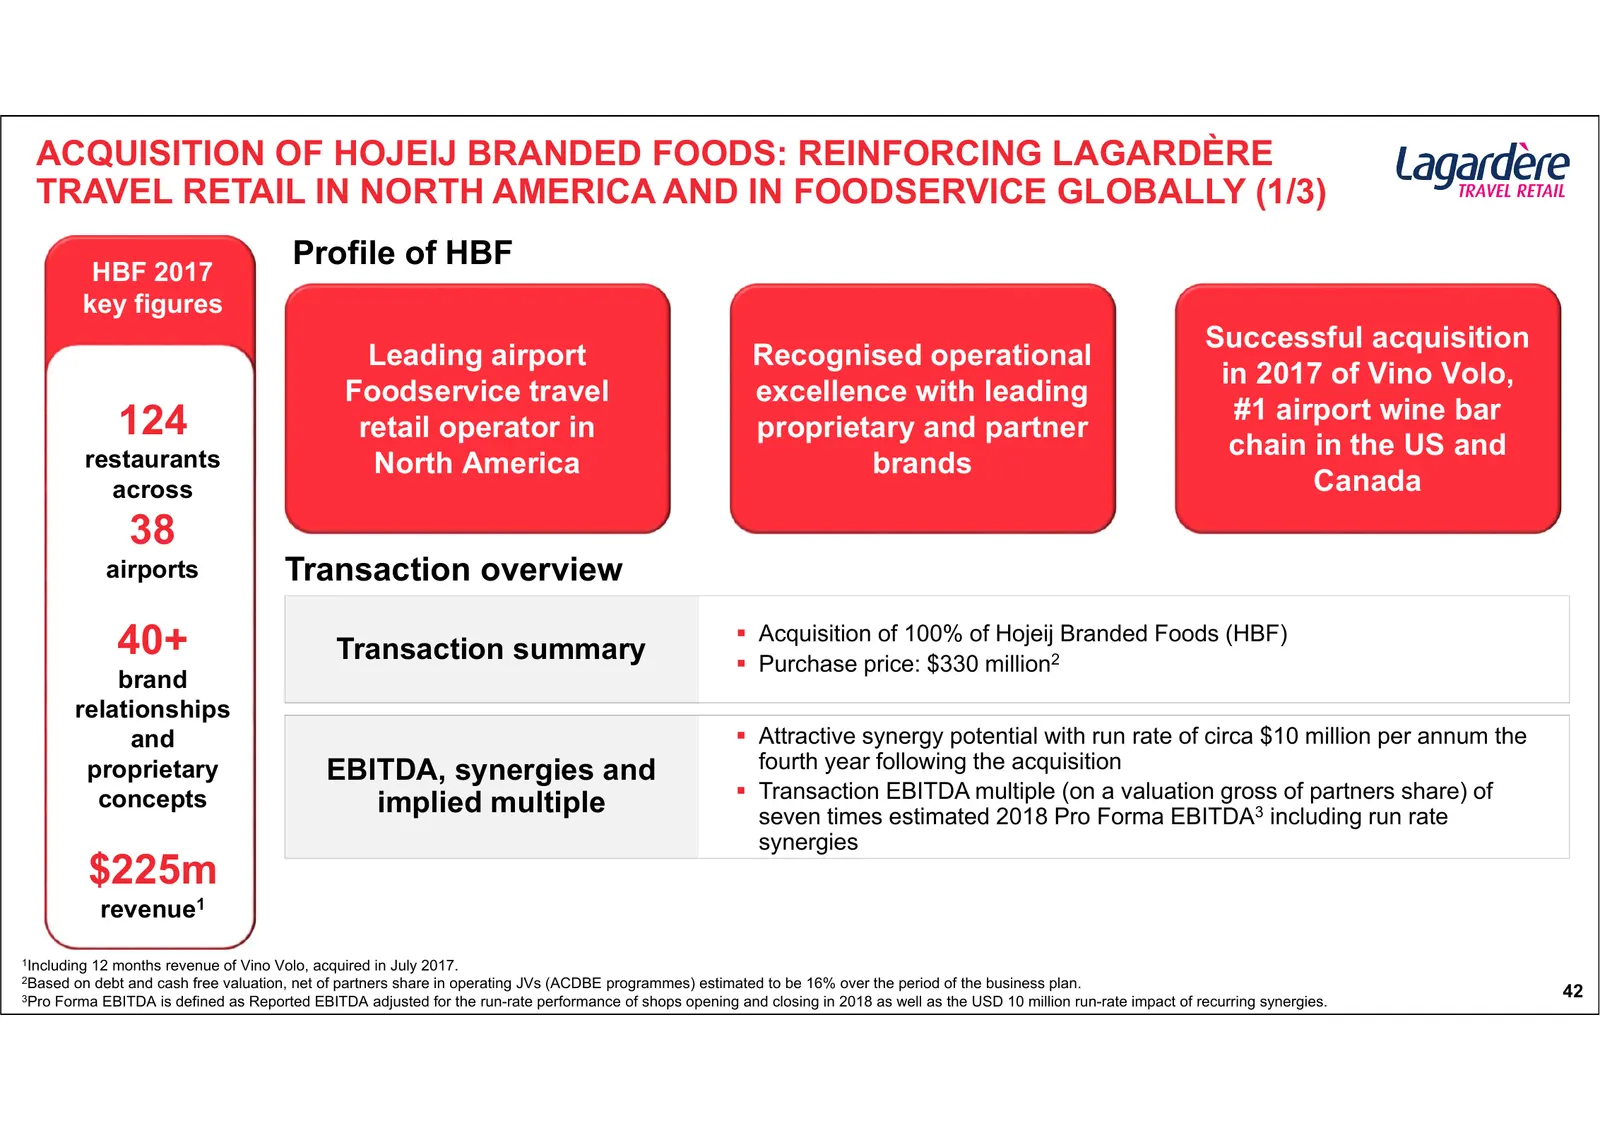
Slide 42: Acquisition of Hojeij Branded Foods (1/3)
ACQUISITION OF HOJEIJ BRANDED FOODS: REINFORCING LAGARDÈRE TRAVEL RETAIL IN NORTH AMERICA AND IN FOODSERVICE GLOBALLY (1/3) HBF 2017 Profile of HBF key figures Successful acquisition Leading airport Recognised operational in 2017 of Vino Volo, Foodservice travel excellence with leading 124 #1 airpor
Slide 43: Acquisition of Hojeij Branded Foods (2/3)
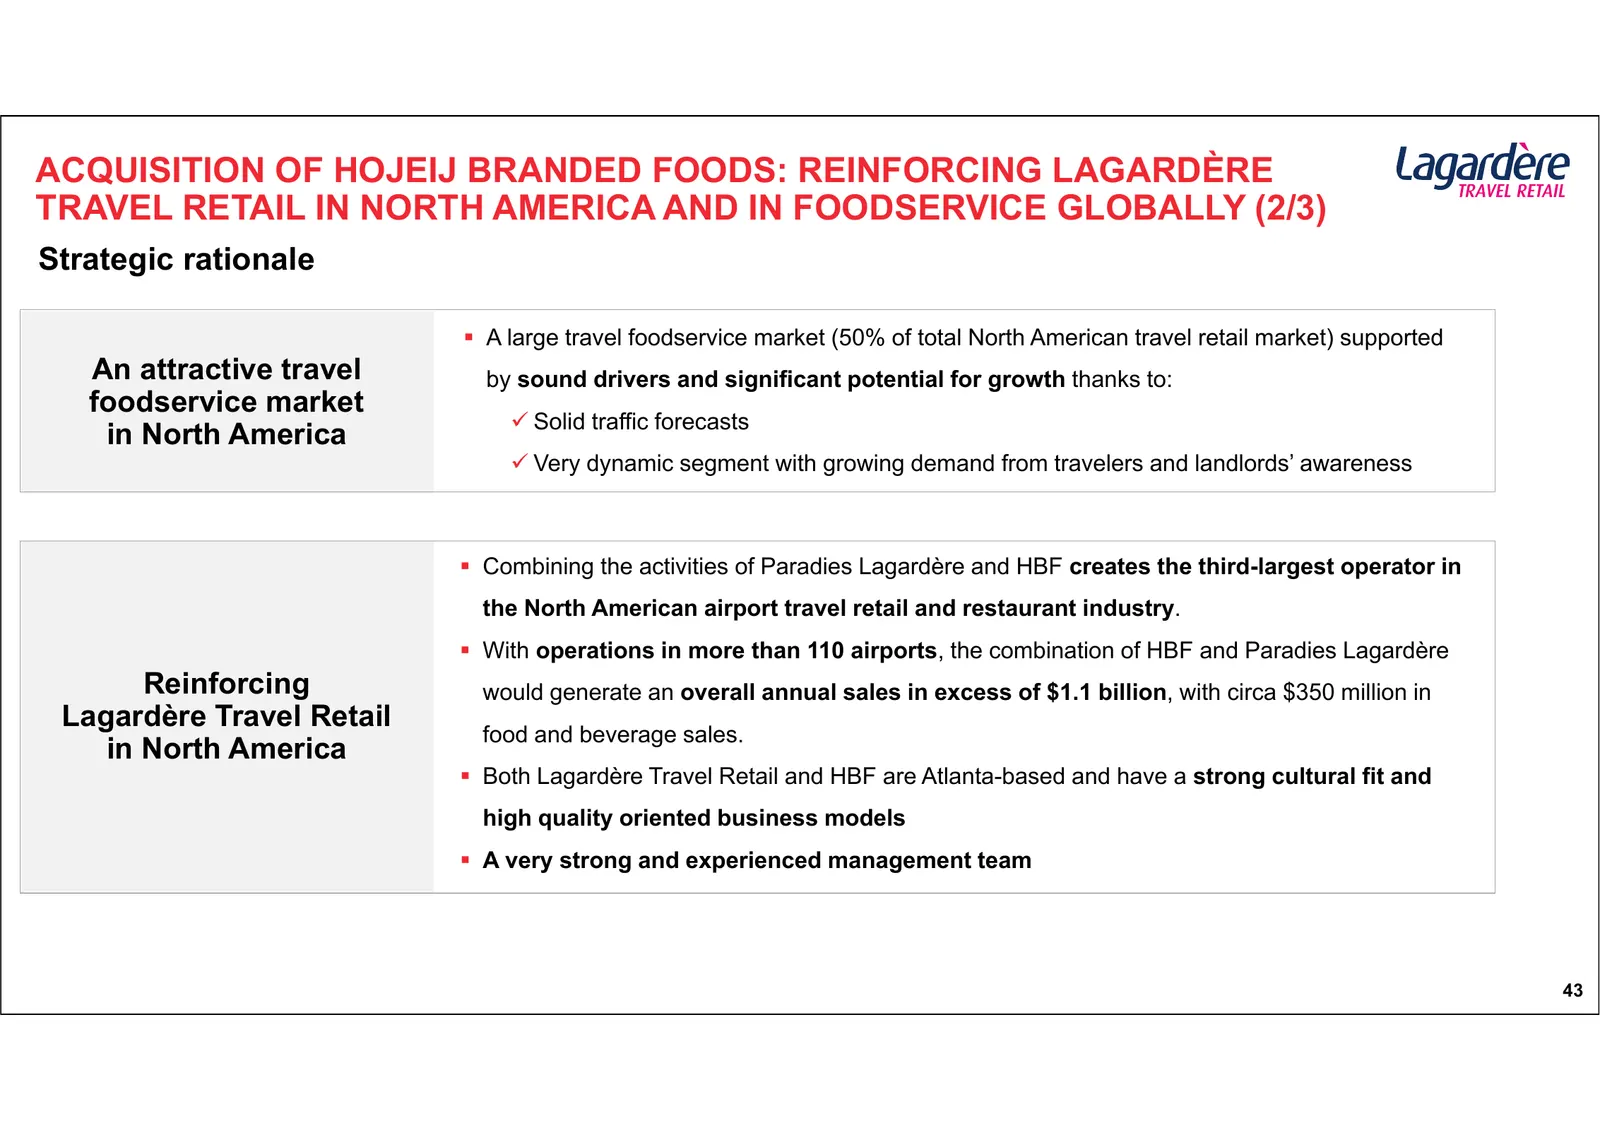
ACQUISITION OF HOJEIJ BRANDED FOODS: REINFORCING LAGARDÈRE TRAVEL RETAIL IN NORTH AMERICA AND IN FOODSERVICE GLOBALLY (2/3) Strategic rationale A large travel foodservice market (50% of total North American travel retail market) supported An attractive travel by sound drivers and significant poten
Slide 44: Acquisition of Hojeij Branded Foods (3/3)
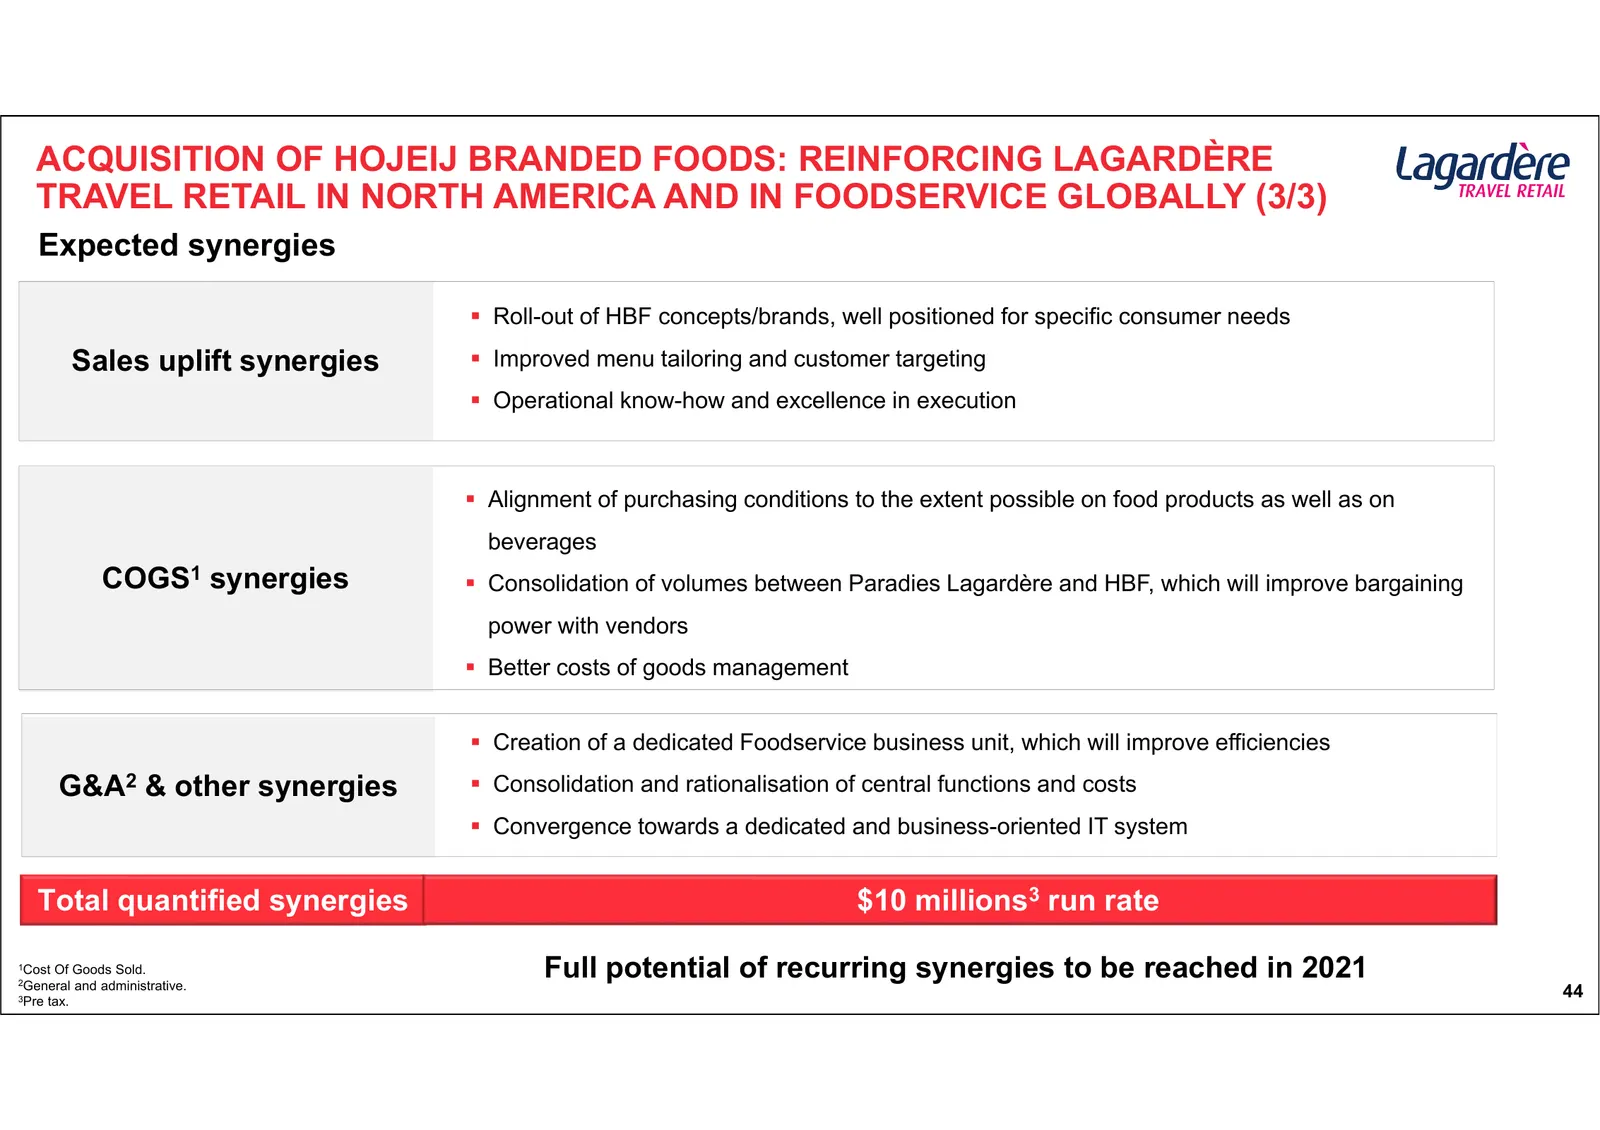
ACQUISITION OF HOJEIJ BRANDED FOODS: REINFORCING LAGARDÈRE TRAVEL RETAIL IN NORTH AMERICA AND IN FOODSERVICE GLOBALLY (3/3) Expected synergies Roll-out of HBF concepts/brands, well positioned for specific consumer needs Sales uplift synergies Improved menu tailoring and customer targeting Oper
Slide 45: Abu Dhabi International Airport: a major step in Middle-East
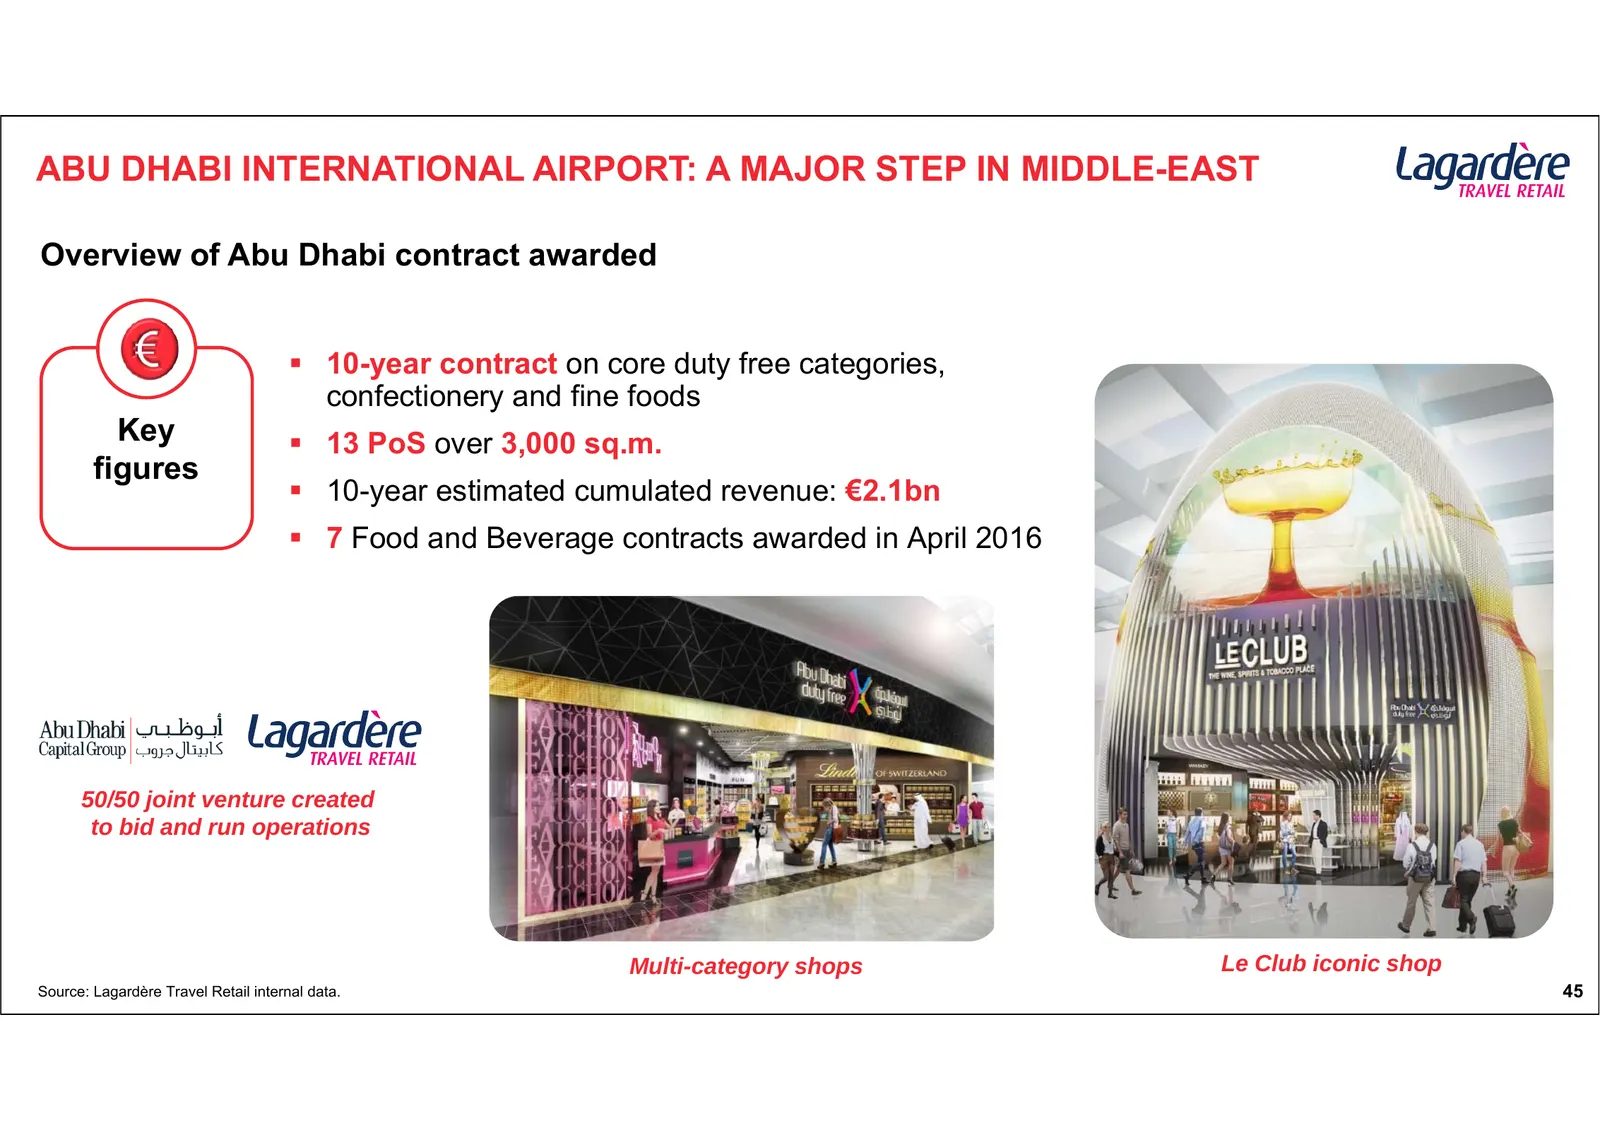
ABU DHABI INTERNATIONAL AIRPORT: A MAJOR STEP IN MIDDLE-EAST Overview of Abu Dhabi contract awarded 10-year contract on core duty free categories, confectionery and fine foods Key 13 PoS over 3,000 sq.m. figures 10-year estimated cumulated revenue: €2.1bn 7 Food and Beverage contracts awarde
Slide 46: Key features and ratios of tender offers in the airport travel retail environment
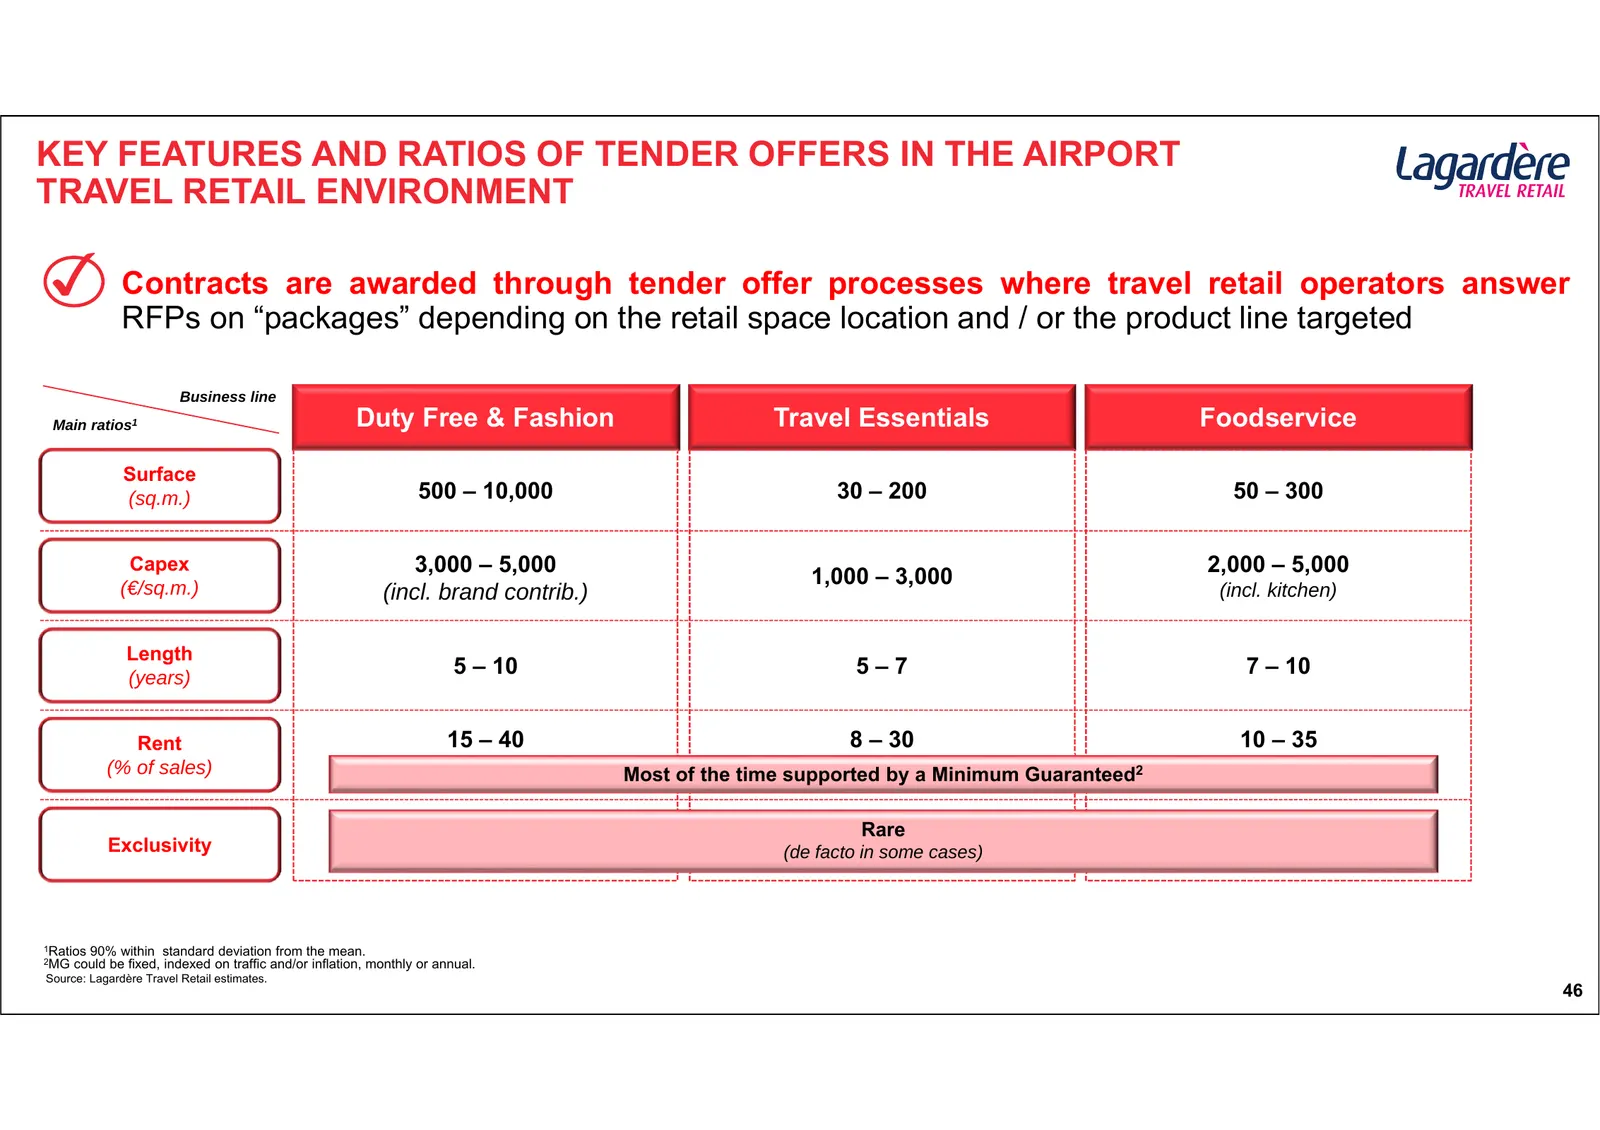
KEY FEATURES AND RATIOS OF TENDER OFFERS IN THE AIRPORT TRAVEL RETAIL ENVIRONMENT ✓ Contracts are awarded through tender offer processes where travel retail operators answer RFPs on “packages” depending on the retail space location and / or the product line targeted Business line Main ratios1 Duty F
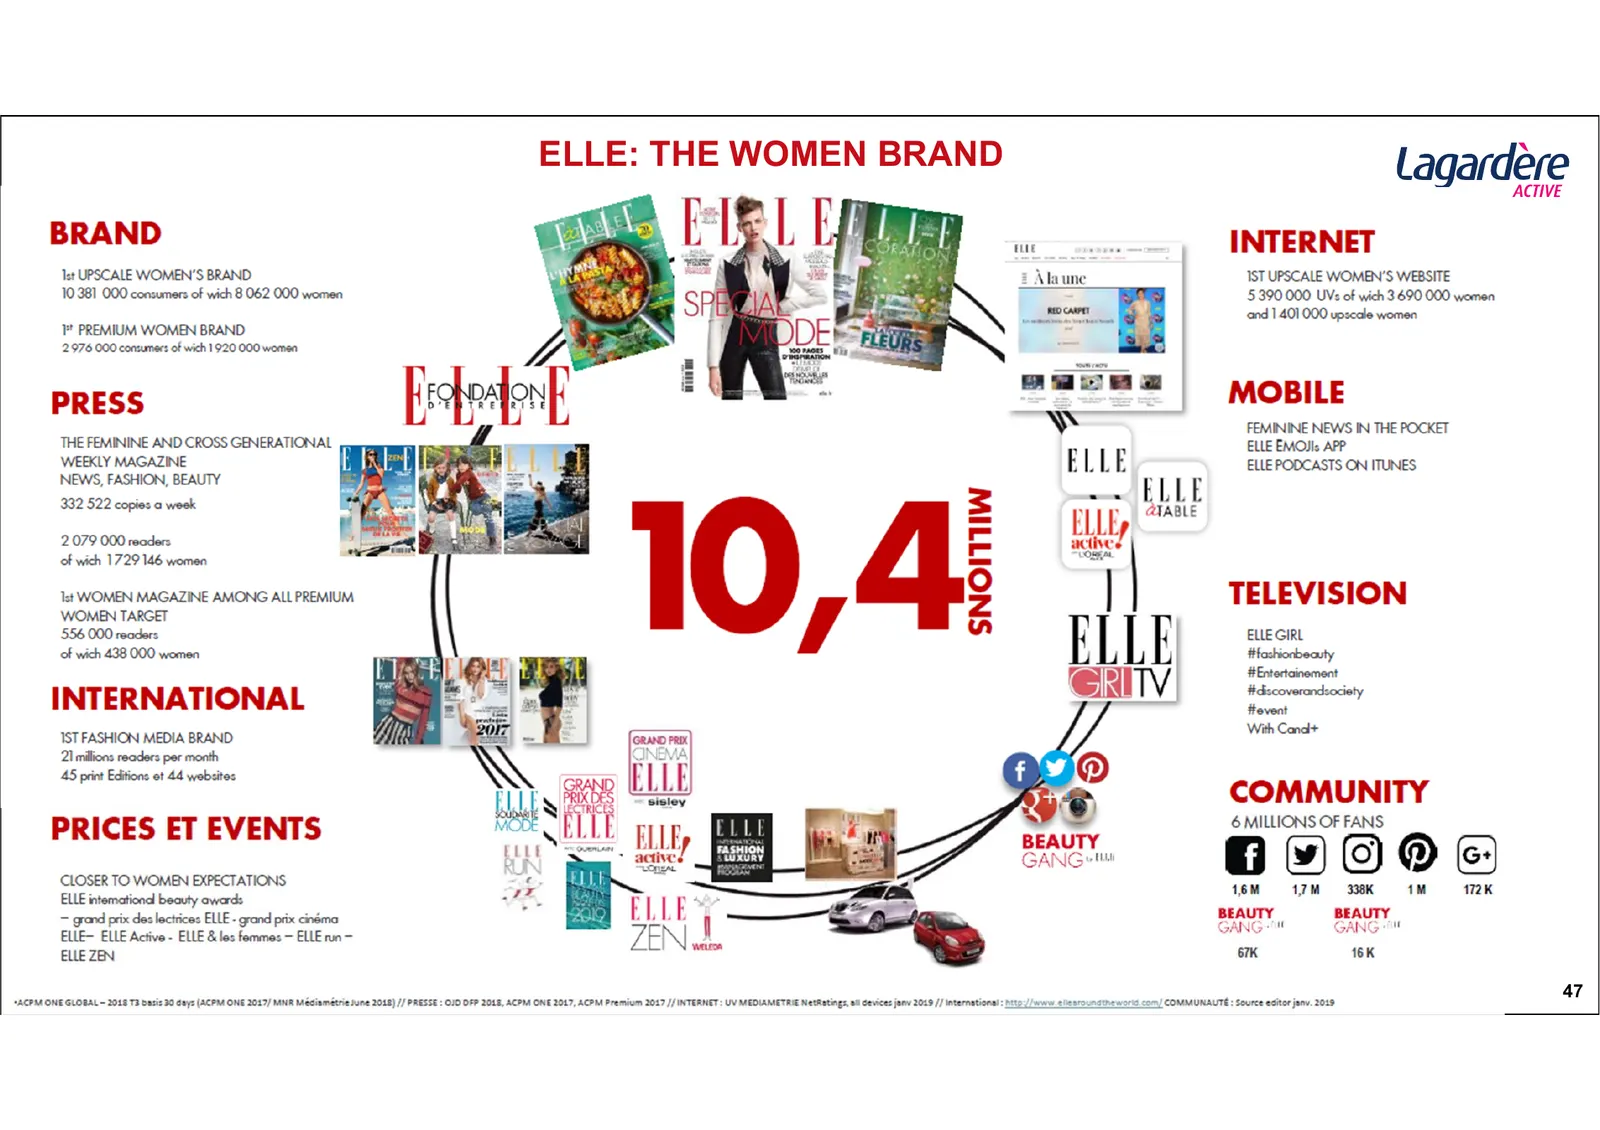
Slide 47: Elle: the women brand
ELLE: THE WOMEN BRAND BRAND Tue et UPSCALE WOMEN’S BRAND nase 10 381 000 consumers of wich 8 062 000 women (RED CAMP 1" PREMIUM WOMEN BRAND ee 2.976 000 consumers of wich 1920 000 women AED ew PRESS THE FEMININE AND CROSS GENERATIONAL 7 1 WEEKLY MAGAZINE ELLE NEWS, FASHION, BEAUTY k | | 332 522 copi
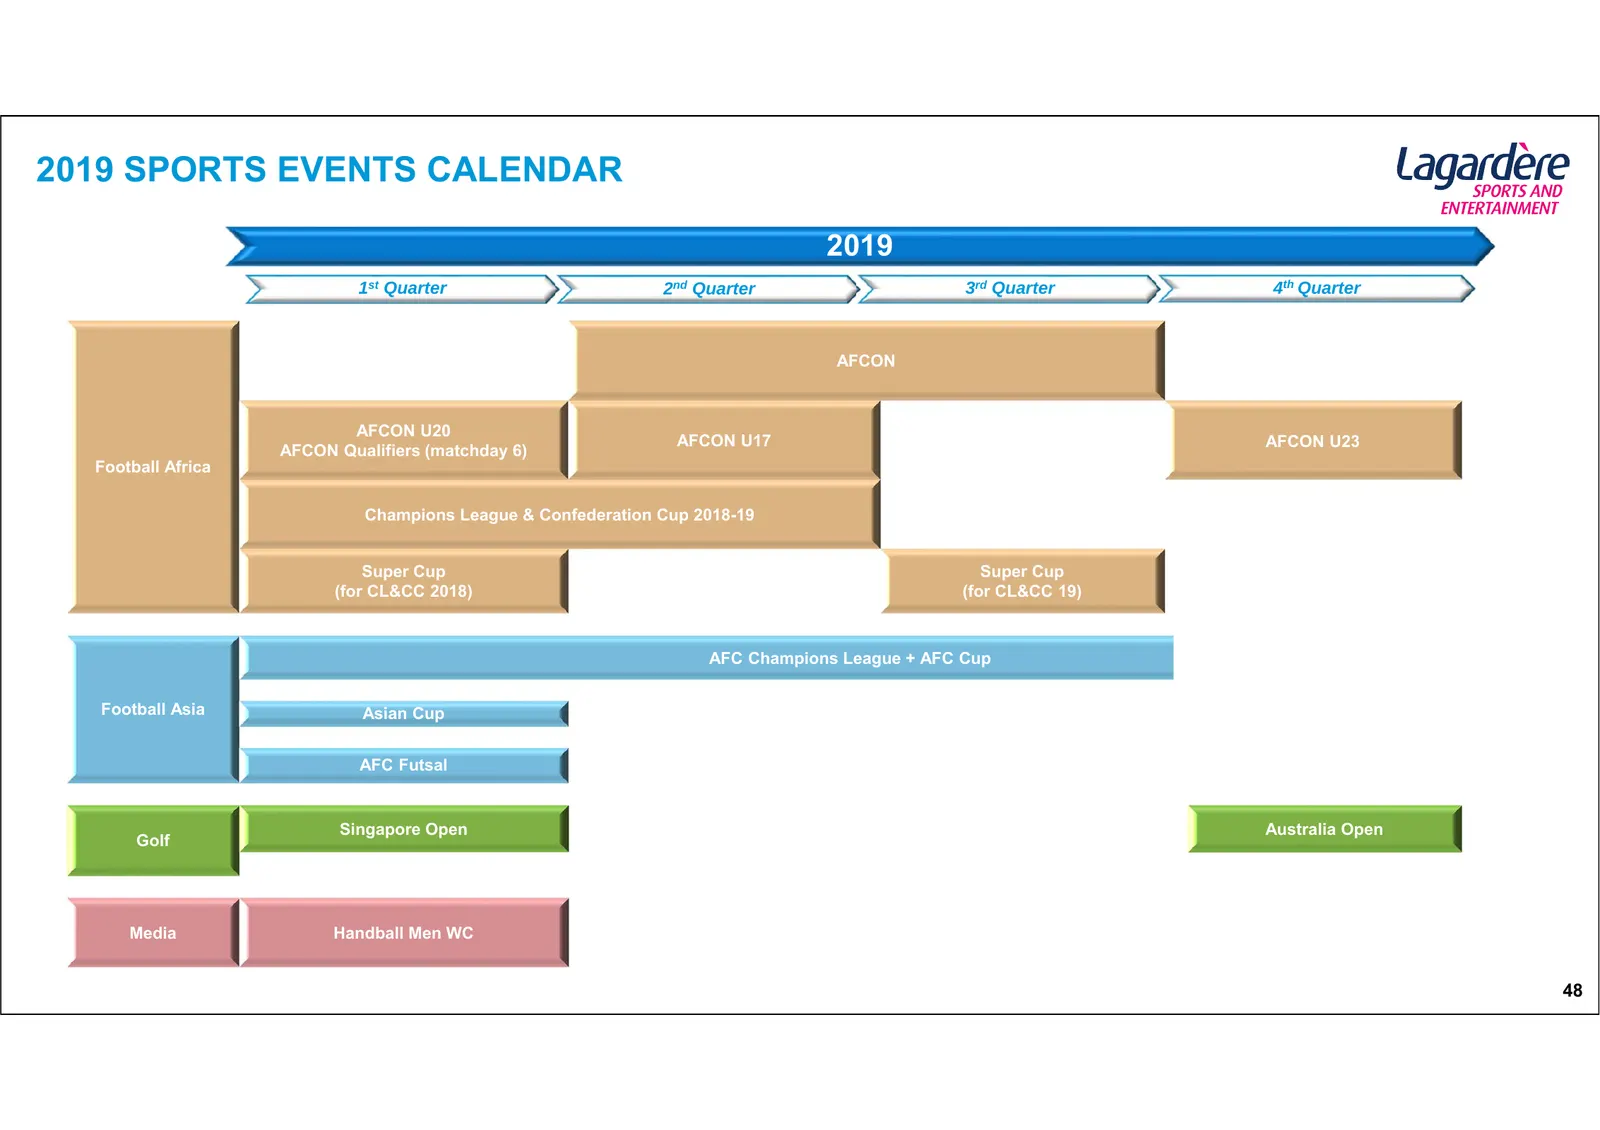
Slide 48: 2019 sports events calendar
2019 SPORTS EVENTS CALENDAR 2019 1st Quarter 2nd Quarter 3rd Quarter 4th Quarter AFCON AFCON U20 AFCON U17 AFCON U23 AFCON Qualifiers (matchday 6) Football Africa Champions League & Confederation Cup 2018-19 Super Cup Super Cup (for CL&CC 2018) (for CL&CC 19) AFC Champions League + AFC Cup Football

Slide 49: Appendix: Financial Updates
APPENDIX: FINANCIAL UPDATES
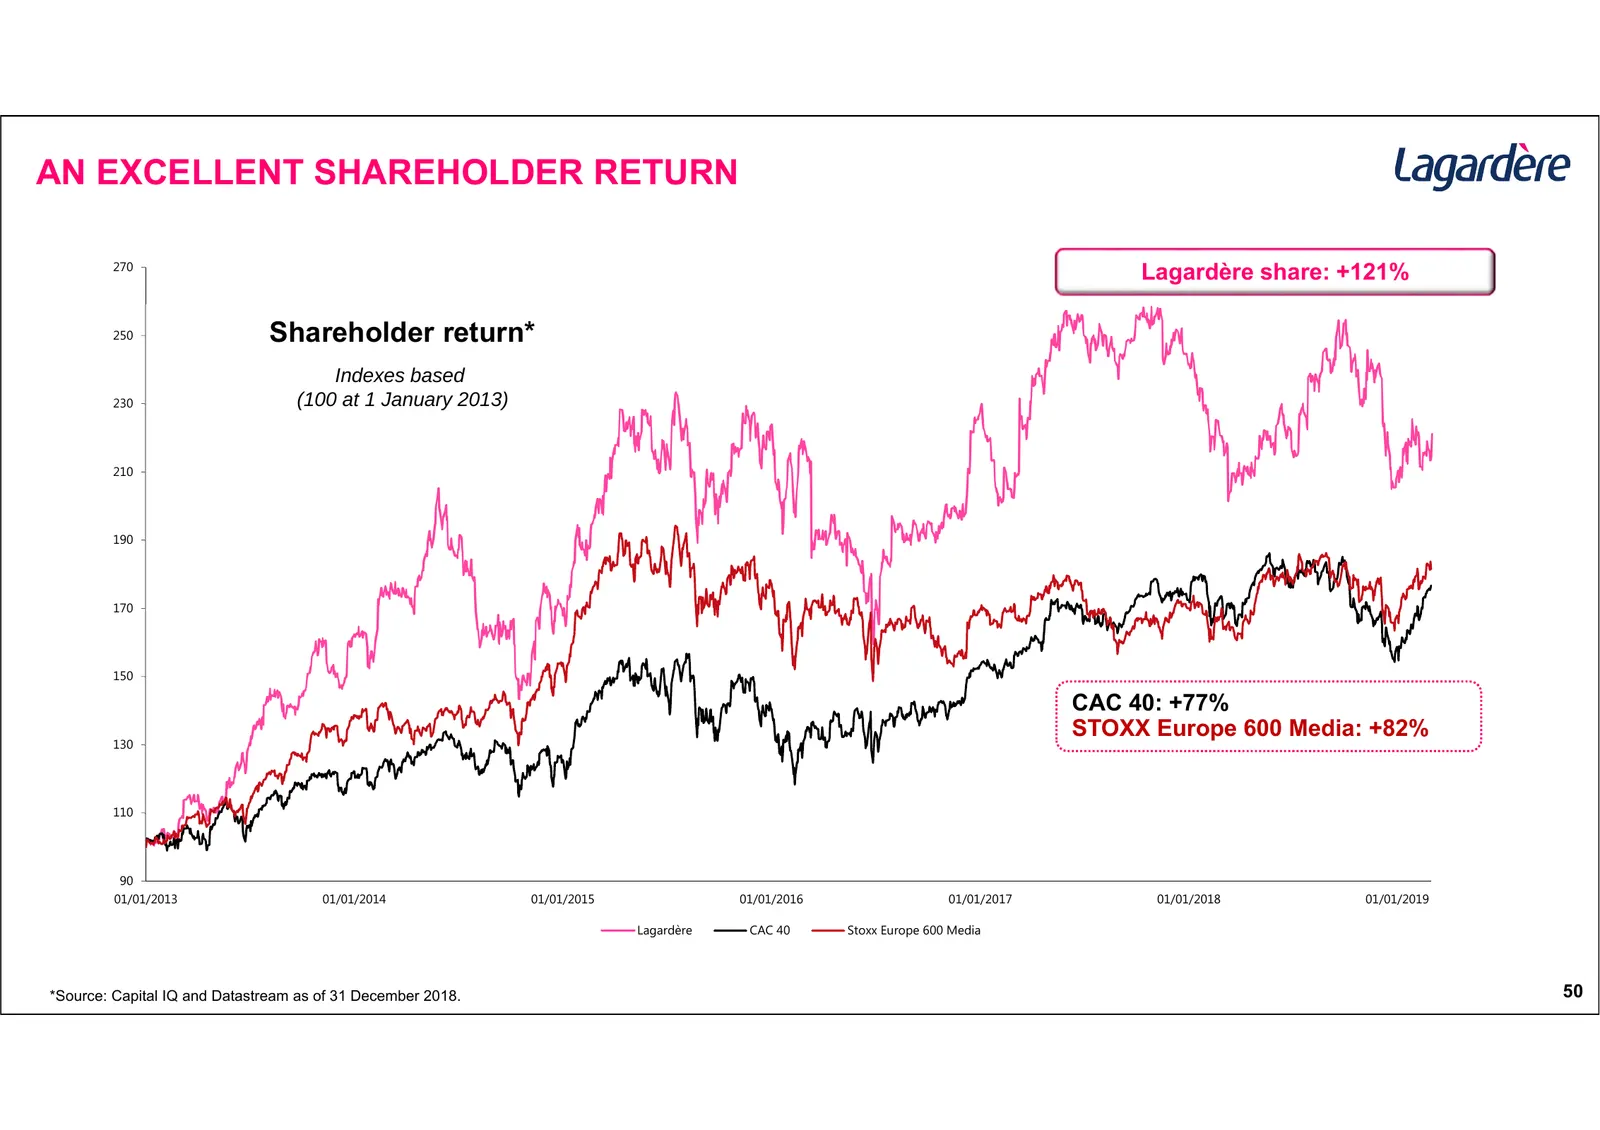
Slide 50: An excellent shareholder return
AN EXCELLENT SHAREHOLDER RETURN 270 Lagardère share: +121% 250 Shareholder return* Indexes based 230 (100 at 1 January 2013) 210 190 170 150 CAC 40: +77% STOXX Europe 600 Media: +82% 130 110 90 01/01/2013 01/01/2014 01/01/2015 01/01/2016 01/01/2017 01/01/2018 01/01/2019 Lagardère CAC 40 Stoxx Europe
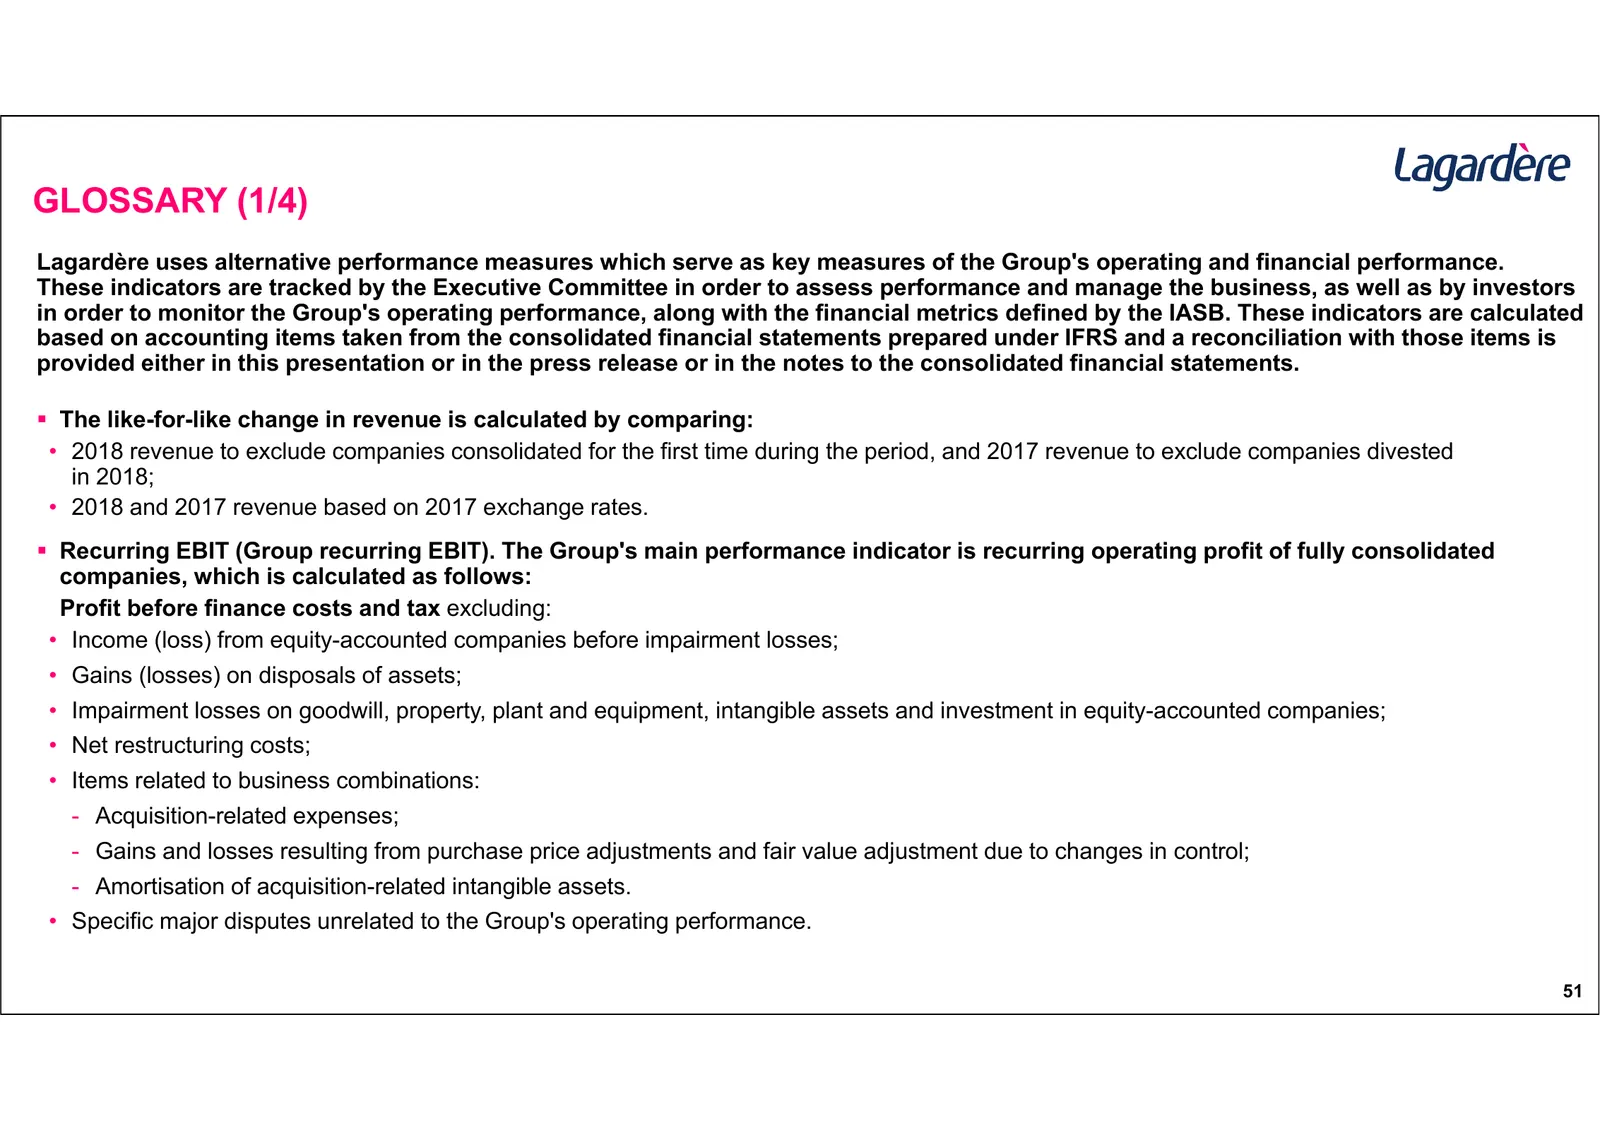
Slide 51: Glossary (1/4)
GLOSSARY (1/4) Lagardère uses alternative performance measures which serve as key measures of the Group's operating and financial performance. These indicators are tracked by the Executive Committee in order to assess performance and manage the business, as well as by investors in order to monitor t
Slide 52: Glossary (2/4)
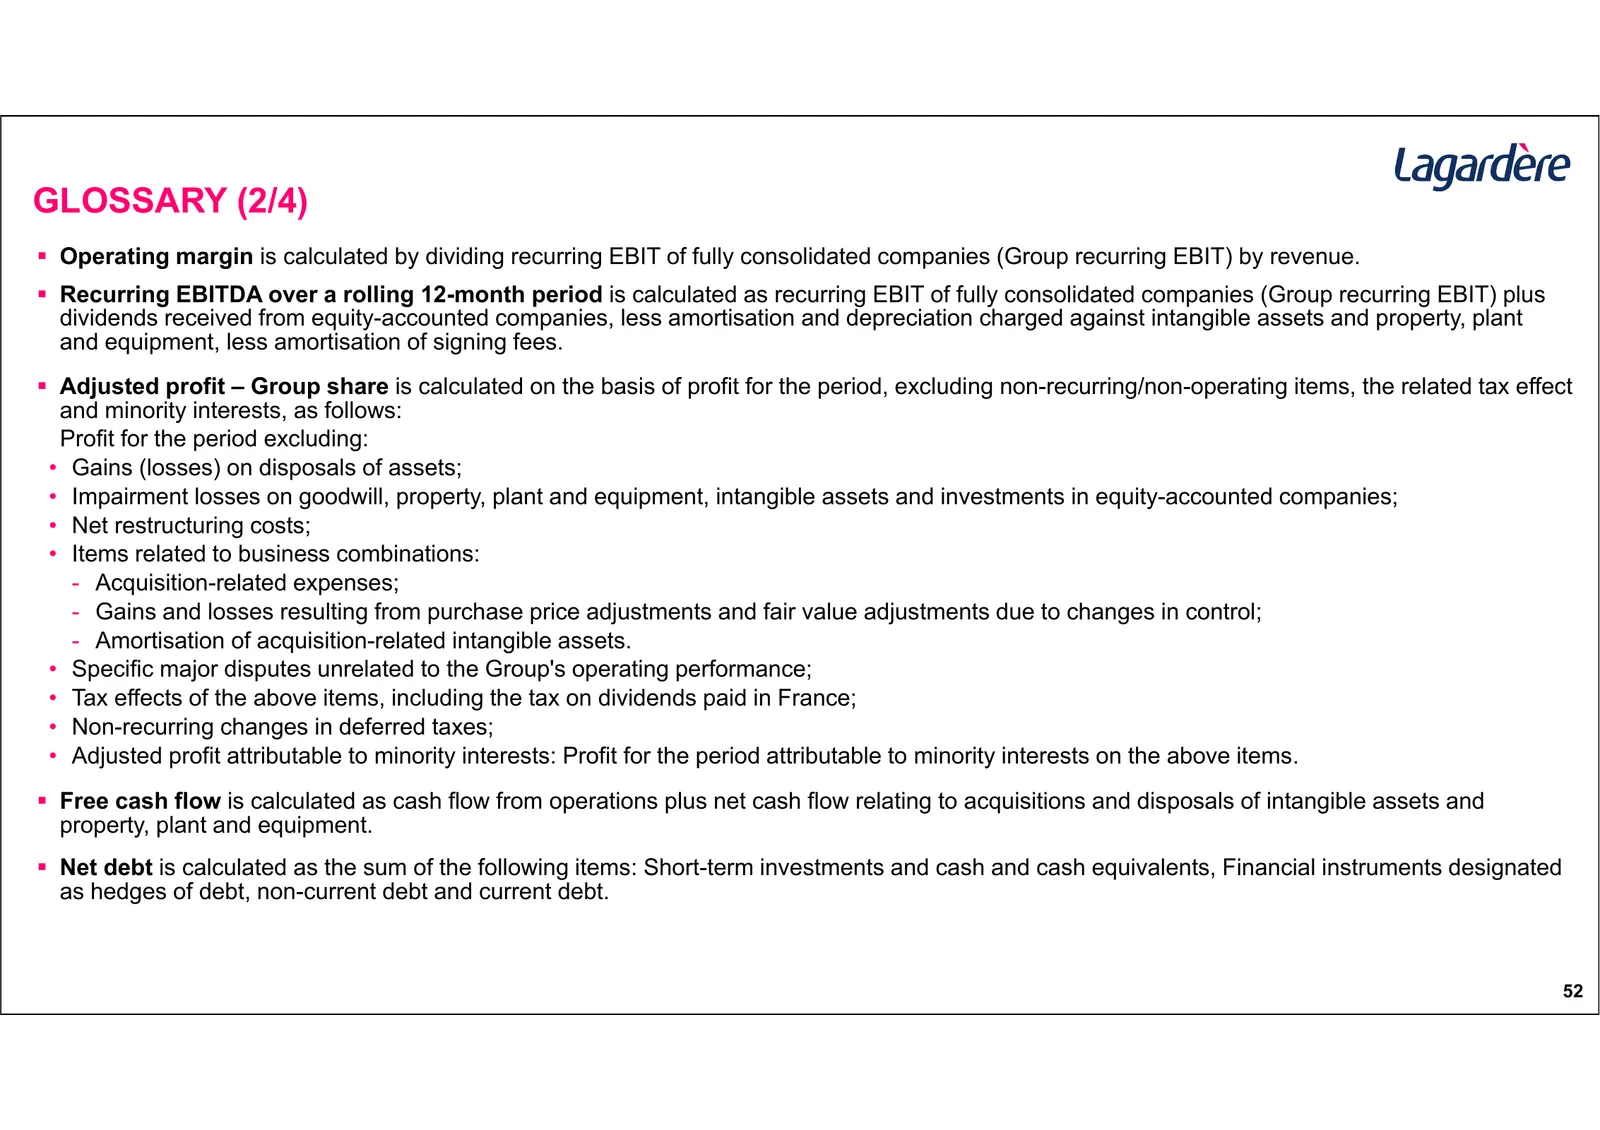
GLOSSARY (2/4) Operating margin is calculated by dividing recurring EBIT of fully consolidated companies (Group recurring EBIT) by revenue. Recurring EBITDA over a rolling 12-month period is calculated as recurring EBIT of fully consolidated companies (Group recurring EBIT) plus dividends receiv
Slide 53: Glossary (3/4)
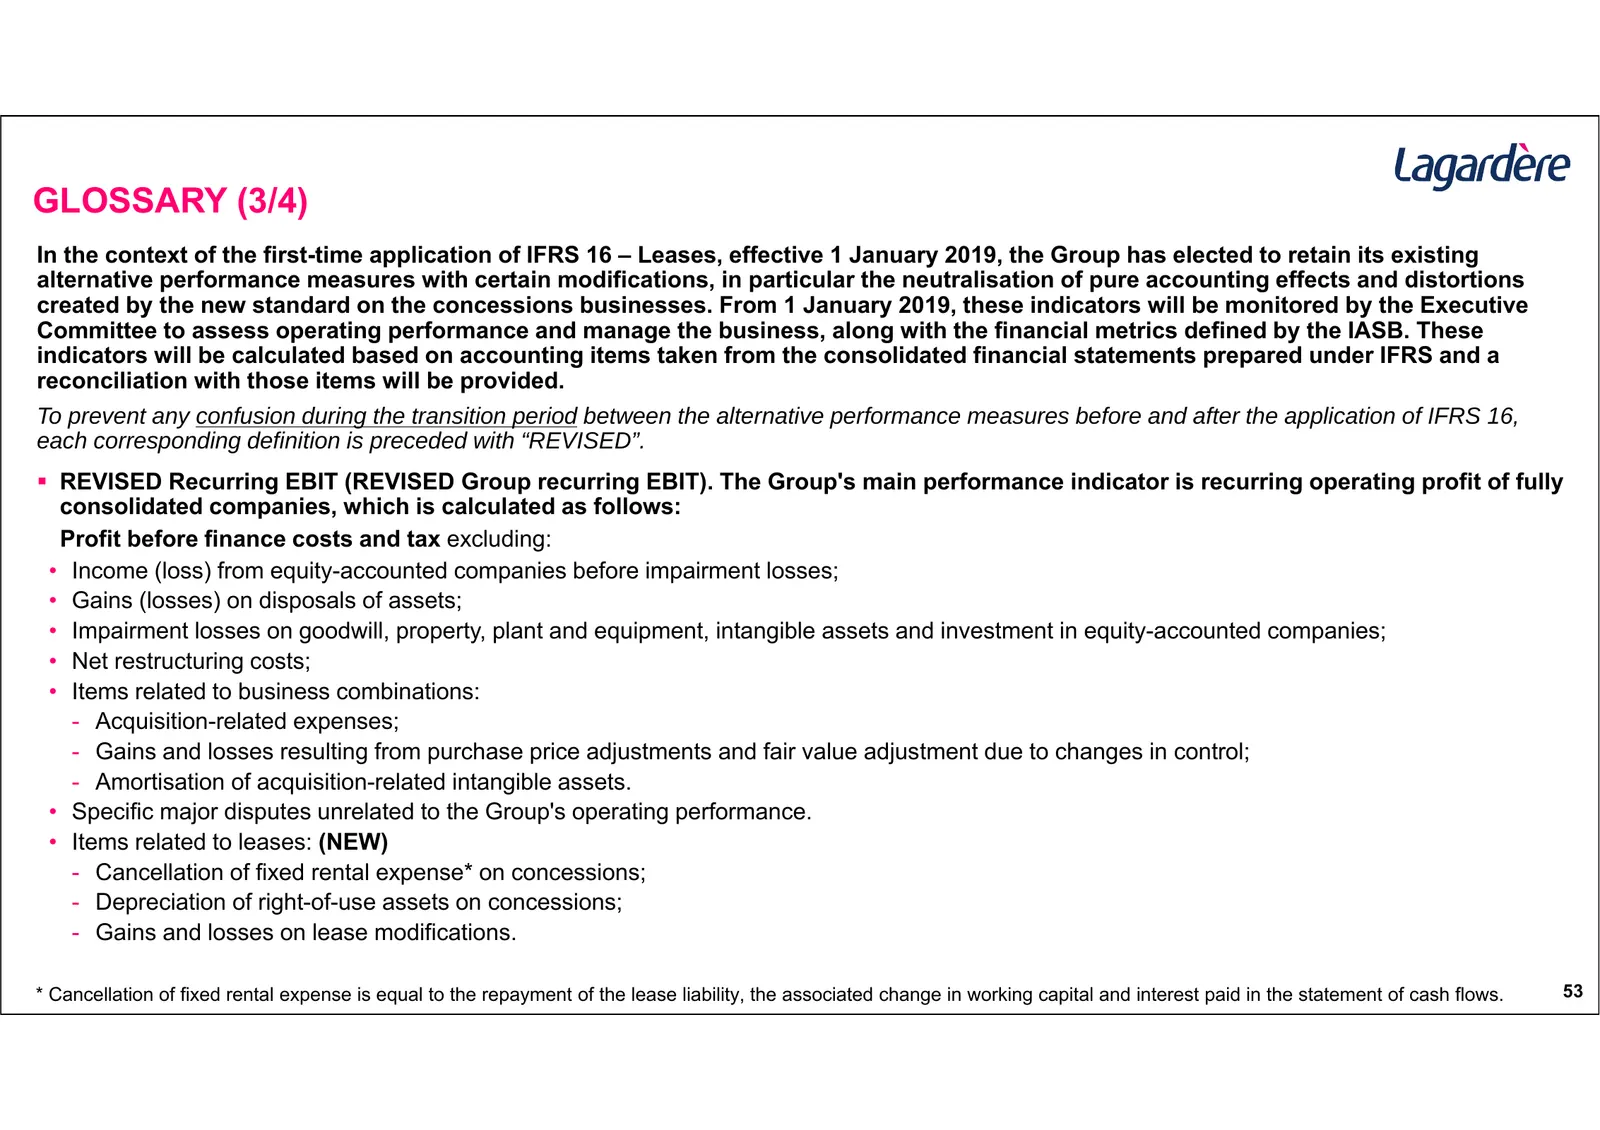
GLOSSARY (3/4) In the context of the first-time application of IFRS 16 – Leases, effective 1 January 2019, the Group has elected to retain its existing alternative performance measures with certain modifications, in particular the neutralisation of pure accounting effects and distortions created by
Slide 54: Glossary (4/4)
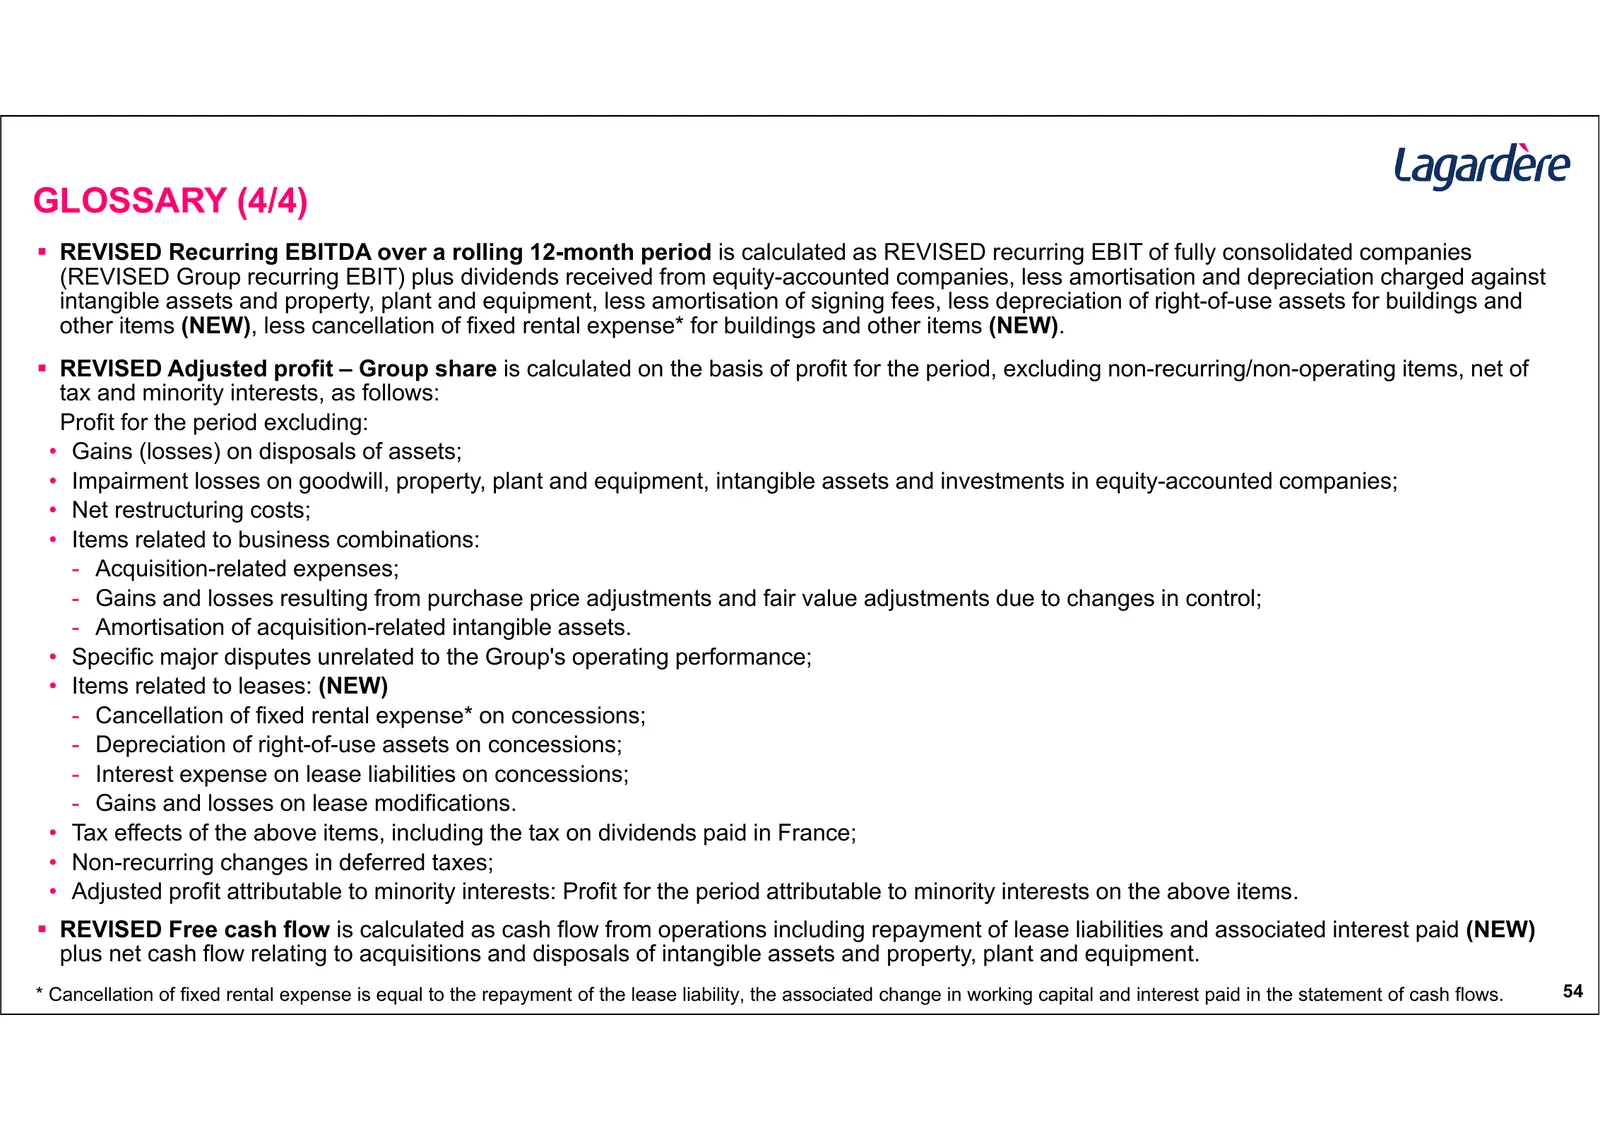
GLOSSARY (4/4) REVISED Recurring EBITDA over a rolling 12-month period is calculated as REVISED recurring EBIT of fully consolidated companies (REVISED Group recurring EBIT) plus dividends received from equity-accounted companies, less amortisation and depreciation charged against intangible asset
Slide 55: Lagardère IR Team
LAGARDÈRE IR TEAM IR team details Calendar* (all time is CET) Florence Lonis • Publication of Q1 2019 revenue 7 May 2019 at 8:00 a.m. Chief of Investor Relations Tel: +33 1 40 69 18 02 flonis@lagardere.fr • Publication of H1 2019 results 25 July 2019 at 5:35 p.m. Dounia Amouch Investor Relations Off
Source: Internet Archive copy of lagardere.com
More decks from Lagardere SA
 Debt Investor Presentation (September 2026)47 slides · September 2026
 H1 2026 Earnings Presentation36 slides · Jul 28, 2026
 Shareholder Meeting (May 2026)101 slides · May 5, 2026
 Shareholder Meeting (May 2026)101 slides · May 5, 2026
 Q1 2026 Earnings Presentation14 slides · Apr 16, 2026
 FY2025 Earnings Presentation44 slides · Feb 19, 2026