EP Energy — Citi 2013 Global Energy and Utilities Conference
14 slides from EP Energy's conference presentation, May 14, 2013
Slide 1: Citi 2013 Global Energy and Utilities Conference
EPE Graphic.pngEP Energy Citi 2013 Global Energy and Utilities Conference Dane Whitehead Executive Vice President and Chief Financial Officer May 14, 2013
Slide 2: Cautionary Statement Regarding Forward-Looking Statements
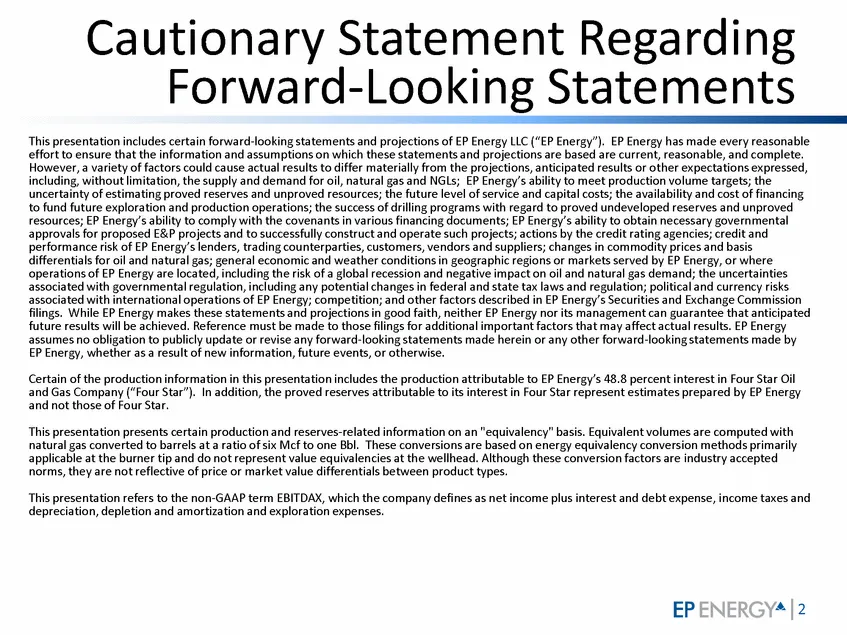
2 EP Energy Cautionary Statement Regarding Forward-Looking Statements This presentation includes certain forward-looking statements and projections of EP Energy LLC (“EP Energy”). EP Energy has made every reasonable effort to ensure that the information and assumptions on which these statements and
Slide 3: Purpose: What We Do
3 EP Energy Purpose: What We Do At EP Energy, we have a passion for finding and producing the oil and natural gas that enriches people's lives
Slide 4: Investment Thesis
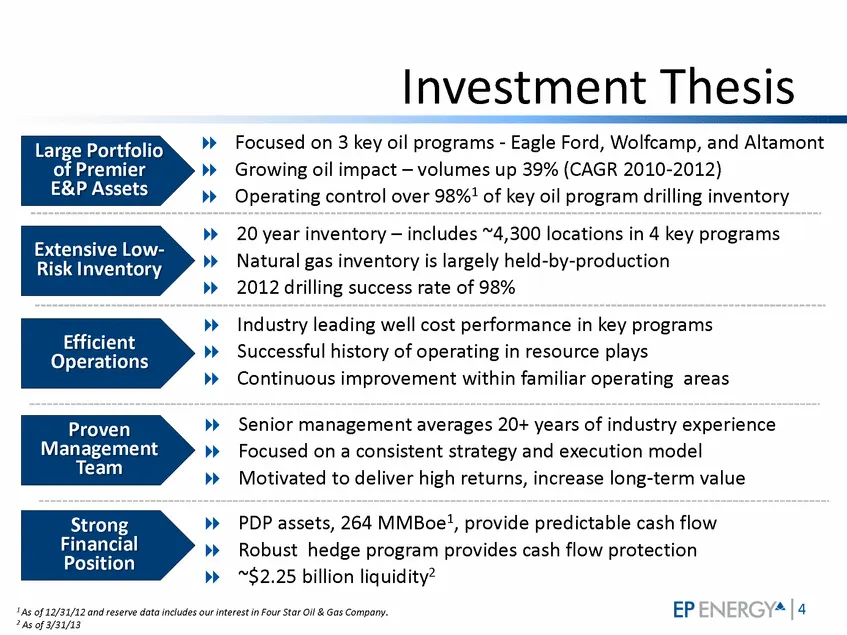
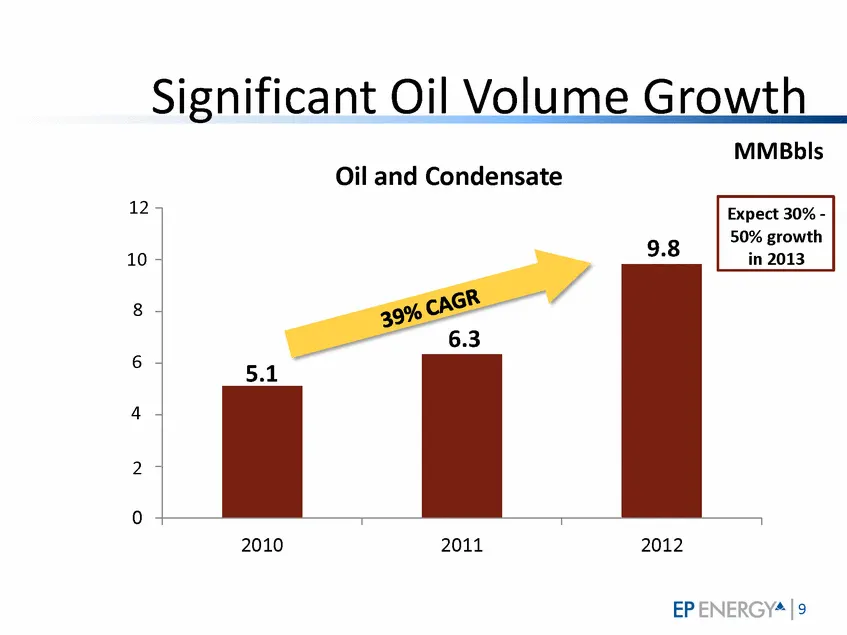
4 EP Energy Investment Thesis .Focused on 3 key oil programs - Eagle Ford, Wolfcamp, and Altamont .Growing oil impact – volumes up 39% (CAGR 2010-2012) .Operating control over 98%1 of key oil program drilling inventory .20 year inventory – includes ~4,300 locations in 4 key programs .Natural gas inv
Slide 5: Reserves and Production by Program
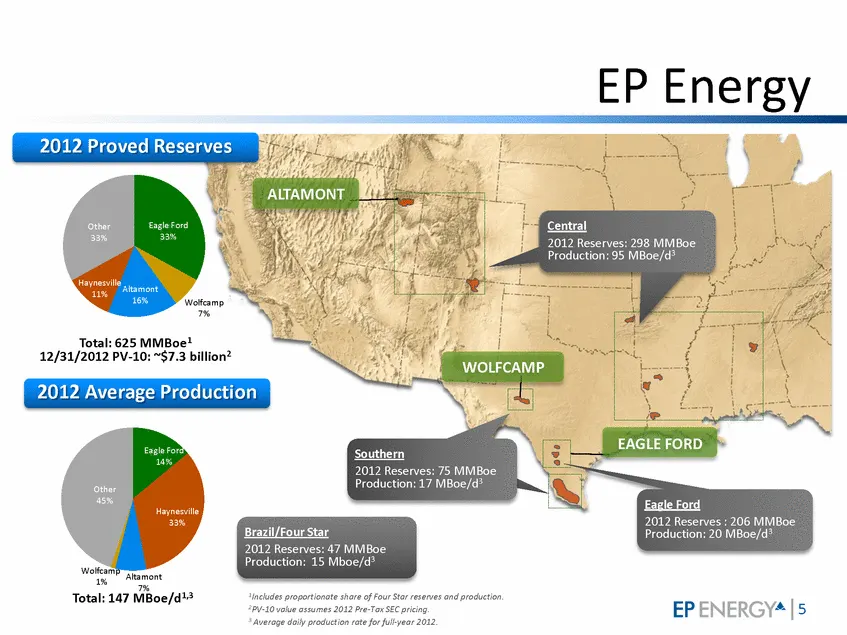
5 EP Energy EAGLE FORD ALTAMONT WOLFCAMP Central 2012 Reserves: 298 MMBoe Production: 95 MBoe/d3 Southern 2012 Reserves: 75 MMBoe Production: 17 MBoe/d3 Brazil/Four Star 2012 Reserves: 47 MMBoe Production: 15 Mboe/d3 Eagle Ford 2012 Reserves : 206 MMBoe Production: 20 MBoe/d3 2012 Proved Reserves To
Slide 6: Accelerating Portfolio Shift to Oil
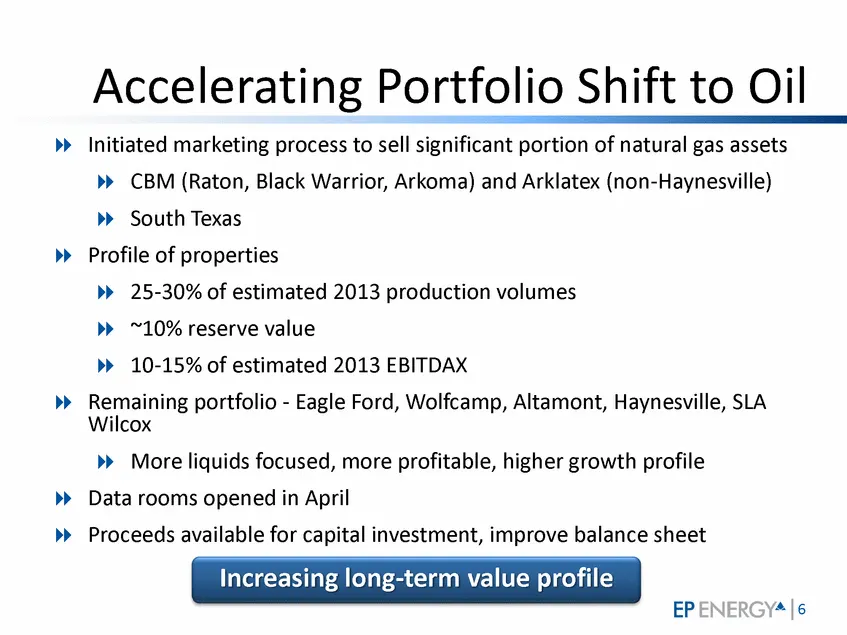
6 EP Energy Accelerating Portfolio Shift to Oil Increasing long-term value profile .Initiated marketing process to sell significant portion of natural gas assets .CBM (Raton, Black Warrior, Arkoma) and Arklatex (non-Haynesville) .South Texas .Profile of properties .25-30% of estimated 2013 productio
Slide 7: Key Programs Provide Multi-Year Drilling Opportunity
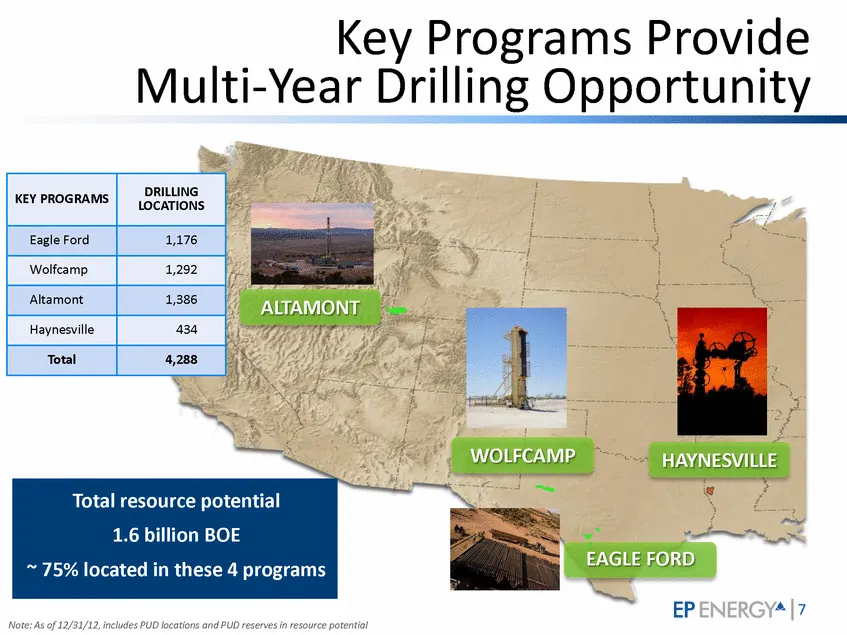
7 EP Energy Key Programs Provide Multi-Year Drilling Opportunity Note: As of 12/31/12, includes PUD locations and PUD reserves in resource potential KEY PROGRAMS DRILLING LOCATIONS Eagle Ford 1,176 Wolfcamp 1,292 Altamont 1,386 Haynesville 434 Total 4,288 Altamont Eagle Ford ALTAMONT WOLFCAMP EAGLE
Slide 8: Investments Generating High Returns
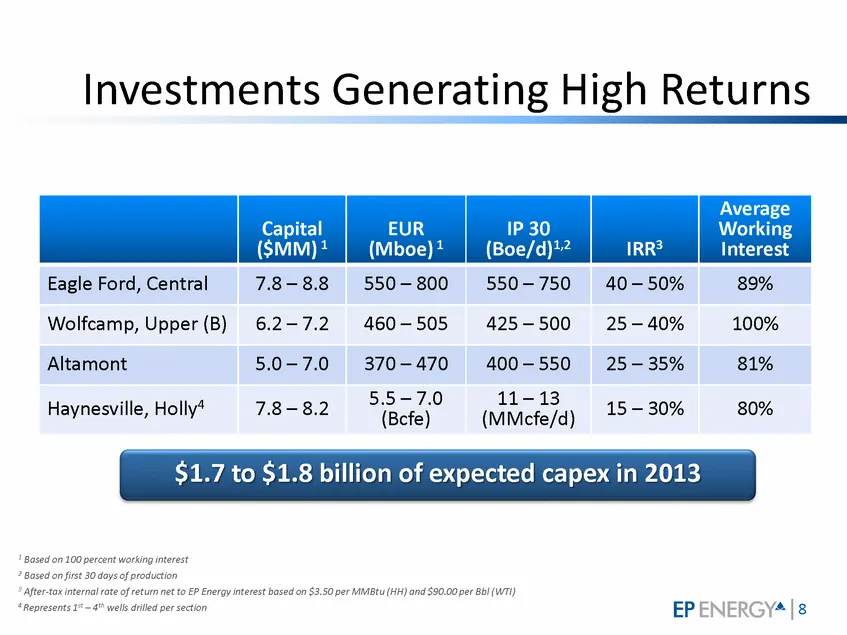
8 EP Energy Investments Generating High Returns Capital ($MM) 1 EUR (Mboe) 1 IP 30 (Boe/d)1,2 IRR3 Average Working Interest Eagle Ford, Central 7.8 – 8.8 550 – 800 550 – 750 40 – 50% 89% Wolfcamp, Upper (B) 6.2 – 7.2 460 – 505 425 – 500 25 – 40% 100% Altamont 5.0 – 7.0 370 – 470 400 – 550 25 – 35% 8
Slide 9: Significant Oil Volume Growth
9 EP Energy Significant Oil Volume Growth 2010 2011 2012 5.1 6.3 9.8 MMBbls Oil and Condensate 39% CAGR Expect 30% - 50% growth in 2013 2 4 6 8 10 12
Slide 10: 1Q'13 Highlights
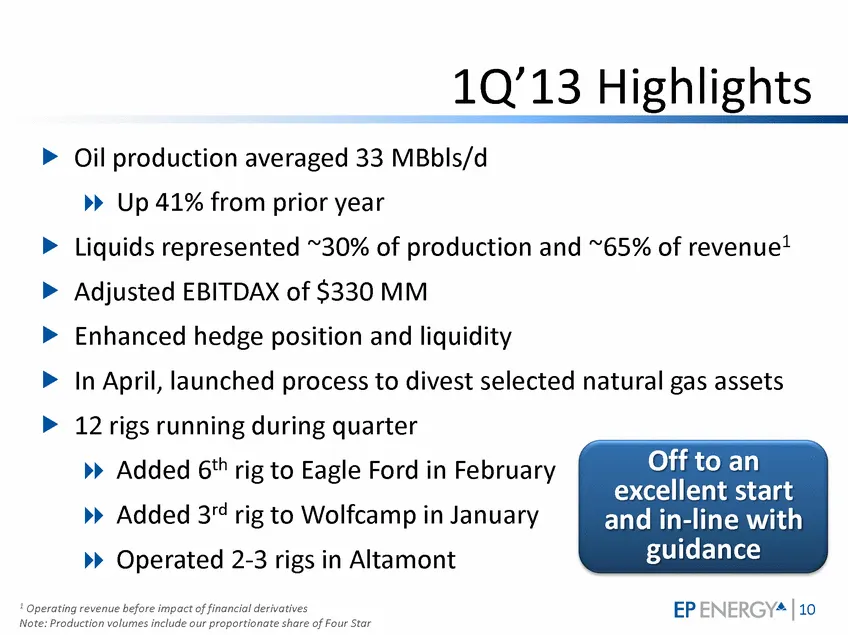
10 EP Energy 1Q’13 Highlights .Oil production averaged 33 MBbls/d .Up 41% from prior year .Liquids represented ~30% of production and ~65% of revenue1 .Adjusted EBITDAX of $330 MM .Enhanced hedge position and liquidity .In April, launched process to divest selected natural gas assets .12 rigs runnin
Slide 11: Favorable Crude Oil Hedges
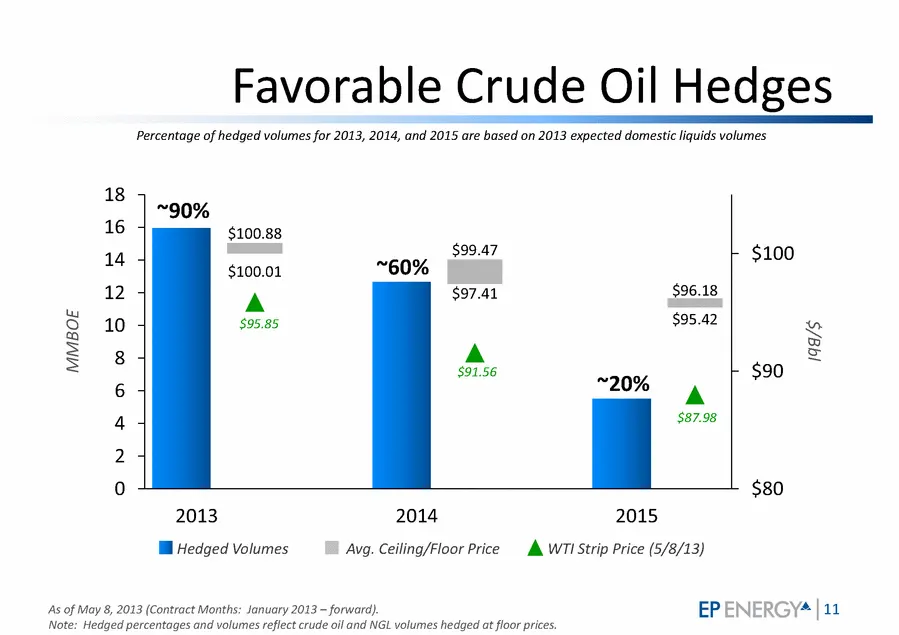
11 EP Energy Favorable Crude Oil Hedges As of May 8, 2013 (Contract Months: January 2013 – forward). Note: Hedged percentages and volumes reflect crude oil and NGL volumes hedged at floor prices. $100.01 $97.41 $95.42 $100.88 $99.47 $96.18 $95.85 $91.56 $87.98 $80 $90 $100 0 2 4 6 8 10 12 14 16 18 2
Slide 12: Natural Gas Hedges Protect Cash Flow
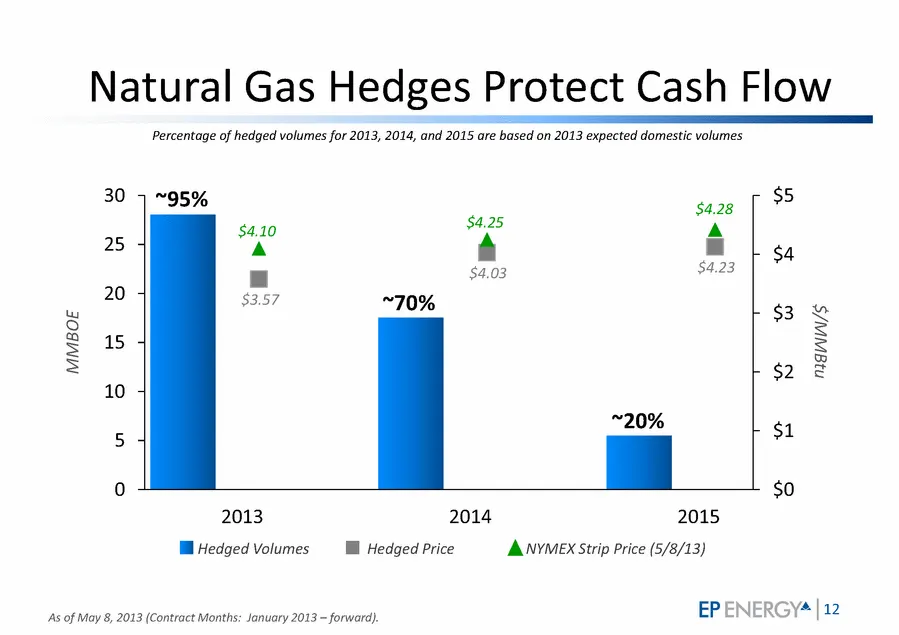
12 EP Energy Natural Gas Hedges Protect Cash Flow As of May 8, 2013 (Contract Months: January 2013 – forward). $3.57 $4.03 $4.23 $4.10 $4.25 $4.28 $0 $1 $2 $3 $4 $5 0 5 10 15 20 25 30 2013 2014 2015 MMBOE $/MMBtu ~95% ~70% ~20% Hedged Volumes Hedged Price NYMEX Strip Price (5/8/13) Percentage of hed
Slide 13: Building Premium Valuation
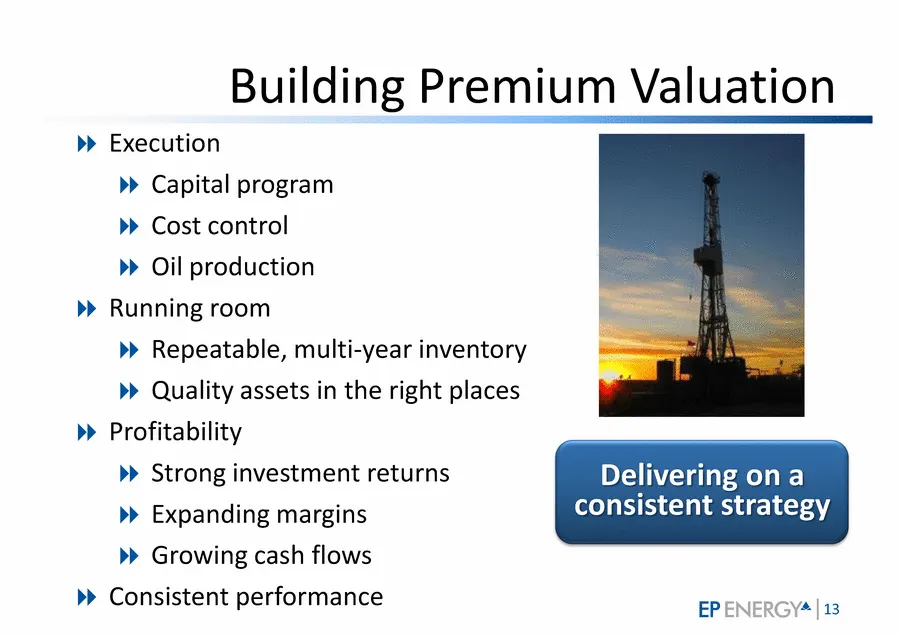
13 EP Energy Building Premium Valuation .Execution .Capital program .Cost control .Oil production .Running room .Repeatable, multi-year inventory .Quality assets in the right places .Profitability .Strong investment returns .Expanding margins .Growing cash flows .Consistent performance Delivering on
Slide 14: Citi 2013 Global Energy and Utilities Conference
EP Energy Citi 2013 Global Energy and Utilities Conference Dane Whitehead Executive Vice President and Chief Financial Officer May 14, 2013
Source: SEC EDGAR · 8-K filed May 14, 2013
More decks from EP Energy Corp
 Presentation (January 2020)6 slides · Jan 9, 2020
 Investor Presentation (October 2019)83 slides · Oct 4, 2019
 IPO Roadshow (October 2019)5 slides · Oct 4, 2019
 Investor Presentation (September 2018)11 slides · Sep 5, 2018
 Debt Investor Presentation (May 2018)25 slides · May 17, 2018
 Credit Suisse Energy Summit 201724 slides · Feb 14, 2017