PHX Minerals — Panhandle Oil & Gas — Shareholder Meeting (March 2018)
29 slides from PHX Minerals's shareholder meeting presentation, Mar 6, 2018

Slide 1: Annual Shareholders Meeting
Annual Shareholders Meeting Oklahoma History Center March 7, 2018 — 9:00 am
Slide 2: Forward-Looking Statements and Risk Factors
FORWARD-LOOKING STATEMENTS AND RISK FACTORS This presentation contains projections and other forward-looking statements within the meaning of Section 27A of the U.S. Securities Act of 1933 and Section 21E of the U.S. Securities Exchange Act of 1934. These projections and statements reflect the Compa
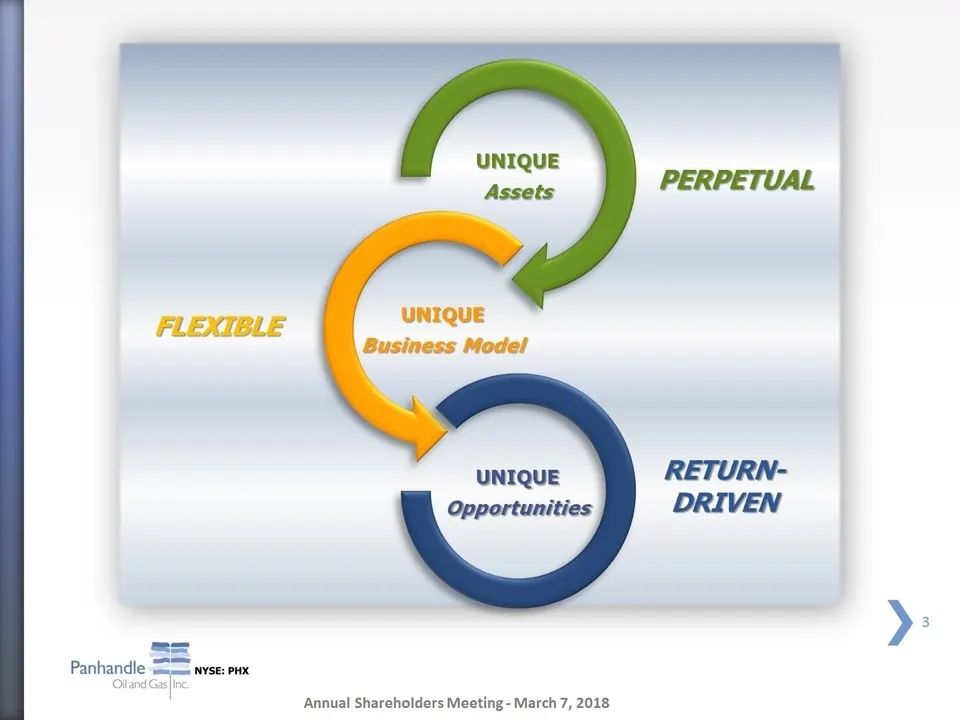
Slide 3: Unique Assets, Unique Opportunities, Perpetual Return-Driven
UNIQUE Assets UNIQUE Opportunities Annual Shareholders Meeting - March 7, 2018 PERPETUAL RETURN- DRIVEN
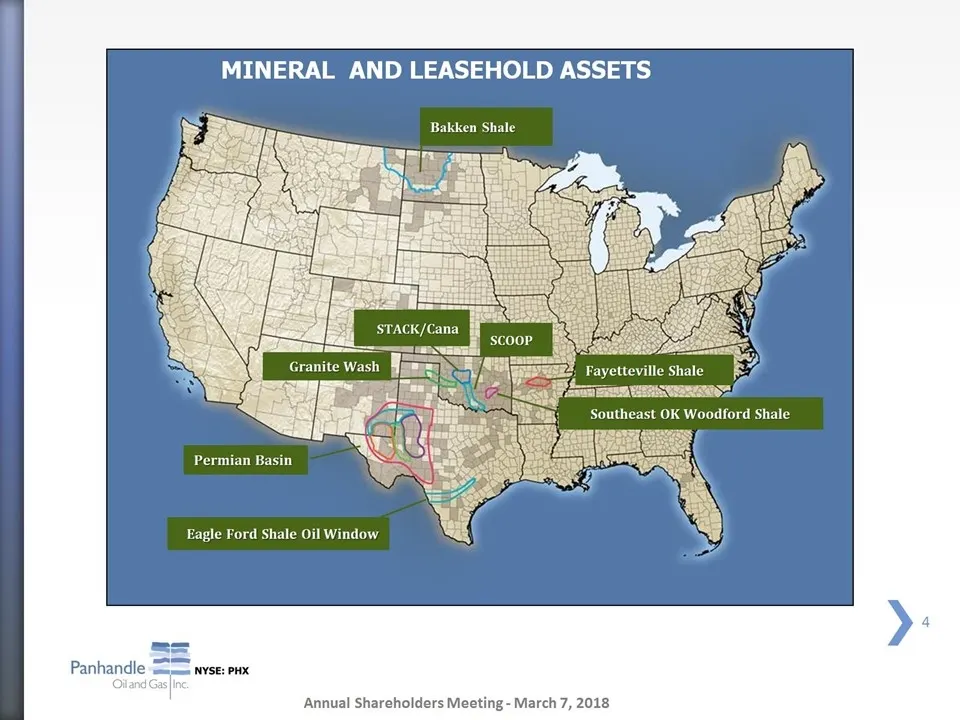
Slide 4: Mineral and Leasehold Assets
MINERAL AND LEASEHOLD ASSETS Bakken Shale teville Shale 2 LERNER Southeast OK Woodford Shale Permian Basin Eagle Ford Shale Oil Window Panhandle 3: PHX Annual Shareholders Meeting - March 7, 2018
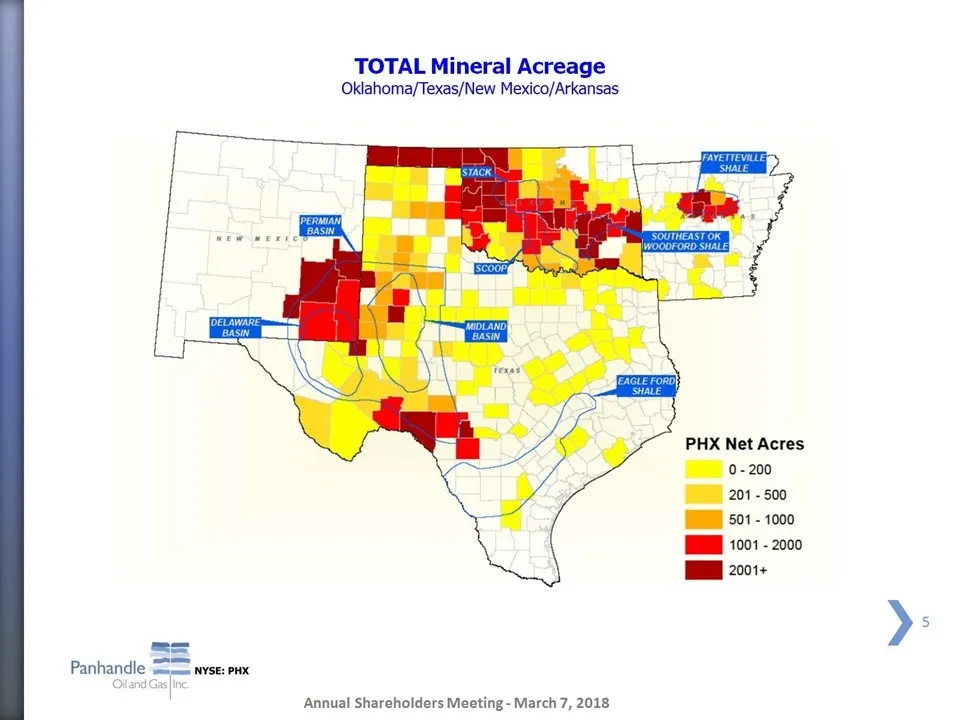
Slide 5: Total Mineral Acreage
TOTAL Mineral Acreage Oklahoma/Texas/New Mexico/Arkansas PHX Net Acres Annual Shareholders Meeting - March 7, 2018
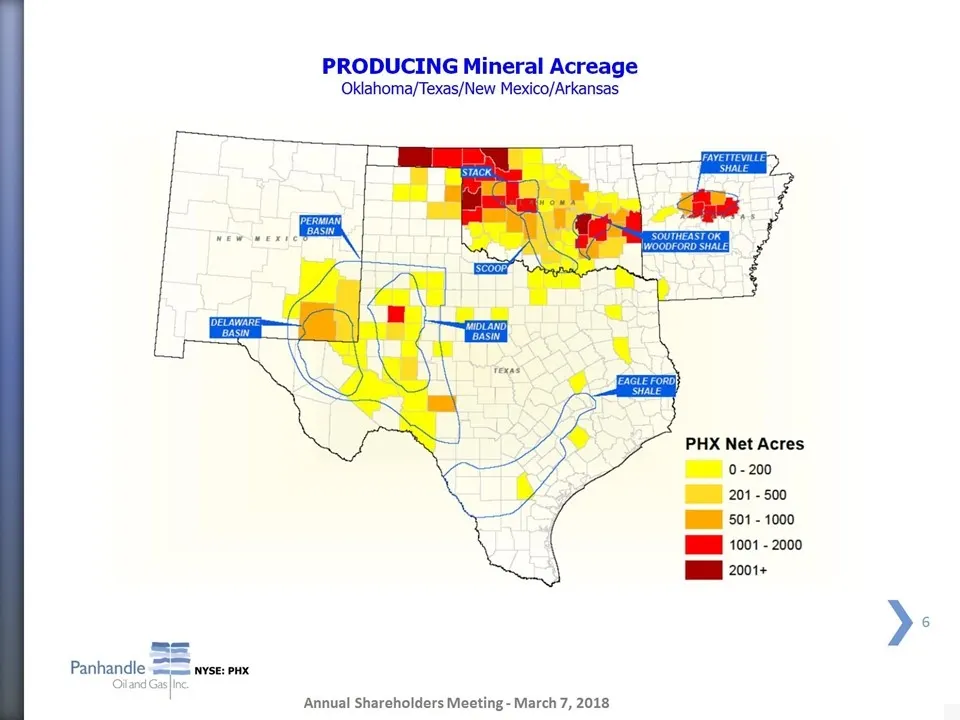
Slide 6: Producing Mineral Acreage
PRODUCING Mineral Acreage Oklahoma/Texas/New Mexico/Arkansas Annual Shareholders Meeting - March 7, 2018 PHX Net Acres
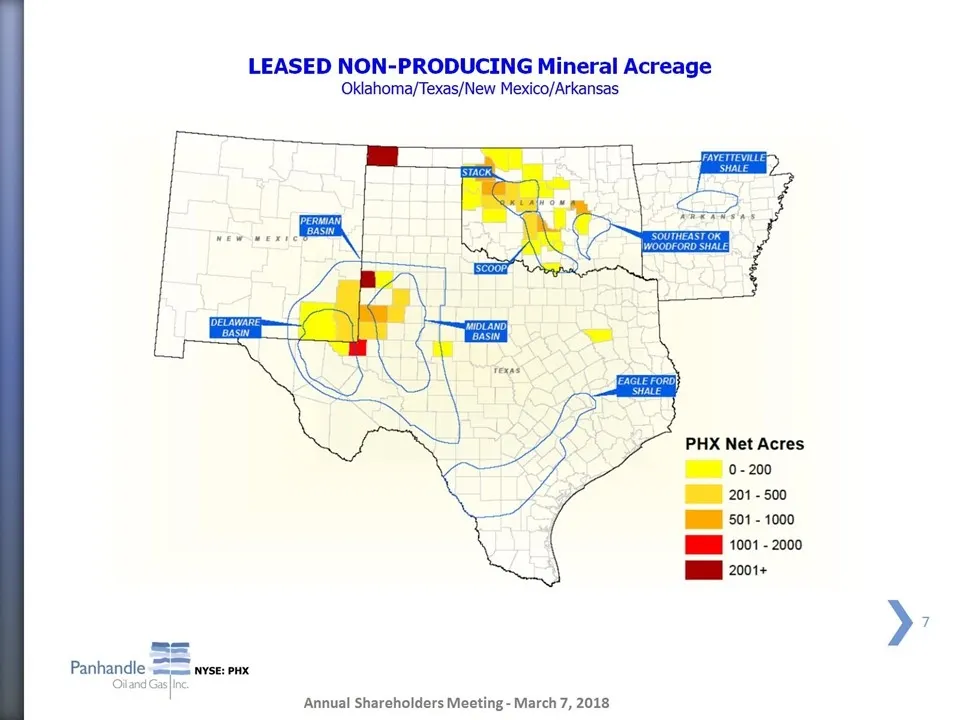
Slide 7: Leased Non-Producing Mineral Acreage
LEASED NON-PRODUCING Mineral Acreage Oklahoma/Texas/New Mexico/Arkansas PHX Net Acres z= Panhandle = wyse: pax Annual Shareholders Meeting - March 7, 2018
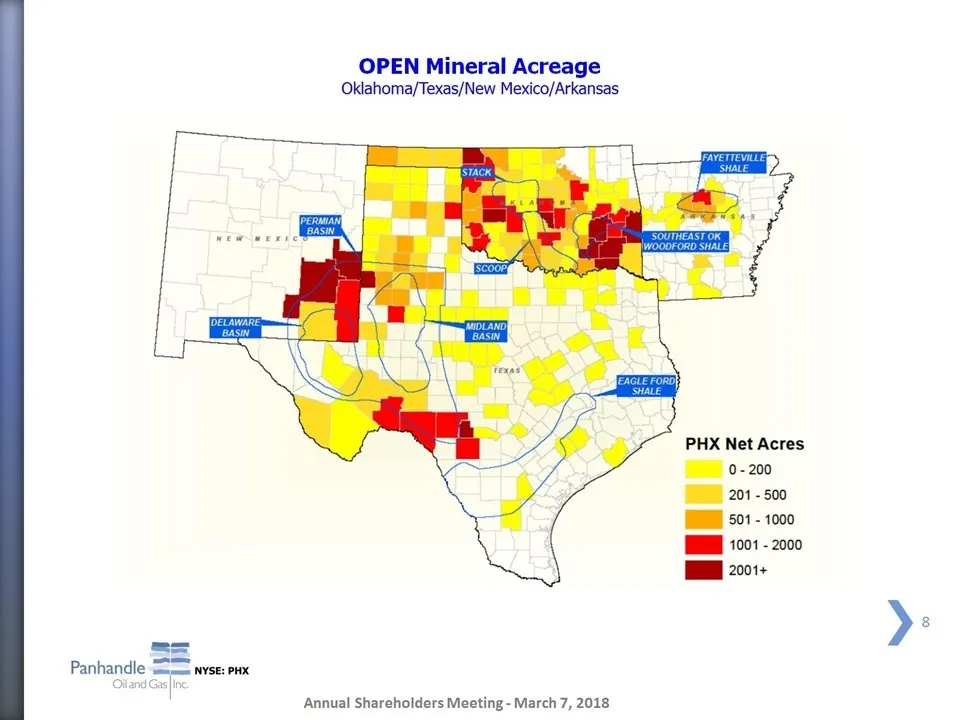
Slide 8: Open Mineral Acreage
OPEN Mineral Acreage Oklahoma/Texas/New Mexico/Arkansas PHX Net Acres z= Panhandle =e NYSE: PHX Annual Shareholders Meeting - March 7, 2018
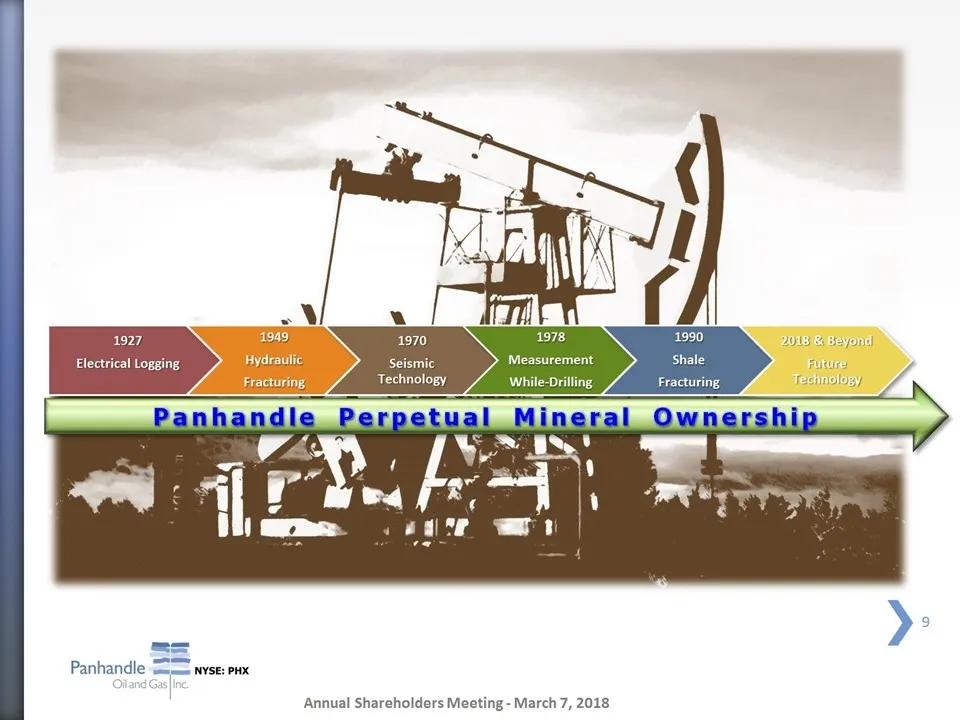
Slide 9: Panhandle
Panhandle NYSE: PHX Annual Shareholders Meeting - March 7, 2018
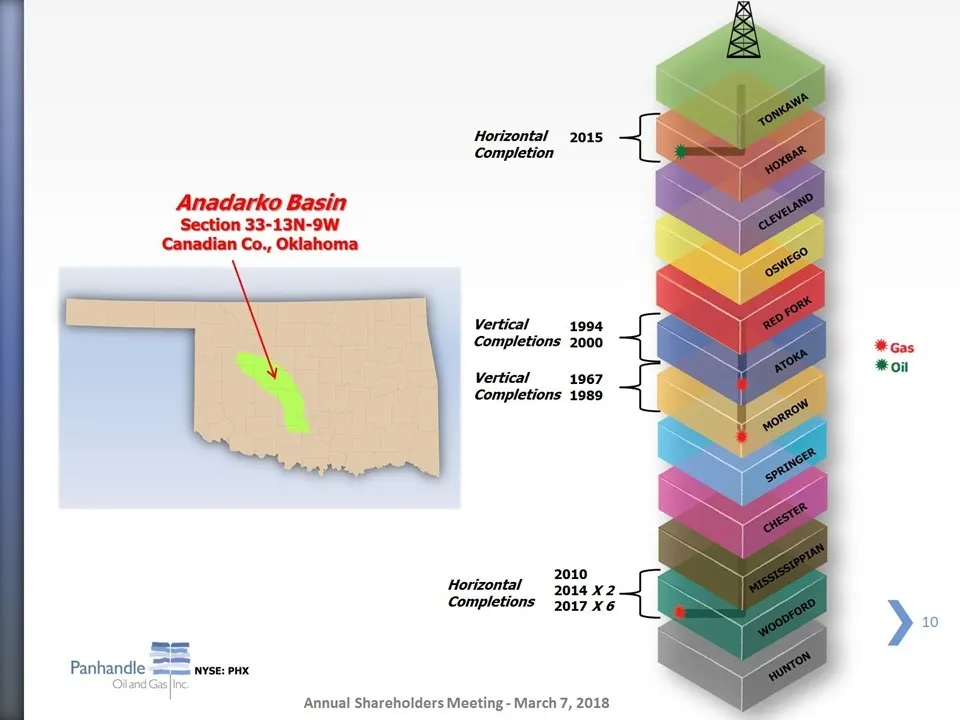
Slide 10: Horizontal 2015 Completion, Anadarko Basin
Horizontal 2015 Completion Anadarko Basin Section 33-13N-9W Canadian Vertical 1994 Completions 2000 # as Vertical 1967 Completions 1989 z= Panhandle = wyse: pax Oiland Gas [ne Annual Shareholders Meeting - March 7, 2018
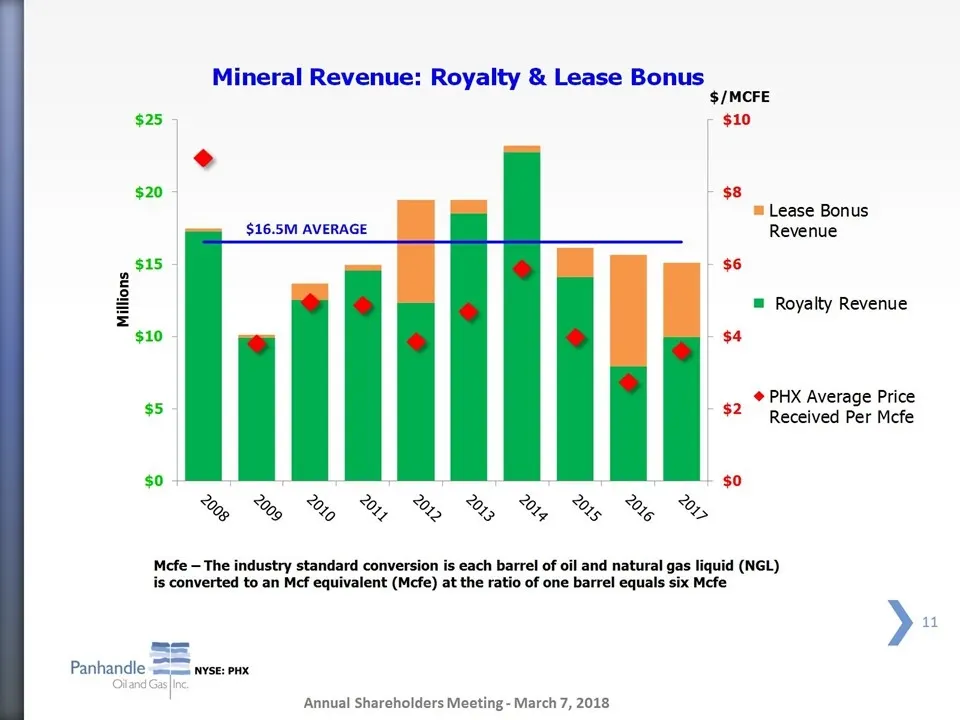
Slide 11: Mineral Revenue: Royalty & Lease Bonus
Mineral Revenue: Royalty & Lease Bonus $/MCFE $25 ; $10 e $20 > $8 ®™ Lease Bonus $16.5M AVERAGE Revenue , $6 ™ Royalty Revenue , $4 @ PHX Average Price s $2 Received Per Mcfe $0 7 : : : + $0 yoeprerner,r»,sssns, &. & & Lp “Sm “iq “Ry “Ry Hy “Rig “Rey “Ug “es Mcfe -The industry jion is each i atural
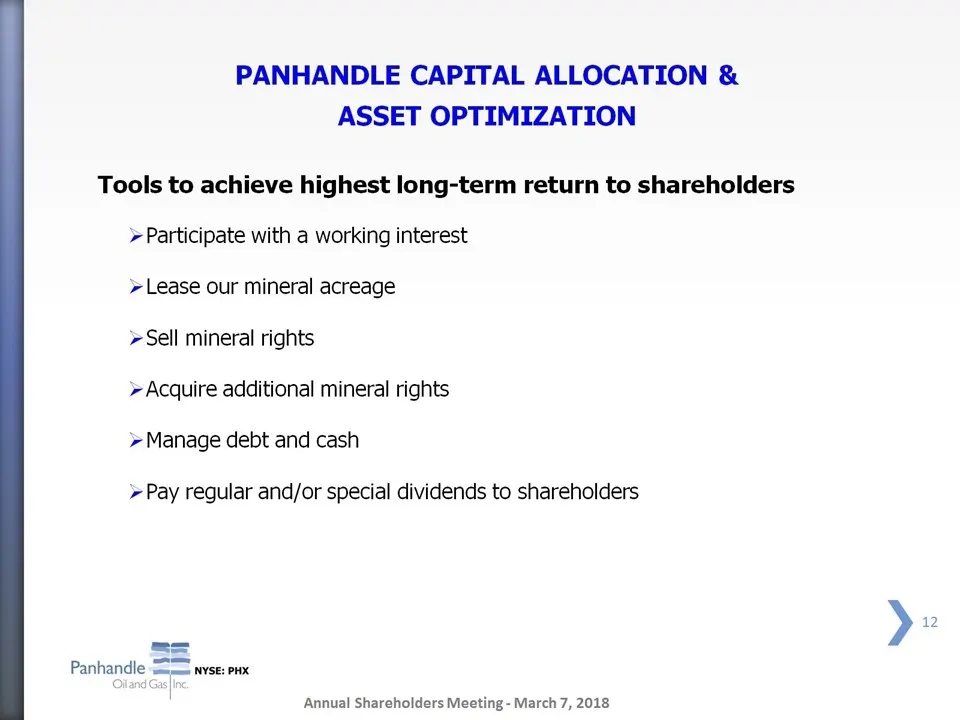
Slide 12: Panhandle Capital Allocation & Asset Optimization
PANHANDLE CAPITAL ALLOCATION & ASSET OPTIMIZATION Tools to achieve highest long-term return to shareholders > Participate with a working interest > Lease our mineral acreage > Sell mineral rights > Acquire additional mineral rights > Manage debt and cash > Pay regular and/or special dividends to sha
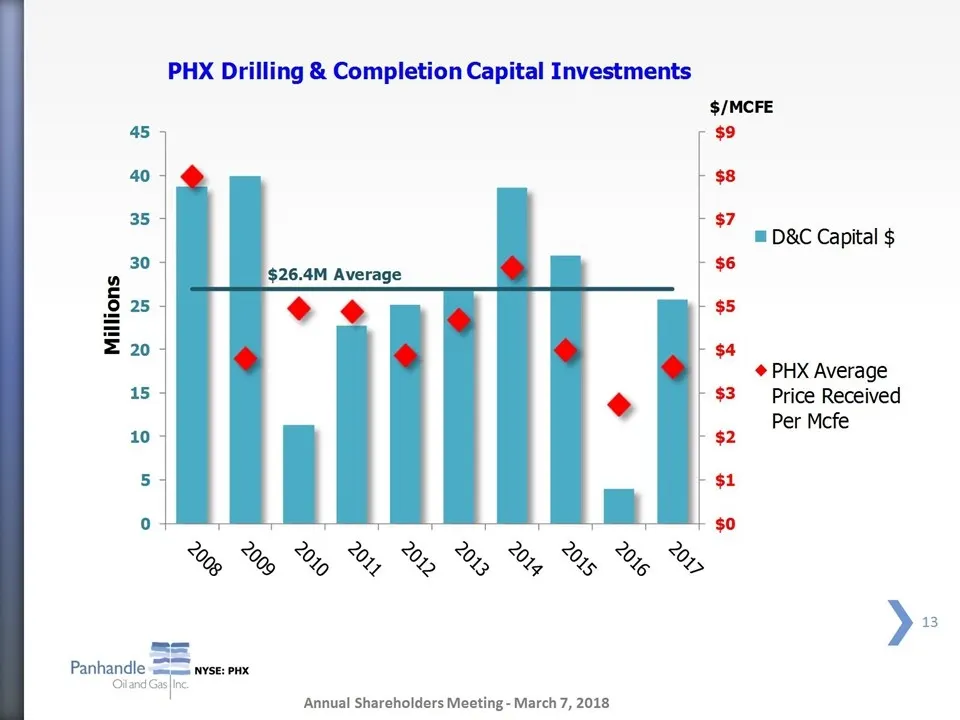
Slide 13: PHX Drilling & Capital
PHX Drilling & C I “% % Panhandle = = = Capital $26.4M Average o % &% o % % %4%% % 2 ee ey “ye “Ge “es S Annual Shareholders Meeting - March 7, 2018 $/MCFE $9 7 5 DBC Capital $ $6 $5 PHX Average $3 Price Received Per Mcfe $1
Slide 14: Company Operations
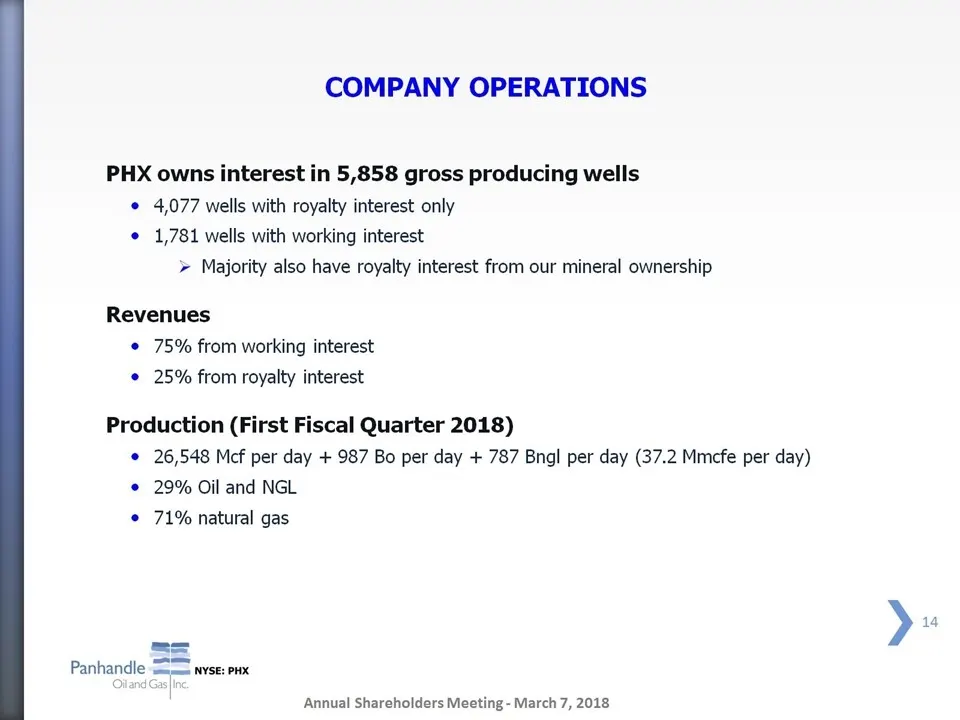
COMPANY OPERATIONS PHX owns interest in 5,858 gross producing wells ¢ 4,077 wells with royalty interest only ¢ 1,781 wells with working interest > Majority also have royalty interest from our mineral ownership Revenues * 75% from working interest ¢ 25% from royalty interest Production (First Fiscal
Slide 15: Quarterly Production
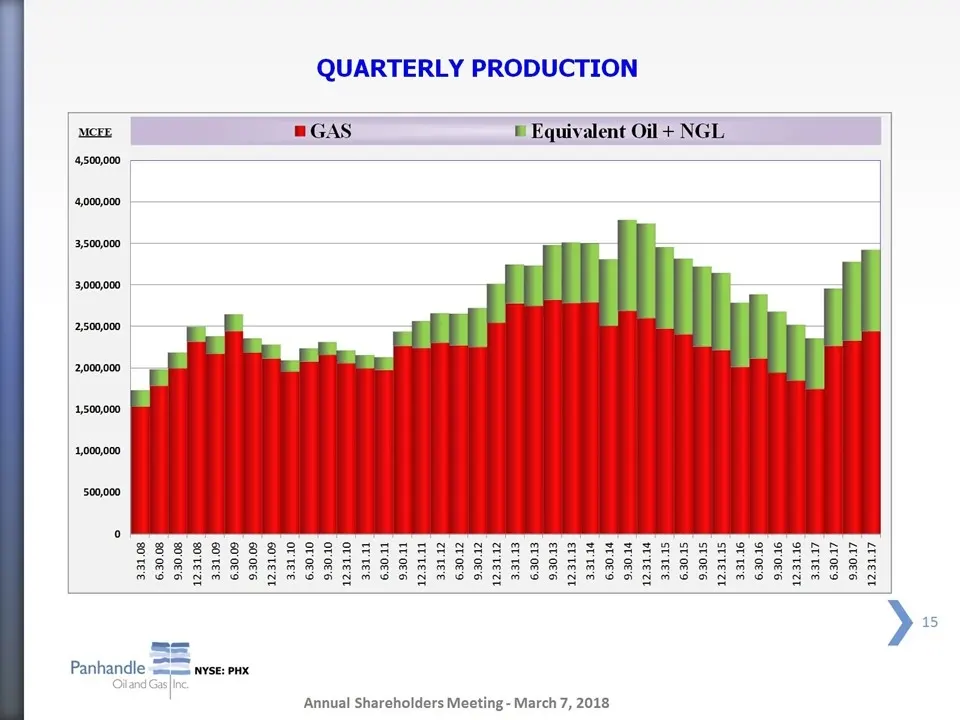
QUARTERLY PRODUCTION = GAS © Equivalent Oil + NGL 3.31.08 J 12.31.10 Panhandle Oiland¢ = NYSE: Pr Annual Shareholders Meeting - March 7, 2018 >«
Slide 16: Major Plays/Current Activity
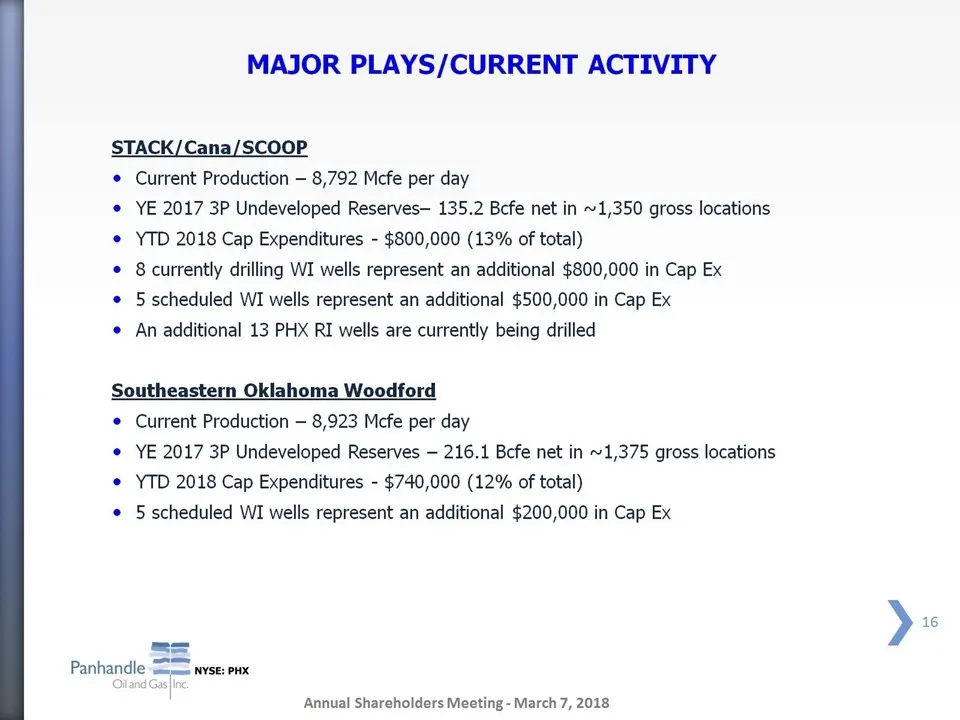
MAJOR PLAYS/CURRENT ACTIVITY STACK/Cana/SCOOP . ° . Current Production — 8,792 Mcfe per day YE 2017 3P Undeveloped Reserves— 135.2 Bcfe net in ~1,350 gross locations YTD 2018 Cap Expenditures - $800,000 (13% of total) 8 currently drilling WI wells represent an additional $800,000 in Cap Ex 5 schedul
Slide 17: Major Plays (Continued)
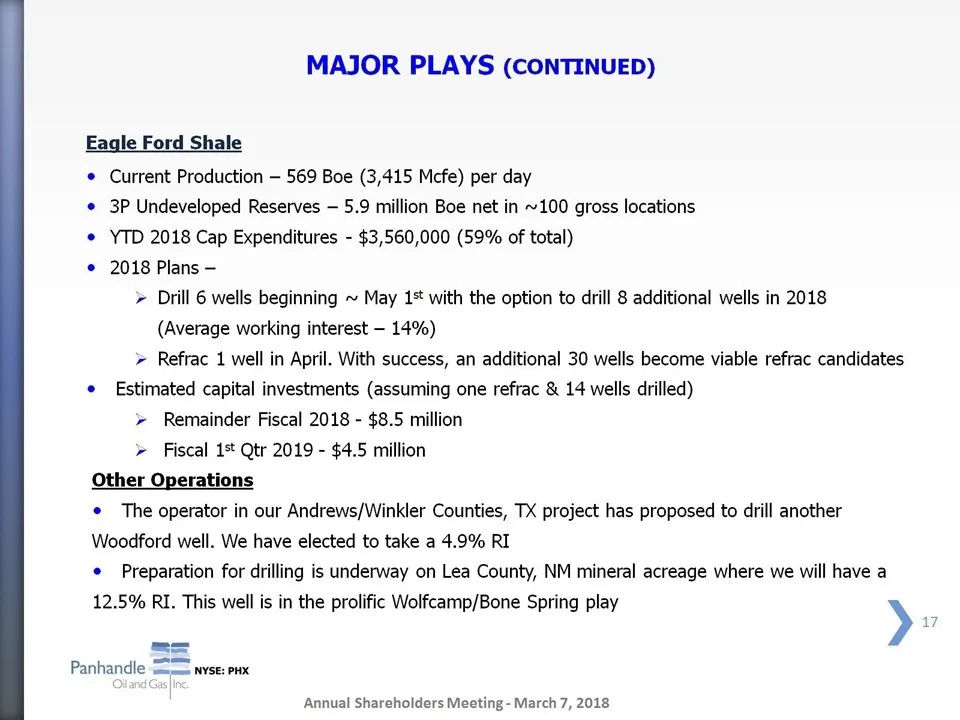
MAJOR PLAYS (CONTINUED) Eagle Ford Shale © Current Production — 569 Boe (3,415 Mcfe) per day 3P Undeveloped Reserves — 5.9 million Boe net in ~100 gross locations YTD 2018 Cap Expenditures - $3,560,000 (59% of total) ¢ 2018 Plans — > Drill 6 wells beginning ~ May 1% with the option to drill 8 additi
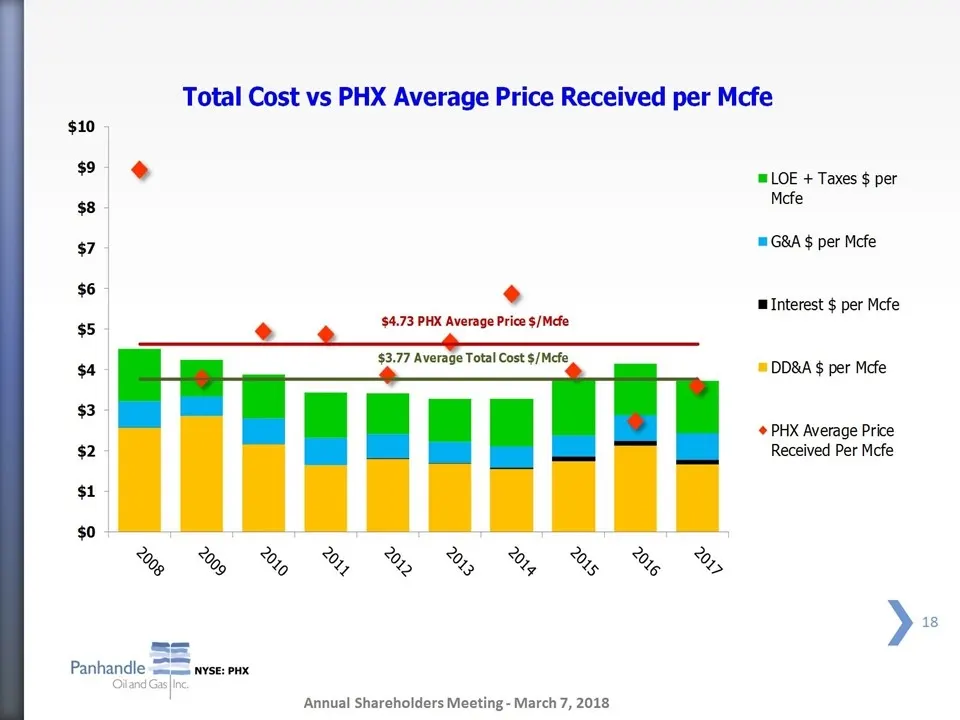
Slide 18: Total Cost vs PHX Average Price Received per Mcfe
Total Cost vs PHX Average Price Received per Mcfe $10 21 @ LOE + Taxes $ per $8 Mcfe $7 = G8A $ per Mcfe sa ¢ mInterest $ per Mcfe $4.73 PHX Average Price $/Mcfe 5 e a " $3.77 Average Total Cost $/Mcfe = DDBA $ per Mcfe $3 PHX Average Price $2 Received Per Mcfe $4 $0 > Lr Panhandle === wyse: eux Ann
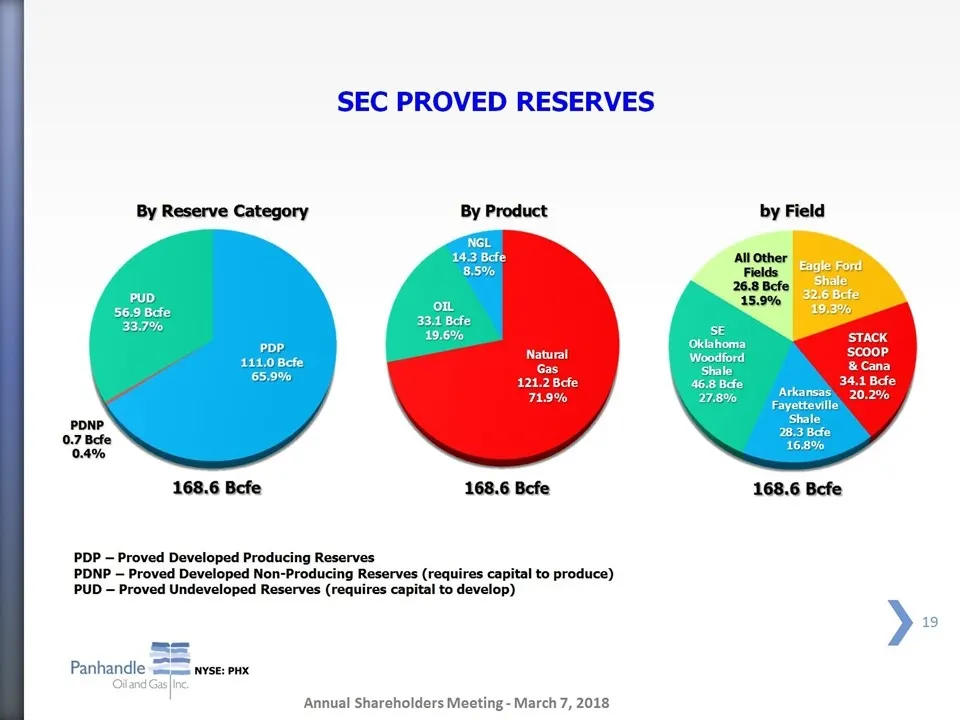
Slide 19: SEC Proved Reserves
SEC PROVED RESERVES By Reserve Category by Field 34.1 Bef Arkansa®, Fayetteville) Shale 168.6 Bcfe 168.6 Bcfe PDP — Proved Developed Producing Reserves PDNP ing z= Panhandle == wvse: px Annual Shareholders Meeting - March 7, 2018
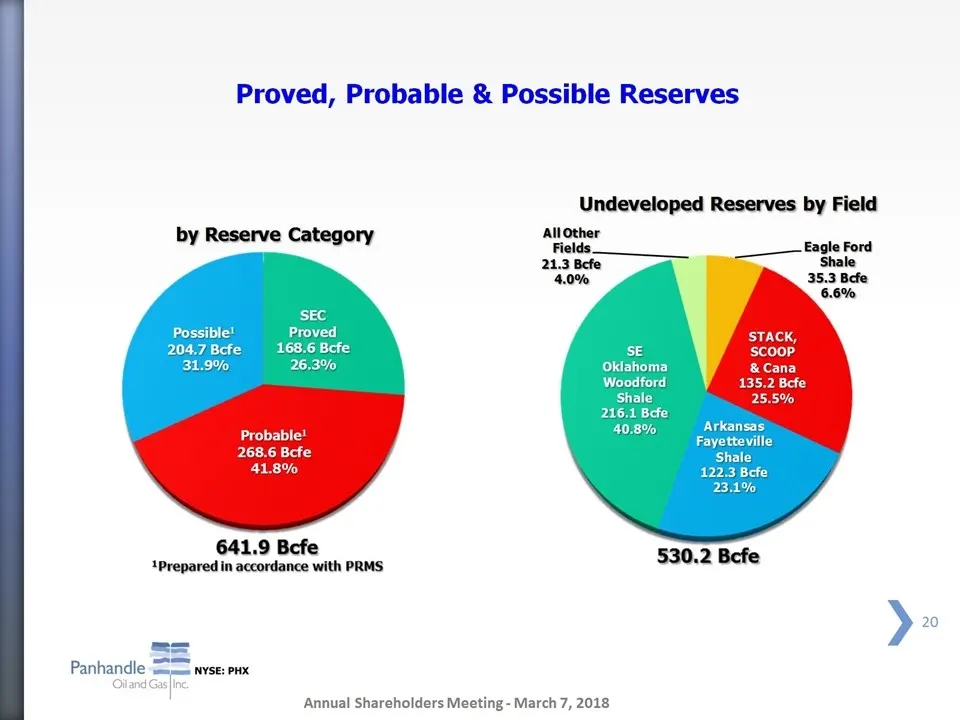
Slide 20: Proved, Probable & Possible Reserves
Proved, Probable & Possible Reserves Undeveloped Reserves by Field by Reserve Category Eagle Ford Shale Possible! Proved 2047Bcfe 168.6 Bcfe 31.9% 26.3% Probable! 641.9 Bcfe 1Prepared in accordance with PRMS z= Panhandle == wvse: px Annual Shareholders Meeting - March 7, 2018
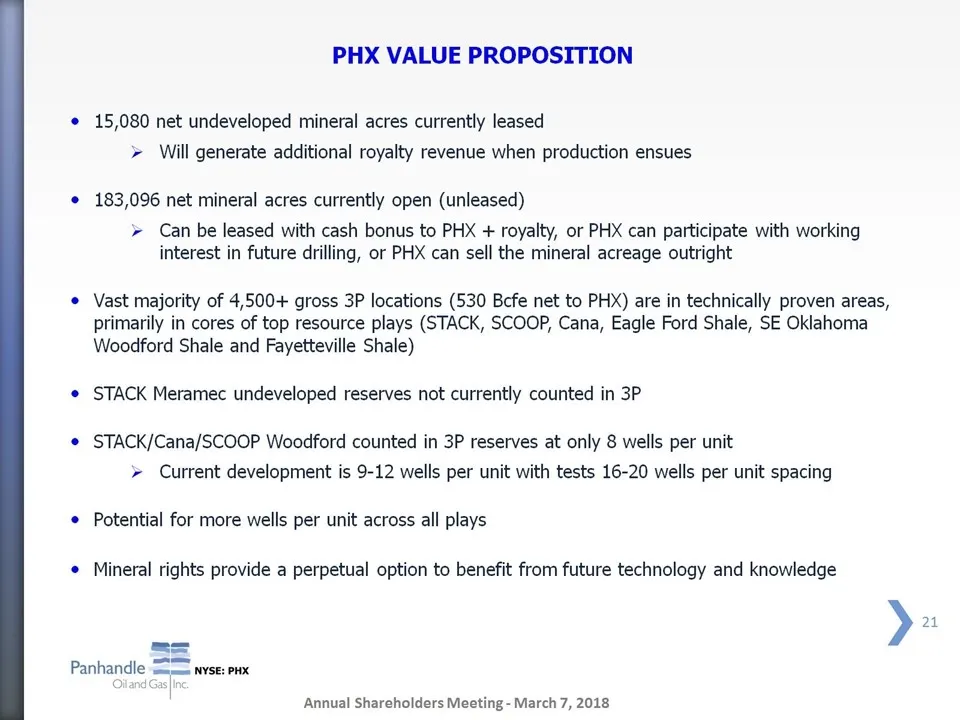
Slide 21: PHX Value Proposition
PHX VALUE PROPOSITION ° 15,080 net undeveloped mineral acres currently leased > Will generate additional royalty revenue when production ensues ° 183,096 net mineral acres currently open (unleased) >» Can be leased with cash bonus to PHX + royalty, or PHX can participate with working interest in fut
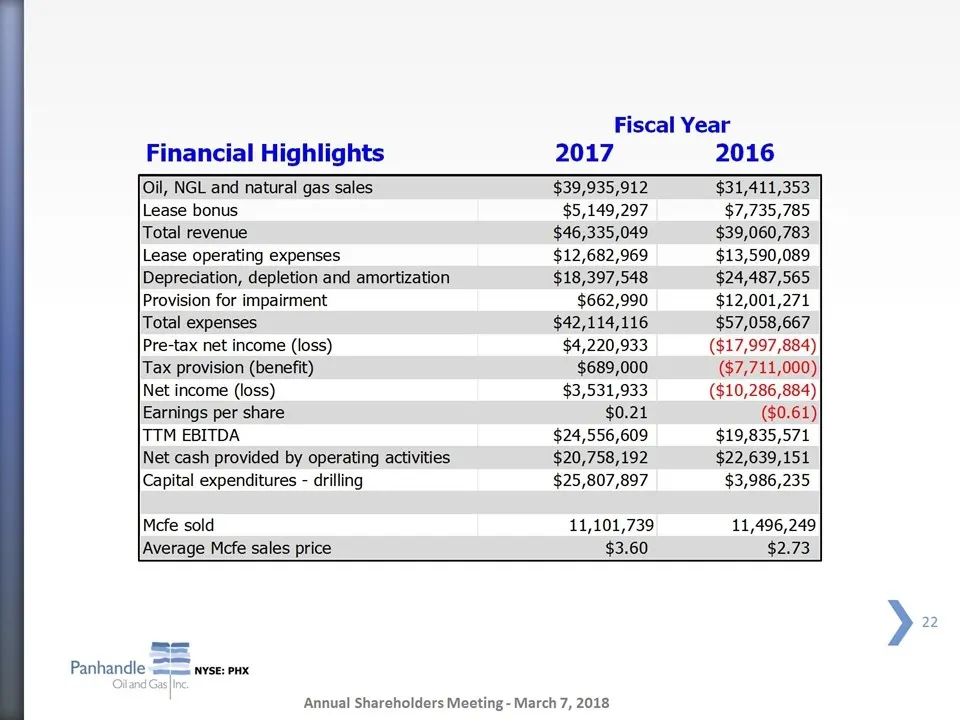
Slide 22: Financial Highlights - Fiscal Year
Fiscal Year Financial Highlights 2 Oil, NGL and natural gas sales $39,935,912 $31,411,353 Lease a $5,149,297 $7,735,785 Total re $46,335,049 $39,060,783 Lease an expense $12,682,969 $13,590,089 Depreciation, depletion = amortization $18,397,548 $24,487,565 Provision for impairment $662,990 $12,001,2
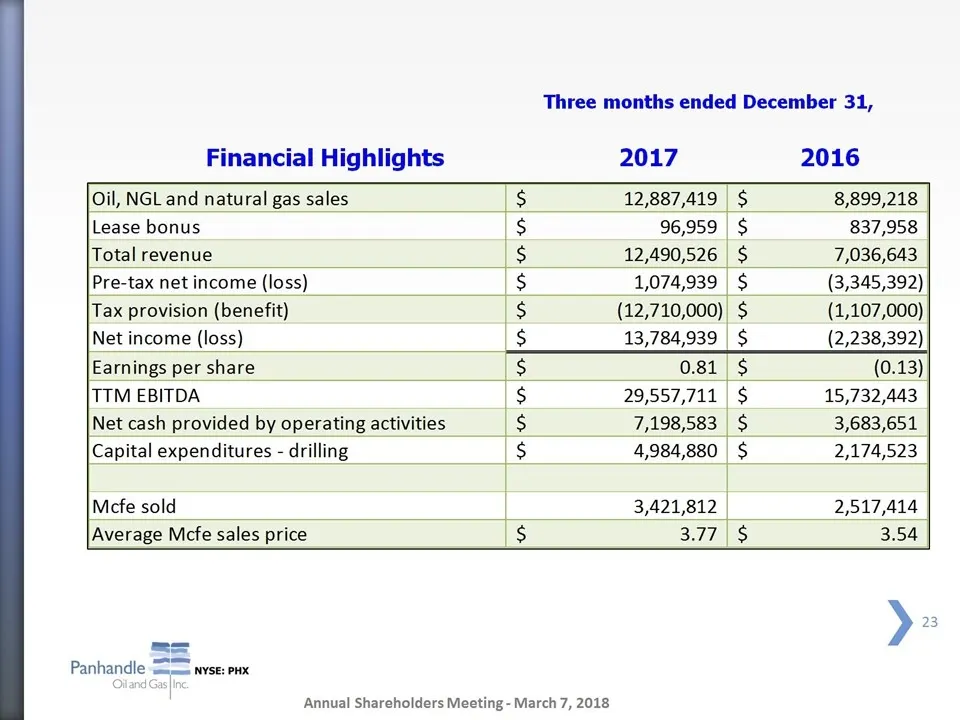
Slide 23: Financial Highlights - Three Months Ended December 31
Three months ended December 31, Financial Highlights 2017 2016 Oil, NGL and natural gas sales $ 12,887,419 | $ 8,899,218 Lease bonus S 96,959 $ 837,958 Total revenue $ 12,490,526 $ 7,036,643 Pre-tax net income (loss) S 1,074,939 | $ (3,345,392) Tax provision (benefit) $ (12,710,000) $ (1,107,000) Ne
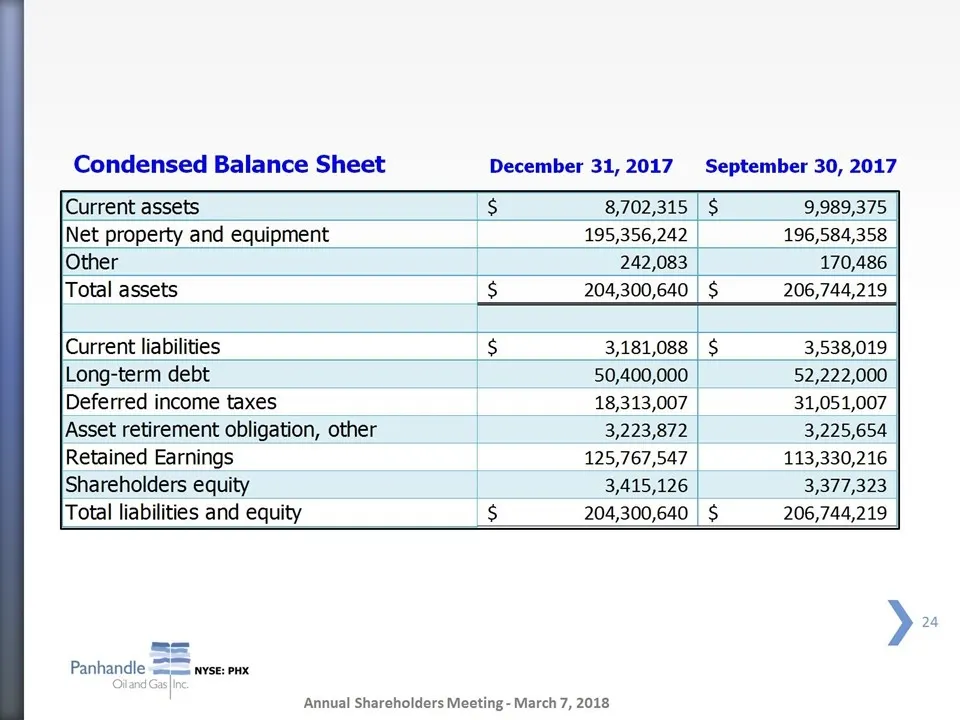
Slide 24: Condensed Balance Sheet
Condensed Balance Sheet December 31,2017 September 30, 2017 Current assets $ 8,702,315 | $ 9,989,375 Net property and equipment 195,356,242 196,584,358 Other 242,083 170,486 Total assets $ 204,300,640 | $ 206,744,219 Current liabilities $ 3,181,088 | $ 3,538,019 Long-term debt 50,400,000 52,222,000
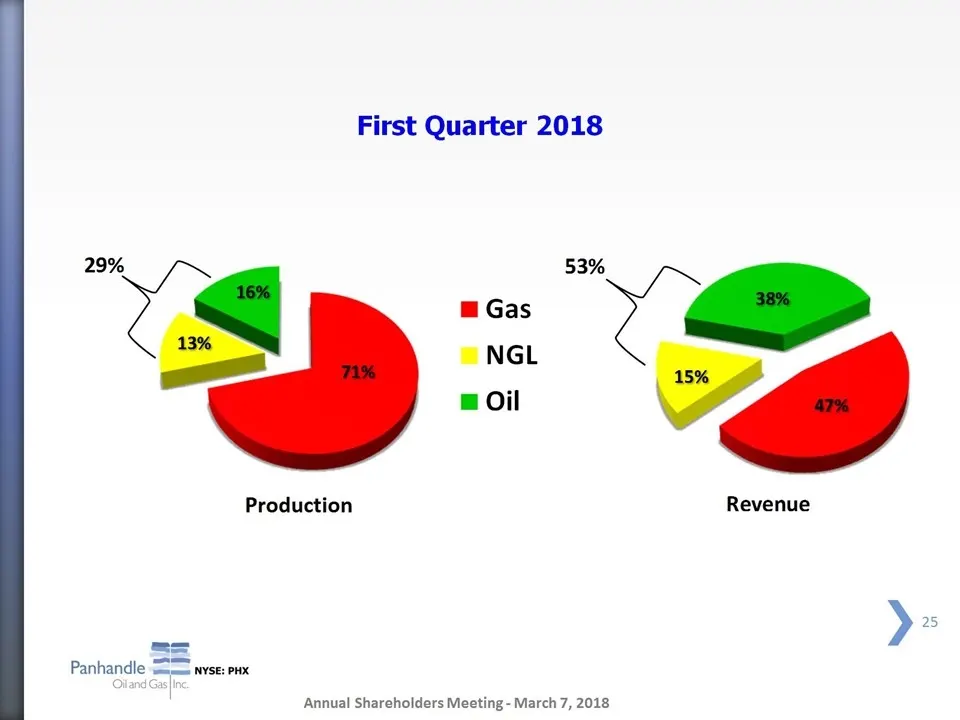
Slide 25: First Quarter 2018 Production Revenue
First Quarter 2018 53% @ Gas ss © NGL = Oil Production Revenue z= Panhandle === wvse: pwx Annual Shareholders Meeting - March 7, 2018
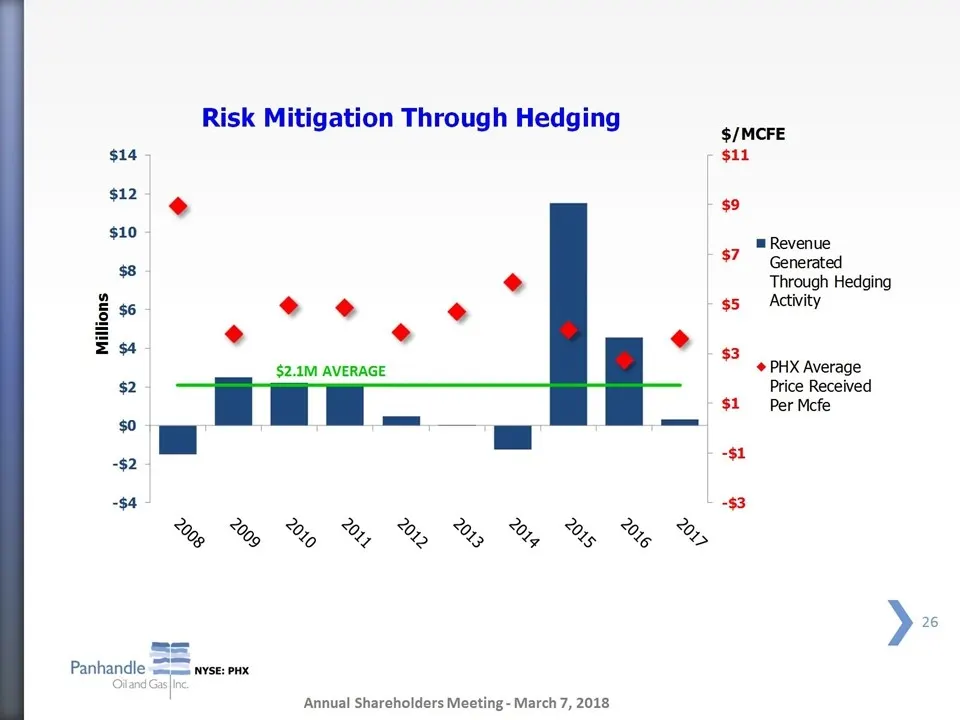
Slide 26: Price Mitigation Through Hedging
igation Through Hedging Annual Shareholders Meeting - March 7, 2018 $/MCFE $11 $9 $7 Generated Through Hedging Activity PHX Average Price Received $1 Per Mcfe $1 $3
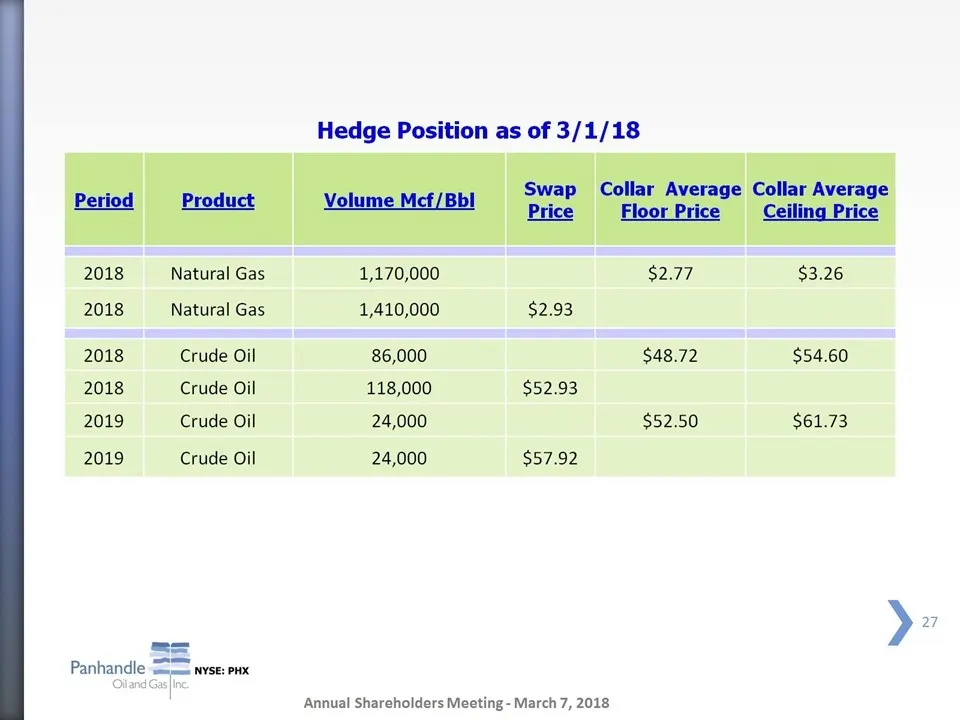
Slide 27: Hedge Position as of 3/1/18
Hedge Position as of 3/1/18 Swap Collar Average Collar Average Period Product Volume Mcf/BbI Period Product Volume Mef/BbI Price Floor Price Ceiling Price 2018 Natural Gas 1,170,000 2577 $3.26 2018 Natural Gas 1,410,000 $2.93 2018 Crude Oil 86,000 $48.72 $54.60 2018 Crude Oil 118,000 $52.93 2019 Cru
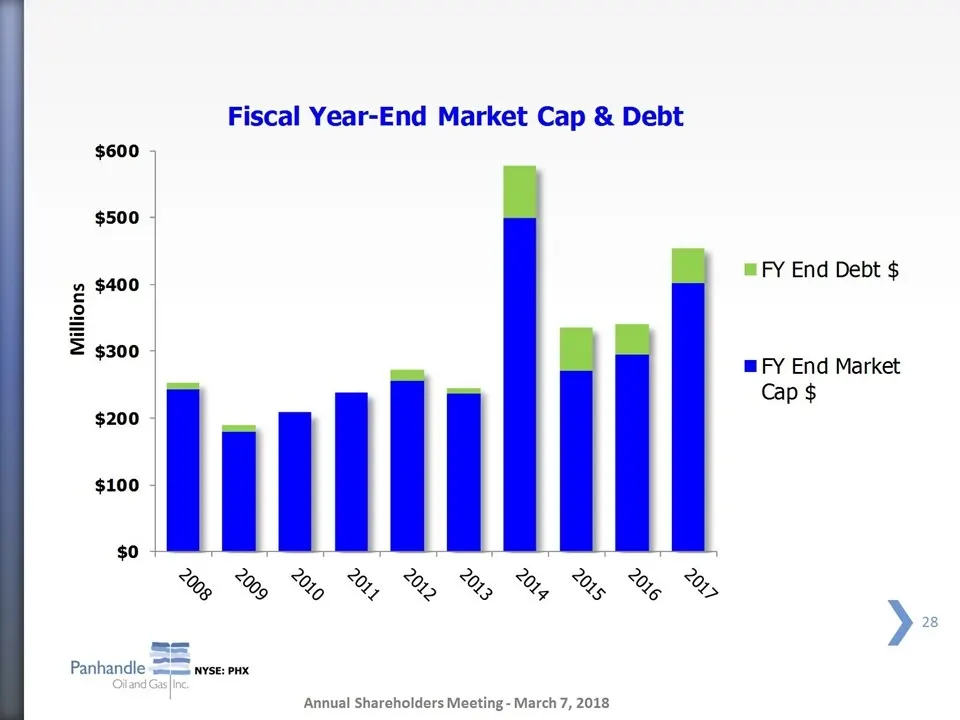
Slide 28: Fiscal Year-End Market Cap & Debt
Fiscal Year-End Market Cap & Debt = FY End Debt $ gon) mFY End Market Cap $ % % 2 > Annual Shareholders Meeting - March 7, 2018
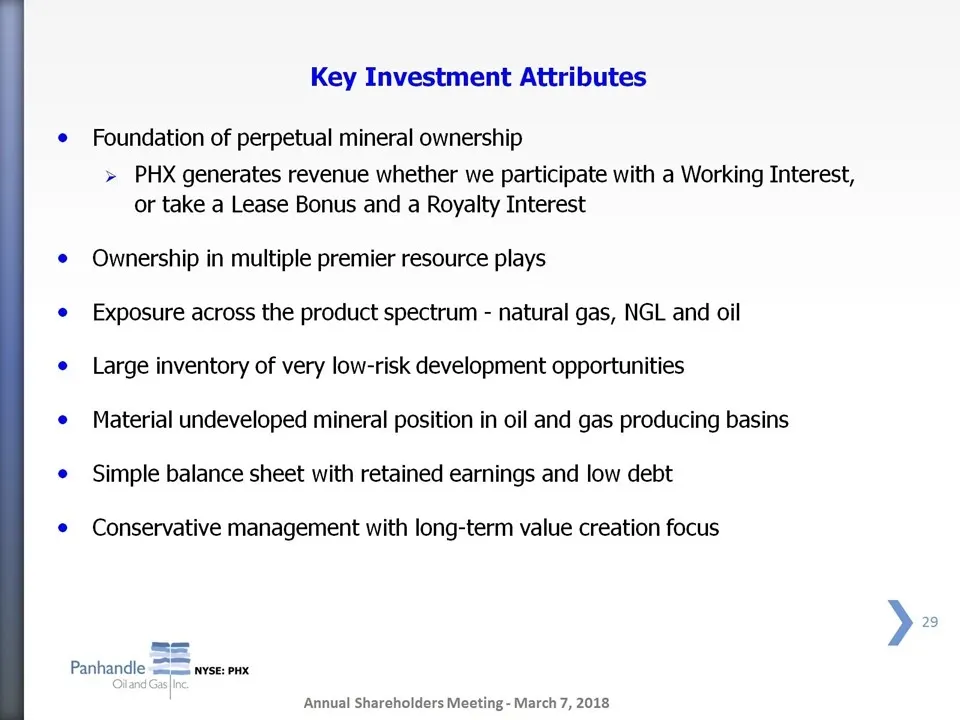
Slide 29: Key Investment Attributes
Key Investment Attributes Foundation of perpetual mineral ownership > PHX generates revenue whether we participate with a Working Interest, or take a Lease Bonus and a Royalty Interest Ownership in multiple premier resource plays Exposure across the product spectrum - natural gas, NGL and oil Large
Source: SEC EDGAR · 8-K filed Mar 6, 2018
More decks from PHX Minerals Inc
 Investor Presentation (March 2025)29 slides · Mar 12, 2025
 Investor Presentation (November 2024)33 slides · Nov 6, 2024
 Investor Presentation (August 2024)33 slides · Aug 7, 2024
 Investor Presentation (May 2024)33 slides · May 8, 2024
 Investor Presentation (March 2024)33 slides · Mar 12, 2024
 Investor Presentation (November 2023)40 slides · Nov 8, 2023