NEXON Co., Ltd. · TSE:3659
NEXON — Q3 2026 Earnings Presentation
41 slides from NEXON's earnings presentation, Nov 10, 2026
Slide 1: Investor Presentation Q3 2026
INVESTOR PRESENTATION Q3 2026 Patrick Söderlund Executive Chairman | Junghun Lee President and CEO | Shiro Uemura CFO © 2026 NEXON Co., Ltd. All Rights Reserved. 1
Slide 2: Table of Contents
Table of Contents • Management Summary • Franchise Summary • Q3 2026 Results • Q4 2026 Outlook • Capital Allocation and Shareholder Returns • Pipeline • Appendix © 2026 NEXON Co., Ltd. All Rights Reserved. 2
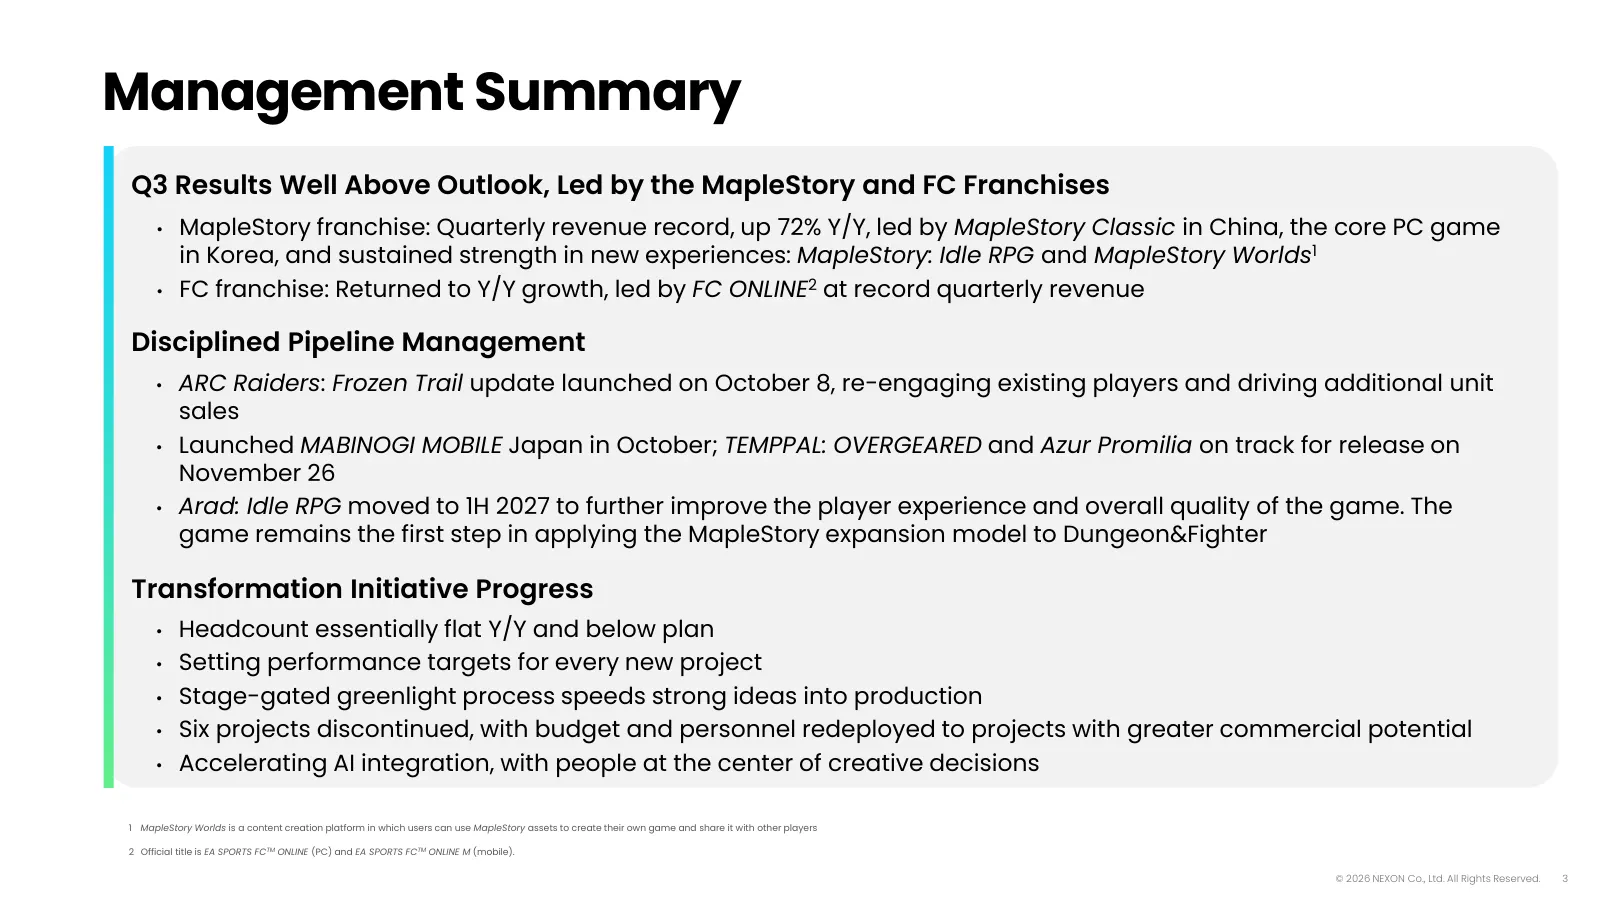
Slide 3: Management Summary
Management Summary Q3 Results Well Above Outlook, Led by the MapleStory and FC Franchises • MapleStory franchise: Quarterly revenue record, up 72% Y/Y, led by MapleStory Classic in China, the core PC game in Korea, and sustained strength in new experiences: MapleStory: Idle RPG and MapleStory Worlds
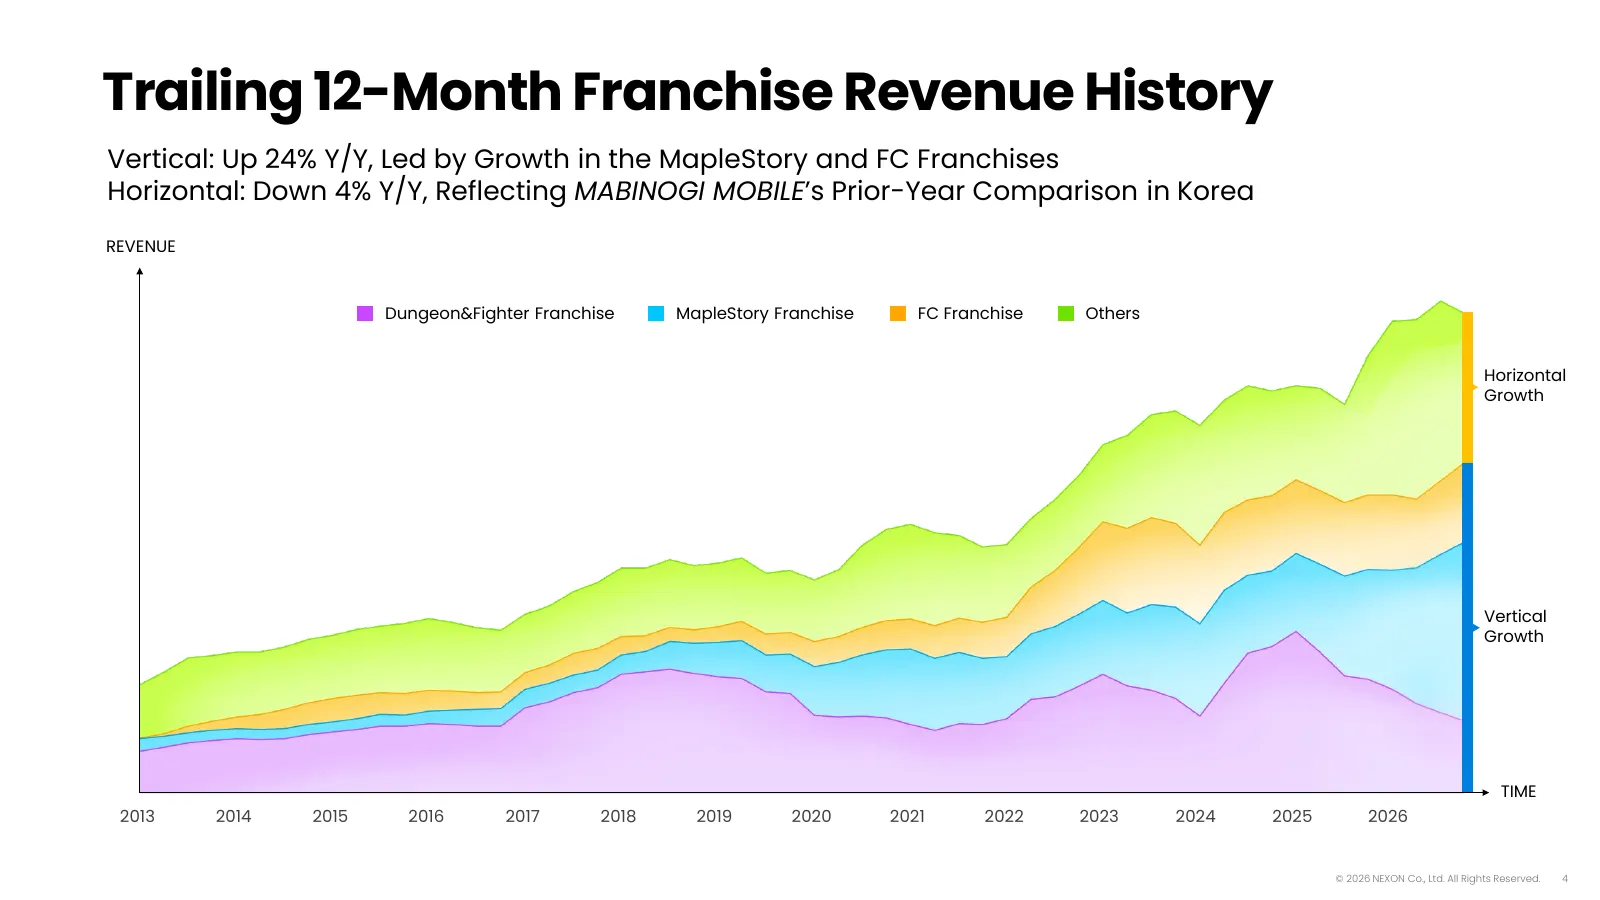
Slide 4: Trailing 12-Month Franchise Revenue History
Trailing 12-Month Franchise Revenue History Vertical: Up 24% Y/Y, Led by Growth in the MapleStory and FC Franchises Horizontal: Down 4% Y/Y, Reflecting MABINOGI MOBILE’s Prior-Year Comparison in Korea REVENUE Dungeon&Fighter Franchise MapleStory Franchise FC Franchise Others Horizontal Growth Vertic
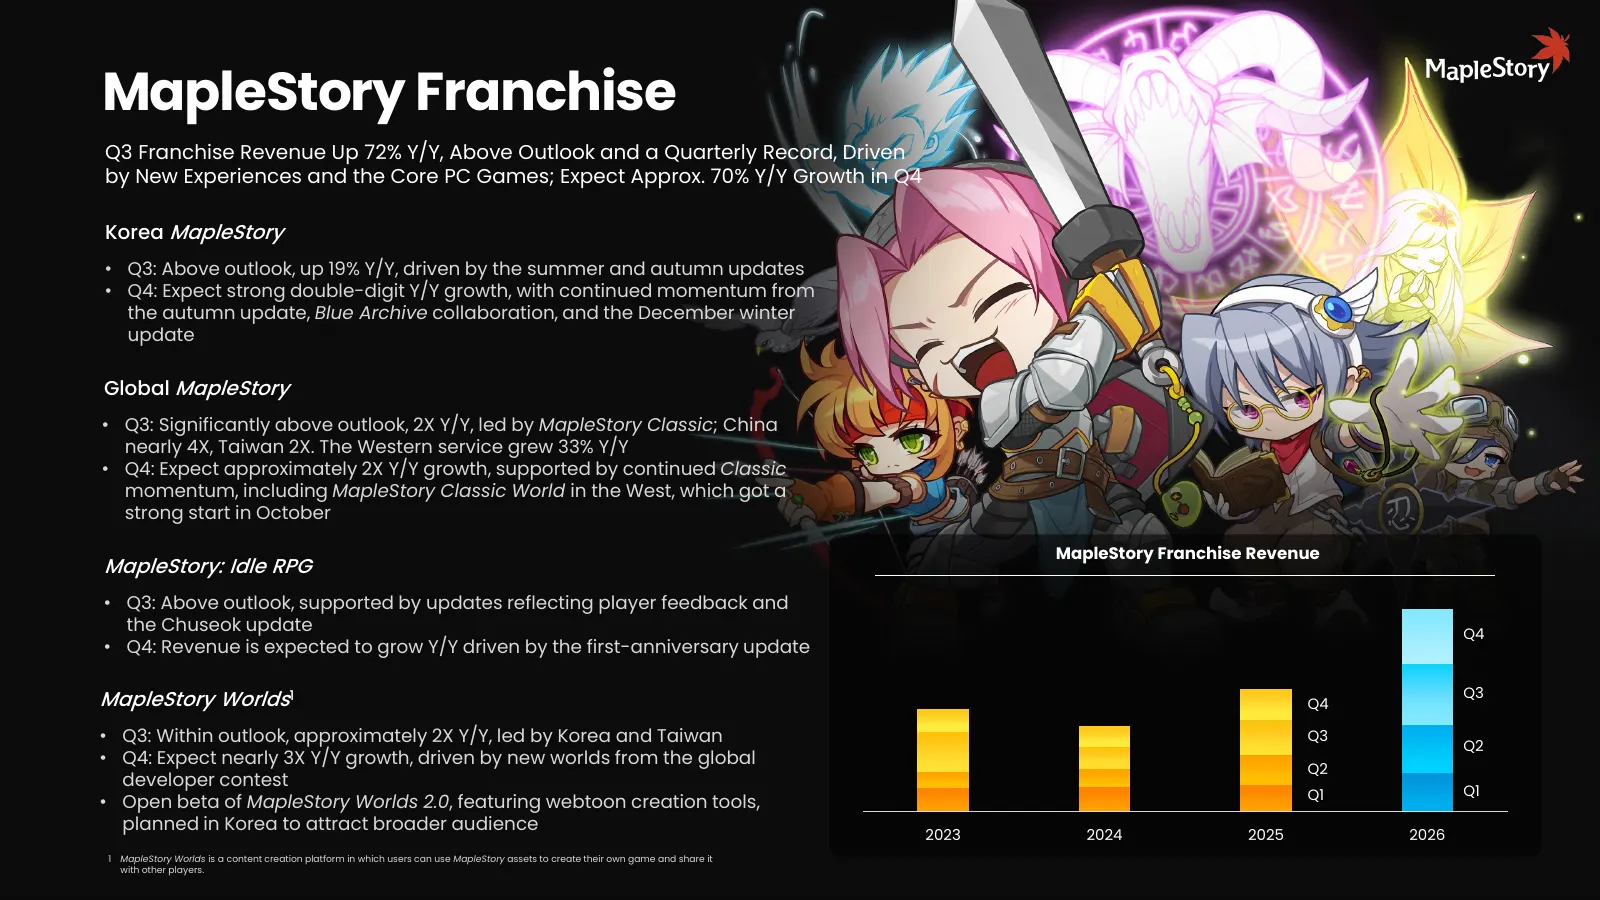
Slide 5: MapleStory Franchise
MapleStory Franchise Q3 Franchise Revenue Up 72% Y/Y, Above Outlook and a Quarterly Record, Driven by New Experiences and the Core PC Games; Expect Approx. 70% Y/Y Growth in Q4 Korea MapleStory • Q3: Above outlook, up 19% Y/Y, driven by the summer and autumn updates • Q4: Expect strong double-digit
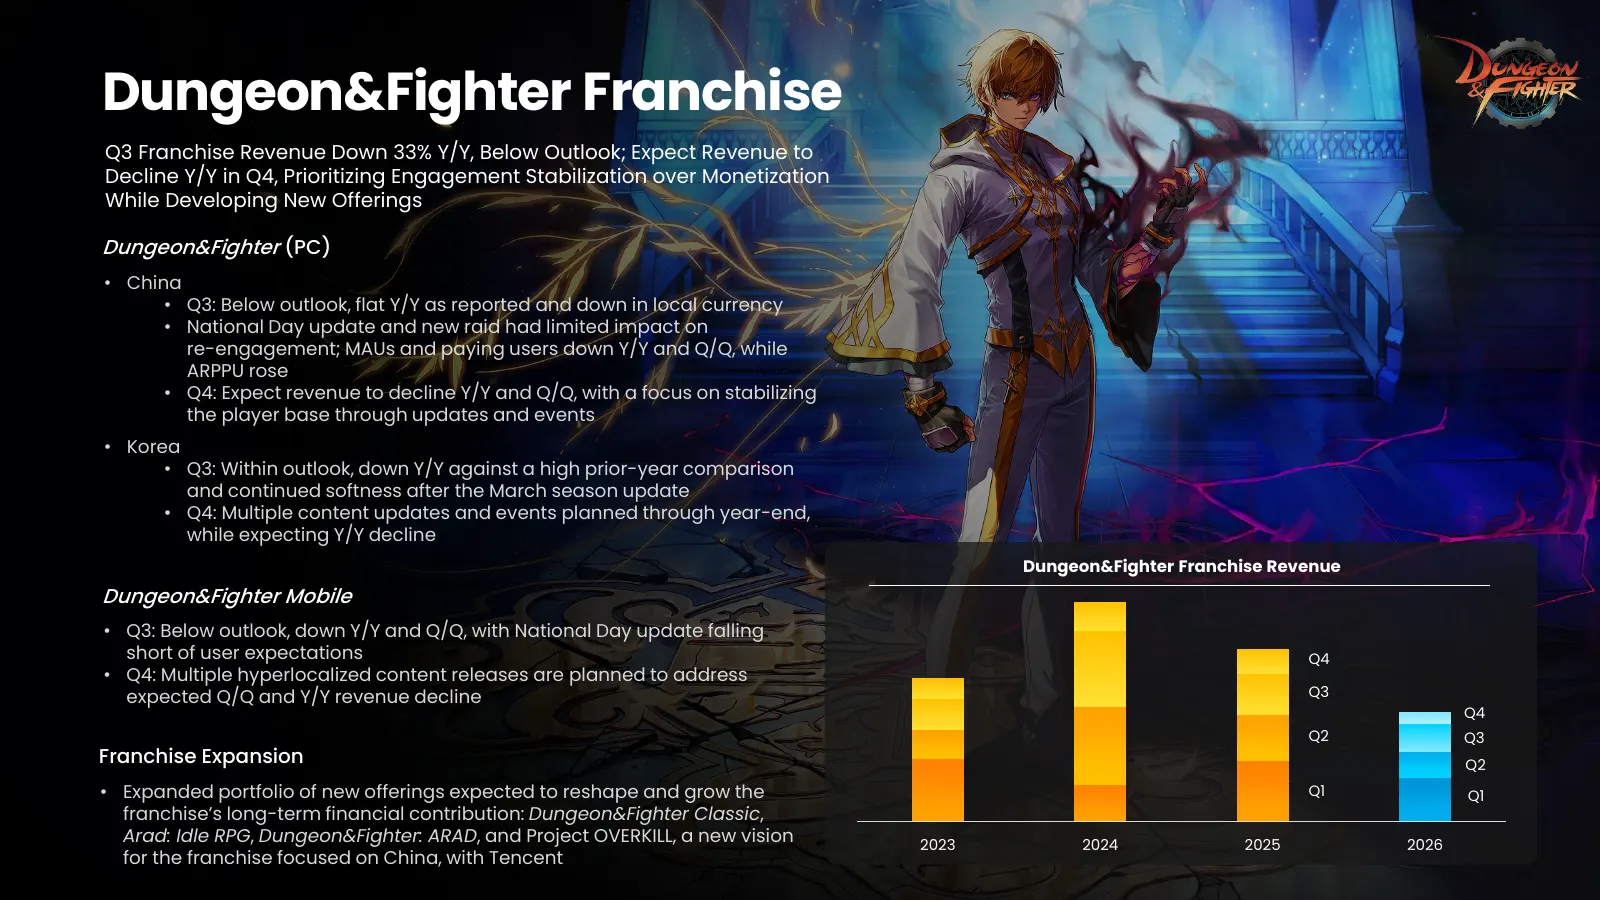
Slide 6: Dungeon&Fighter Franchise
Dungeon&Fighter Franchise Q3 Franchise Revenue Down 33% Y/Y, Below Outlook; Expect Revenue to Decline Y/Y in Q4, Prioritizing Engagement Stabilization over Monetization While Developing New Offerings Dungeon&Fighter (PC) • China • Q3: Below outlook, flat Y/Y as reported and down in local currency •
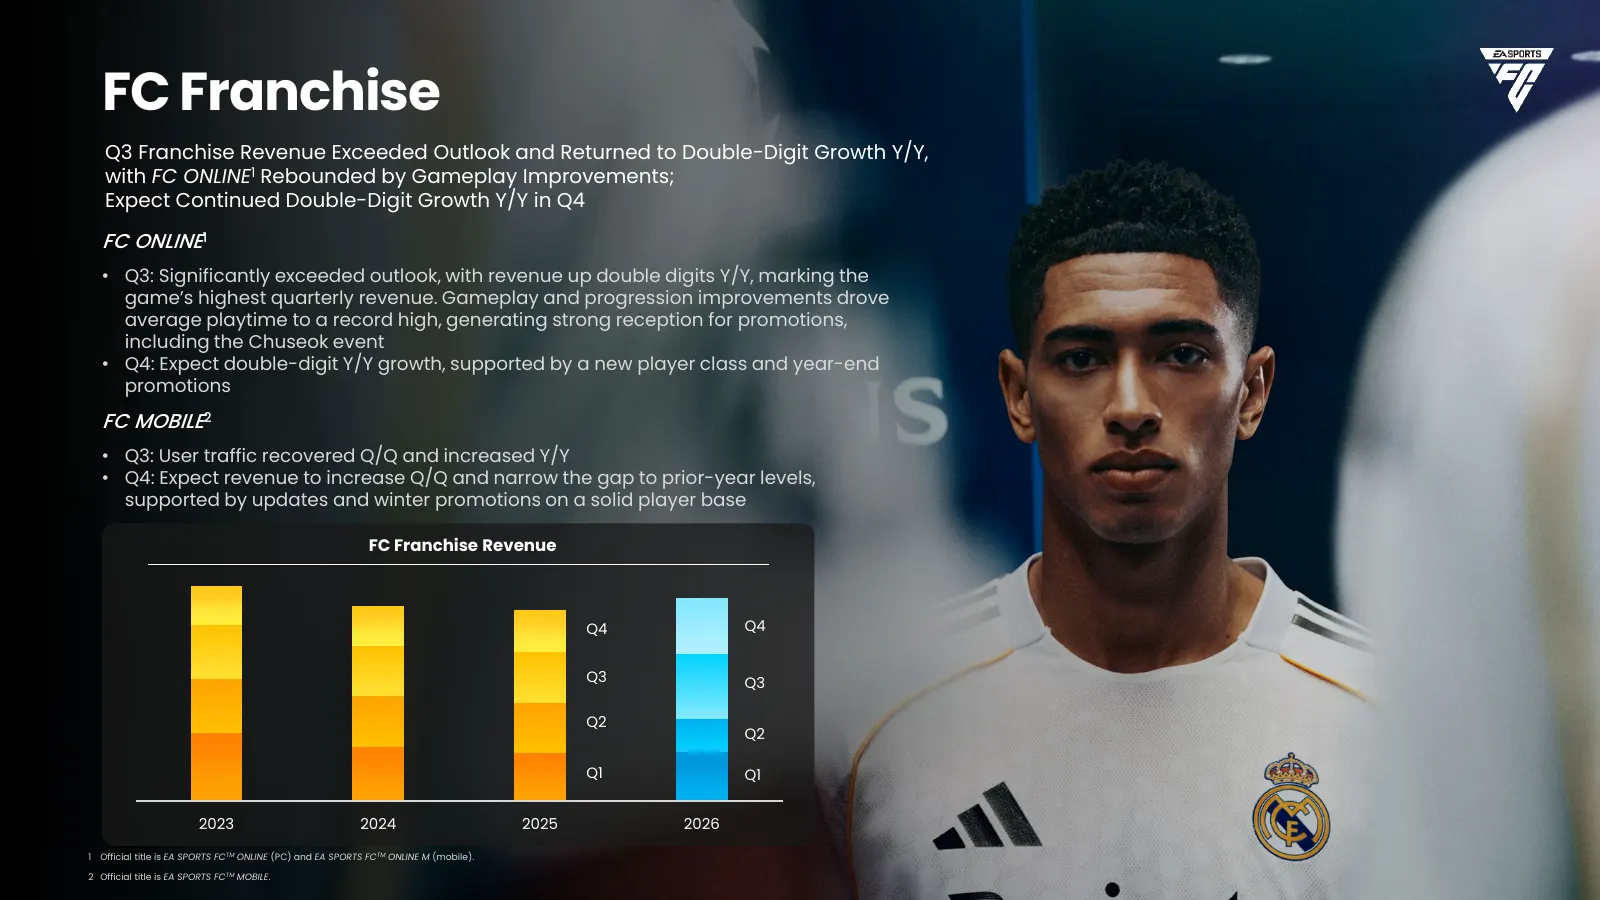
Slide 7: FC Franchise
FC Franchise Q3 Franchise Revenue Exceeded Outlook and Returned to Double-Digit Growth Y/Y, with FC ONLINE1 Rebounded by Gameplay Improvements; Expect Continued Double-Digit Growth Y/Y in Q4 FC ONLINE1 • Q3: Significantly exceeded outlook, with revenue up double digits Y/Y, marking the game’s highes
Slide 8: Shooters
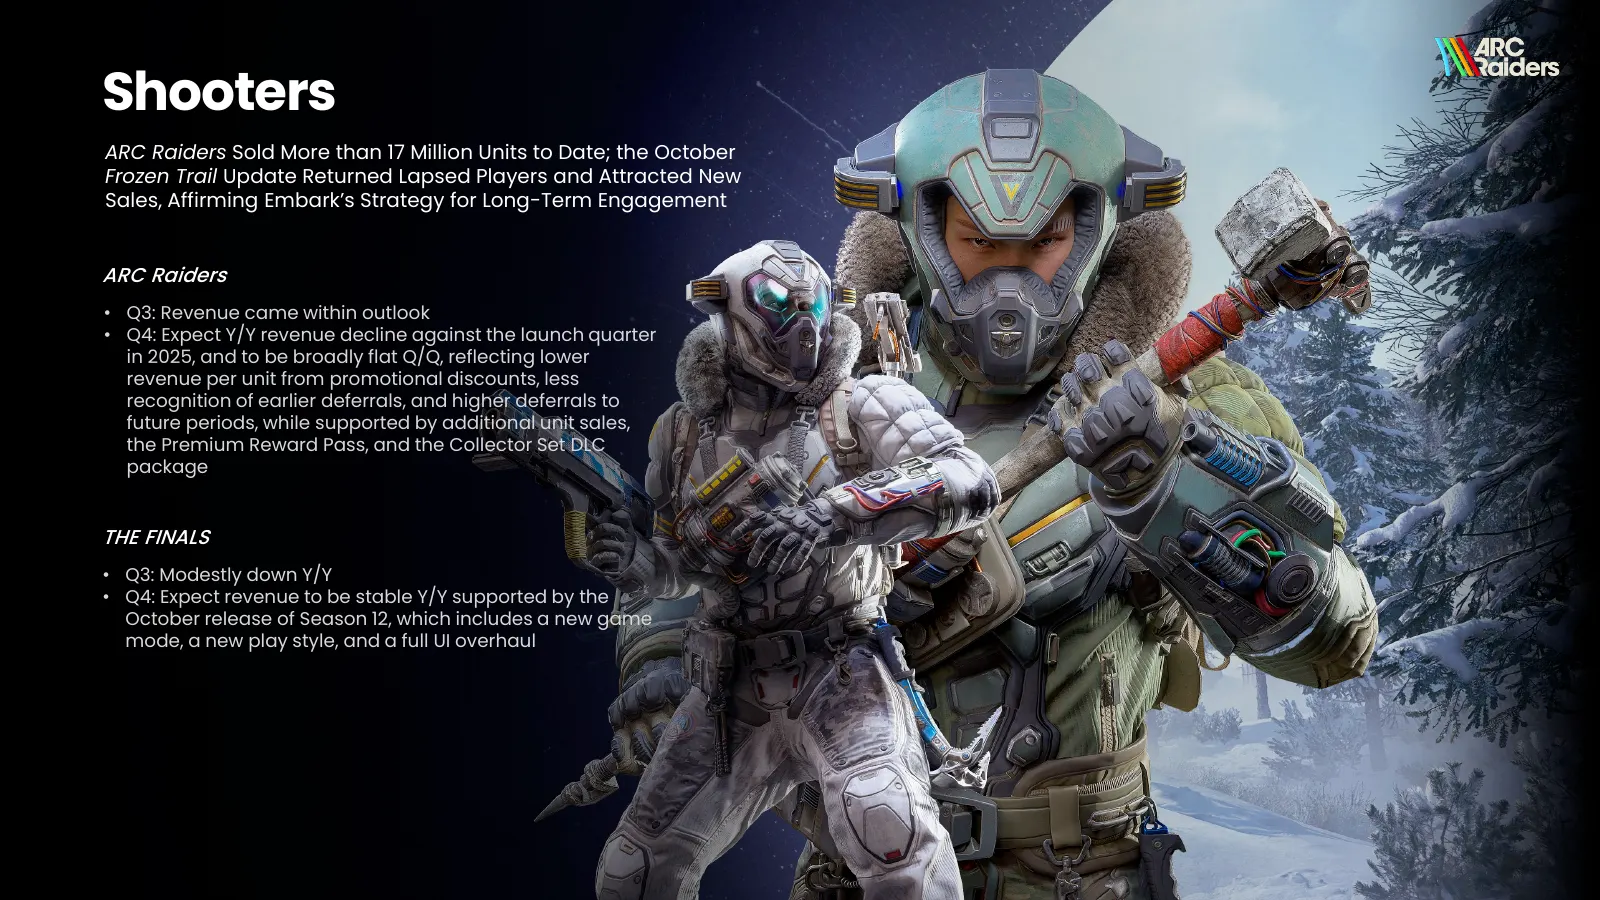
Shooters ARC Raiders Sold More than 17 Million Units to Date; the October Frozen Trail Update Returned Lapsed Players and Attracted New Sales, Affirming Embark’s Strategy for Long-Term Engagement ARC Raiders • Q3: Revenue came within outlook • Q4: Expect Y/Y revenue decline against the launch quarte
Slide 9: Q3 2026 Results
Q3 2026 Results © 2026 NEXON Co., Ltd. All Rights Reserved. 9
Slide 10: Q3 2026 Financial Highlights
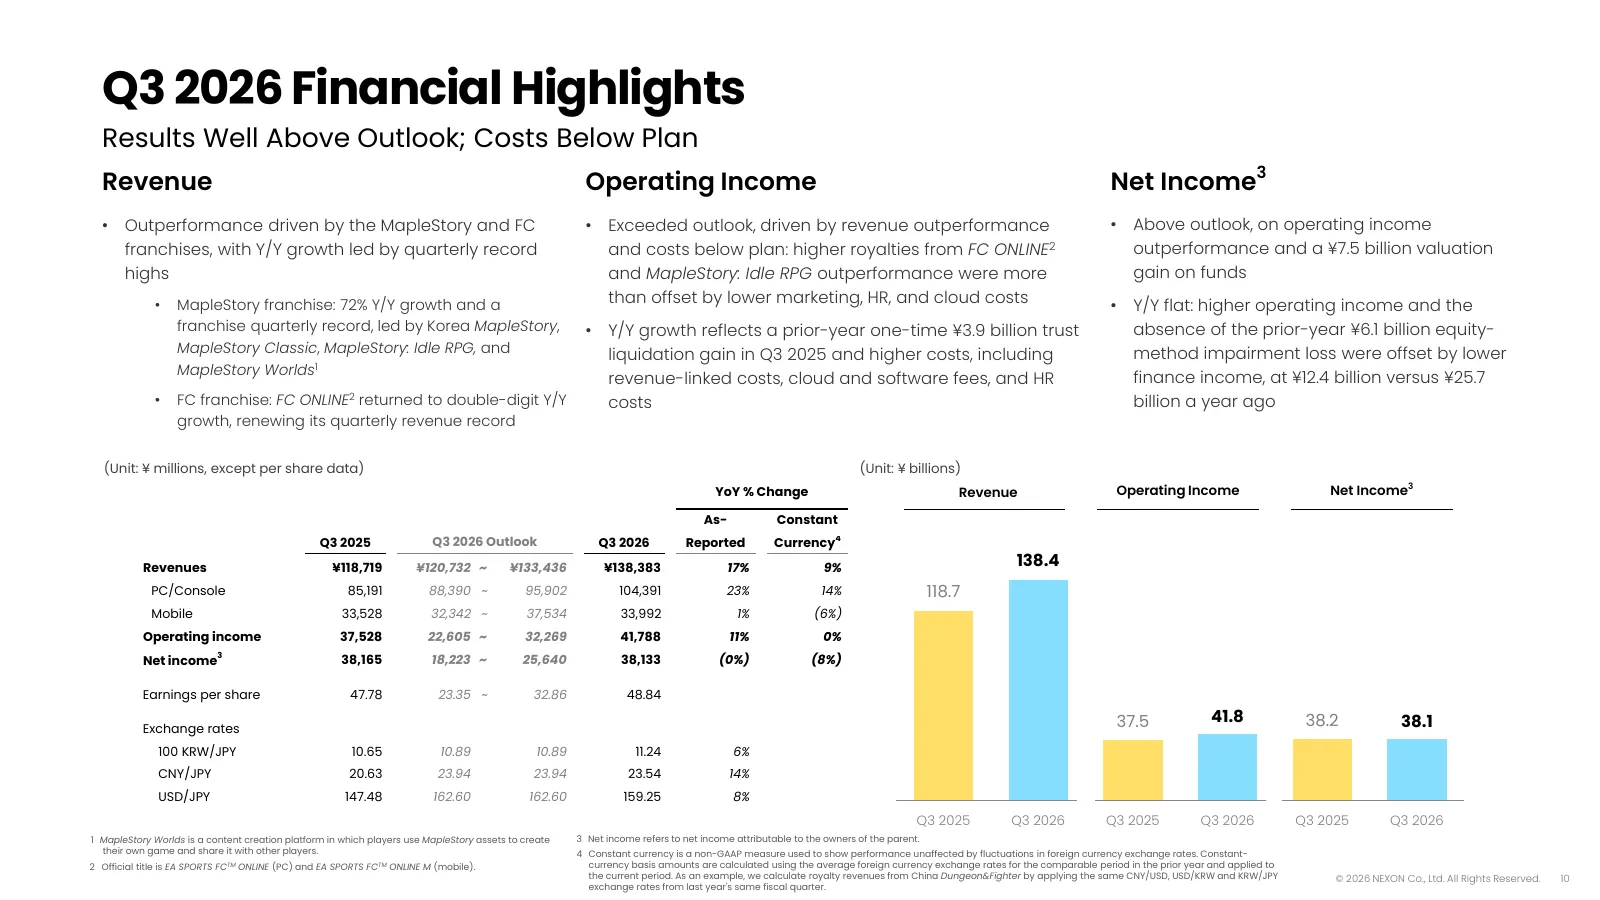
Q3 2026 Financial Highlights Results Well Above Outlook; Costs Below Plan 3 Revenue Operating Income Net Income • Outperformance driven by the MapleStory and FC • Exceeded outlook, driven by revenue outperformance • Above outlook, on operating income franchises, with Y/Y growth led by quarterly reco
Slide 11: Q3 2026 Revenue Breakdown
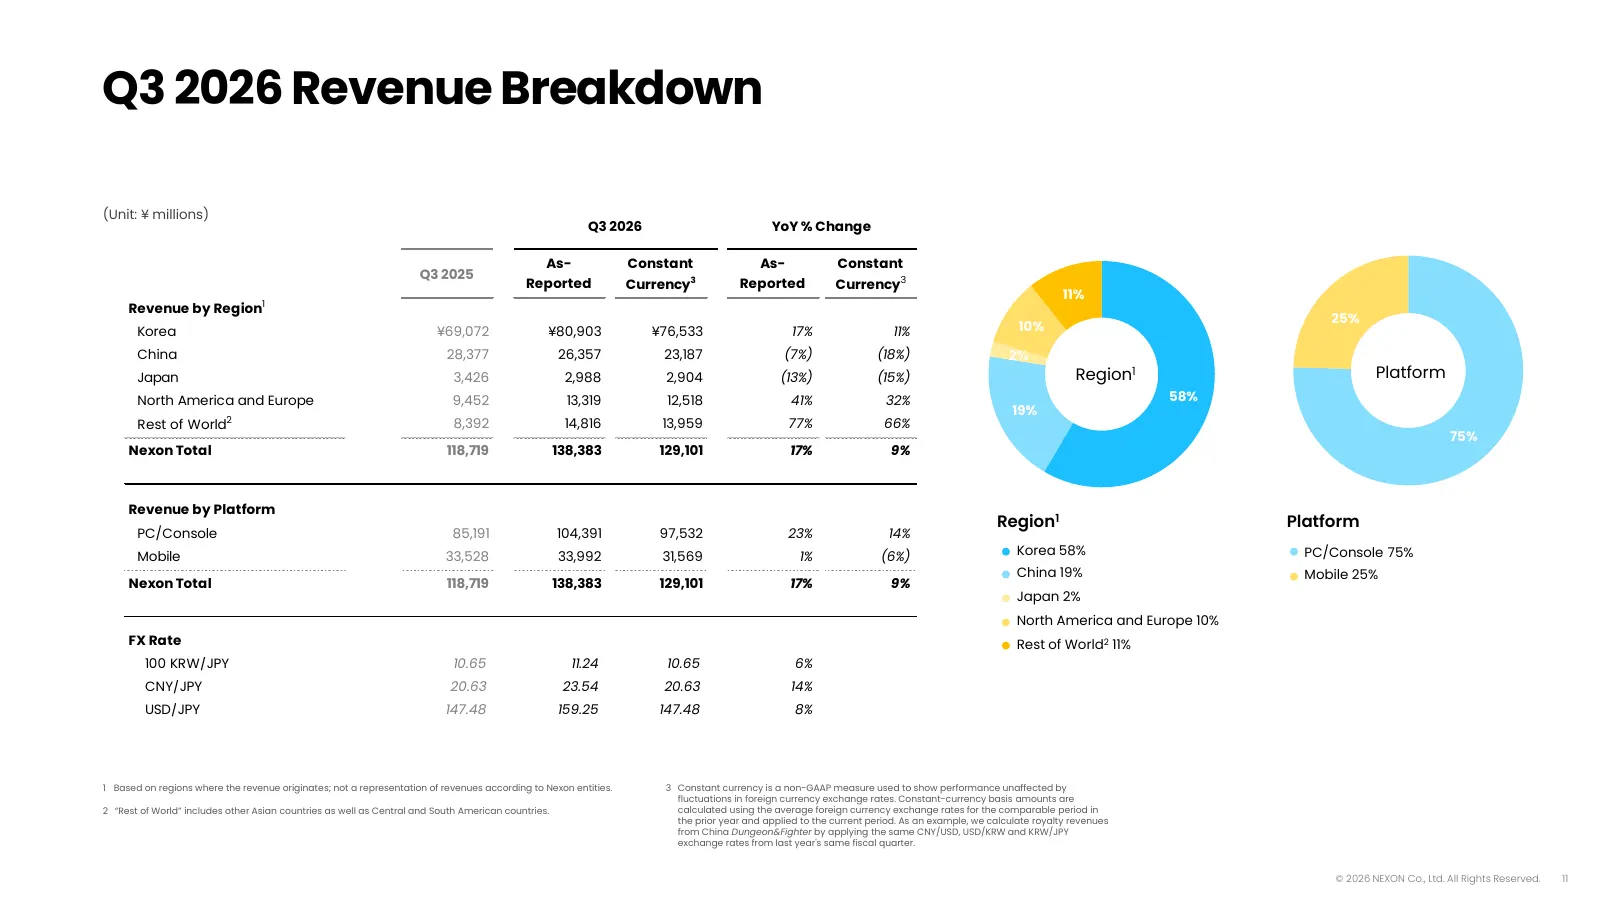
Q3 2026 Revenue Breakdown (Unit: ¥ millions) Q3 2026 YoY % Change As- Constant As- Constant Q3 2025 Reported Currency3 Reported Currency3 11% Revenue by Region1 25% Korea ¥69,072 ¥80,903 ¥76,533 17% 11% 10% China 28,377 26,357 23,187 (7%) (18%) 2% Japan 3,426 2,988 2,904 (13%) (15%) Region1 Platform
Slide 12: Q3 2026 Accumulated Results
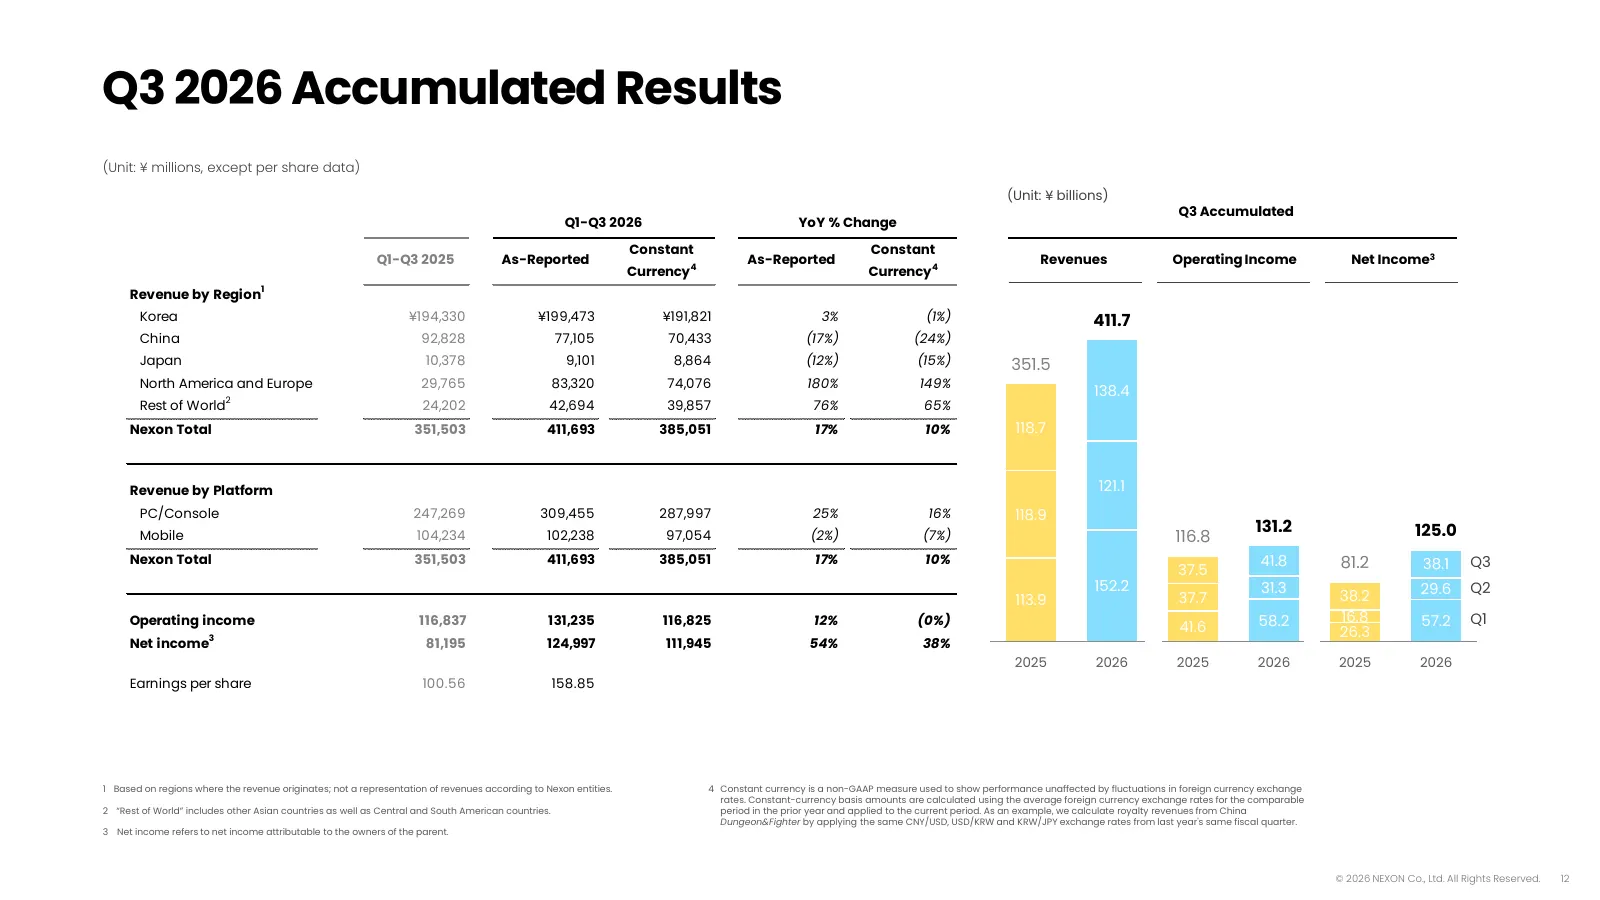
Q3 2026 Accumulated Results (Unit: ¥ millions, except per share data) (Unit: ¥ billions) Q3 Accumulated Q1-Q3 2026 YoY % Change Constant Constant Q1-Q3 2025 As-Reported As-Reported Revenues Operating Income Net Income3 Currency 4 Currency 4 Revenue by Region1 Korea ¥194,330 ¥199,473 ¥191,821 3% (1%)
Slide 13: Q3 2026 Korea – Highlights
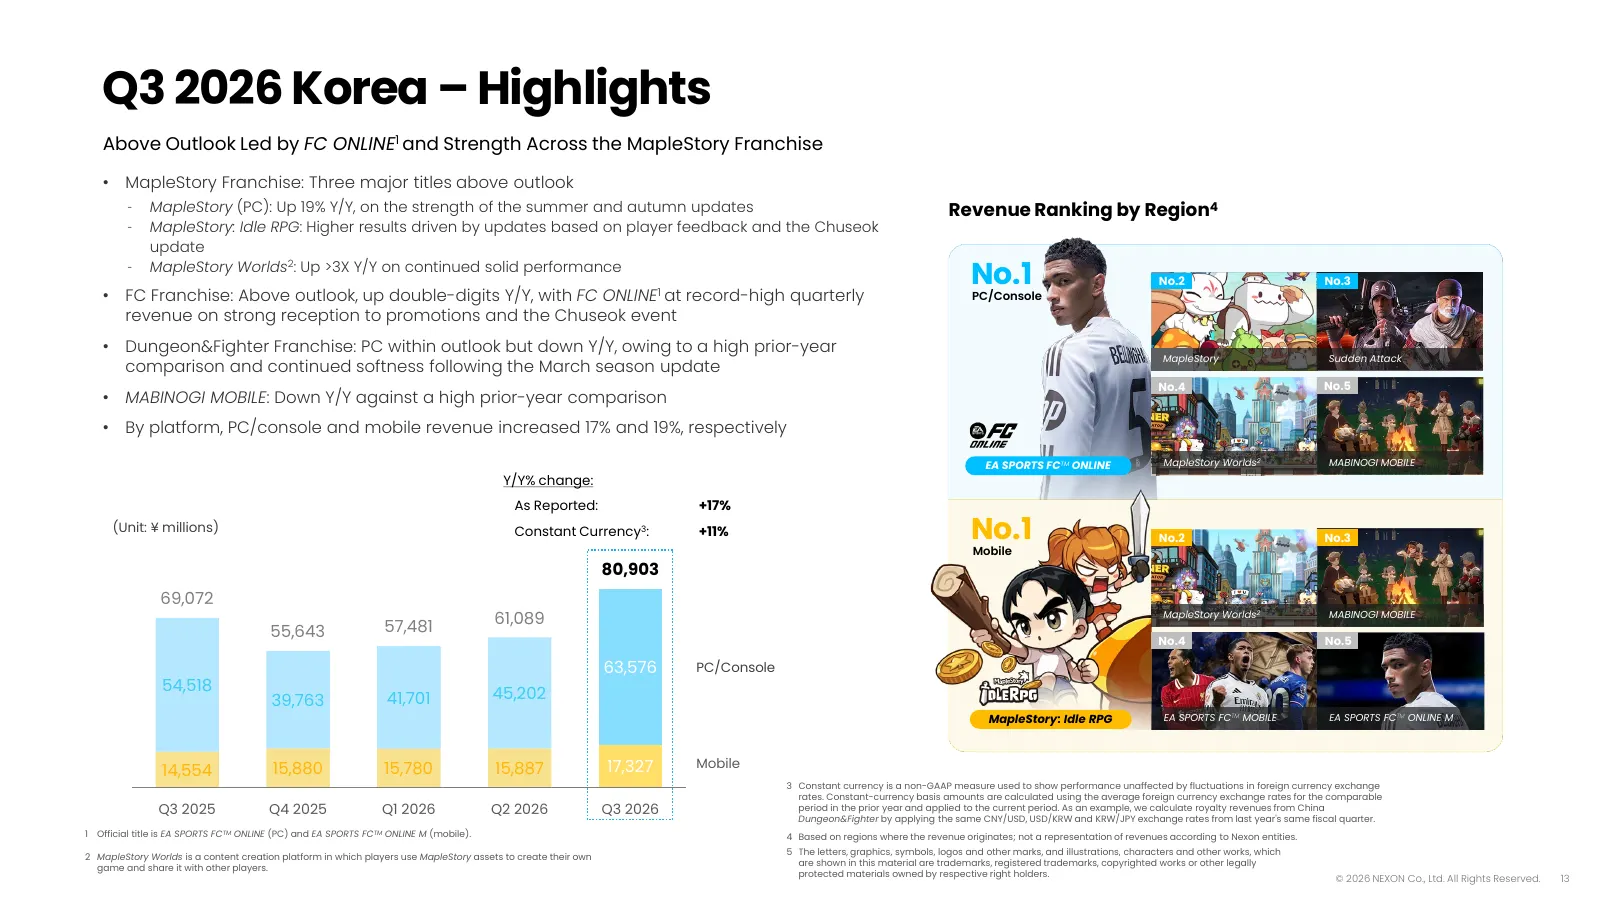
Q3 2026 Korea – Highlights Above Outlook Led by FC ONLINE1 and Strength Across the MapleStory Franchise • MapleStory Franchise: Three major titles above outlook ‐ MapleStory (PC): Up 19% Y/Y, on the strength of the summer and autumn updates Revenue Ranking by Region4 ‐ MapleStory: Idle RPG: Higher r
Slide 14: Q3 2026 China – Highlights
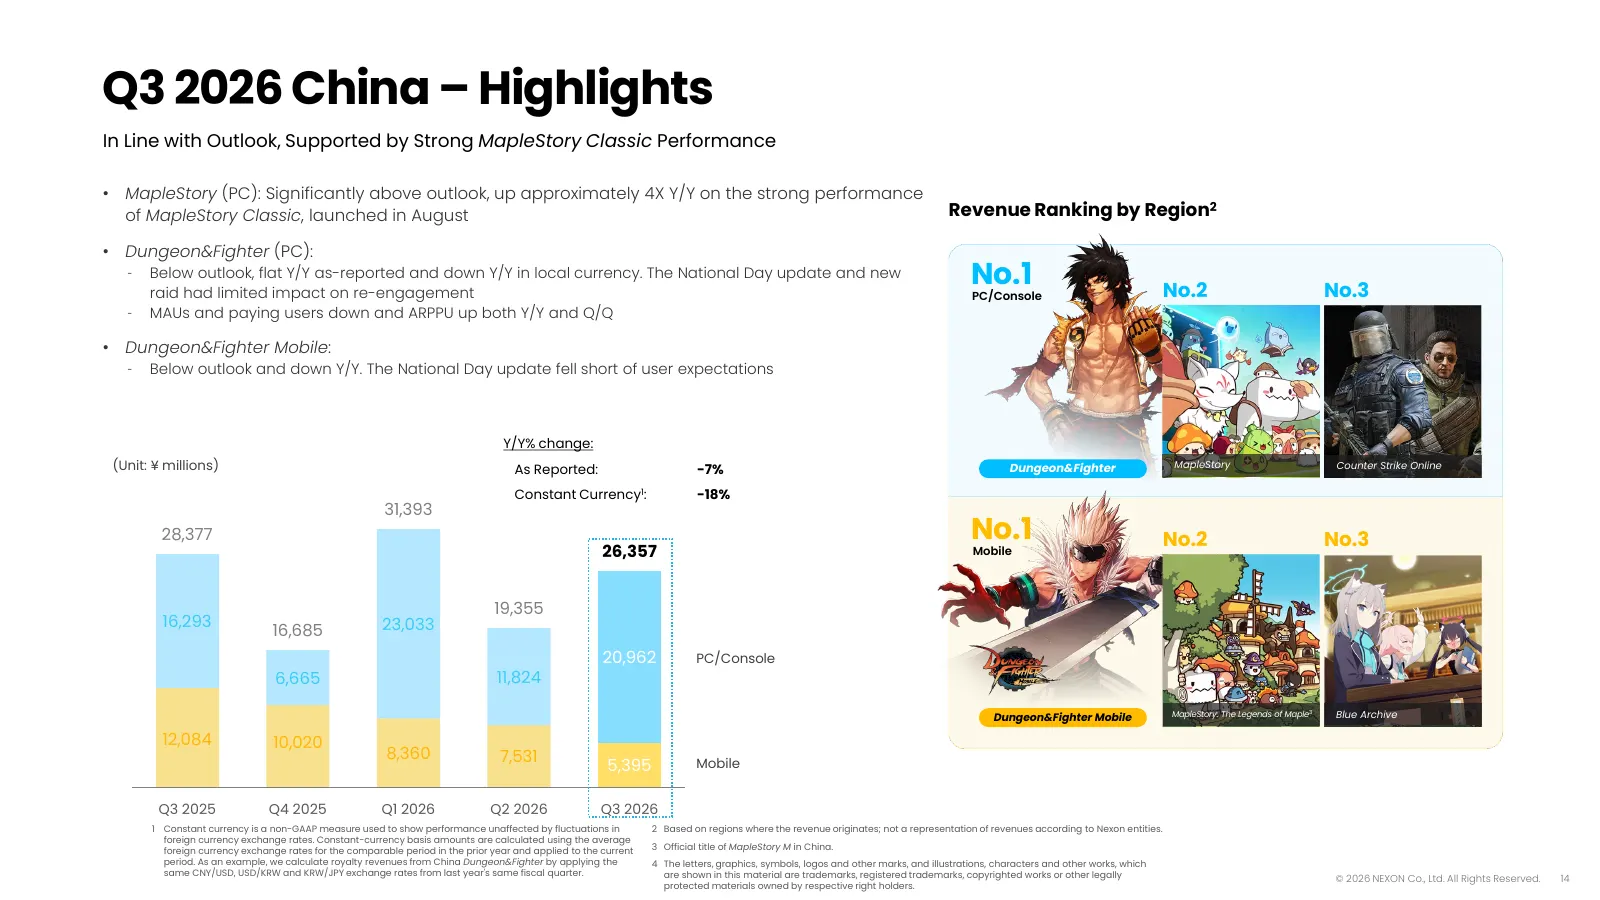
Q3 2026 China – Highlights In Line with Outlook, Supported by Strong MapleStory Classic Performance • MapleStory (PC): Significantly above outlook, up approximately 4X Y/Y on the strong performance of MapleStory Classic, launched in August Revenue Ranking by Region2 • Dungeon&Fighter (PC): ‐ Below o
Slide 15: Q3 2026 Japan – Highlights
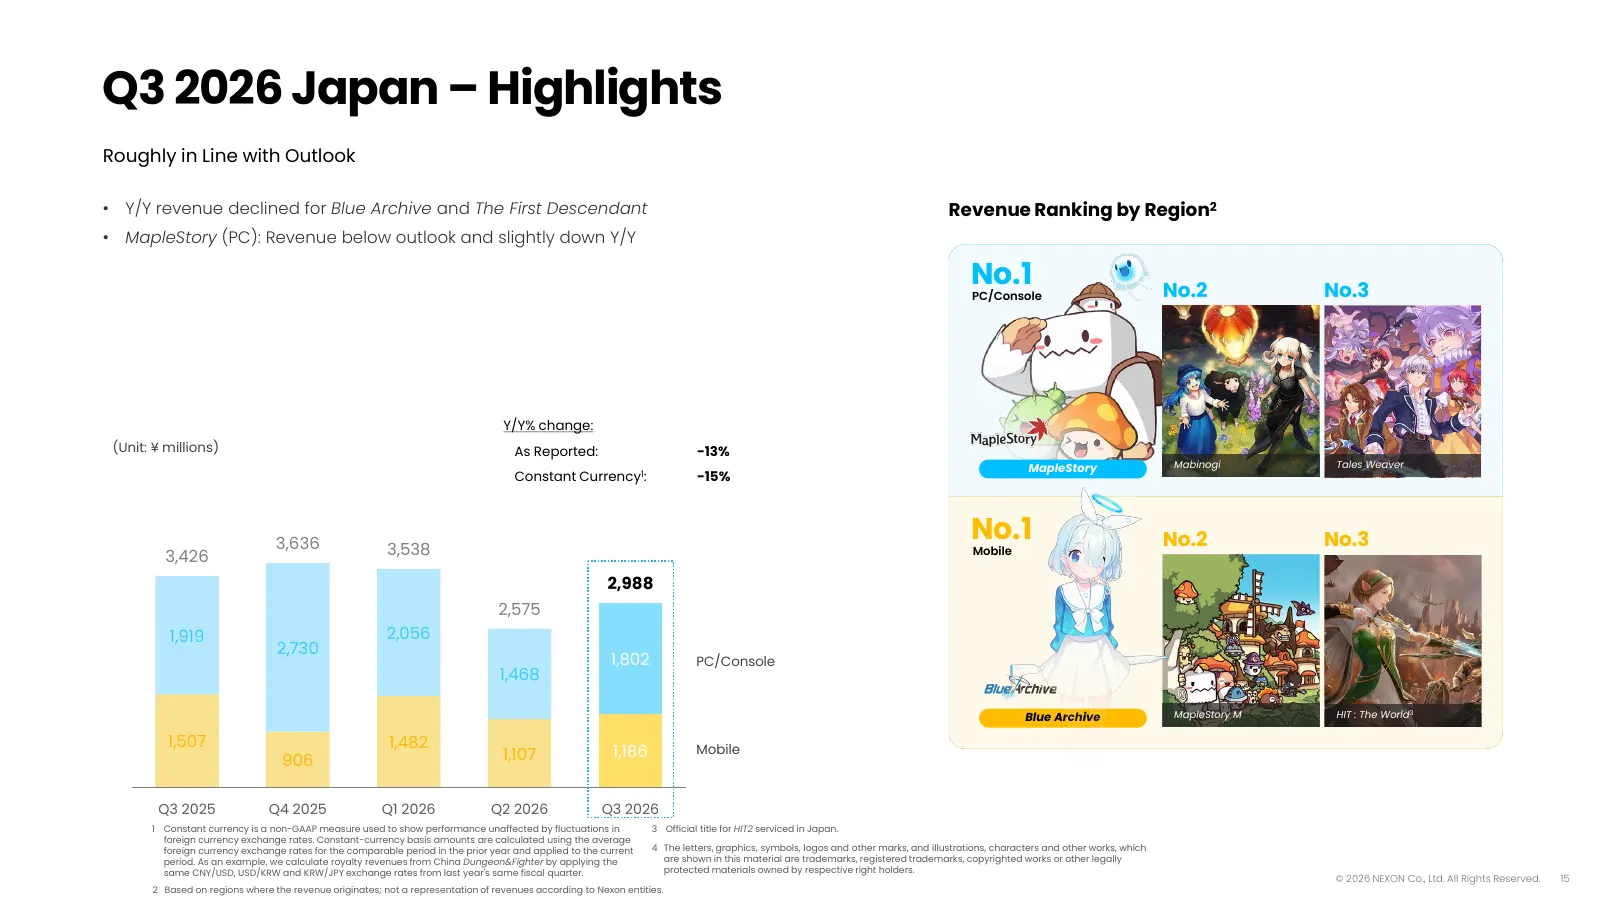
Q3 2026 Japan – Highlights Roughly in Line with Outlook • Y/Y revenue declined for Blue Archive and The First Descendant Revenue Ranking by Region2 • MapleStory (PC): Revenue below outlook and slightly down Y/Y No.1 No.2 No.3 PC/Console Y/Y% change: (Unit: ¥ millions) As Reported: -13% MapleStory Ma
Slide 16: Q3 2026 North America and Europe – Highlights
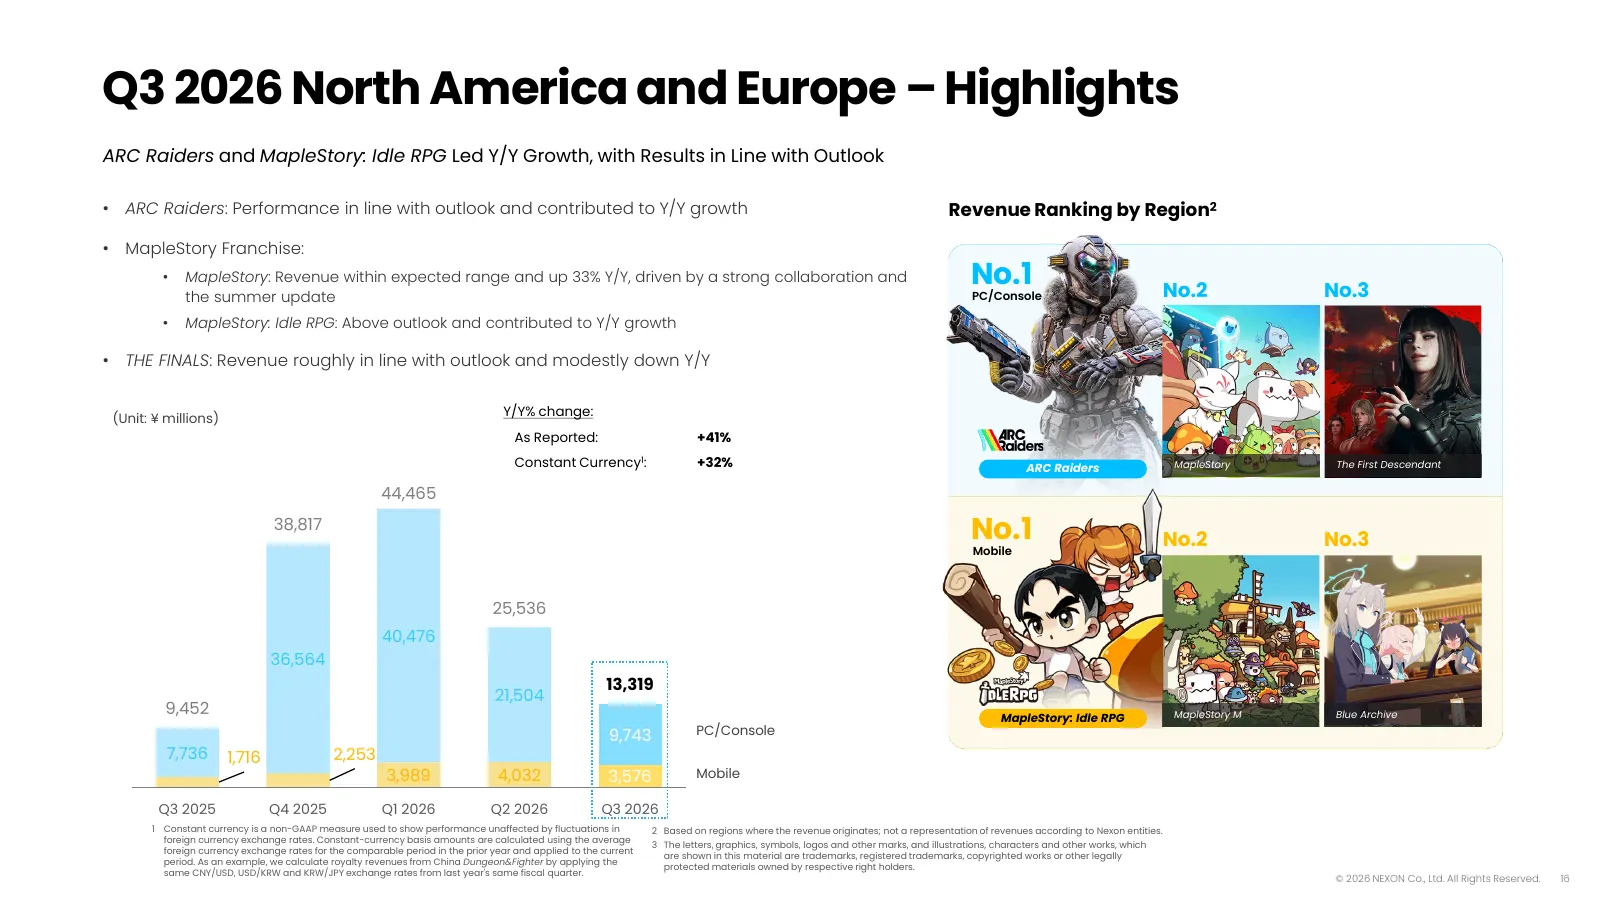
Q3 2026 North America and Europe – Highlights ARC Raiders and MapleStory: Idle RPG Led Y/Y Growth, with Results in Line with Outlook • ARC Raiders: Performance in line with outlook and contributed to Y/Y growth Revenue Ranking by Region2 • MapleStory Franchise: • MapleStory: Revenue within expected
Slide 17: Q3 2026 Rest of World – Highlights
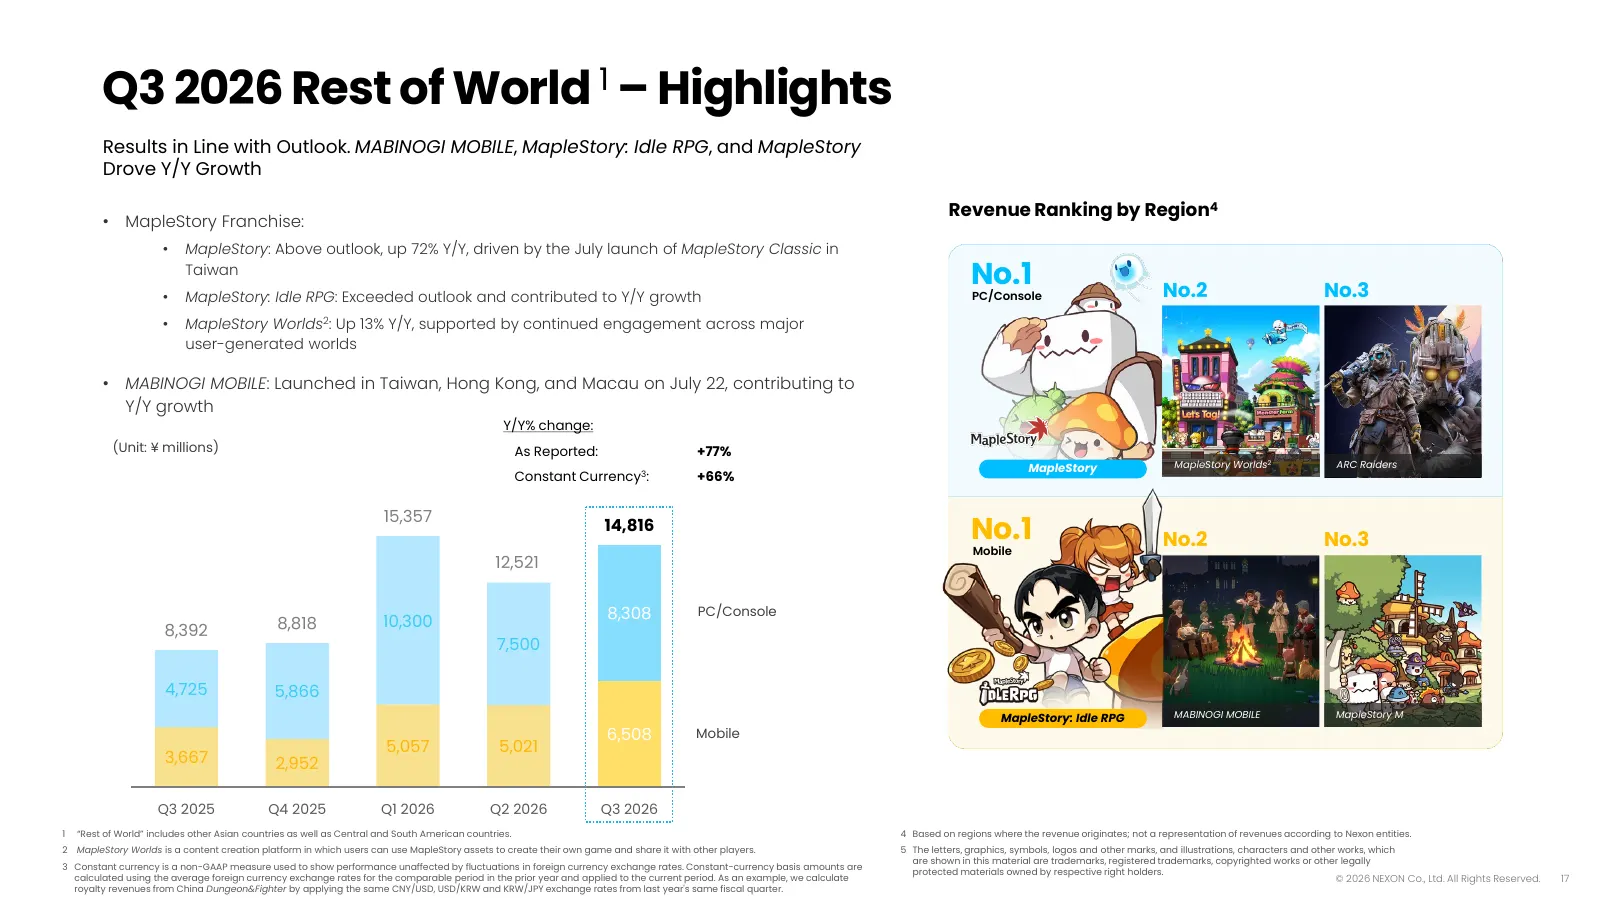
Q3 2026 Rest of World 1 – Highlights Results in Line with Outlook. MABINOGI MOBILE, MapleStory: Idle RPG, and MapleStory Drove Y/Y Growth Revenue Ranking by Region4 • MapleStory Franchise: • MapleStory: Above outlook, up 72% Y/Y, driven by the July launch of MapleStory Classic in Taiwan No.1 No.2 No
Slide 18: Cost Breakdown
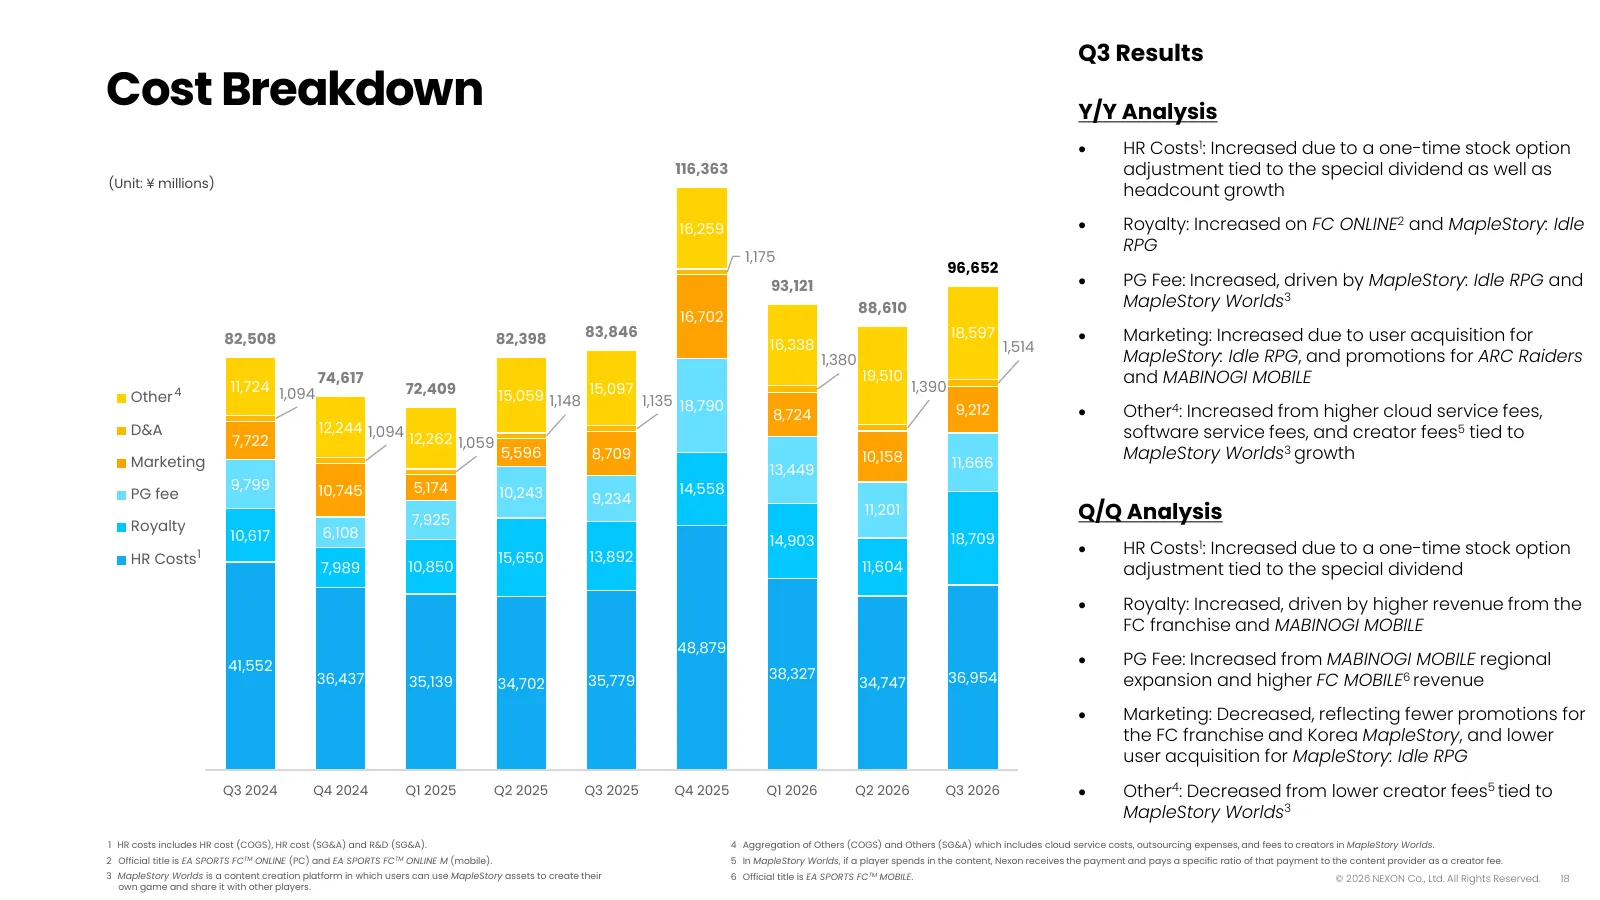
Q3 Results Cost Breakdown Y/Y Analysis • HR Costs1: Increased due to a one-time stock option 116,363 adjustment tied to the special dividend as well as (Unit: ¥ millions) headcount growth 16,259 • Royalty: Increased on FC ONLINE2 and MapleStory: Idle RPG 1,175 96,652 93,121 • PG Fee: Increased, driv
Slide 19: Q4 2026 Outlook
Q4 2026 Outlook © 2026 NEXON Co., Ltd. All Rights Reserved. 19
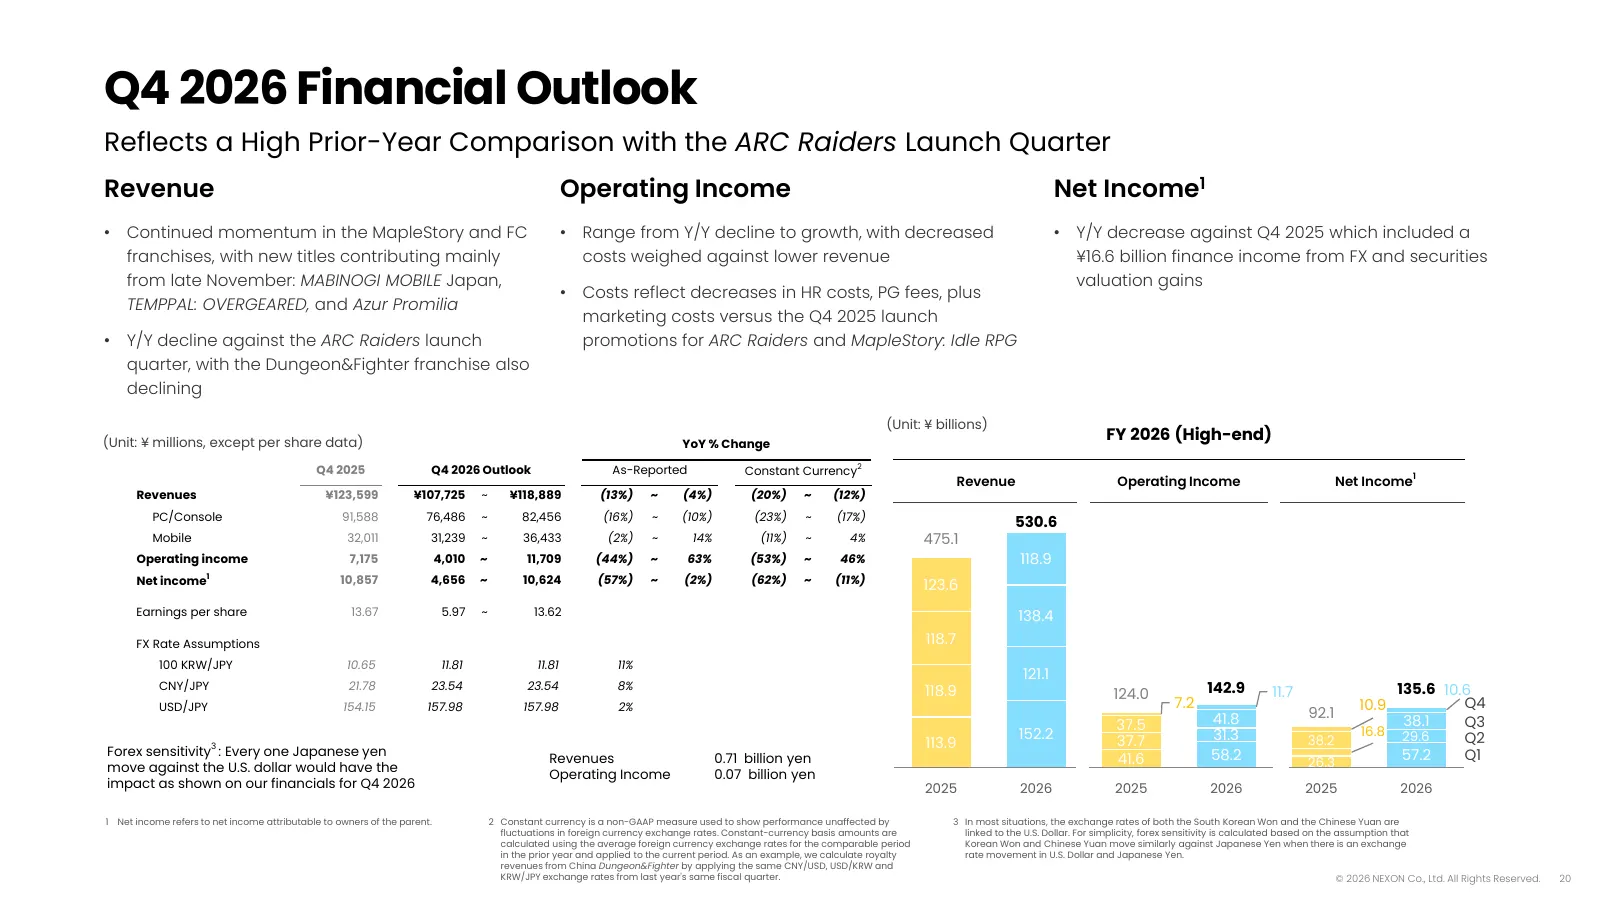
Slide 20: Q4 2026 Financial Outlook
Q4 2026 Financial Outlook Reflects a High Prior-Year Comparison with the ARC Raiders Launch Quarter Revenue Operating Income Net Income1 • Continued momentum in the MapleStory and FC • Range from Y/Y decline to growth, with decreased • Y/Y decrease against Q4 2025 which included a franchises, with n
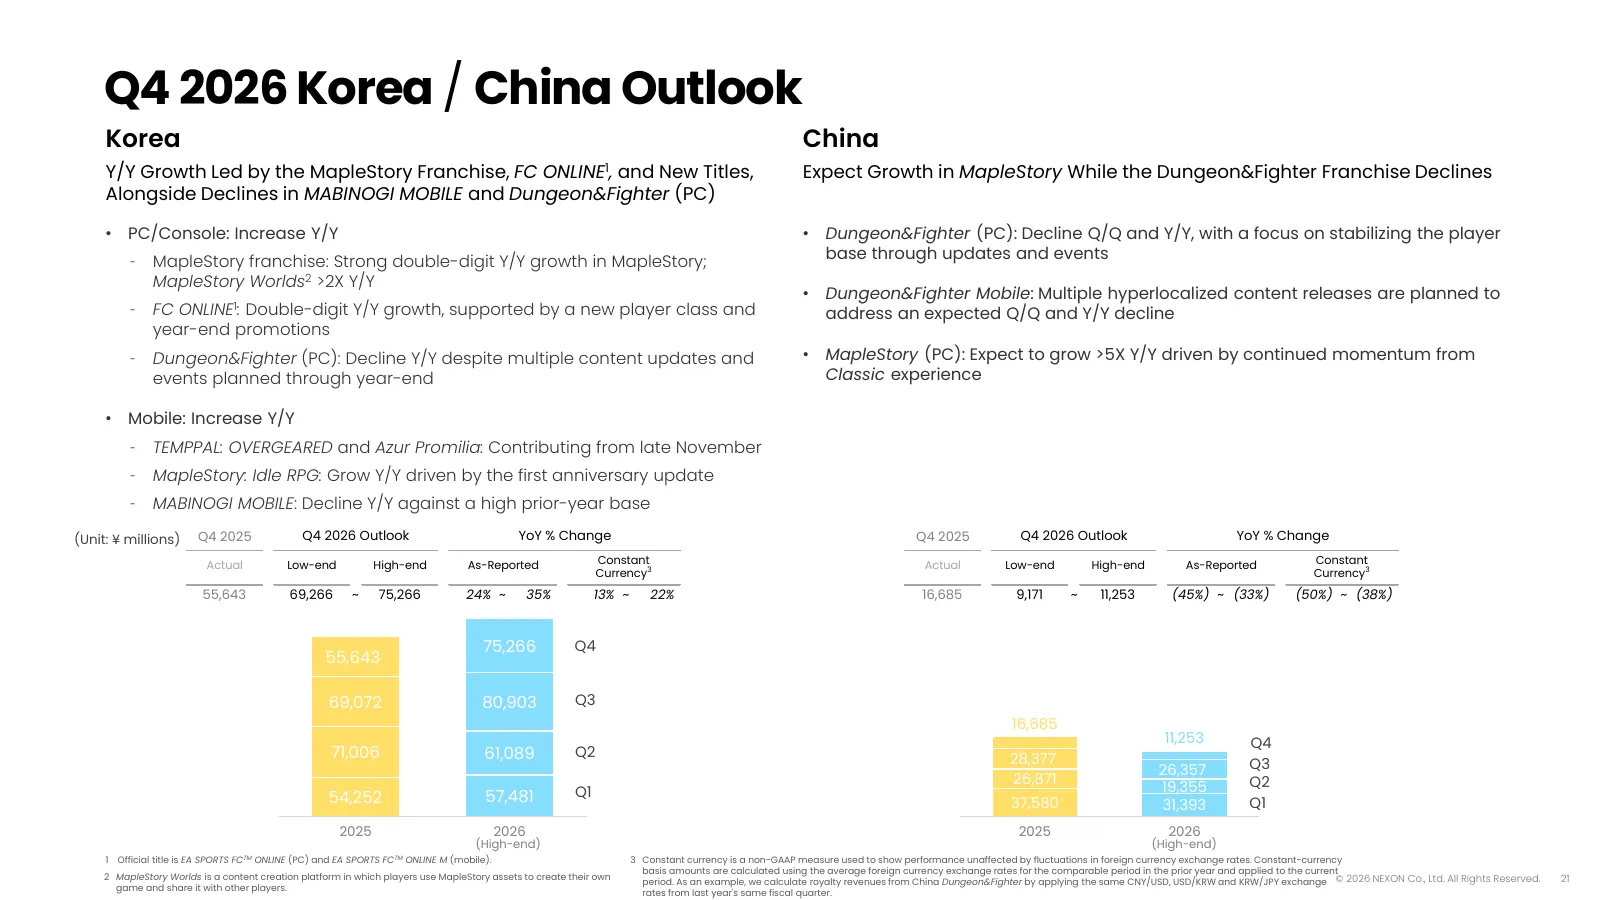
Slide 21: Q4 2026 Korea / China Outlook
Q4 2026 Korea / China Outlook Korea China Y/Y Growth Led by the MapleStory Franchise, FC ONLINE1, and New Titles, Expect Growth in MapleStory While the Dungeon&Fighter Franchise Declines Alongside Declines in MABINOGI MOBILE and Dungeon&Fighter (PC) • PC/Console: Increase Y/Y • Dungeon&Fighter (PC):
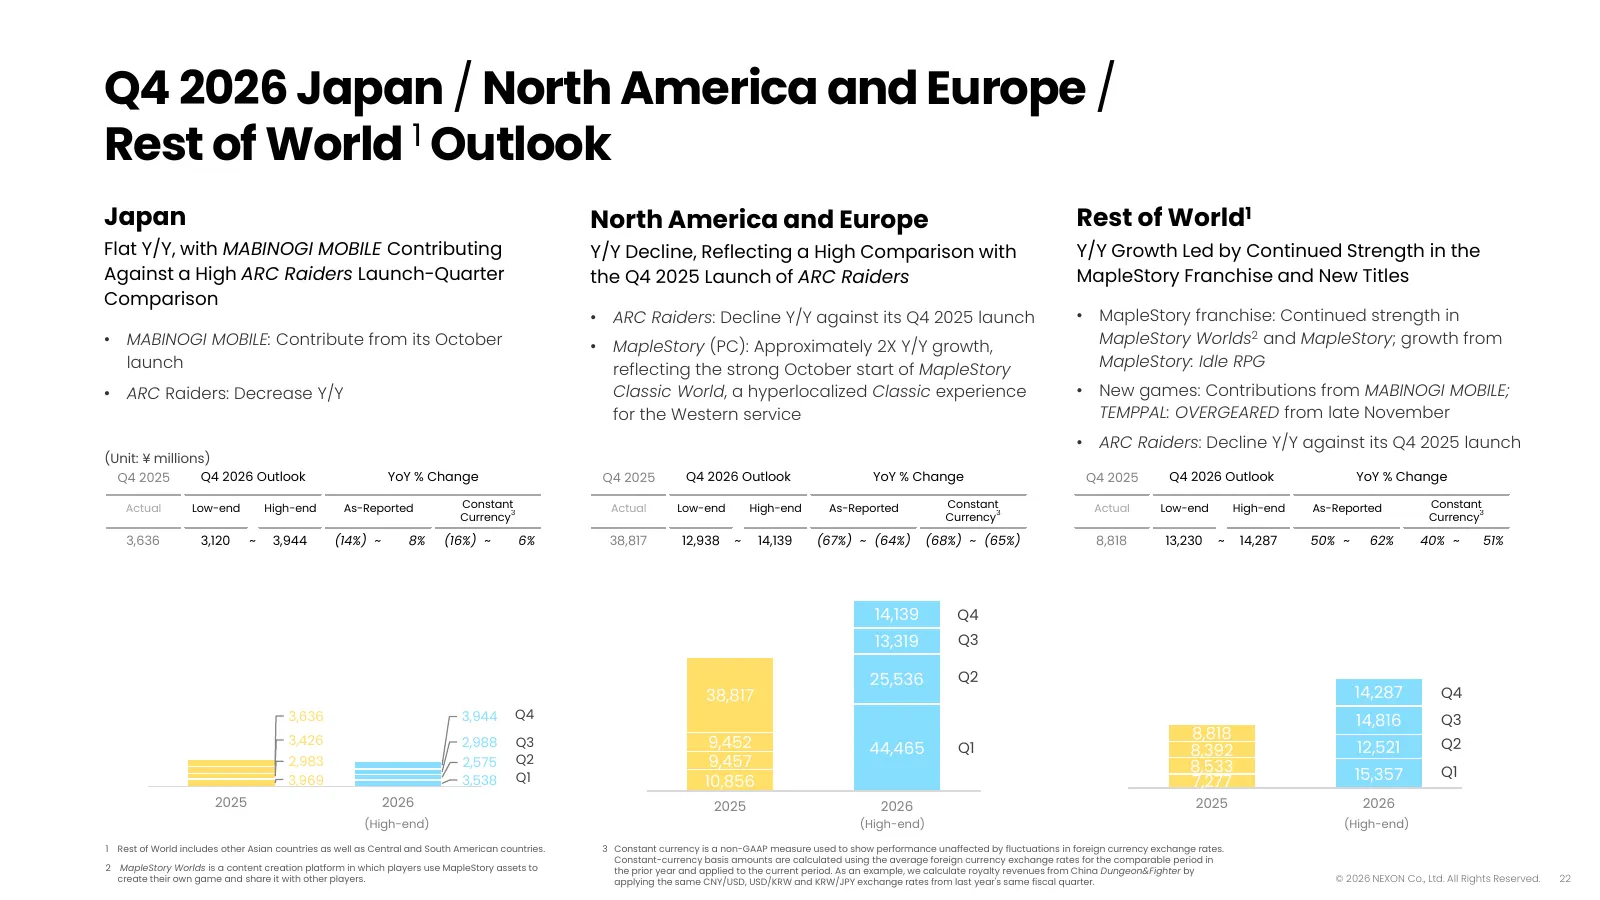
Slide 22: Q4 2026 Japan / North America and Europe / Rest of World Outlook
Q4 2026 Japan / North America and Europe / Rest of World 1 Outlook Japan North America and Europe Rest of World1 Flat Y/Y, with MABINOGI MOBILE Contributing Y/Y Decline, Reflecting a High Comparison with Y/Y Growth Led by Continued Strength in the Against a High ARC Raiders Launch-Quarter the Q4 202
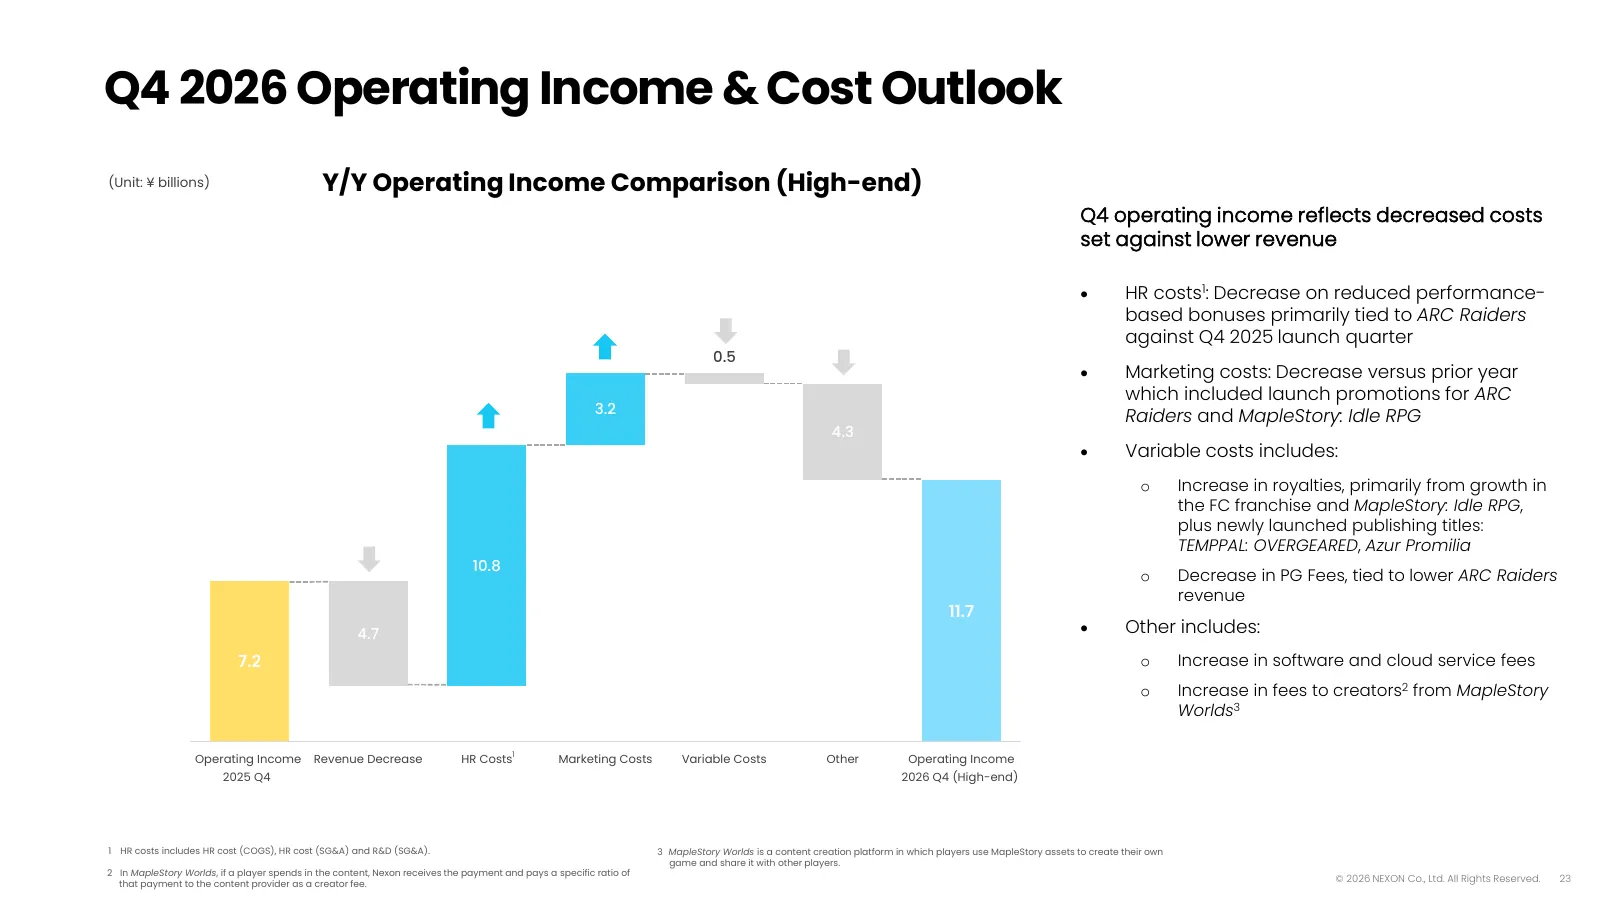
Slide 23: Q4 2026 Operating Income & Cost Outlook
Q4 2026 Operating Income & Cost Outlook (Unit: ¥ billions) Y/Y Operating Income Comparison (High-end) Q4 operating income reflects decreased costs set against lower revenue • HR costs1: Decrease on reduced performance- based bonuses primarily tied to ARC Raiders against Q4 2025 launch quarter 0.5 •
Slide 24: Capital Allocation and Shareholder Returns
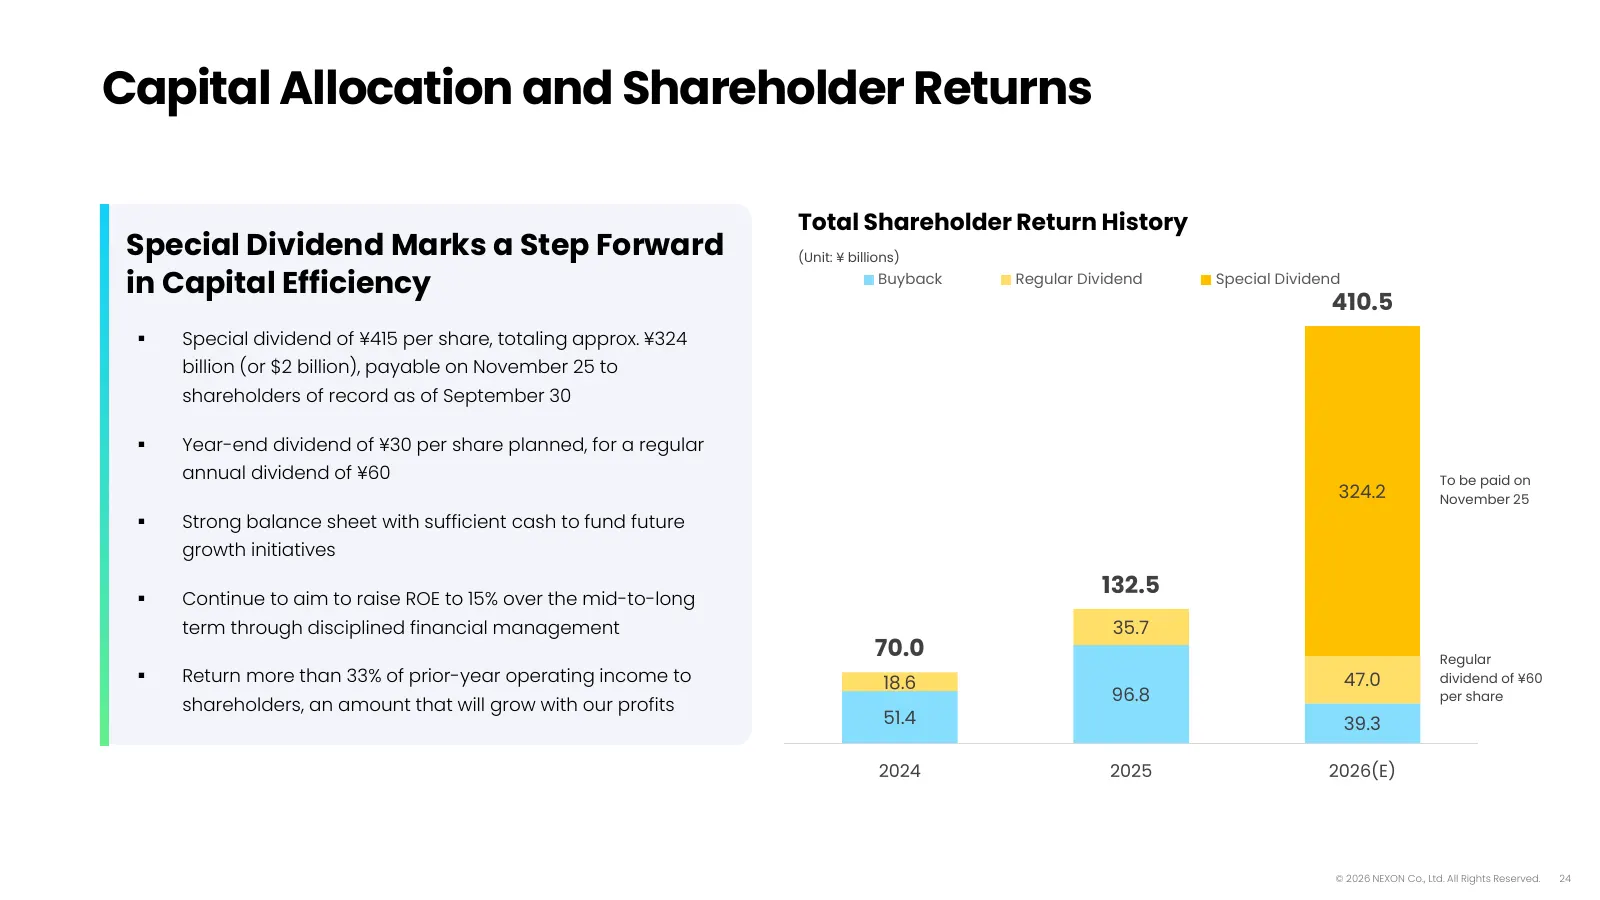
Capital Allocation and Shareholder Returns Total Shareholder Return History Special Dividend Marks a Step Forward (Unit: ¥ billions) in Capital Efficiency Buyback Regular Dividend Special Dividend 410.5 Special dividend of ¥415 per share, totaling approx. ¥324 billion (or $2 billion), payable on N

Slide 25: Pipeline
Pipeline © 2026 NEXON Co., Ltd. All Rights Reserved. 25
Slide 26: Azur Promilia, Arad: Idle RPG, TEMPPAL: OVERGEARED
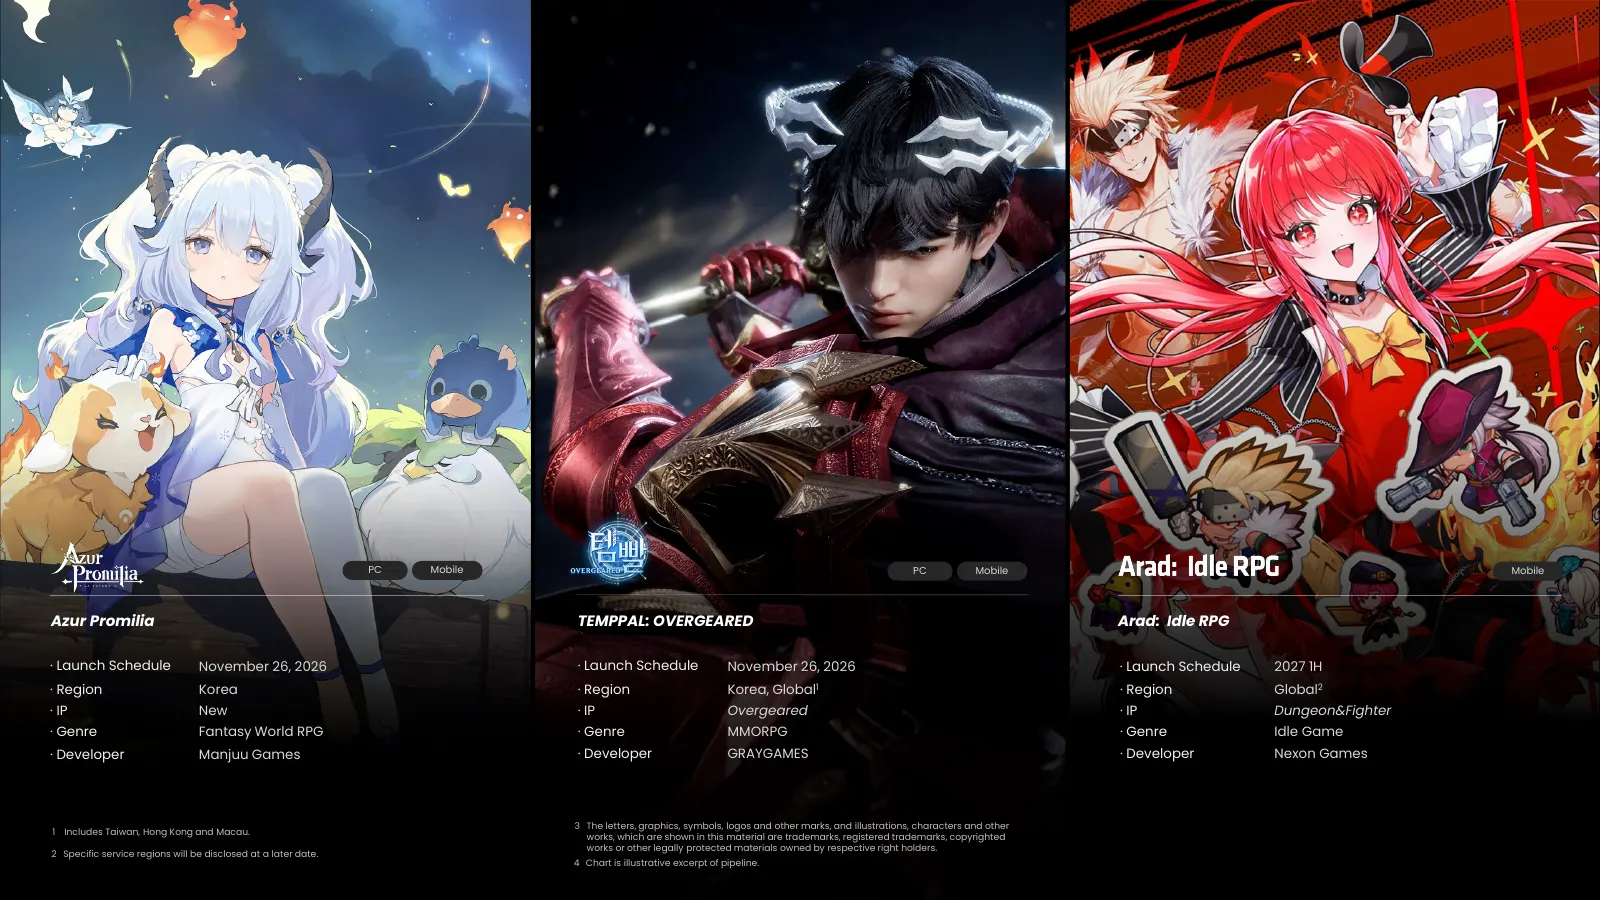
PC Mobile PC Mobile Mobile Azur Promilia TEMPPAL: OVERGEARED Arad: Idle RPG · Launch Schedule November 26, 2026 · Launch Schedule November 26, 2026 · Launch Schedule 2027 1H · Region Korea · Region Korea, Global1 · Region Global2 · IP New · IP Overgeared · IP Dungeon&Fighter · Genre Fantasy World RP
Slide 27: Vindictus: Defying Fate, NAKWON: LAST PARADISE
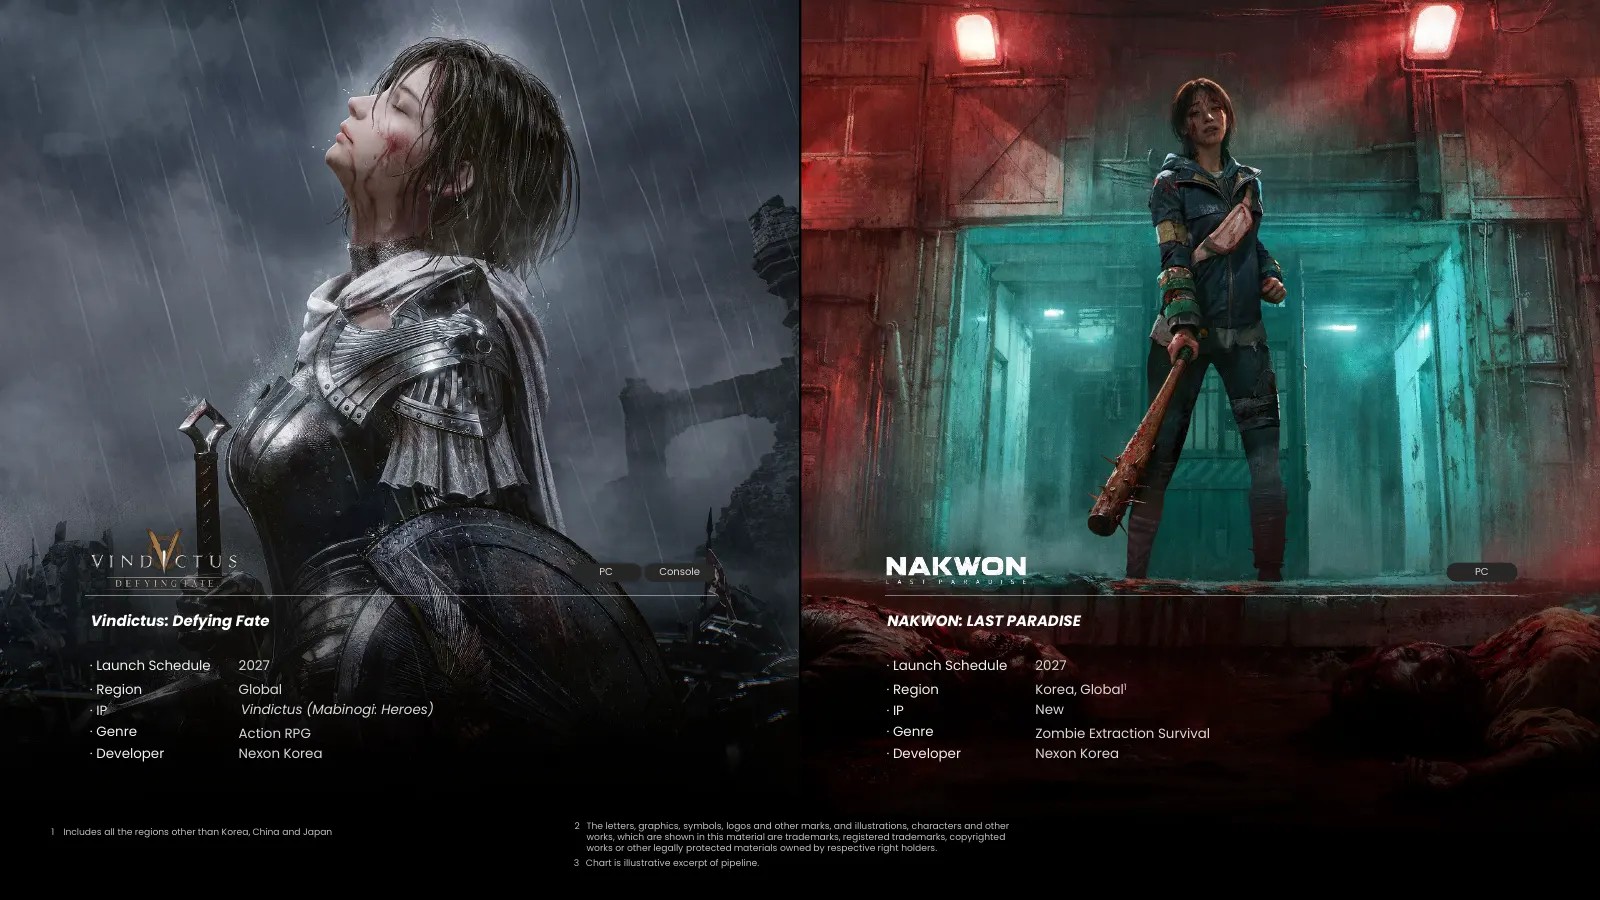
PC Console PC Vindictus: Defying Fate NAKWON: LAST PARADISE · Launch Schedule 2027 · Launch Schedule 2027 · Region Global · Region Korea, Global1 · IP Vindictus (Mabinogi: Heroes) · IP New · Genre Action RPG · Genre Zombie Extraction Survival · Developer Nexon Korea · Developer Nexon Korea 2 The let
Slide 28: FAREIDOLIA, Woochi the Wayfarer
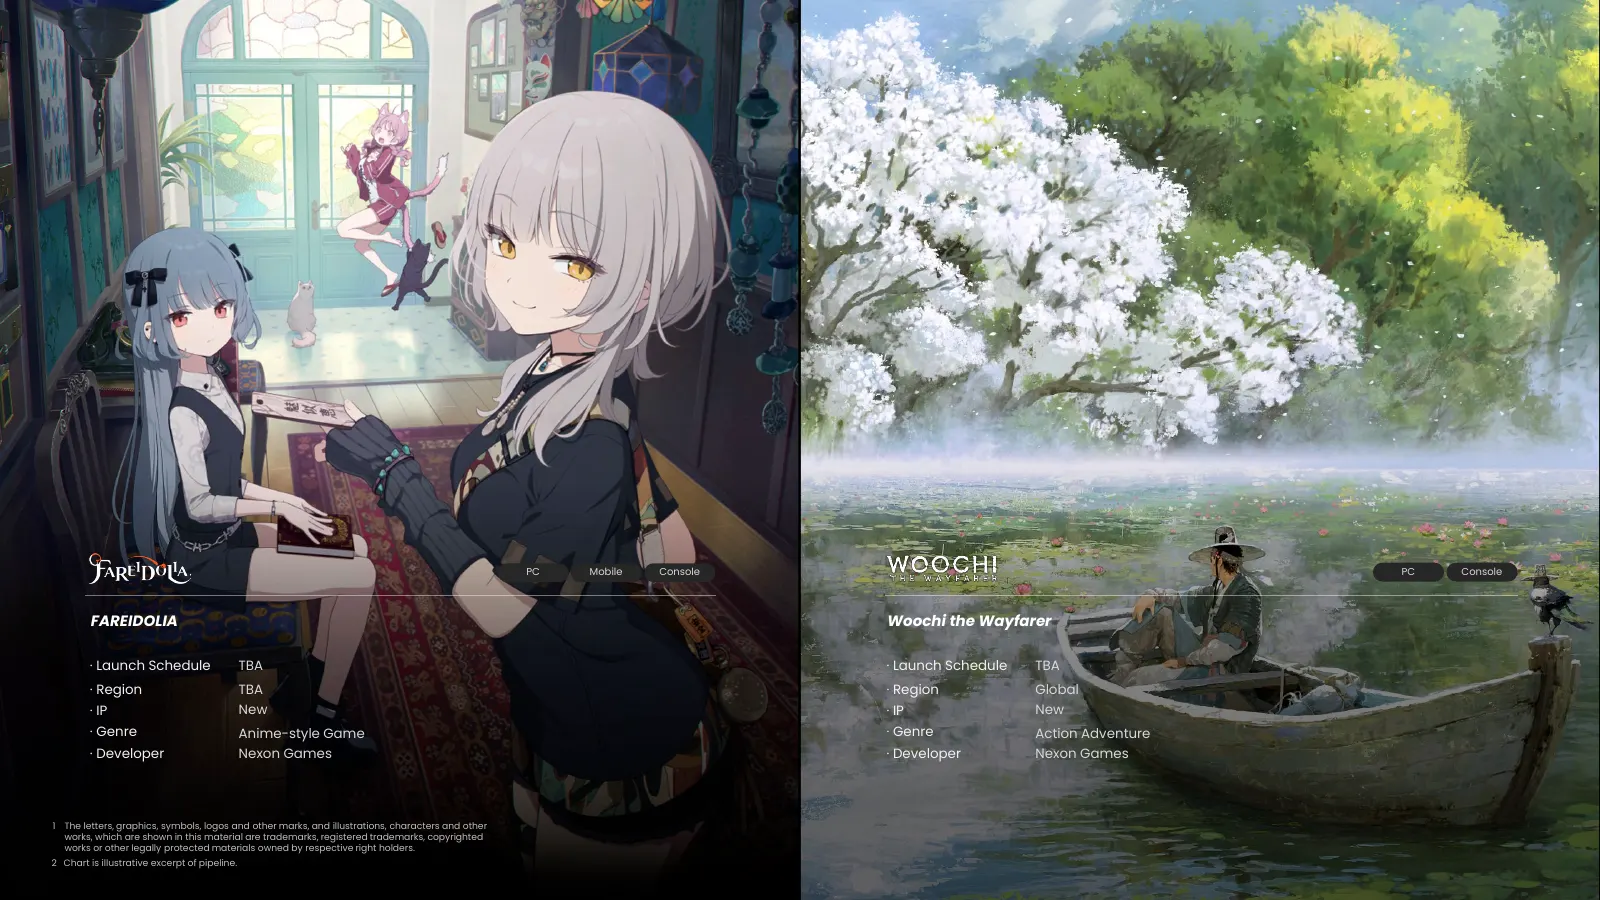
PC Mobile Console PC Console FAREIDOLIA Woochi the Wayfarer · Launch Schedule TBA · Launch Schedule TBA · Region TBA · Region Global · IP New · IP New · Genre Anime-style Game · Genre Action Adventure · Developer Nexon Games · Developer Nexon Games 1 The letters, graphics, symbols, logos and other m
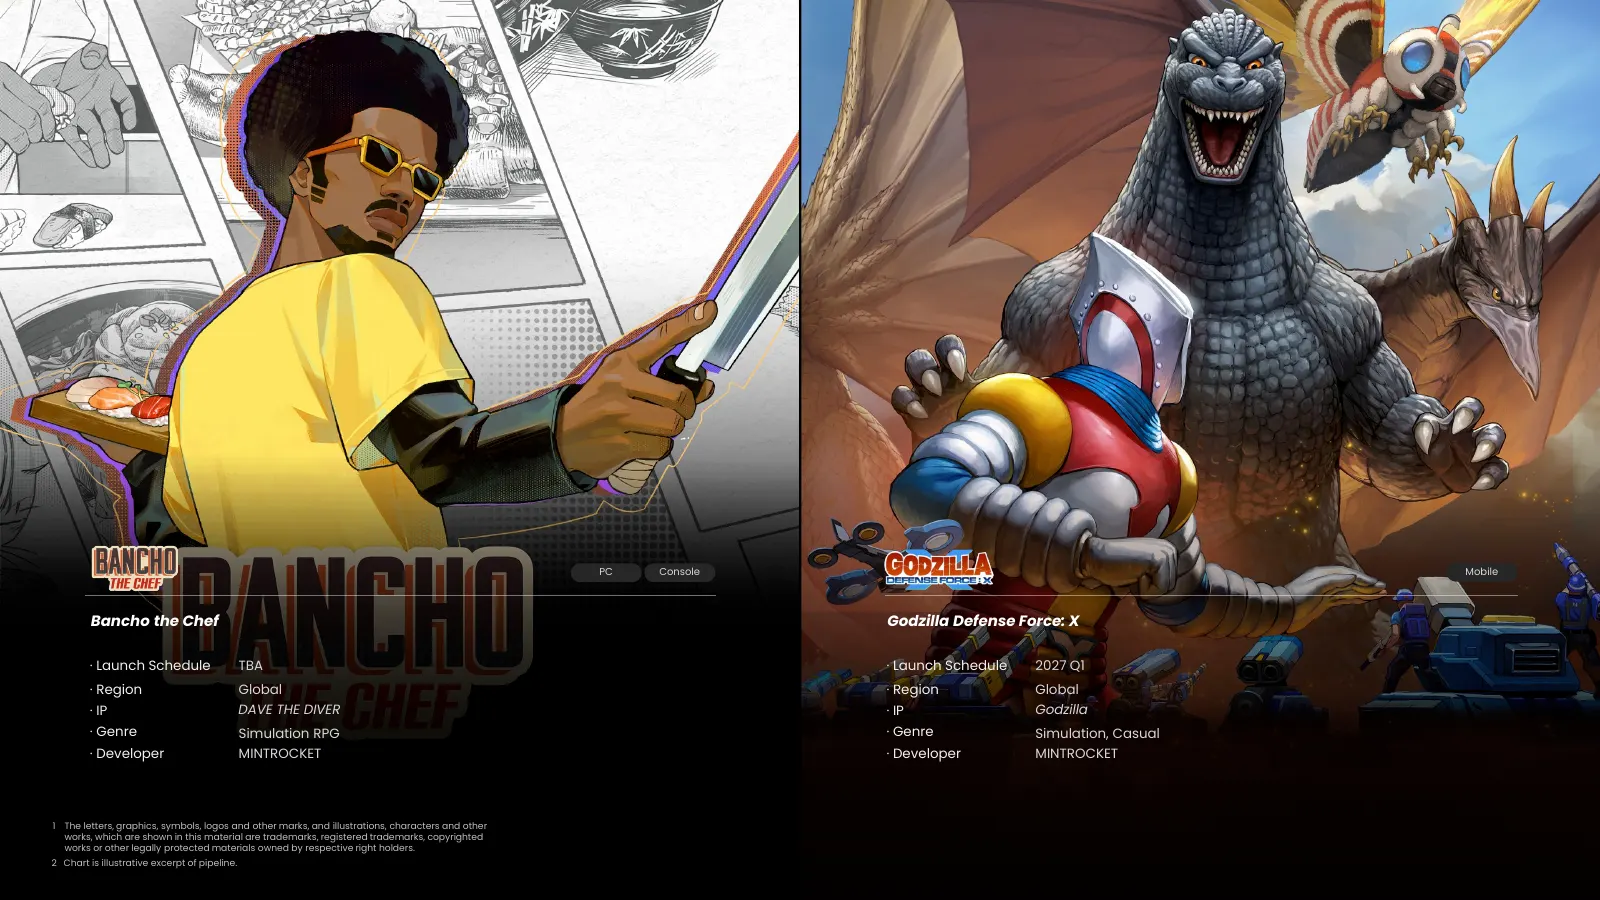
Slide 29: Bancho the Chef, Godzilla Defense Force: X
PC Console Mobile Bancho the Chef Godzilla Defense Force: X · Launch Schedule TBA · Launch Schedule 2027 Q1 · Region Global · Region Global · IP DAVE THE DIVER · IP Godzilla · Genre Simulation RPG · Genre Simulation, Casual · Developer MINTROCKET · Developer MINTROCKET 1 The letters, graphics, symbo
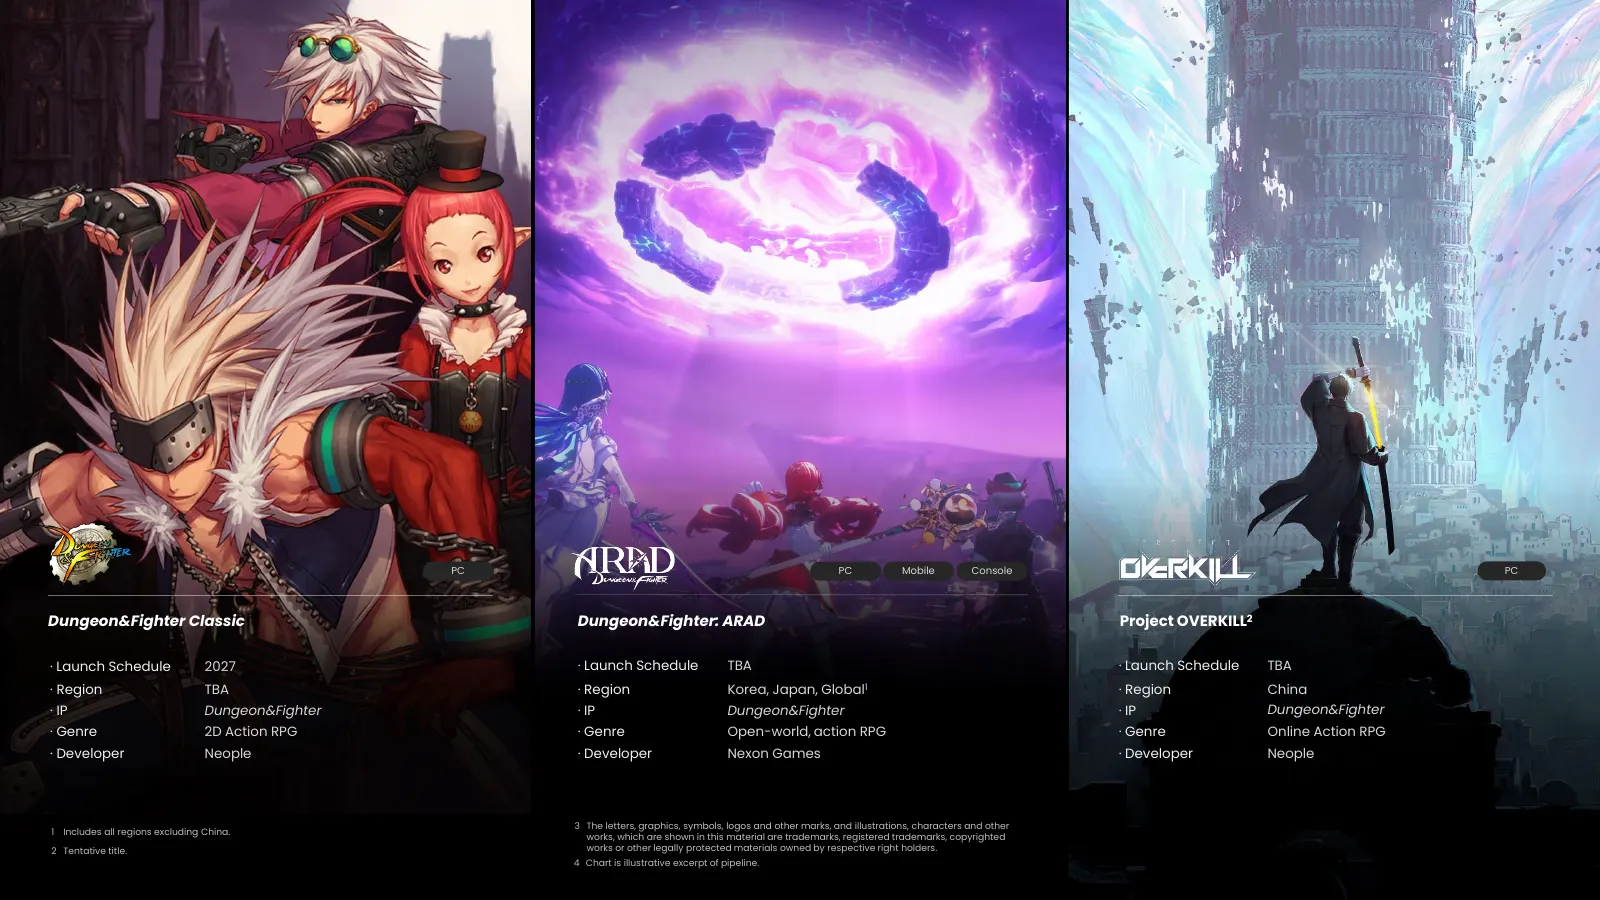
Slide 30: Dungeon&Fighter Classic, ARAD, Project OVERKILL
PC PC Mobile Console PC Dungeon&Fighter Classic Dungeon&Fighter: ARAD Project OVERKILL2 · Launch Schedule 2027 · Launch Schedule TBA · Launch Schedule TBA · Region TBA · Region Korea, Japan, Global1 · Region China · IP Dungeon&Fighter · IP Dungeon&Fighter · IP Dungeon&Fighter · Genre 2D Action RPG ·

Slide 31: Appendix
Appendix © 2026 NEXON Co., Ltd. All Rights Reserved. 31
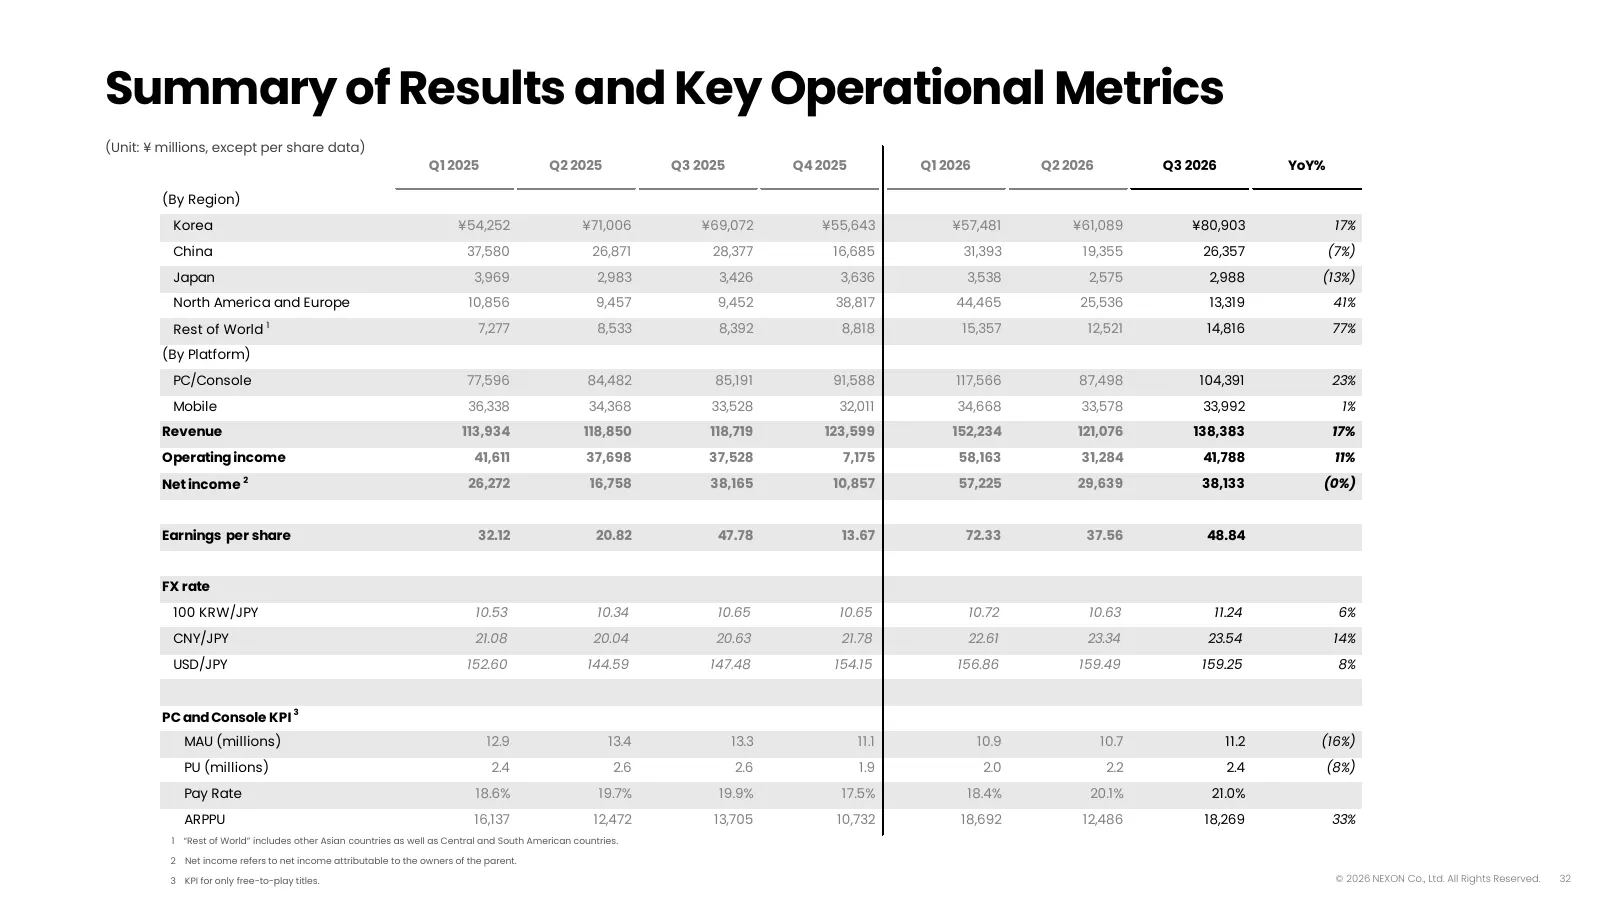
Slide 32: Summary of Results and Key Operational Metrics
Summary of Results and Key Operational Metrics (Unit: ¥ millions, except per share data) Q1 2025 Q2 2025 Q3 2025 Q4 2025 Q1 2026 Q2 2026 Q3 2026 YoY% (By Region) Korea ¥54,252 ¥71,006 ¥69,072 ¥55,643 ¥57,481 ¥61,089 ¥80,903 17% China 37,580 26,871 28,377 16,685 31,393 19,355 26,357 (7%) Japan 3,969
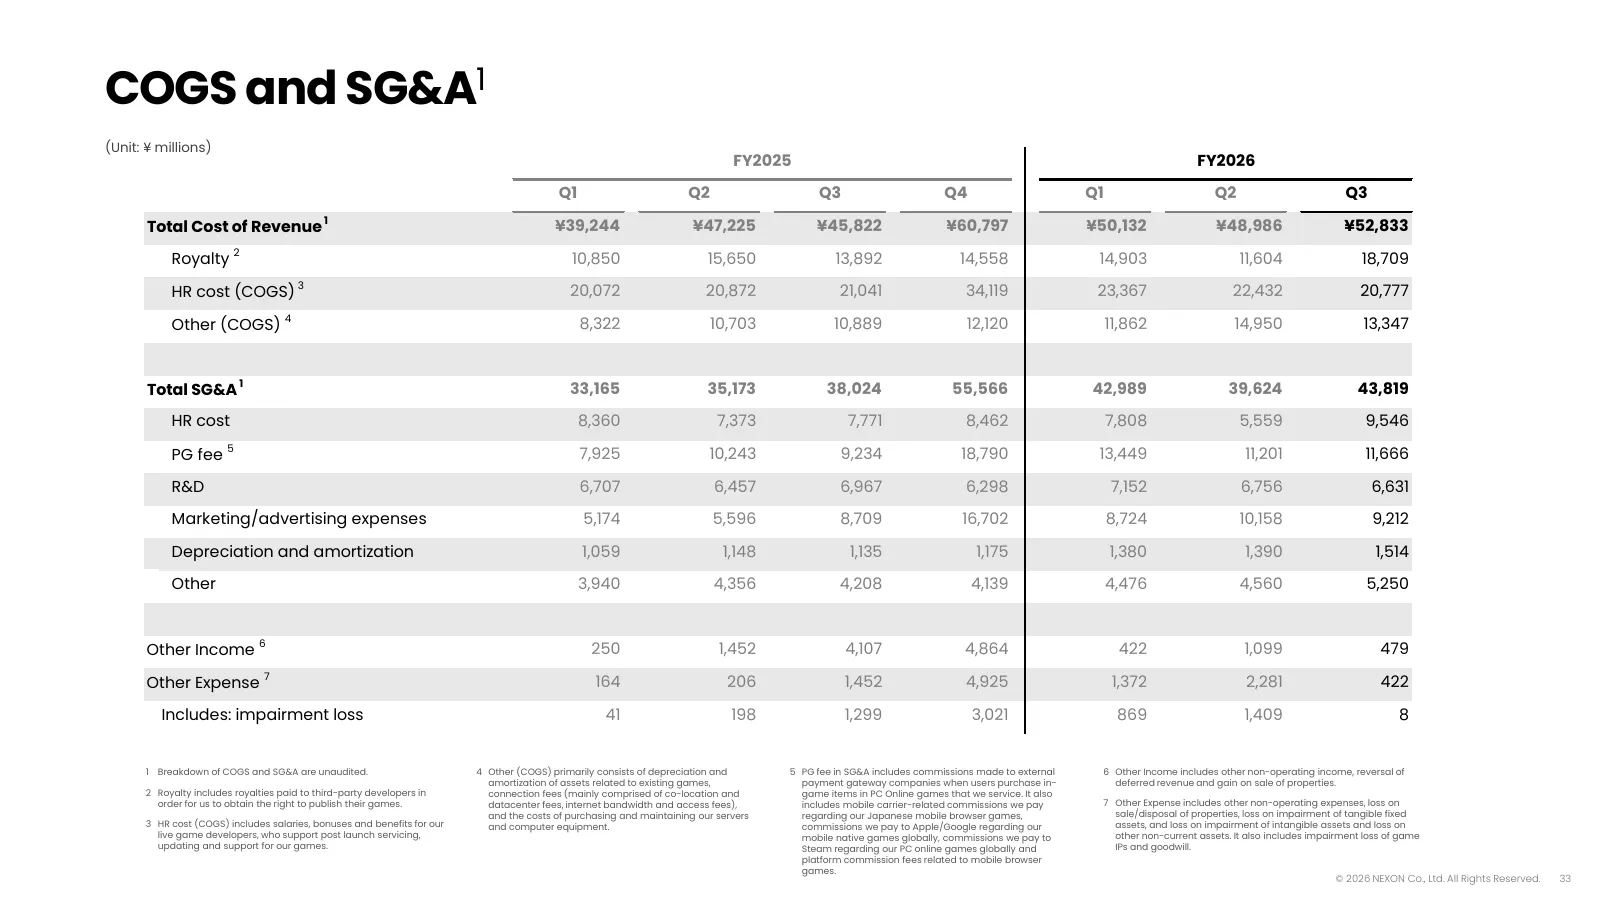
Slide 33: COGS and SG&A
COGS and SG&A1 (Unit: ¥ millions) FY2025 FY2026 Q1 Q2 Q3 Q4 Q1 Q2 Q3 1 Total Cost of Revenue ¥39,244 ¥47,225 ¥45,822 ¥60,797 ¥50,132 ¥48,986 ¥52,833 2 Royalty 10,850 15,650 13,892 14,558 14,903 11,604 18,709 HR cost (COGS) 3 20,072 20,872 21,041 34,119 23,367 22,432 20,777 4 Other (COGS) 8,322 10,70
Slide 34: P&L Below Operating Income
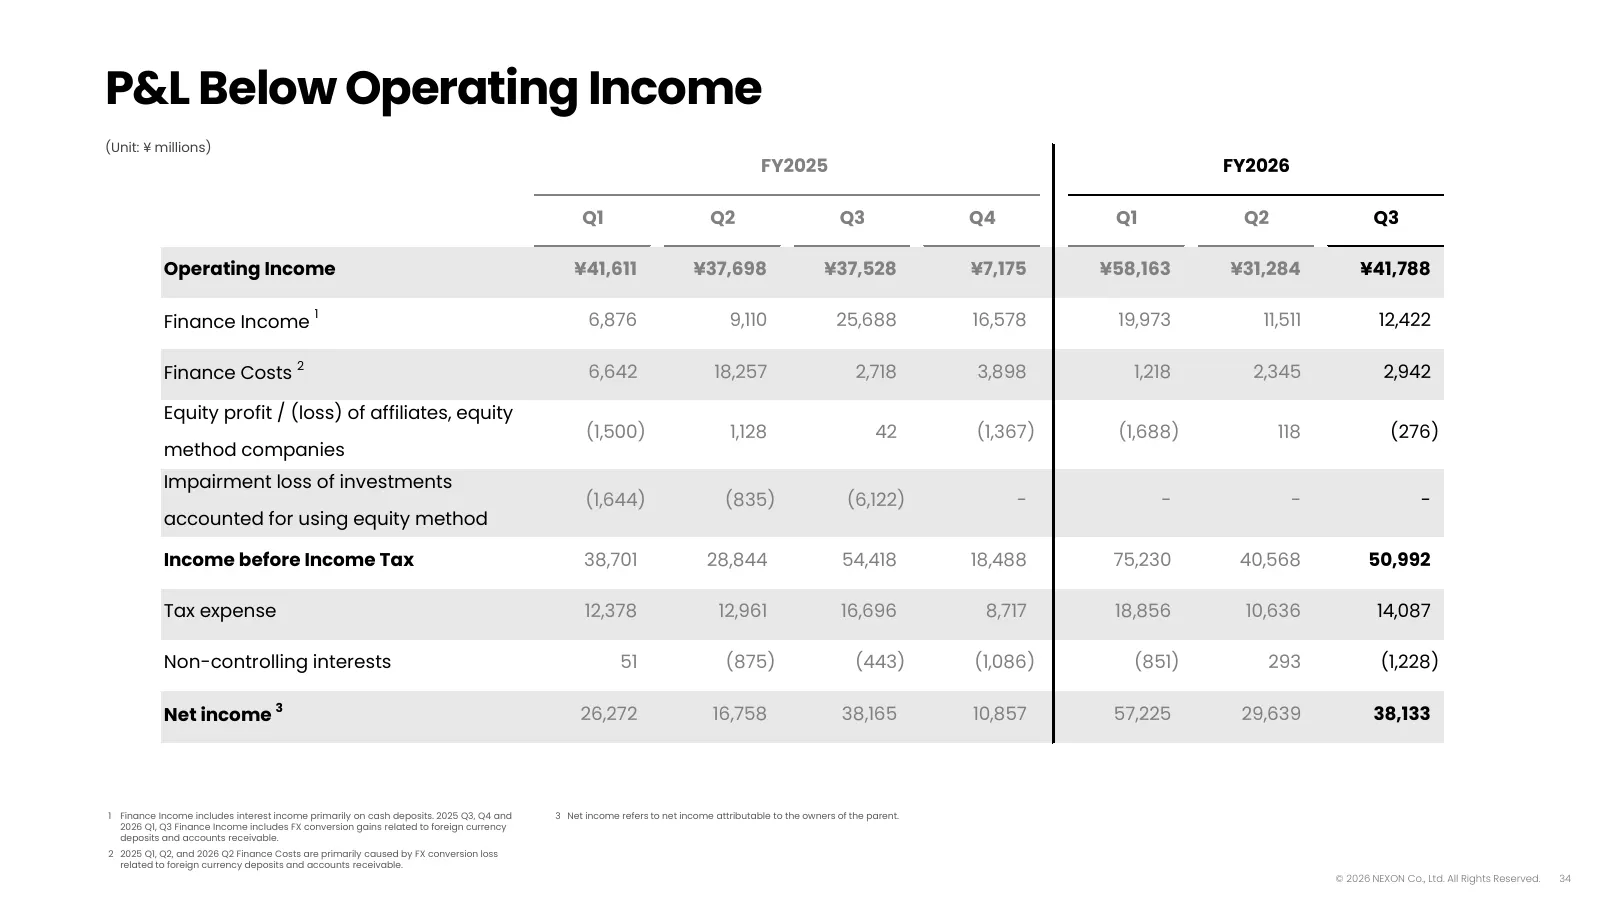
P&L Below Operating Income (Unit: ¥ millions) FY2025 FY2026 Q1 Q2 Q3 Q4 Q1 Q2 Q3 Operating Income ¥41,611 ¥37,698 ¥37,528 ¥7,175 ¥58,163 ¥31,284 ¥41,788 1 Finance Income 6,876 9,110 25,688 16,578 19,973 11,511 12,422 2 Finance Costs 6,642 18,257 2,718 3,898 1,218 2,345 2,942 Equity profit / (loss) o
Slide 35: Cash Flow Statement
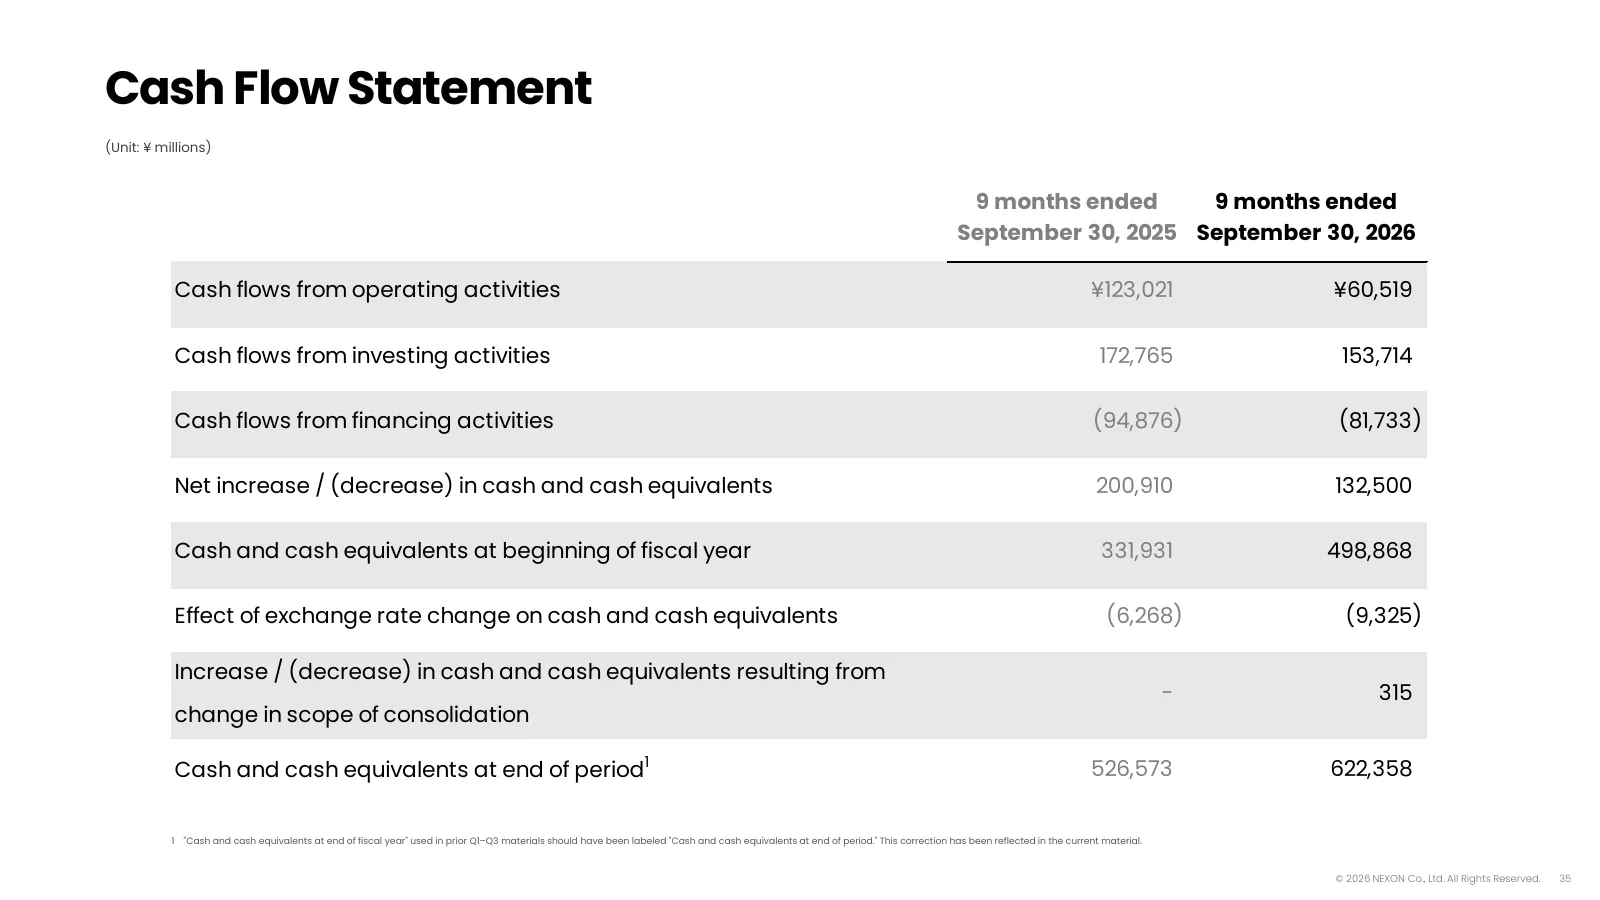
Cash Flow Statement (Unit: ¥ millions) 9 months ended 9 months ended September 30, 2025 September 30, 2026 Cash flows from operating activities ¥123,021 ¥60,519 Cash flows from investing activities 172,765 153,714 Cash flows from financing activities (94,876) (81,733) Net increase / (decrease) in ca
Slide 36: Balance Sheet
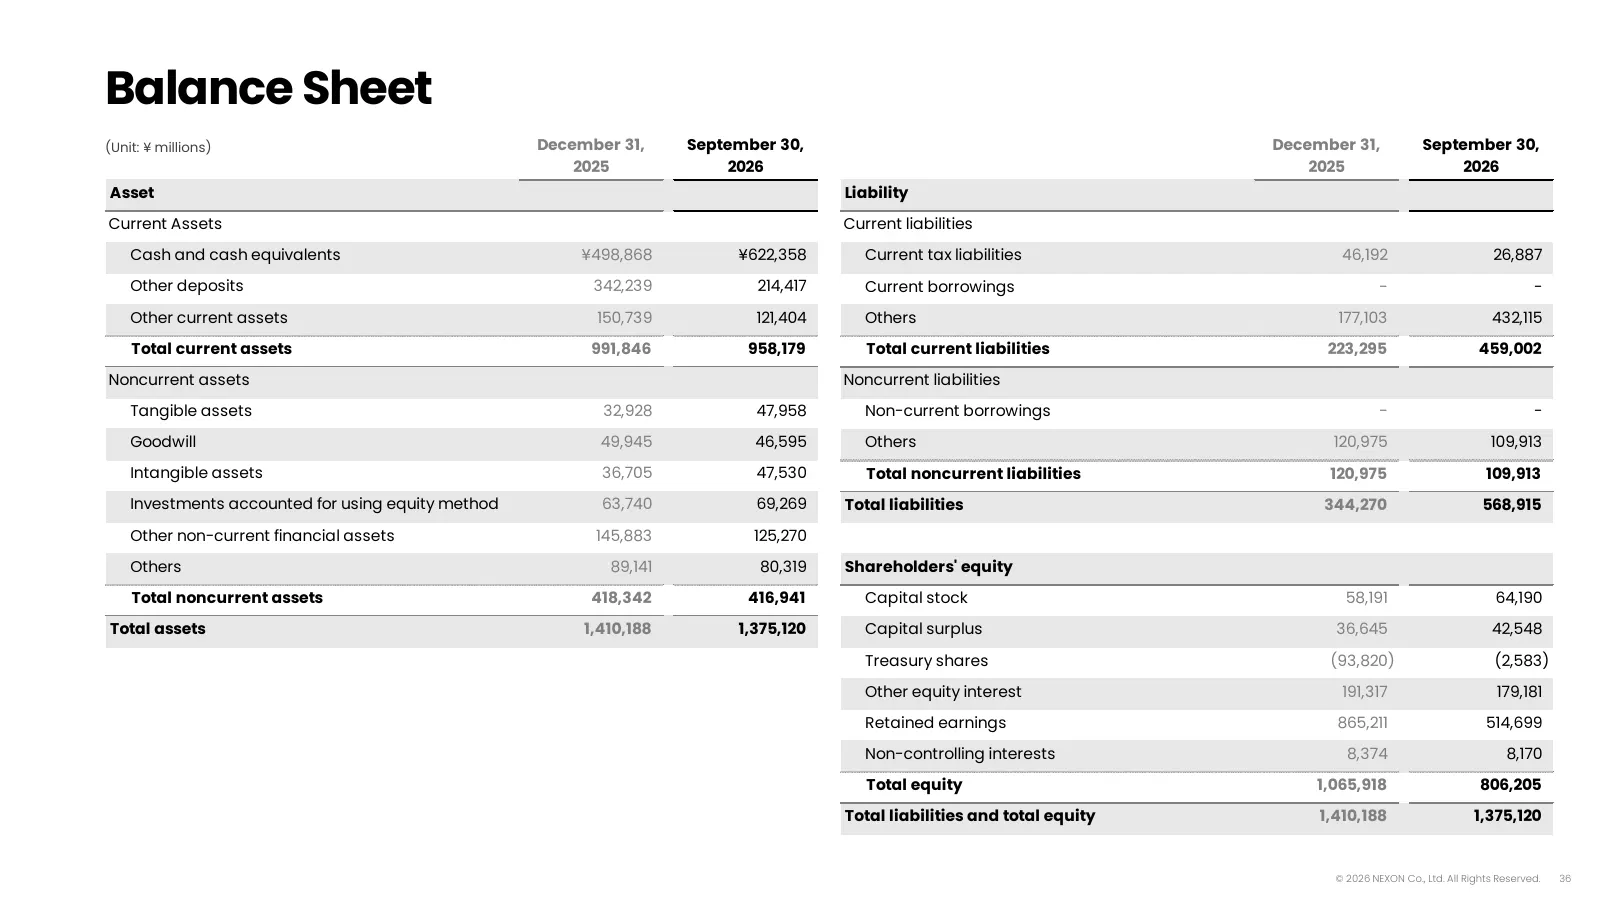
Balance Sheet (Unit: ¥ millions) December 31, September 30, December 31, September 30, 2025 2026 2025 2026 Asset Liability Current Assets Current liabilities Cash and cash equivalents ¥498,868 ¥622,358 Current tax liabilities 46,192 26,887 Other deposits 342,239 214,417 Current borrowings - - Other
Slide 37: Number of Employees by Reporting Segment
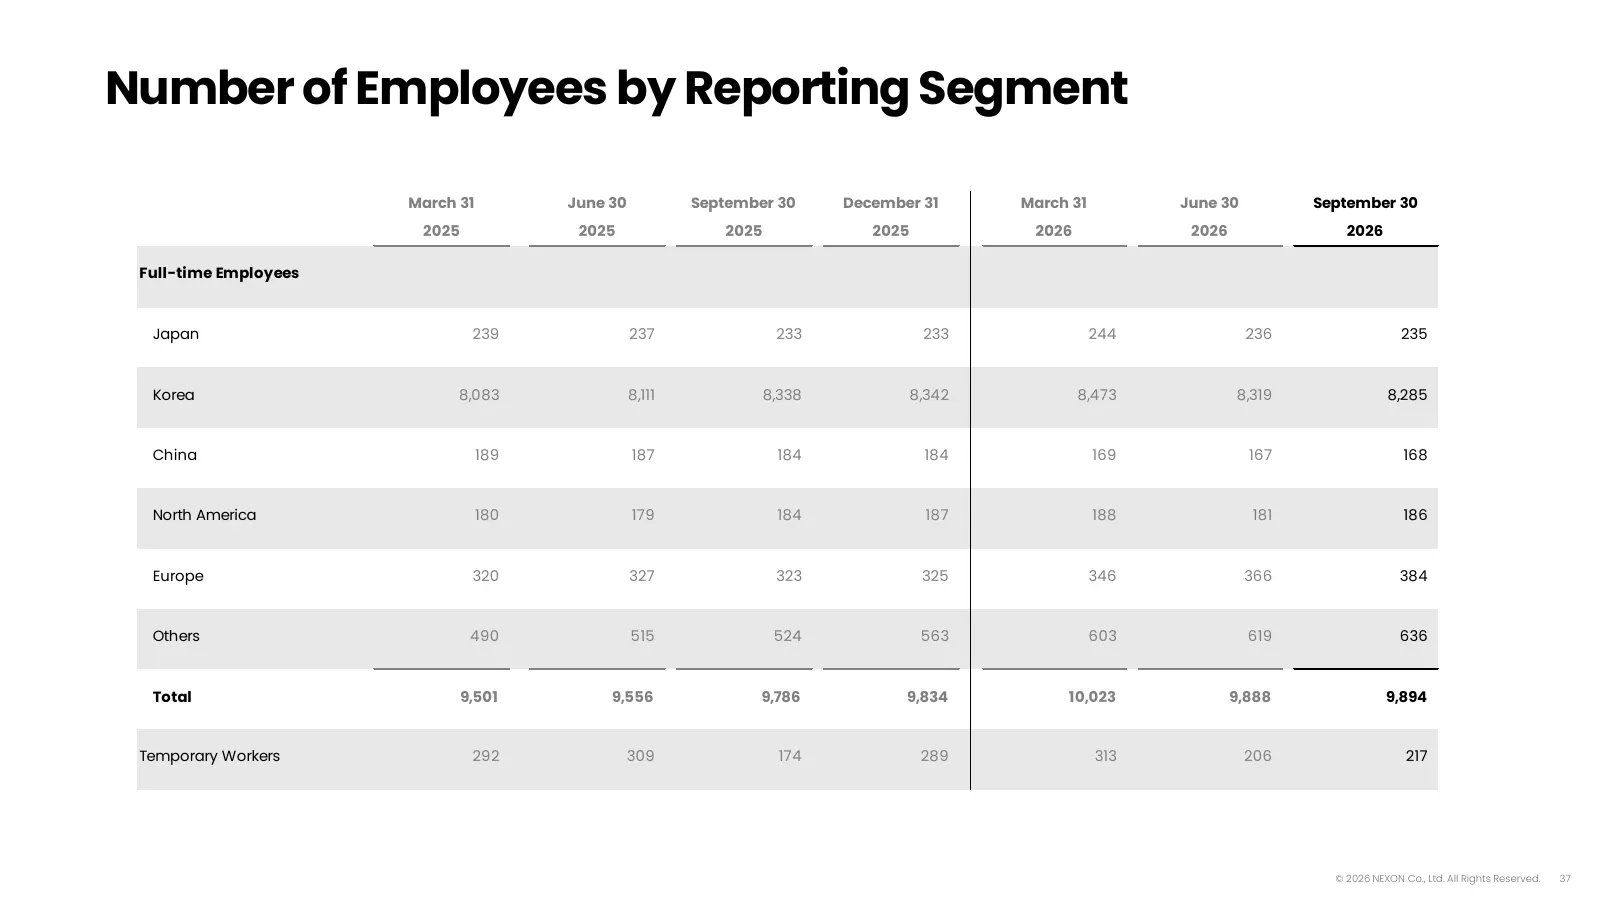
Number of Employees by Reporting Segment March 31 June 30 September 30 December 31 March 31 June 30 September 30 2025 2025 2025 2025 2026 2026 2026 Full-time Employees Japan 239 237 233 233 244 236 235 Korea 8,083 8,111 8,338 8,342 8,473 8,319 8,285 China 189 187 184 184 169 167 168 North America 18
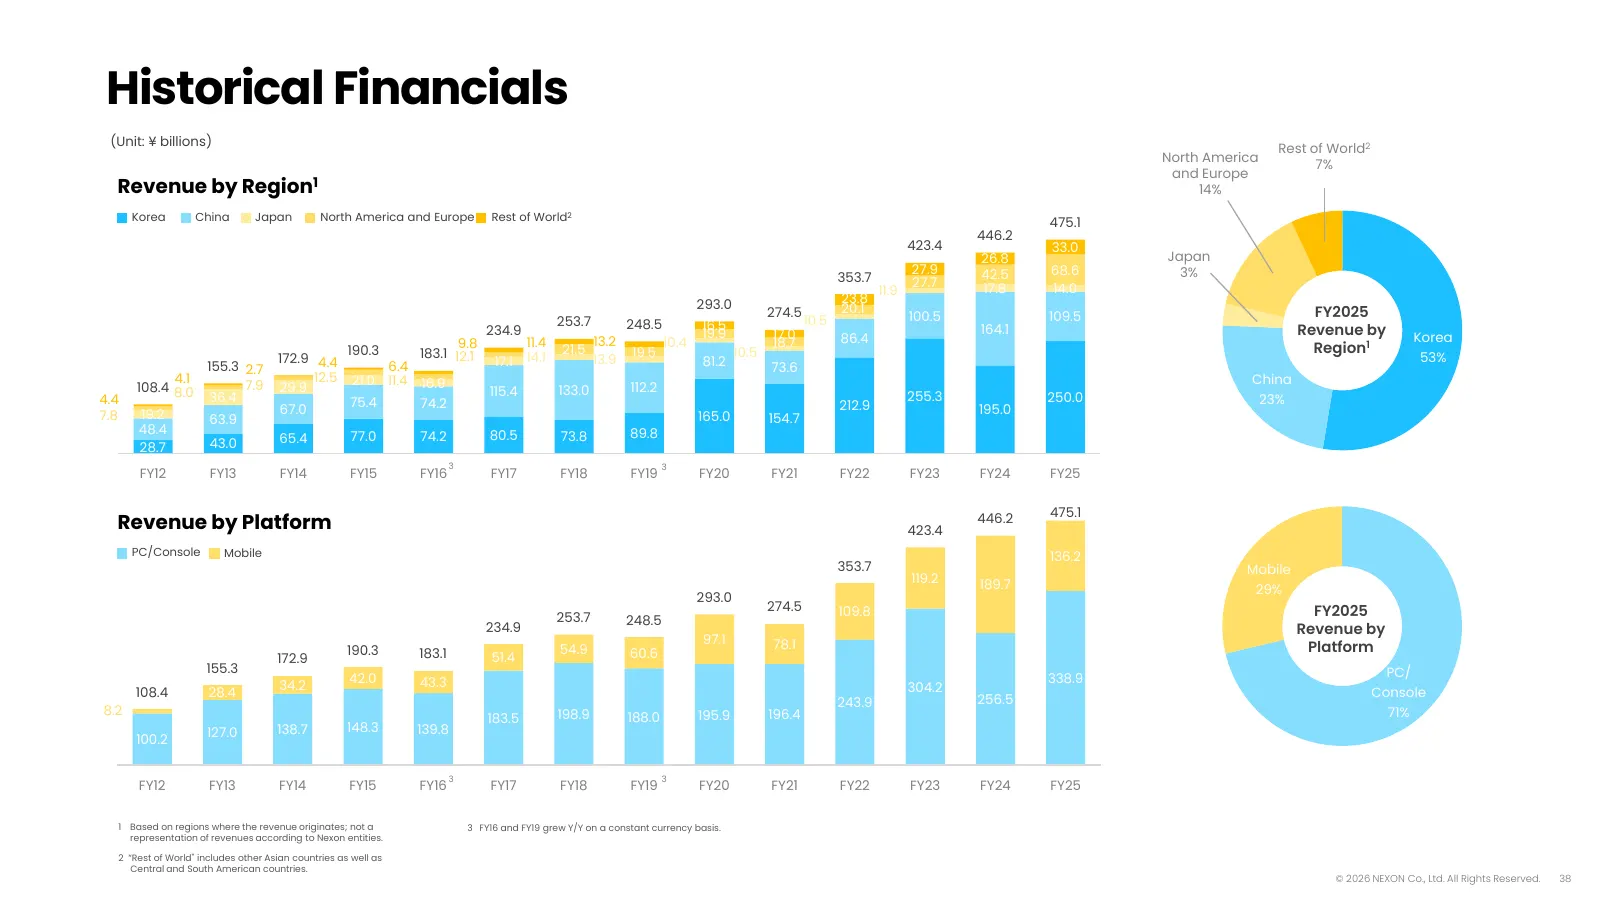
Slide 38: Historical Financials
Historical Financials (Unit: ¥ billions) Rest of World2 North America 7% and Europe Revenue by Region1 14% Korea China Japan North America and Europe Rest of World2 475.1 446.2 423.4 33.0 26.8 Japan 27.9 42.5 68.6 3% 353.7 27.7 11.9 17.8 14.0 293.0 23.8 274.5 20.1 FY2025 253.7 10.5 100.5 109.5 234.9
Slide 39: Disclaimer
Disclaimer This presentation is prepared to offer reference information about NEXON group to the investors and is intended to generally provide investors and analysts with financial and operational information about Nexon, but not to solicit or recommend any sale or purchase of stock or other securi
Slide 40: Q4 2026 Earnings Release Schedule
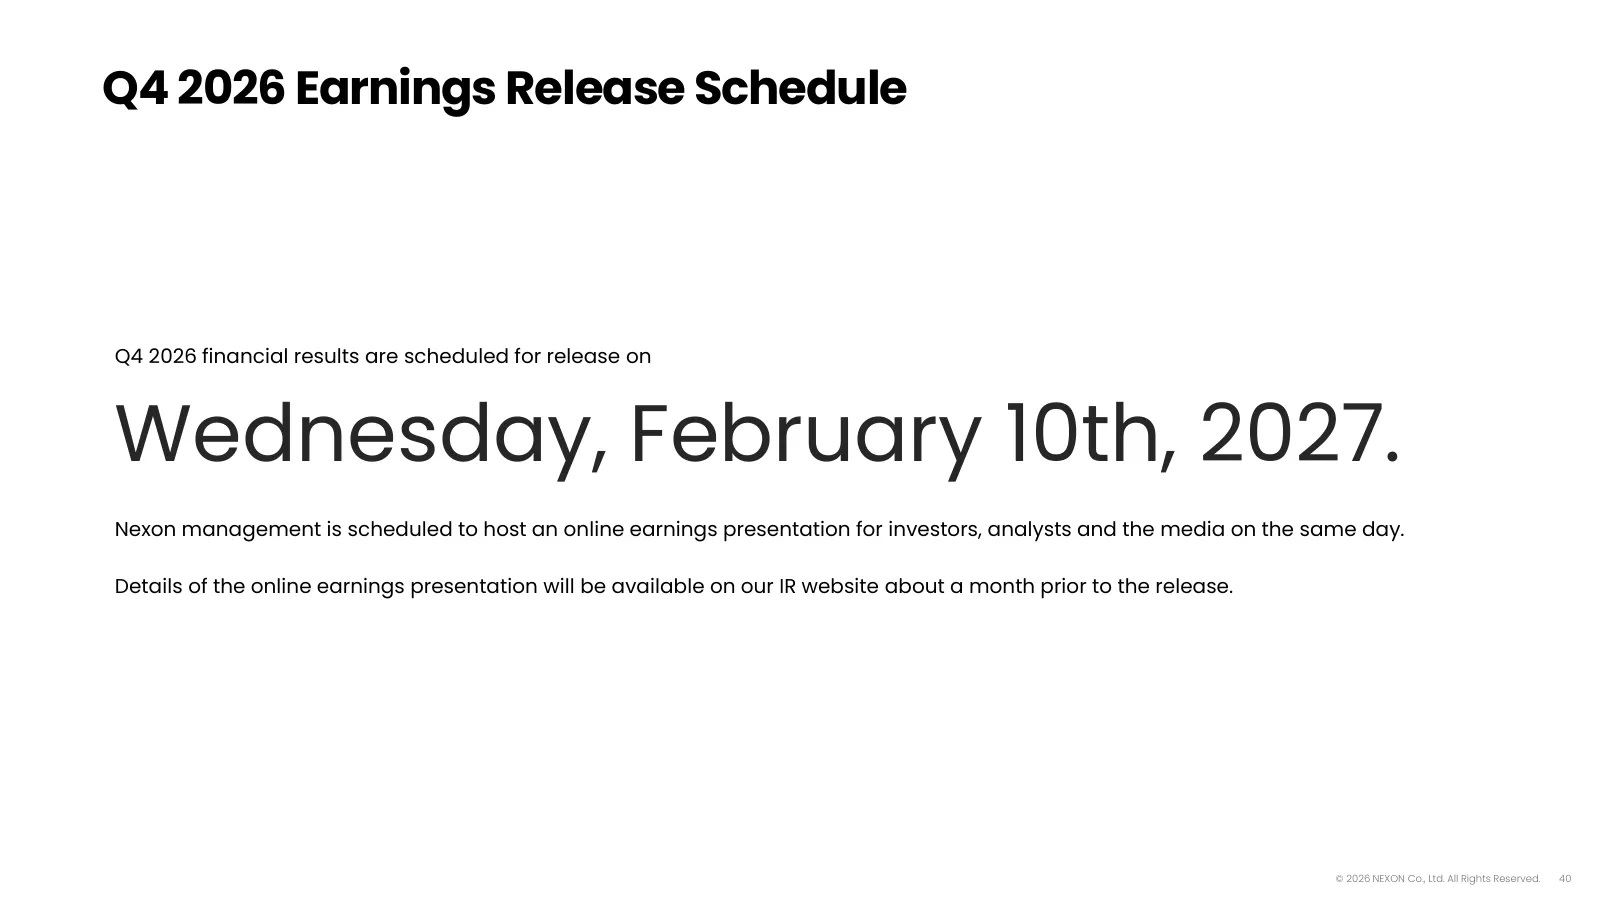
Q4 2026 Earnings Release Schedule Q4 2026 financial results are scheduled for release on Wednesday, February 10th, 2027. Nexon management is scheduled to host an online earnings presentation for investors, analysts and the media on the same day. Details of the online earnings presentation will be av

Slide 41
Source: 6ix earnings call