PowerSecure International — Investor Presentation (November 2009)
17 slides from PowerSecure International's investor presentation, Nov 12, 2009
Slide 1: Forward Looking Statements Safe Harbor
Forward Looking Statements Safe Harbor All forward-looking statements made in this presentation are made under the safe harbor provisions of the Private Securities Litigation Reform Act of 1995. Forward-looking statements, which are all statements other than statements of historical facts and includ
Slide 2: Our Business and the Customers We Serve
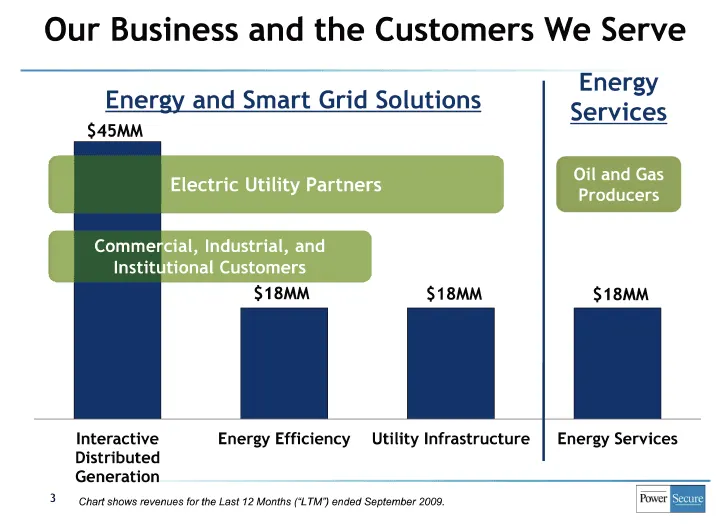
Our Business and the Customers We Serve Solutions Grid Smart and Energy $45MM Electric Utility Partners Commercial, Industrial, and Institutional Customers $18MM $18MM Energy Services Oil and Gas Producers $18MM Interactive Distributed Generation Energy Efficiency Utility Infrastructure Energy Servi
Slide 3: Our Track Record of Profitable Growth and Strong Execution
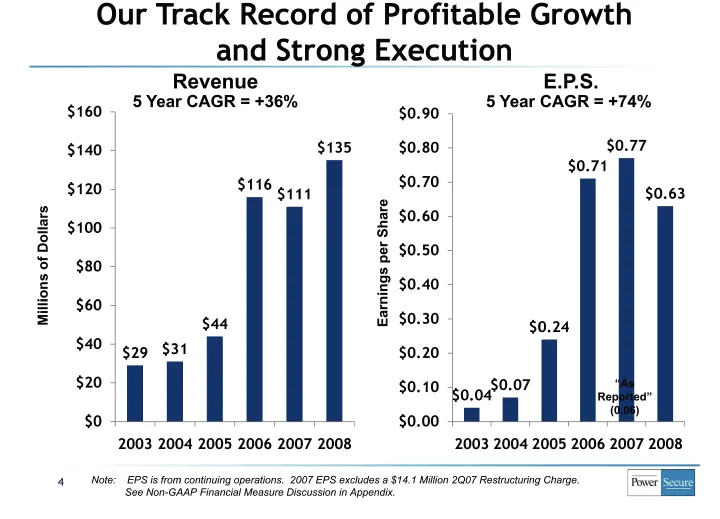
Our Track Record of Profitable Growth and Strong Execution Revenue 5 Year CAGR = +36% Dollars of Millions $160 $140 $120 $100 $80 $60 $40 $20 $0 $29 $31 $44 $116 $111 $135 2003 2004 2005 2006 2007 2008 per ShareEarnings $0.90 $0.80 $0.70 $0.60 $0.50 $0.40 $0.30 $0.20 $0.10 $0.00 E.P.S. 5 Year CAGR =
Slide 4: Interactive Distributed Generation: Smart Grid Efficiencies + Standby Power = ROI
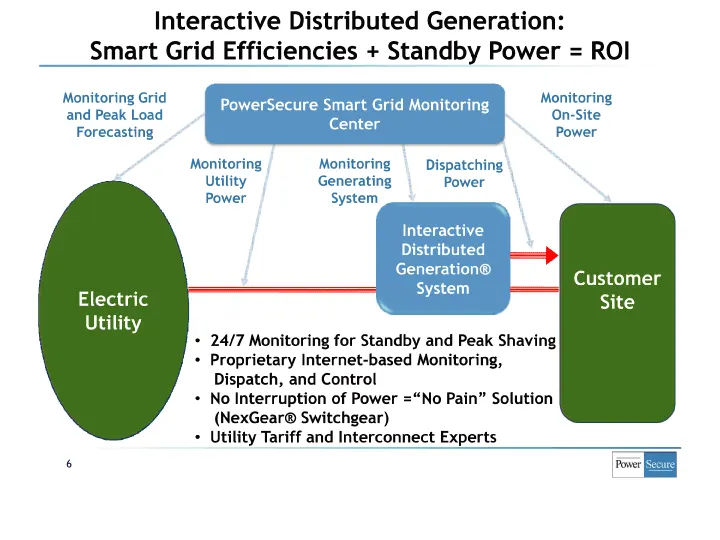
Interactive Distributed Generation: Smart Grid Efficiencies + Standby Power = ROI Monitoring Grid and Peak Load Forecasting PowerSecure Smart Grid Monitoring Center Monitoring Utility Power Monitoring Generating System Dispatching Power Monitoring On-Site Power Interactive Distributed Generation ® S
Slide 5: Our Systems Ran 4,000 Times in 1H09 to Deliver Peak Shaving Benefits
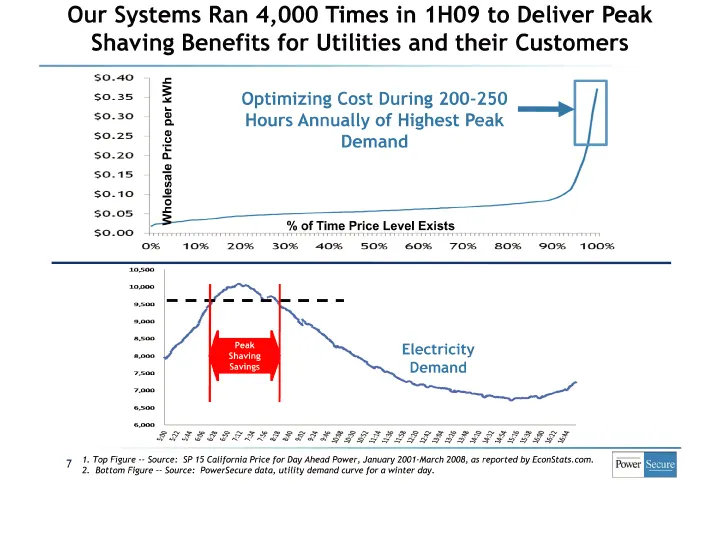
Our Systems Ran 4,000 Times in 1H09 to Deliver Peak Shaving Benefits for Utilities and their Customers [Graphic Appears Here] Price per kWhWholesale Optimizing Cost During 200-250 Hours Annually of Highest Peak Demand % of Time Price Level Exists Peak Shaving Savings Electricity Demand SP 15 Califor
Slide 6: Distributed Power Systems are Limited; Lack of Backup Power Costs the U.S. $80 Billion
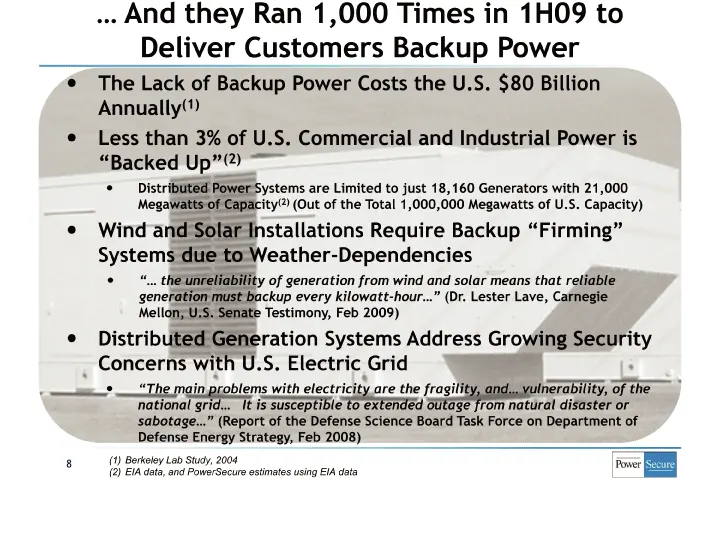
(Out of the Total 1,000,000 Megawatts of U.S. Capacity) (Dr. Lester Lave, Carnegie (2) It is susceptible to extended outage from natural disaster or (2) (Report of the Defense Science Board Task Force on Department of Deliver Customers Backup Power (1) Distributed Power Systems are Limited to just 1
Slide 7: An Extension of our Core Competencies and Utility Relationships
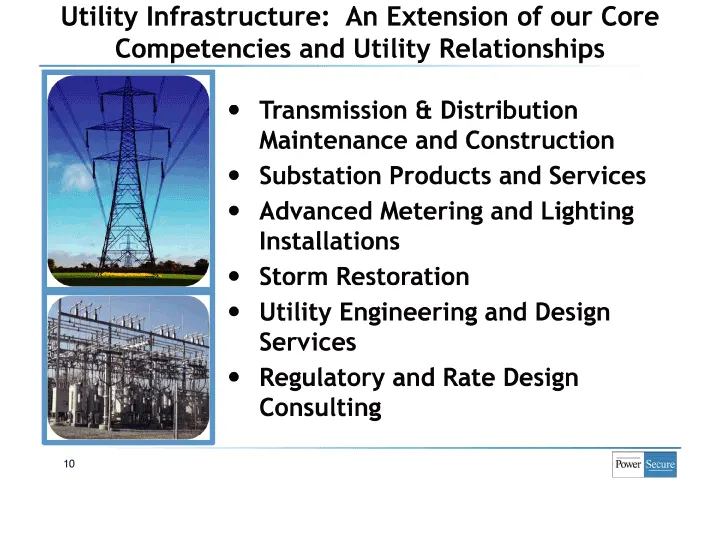
An Extension of our Core Competencies and Utility Relationships Utility Infrastructure: Transmission & Distribution Maintenance and Construction Substation Products and Services Advanced Metering and Lighting Installations Storm Restoration Utility Engineering and Design Services Regulatory and Rate
Slide 8: Utility Infrastructure: Business Progression and Growth
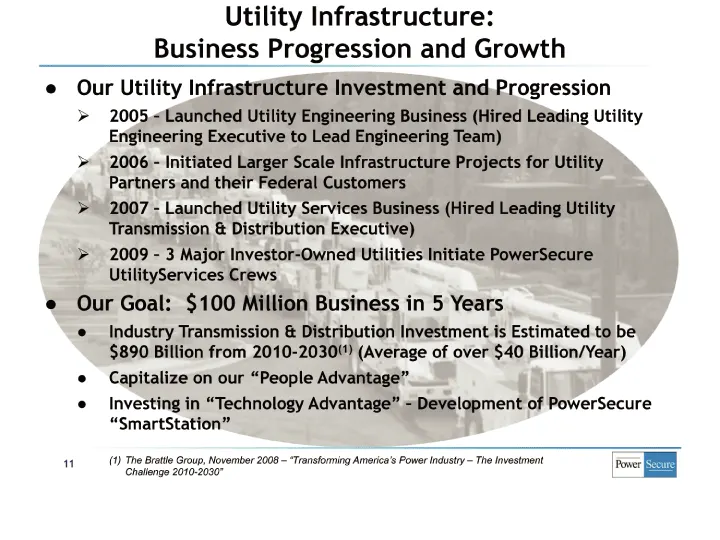
Utility Infrastructure: Business Progression and Growth Our Utility Infrastructure Investment and Progression Launched Utility Engineering Business (Hired Leading Utility Initiated Larger Scale Infrastructure Projects for Utility Launched Utility Services Business (Hired Leading Utility 3 Major Inve
Slide 9: Energy Efficiency: EfficientLights Extends our National Account Relationships
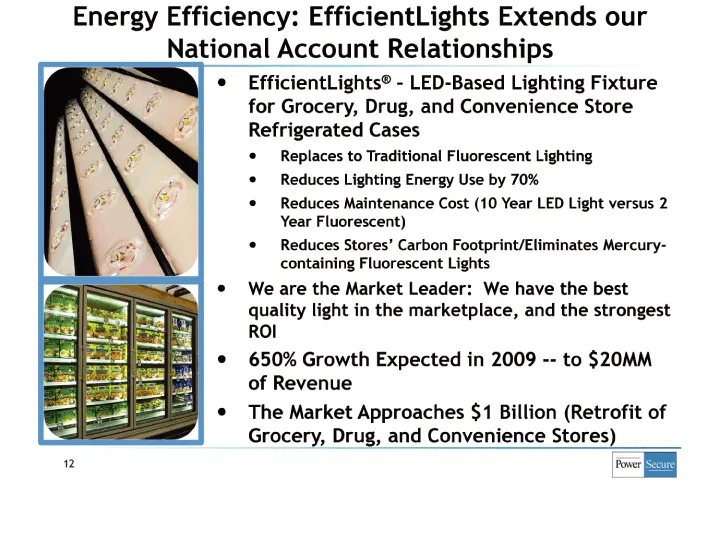
Energy Efficiency: EfficientLights Extends our National Account Relationships LED-Based Lighting Fixture – EfficientLights for Grocery, Drug, and Convenience Store Refrigerated Cases ® Replaces to Traditional Fluorescent Lighting Reduces Lighting Energy Use by 70% Reduces Maintenance Cost (10 Year L
Slide 10: EfficientLights: Business Progression and Growth
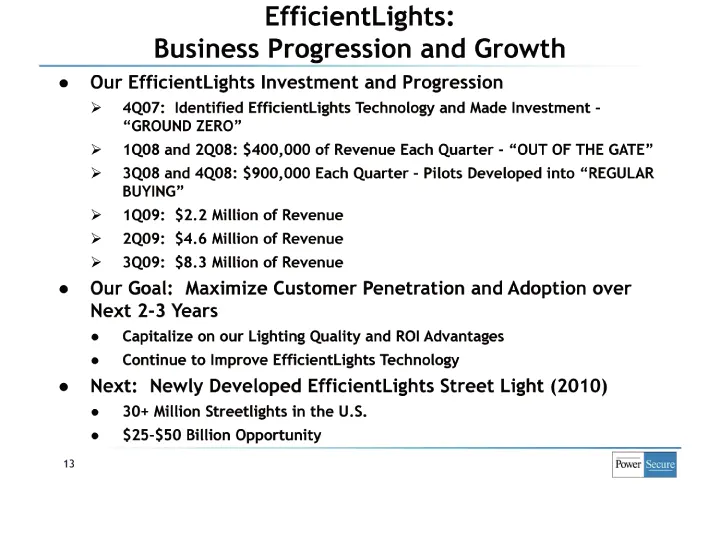
EfficientLights: Business Progression and Growth Our EfficientLights Investment and Progression “OUT OF THE GATE” Pilots Developed into “REGULAR Identified EfficientLights Technology and Made Investment – “GROUND ZERO” $2.2 Million of Revenue $4.6 Million of Revenue $8.3 Million of Revenue 4Q07: 1Q0
Slide 11: Our Growth and Diversification Strategies are Succeeding
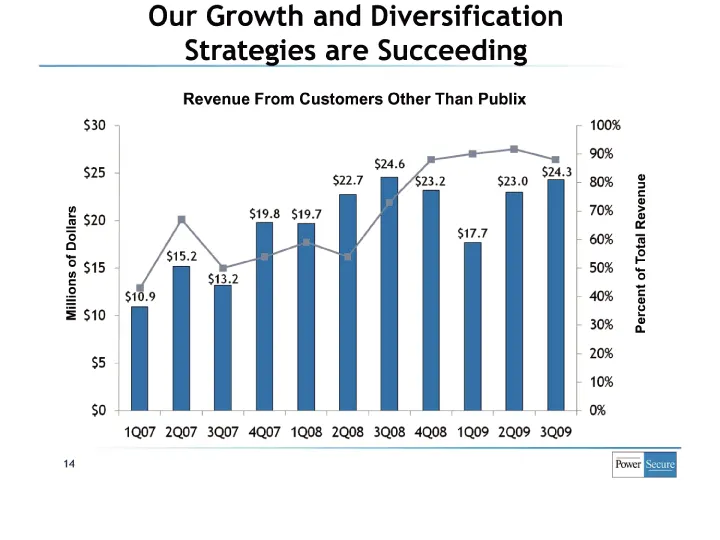
Our Growth and Diversification Strategies are Succeeding Revenue From Customers Other Than Publix Dollars of Millions Revenue of Total Percent 14
Slide 12: Our Energy Solutions Deliver Value to a Growing List of Utility Partners and Customers
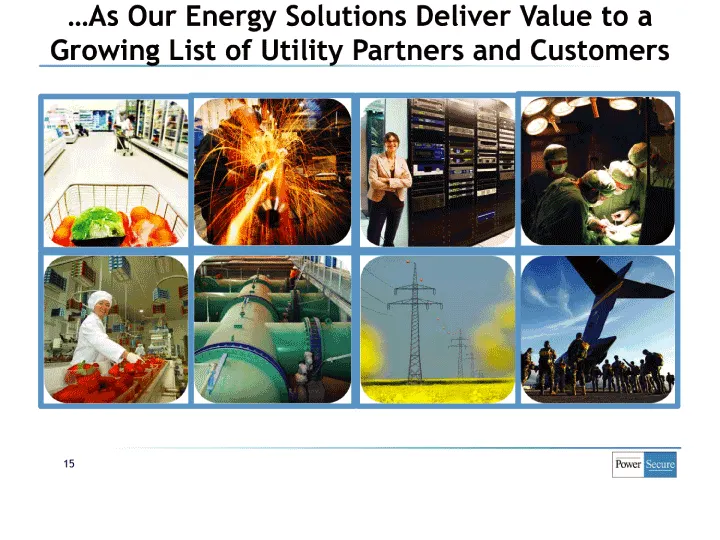
...As Our Energy Solutions Deliver Value to a Growing List of Utility Partners and Customers 15
Slide 13: Questions?
POWR (919) 556 3056 Questions? NSADAQ: www.PowerSecure.com 16
Slide 14: Appendix (Non-GAAP Measures)
Appendix (Non-GAAP Measures) 17
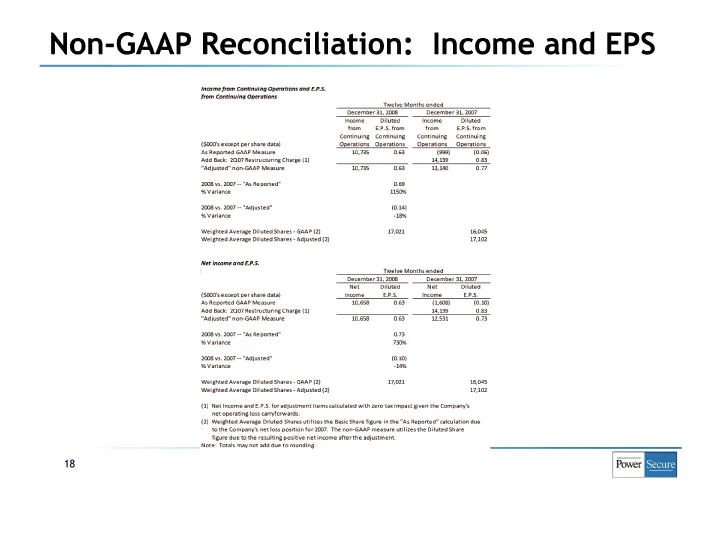
Slide 15: Non-GAAP Reconciliation: Income and EPS
Non-GAAP Reconciliation: Income and EPS Income from Continuing Operations and E.P.S. from Continuing Operations Twelve Months ended December 31, 2003 December 31, 2007 ($000's except per share data) Income Diluted from E_P.5_ from Continuing Continuing Operations Operations Income fr orn Continuing
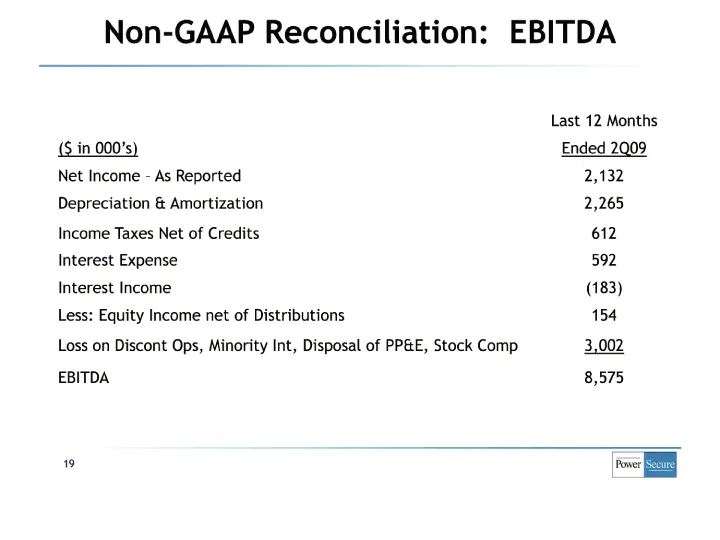
Slide 16: EBITDA Non-GAAP Reconciliation
EBITDA Non-GAAP Reconciliation: Last 12 Months Ended 2Q09 2,132 2,265 612 592 (183) 154 3,002 8,575 As Reported & Amortization Ops, Minority Int, Disposal of PP&E, Stock Comp Expense in 000’s) $ Net Income – Depreciation Income Taxes Net of Credits Interest Interest Income Less: Equity Income net of
Slide 17: Non-GAAP Measures Notes
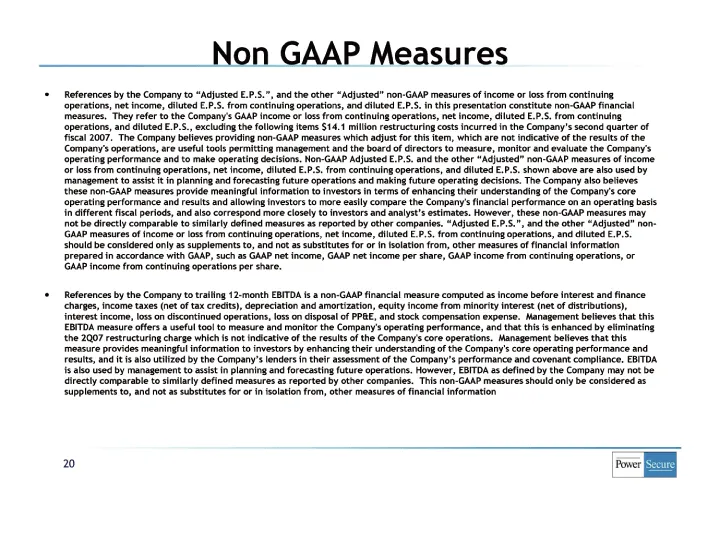
or that this quarter of also used by this may not be The Company also believes Management believes Management believes that This non-GAAP measures should only be considered as Non GAAP Measures References by the Company to “Adjusted E.P.S.”, and the other “Adjusted” non-GAAP measures of income or lo
Source: SEC EDGAR · 8-K filed Nov 12, 2009
More decks from PowerSecure International Inc
 Investor Presentation (January 2016)19 slides · Jan 13, 2016
 Q3 2015 Earnings Presentation19 slides · Nov 9, 2015
 Investor Presentation (September 2015)19 slides · Sep 2, 2015
 Investor Presentation (August 2015)16 slides · Aug 10, 2015
 Investor Presentation (May 2015)21 slides · May 26, 2015
 Investor Presentation (May 2015)18 slides · May 6, 2015