Dynegy — 2006 Credit Suisse First Boston Energy Summit
36 slides from Dynegy's conference presentation, Jan 31, 2006
Slide 1: 2006 Credit Suisse First Boston Energy Summit
Exhibit 99.1 2006 Credit Suisse First Boston Energy Summit January 31, 2006 Vail, Colorado Investor & Public Relations: John Sousa,Vice President Hillarie Bloxom, Senior Analyst (713) 507-6466 ir@dynegy.com
Slide 2: Forward-Looking Statements
FORWARD-LOOKING FORWARD-LOOKING STATEMENTS STATEMENTS This presentation contains statements reflecting assumptions, expectations, projections, intentions or beliefs about future events that are intended as “forward-looking statements.” You can identify these statements, including those relating to D

Slide 3: Business Update
DYNEGY Business Update
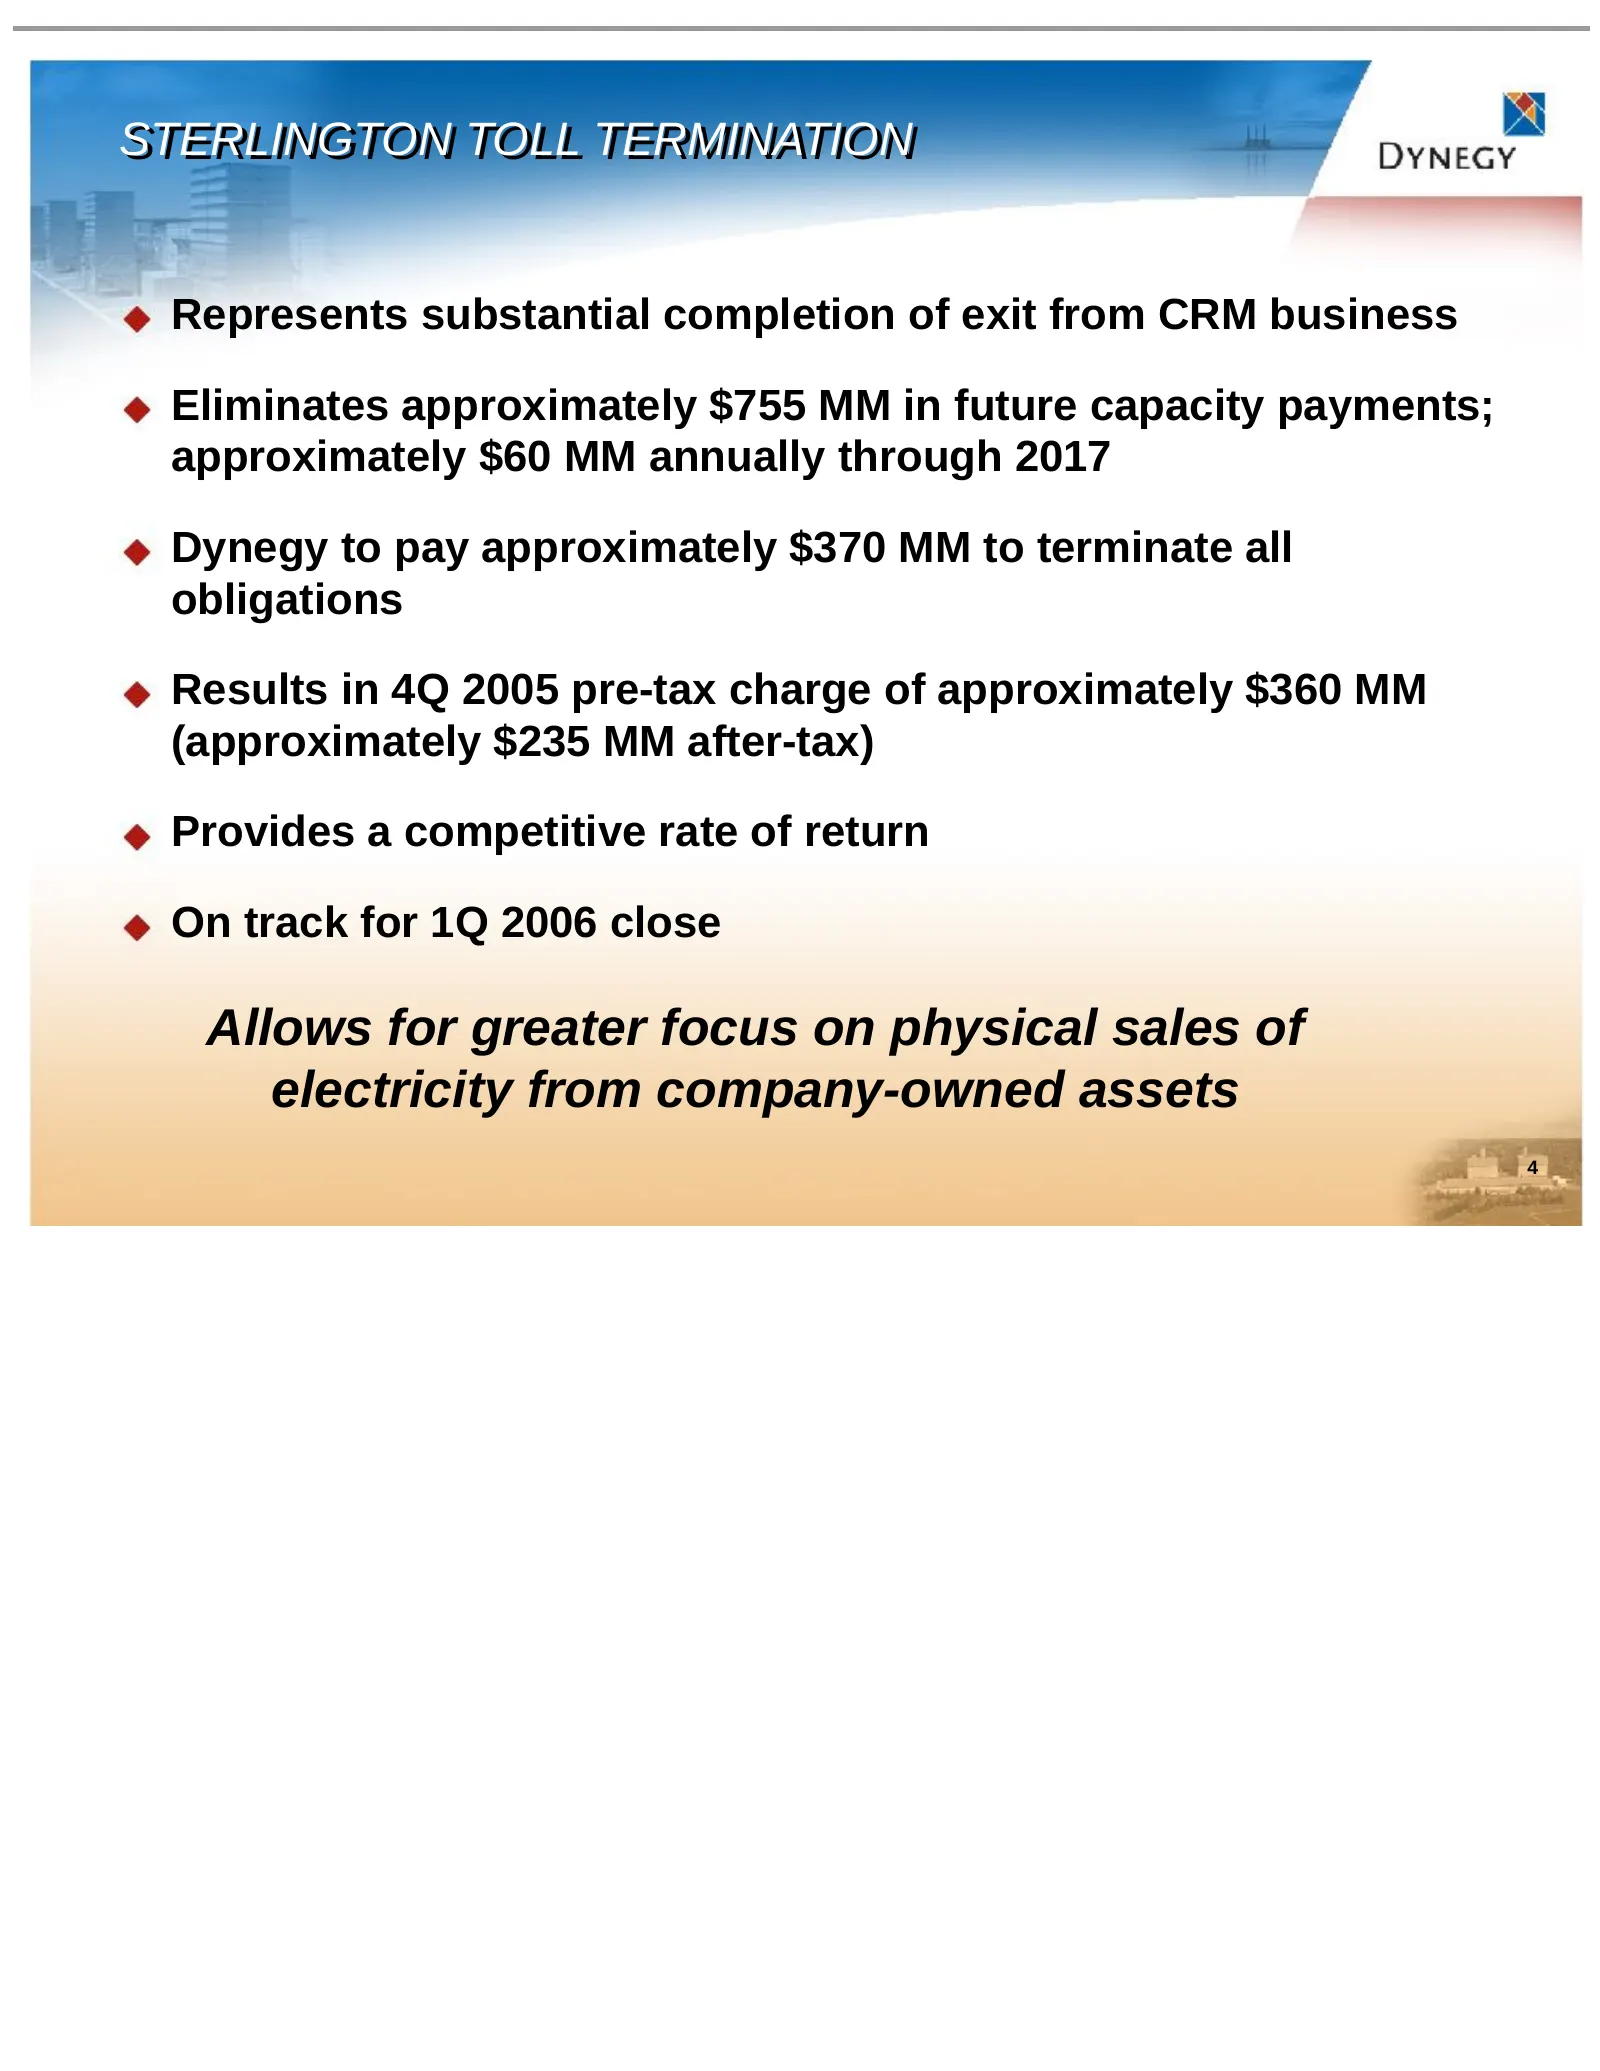
Slide 4: Sterlington Toll Termination
STERLINGTON STERLINGTON TOLL TOLL TERMINATION TERMINATION Represents substantial completion of exit from CRM business Eliminates approximately $755 MM in future capacity payments; approximately $60 MM annually through 2017 Dynegy to pay approximately $370 MM to terminate all obligations Results in 4
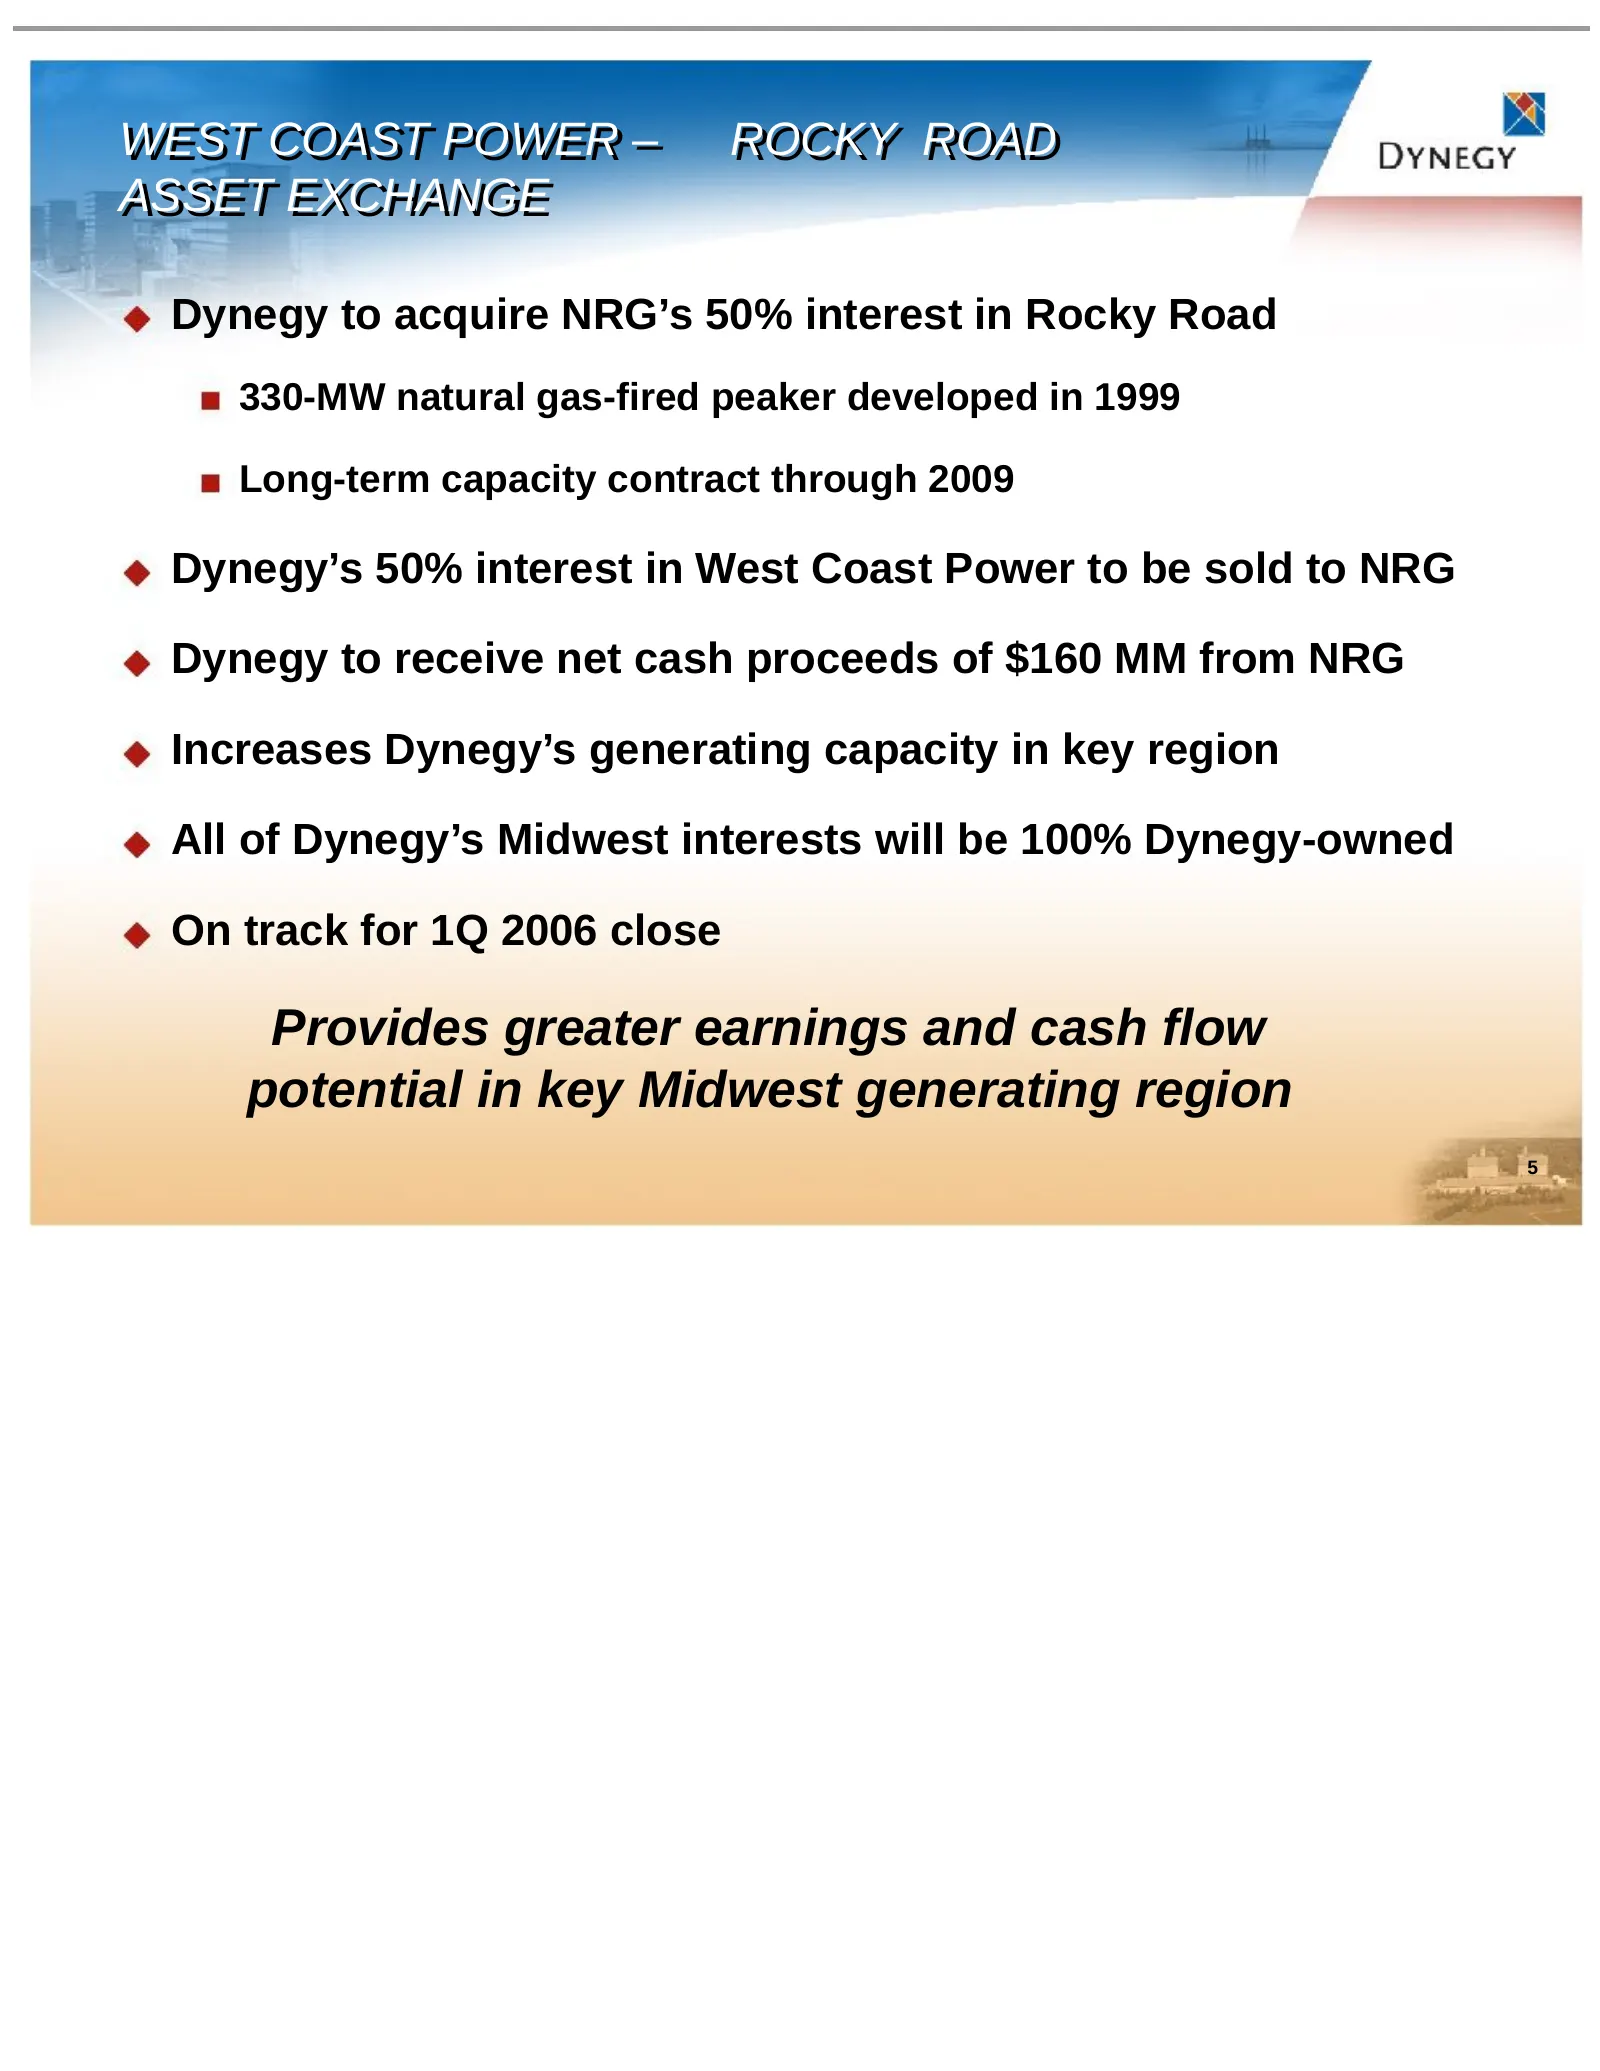
Slide 5: West Coast Power – Rocky Road Asset Exchange
WEST WEST COAST COAST POWER POWER –– ROCKY ROCKY ROAD ROAD ASSET ASSET EXCHANGE EXCHANGE Dynegy to acquire NRG’s 50% interest in Rocky Road 330-MW natural gas-fired peaker developed in 1999 Long-term capacity contract through 2009 Dynegy’s 50% interest in West Coast Power to be sold to NRG Dynegy to
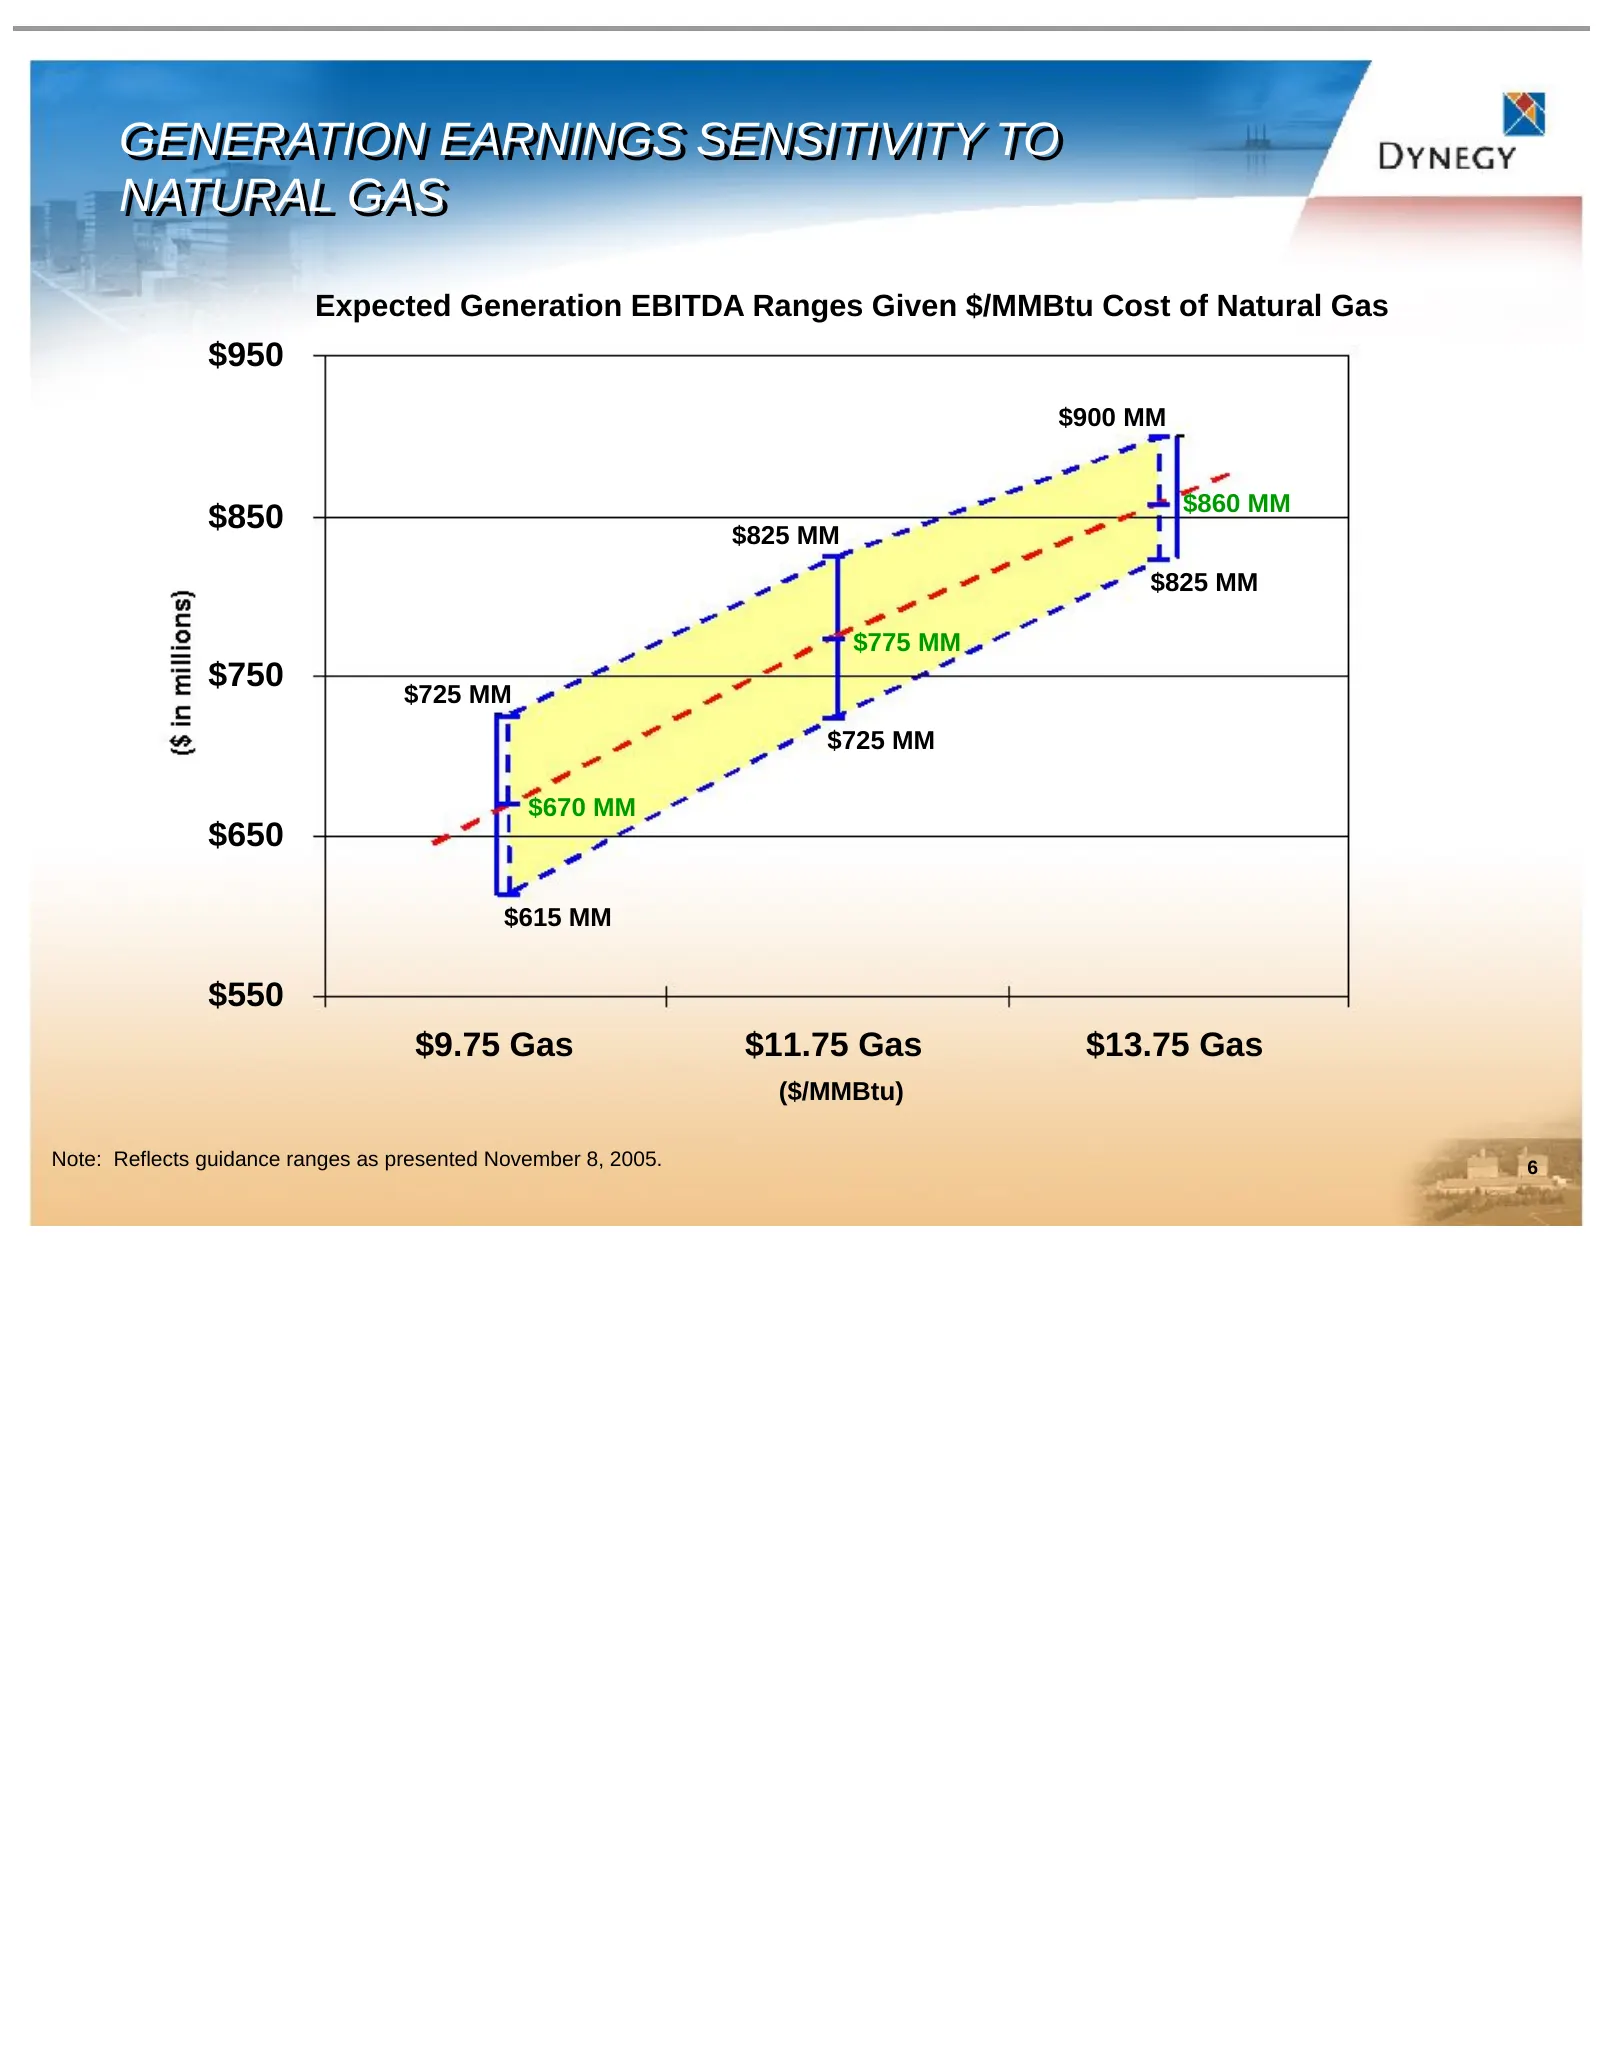
Slide 6: Generation Earnings Sensitivity to Natural Gas
GENERATION GENERATION EARNINGS EARNINGS SENSITIVITY SENSITIVITY TO TO NATURAL NATURAL GAS GAS Expected Generation EBITDA Ranges Given $/MMBtu Cost of Natural Gas $950 $900 MM $860 MM $850 $825 MM $825 MM $775 MM $750 $725 MM $725 MM $670 MM $650 $615 MM $550 $9.75 Gas $11.75 Gas $13.75 Gas ($/MMBtu)
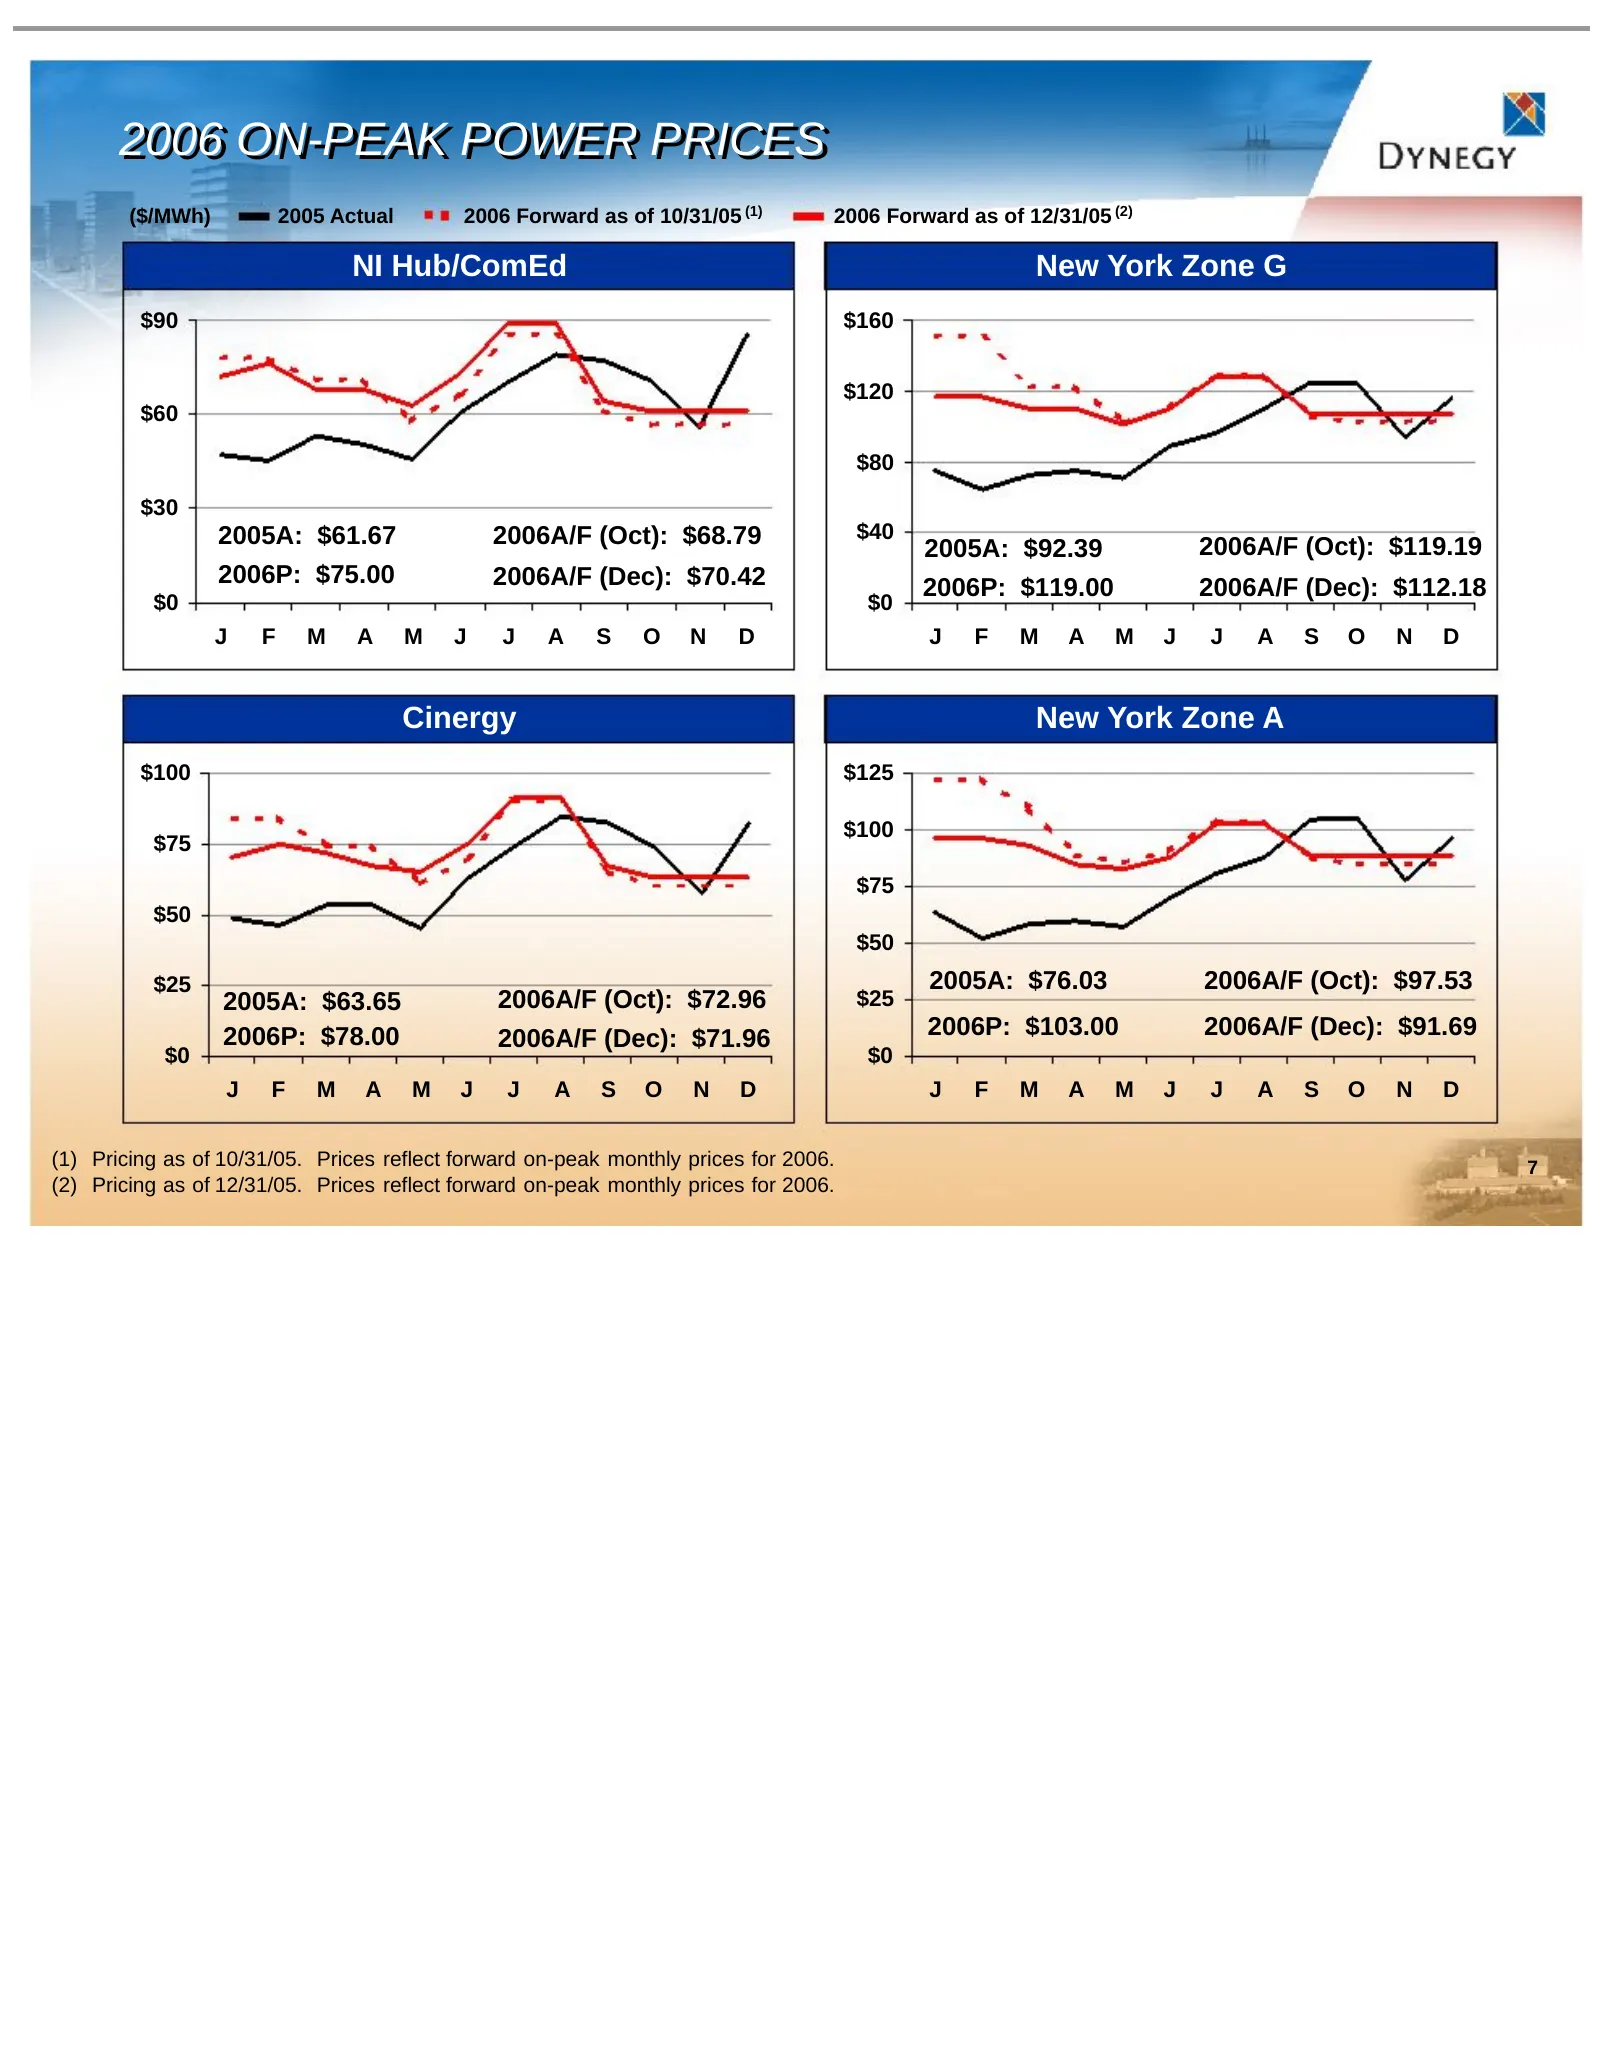
Slide 7: 2006 On-Peak Power Prices
2006 2006 ON-PEAK ON-PEAK POWER POWER PRICES PRICES ($/MWh) 2005 Actual 2006 Forward as of 10/31/05 (1) 2006 Forward as of 12/31/05 (2) NI Hub/ComEd New York Zone G $90 $160 $120 $60 $80 $30 2005A: $61.67 2006A/F (Oct): $68.79 $40 2005A: $92.39 2006A/F (Oct): $119.19 2006P: $75.00 2006A/F (Dec): $70
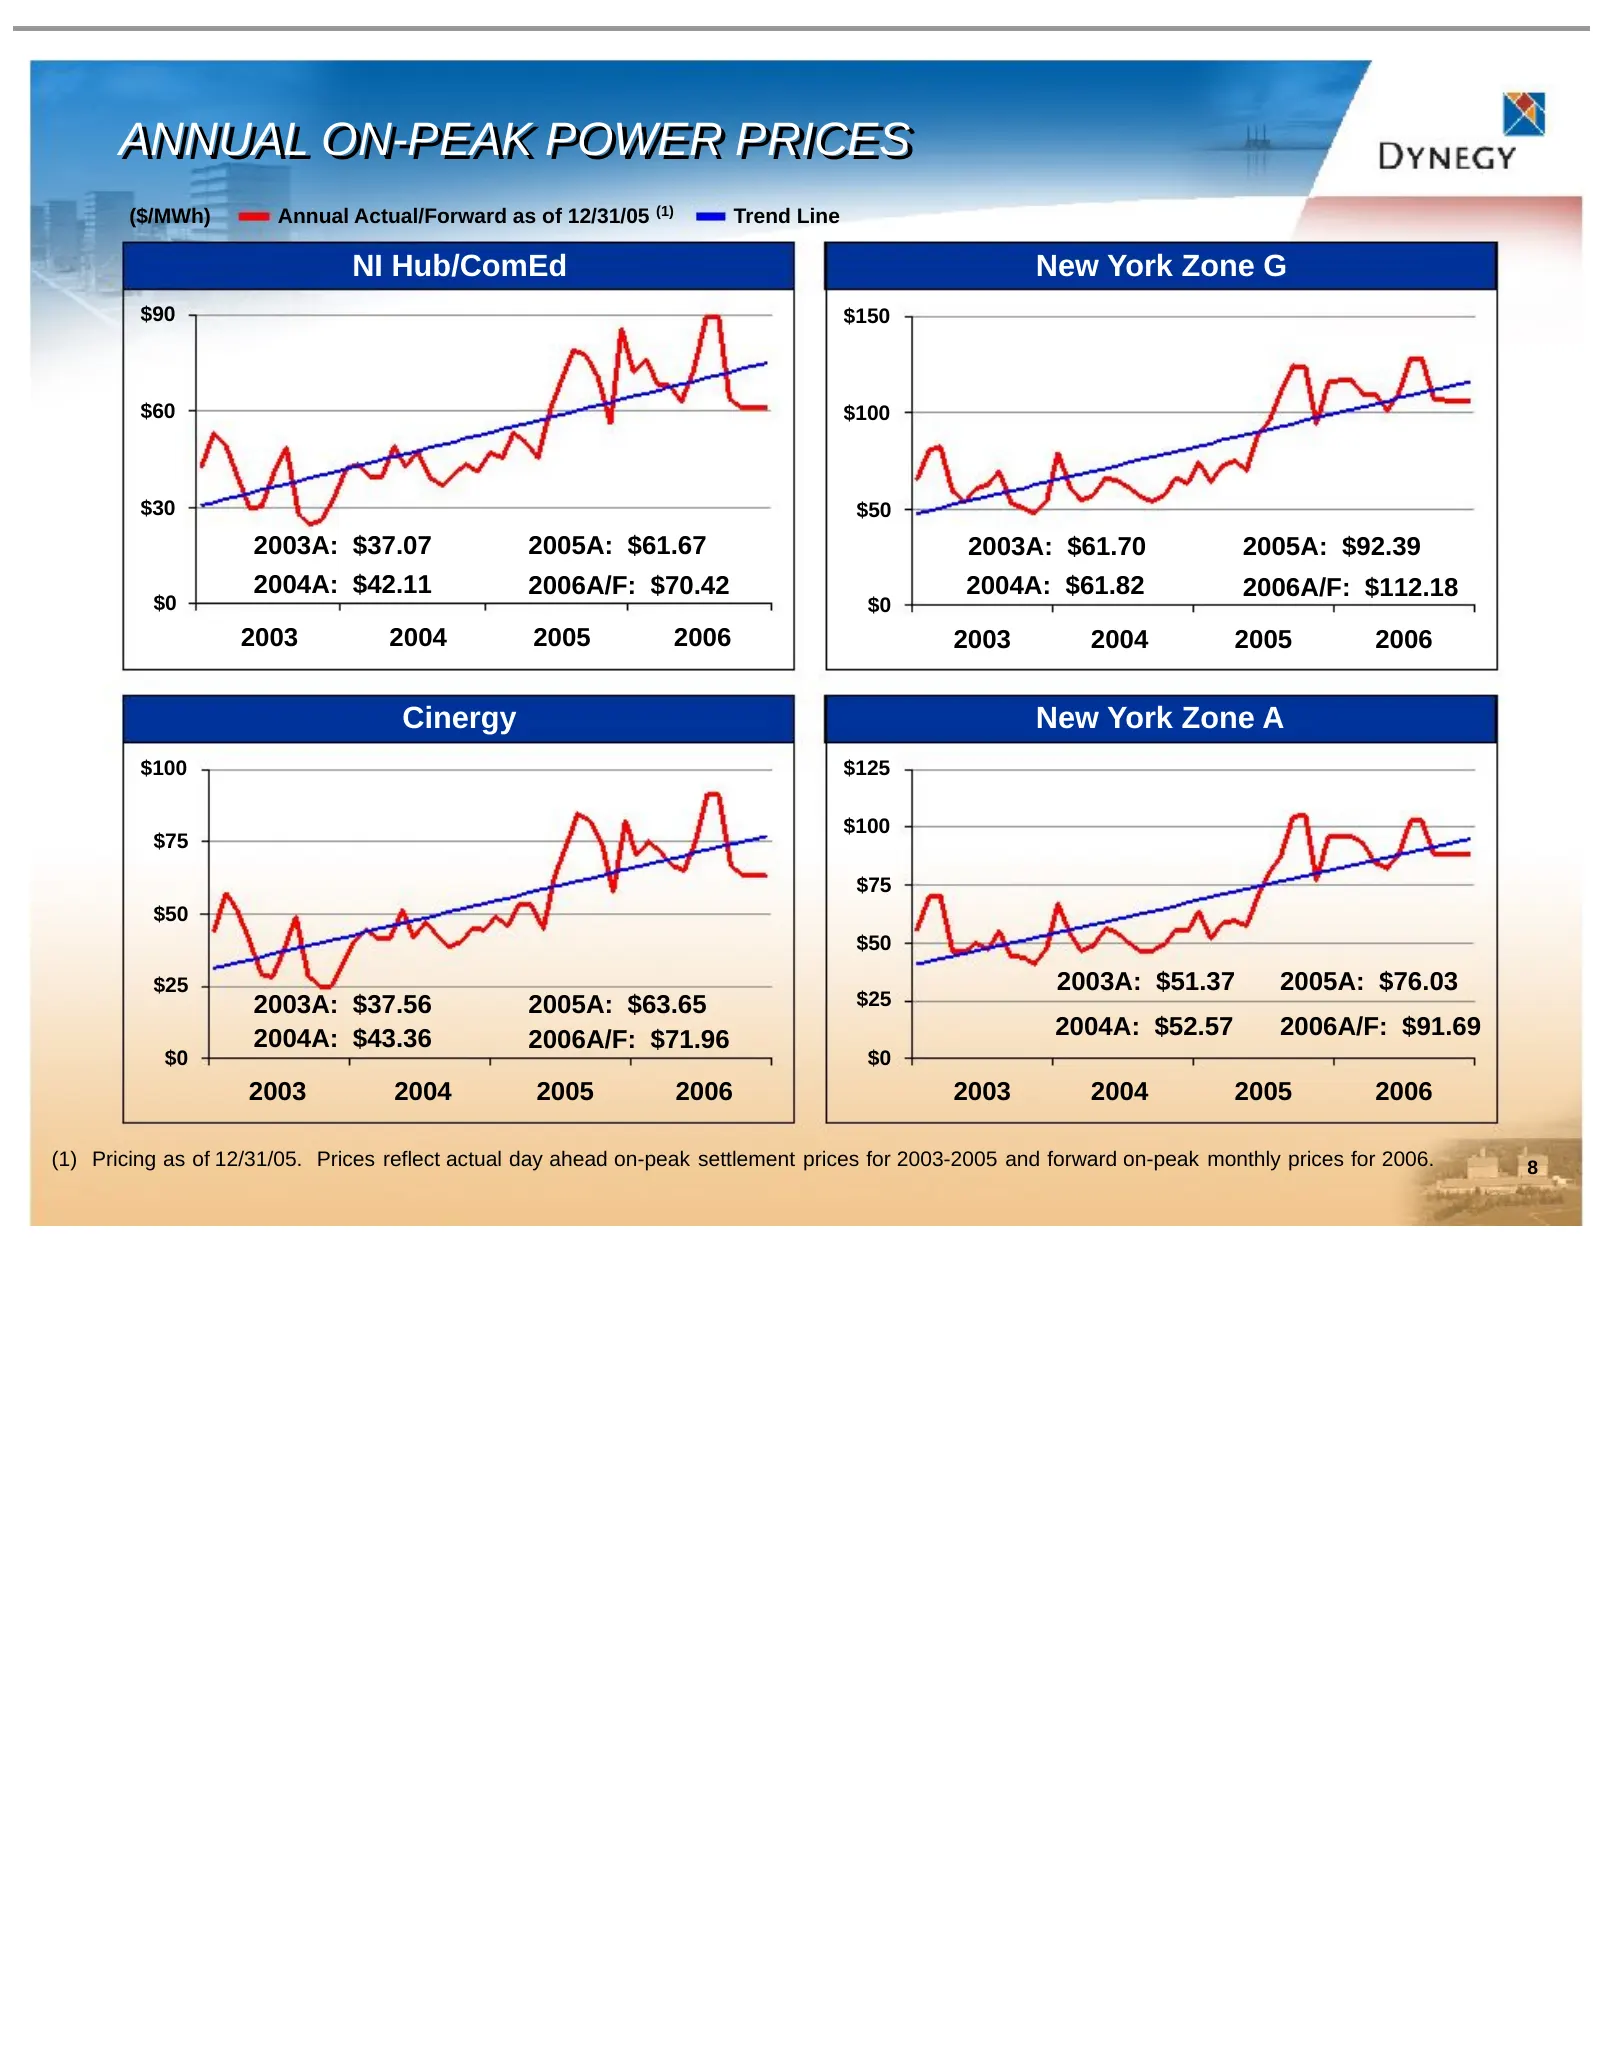
Slide 8: Annual On-Peak Power Prices
ANNUAL ANNUAL ON-PEAK ON-PEAK POWER POWER PRICES PRICES ($/MWh) Annual Actual/Forward as of 12/31/05 (1) Trend Line NI Hub/ComEd New York Zone G $90 $150 $60 $100 $30 $50 2003A: $37.07 2005A: $61.67 2003A: $61.70 2005A: $92.39 2004A: $42.11 2006A/F: $70.42 2004A: $61.82 2006A/F: $112.18 $0 $0 2003 2
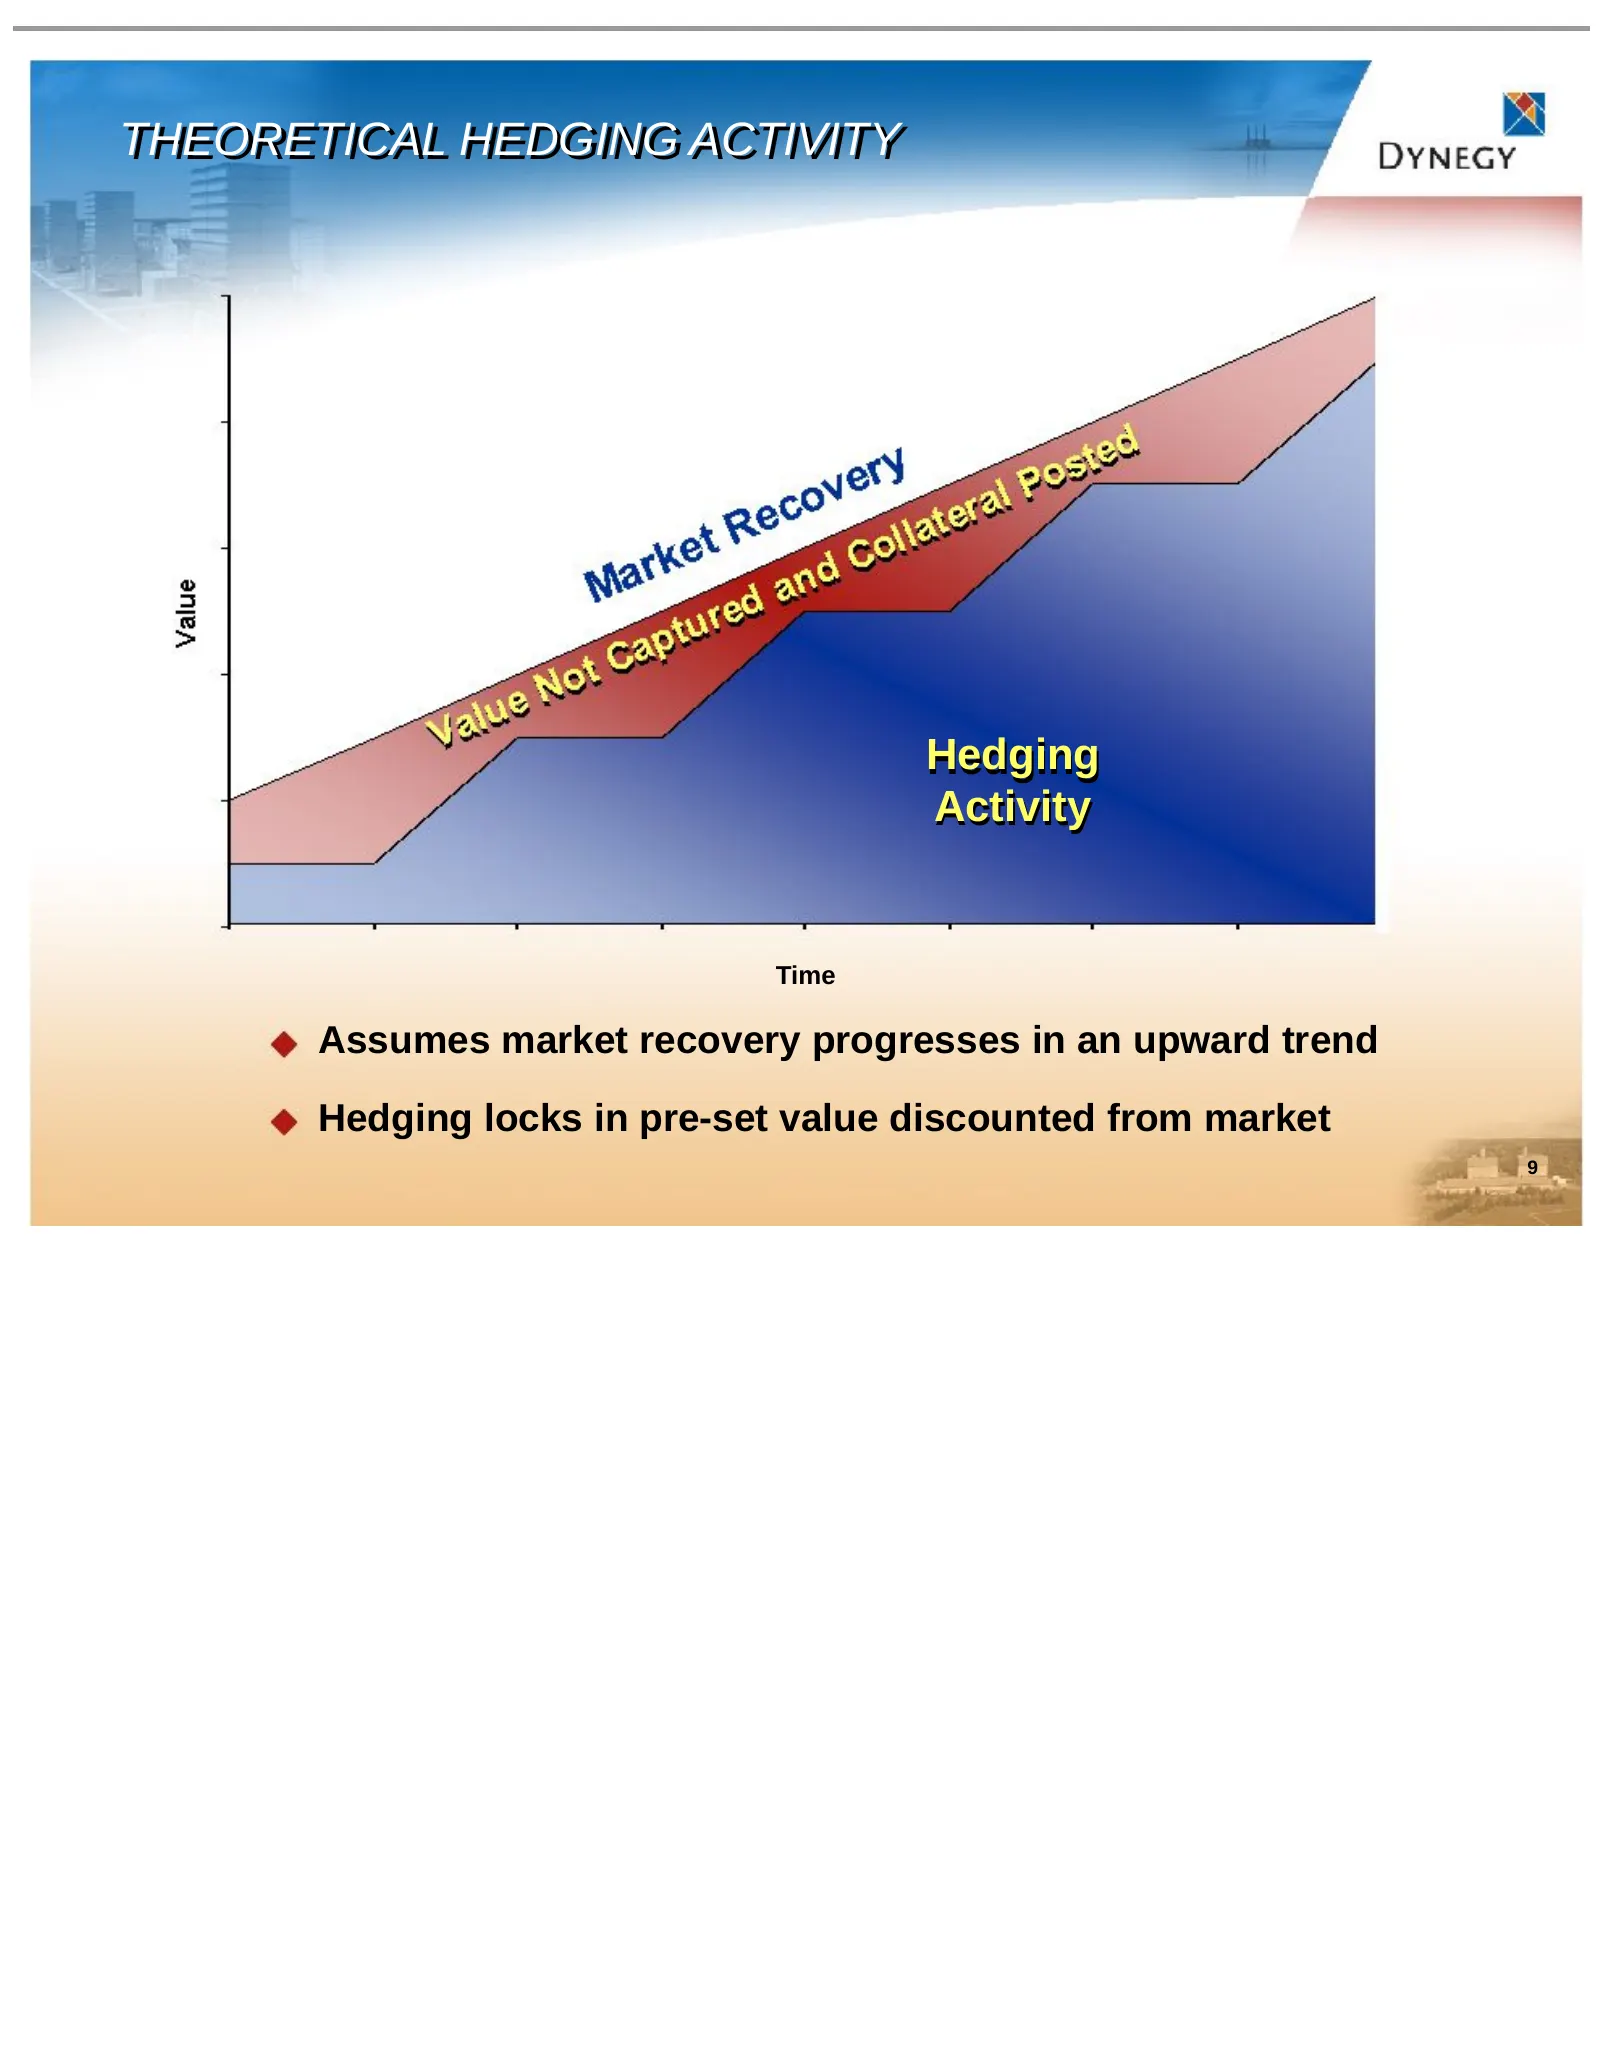
Slide 9: Theoretical Hedging Activity
THEORETICAL THEORETICAL HEDGING HEDGING ACTIVITY ACTIVITY Hedging Activity Time Assumes market recovery progresses in an upward trend Hedging locks in pre-set value discounted from market 9
Slide 10: Illinois Market Structure
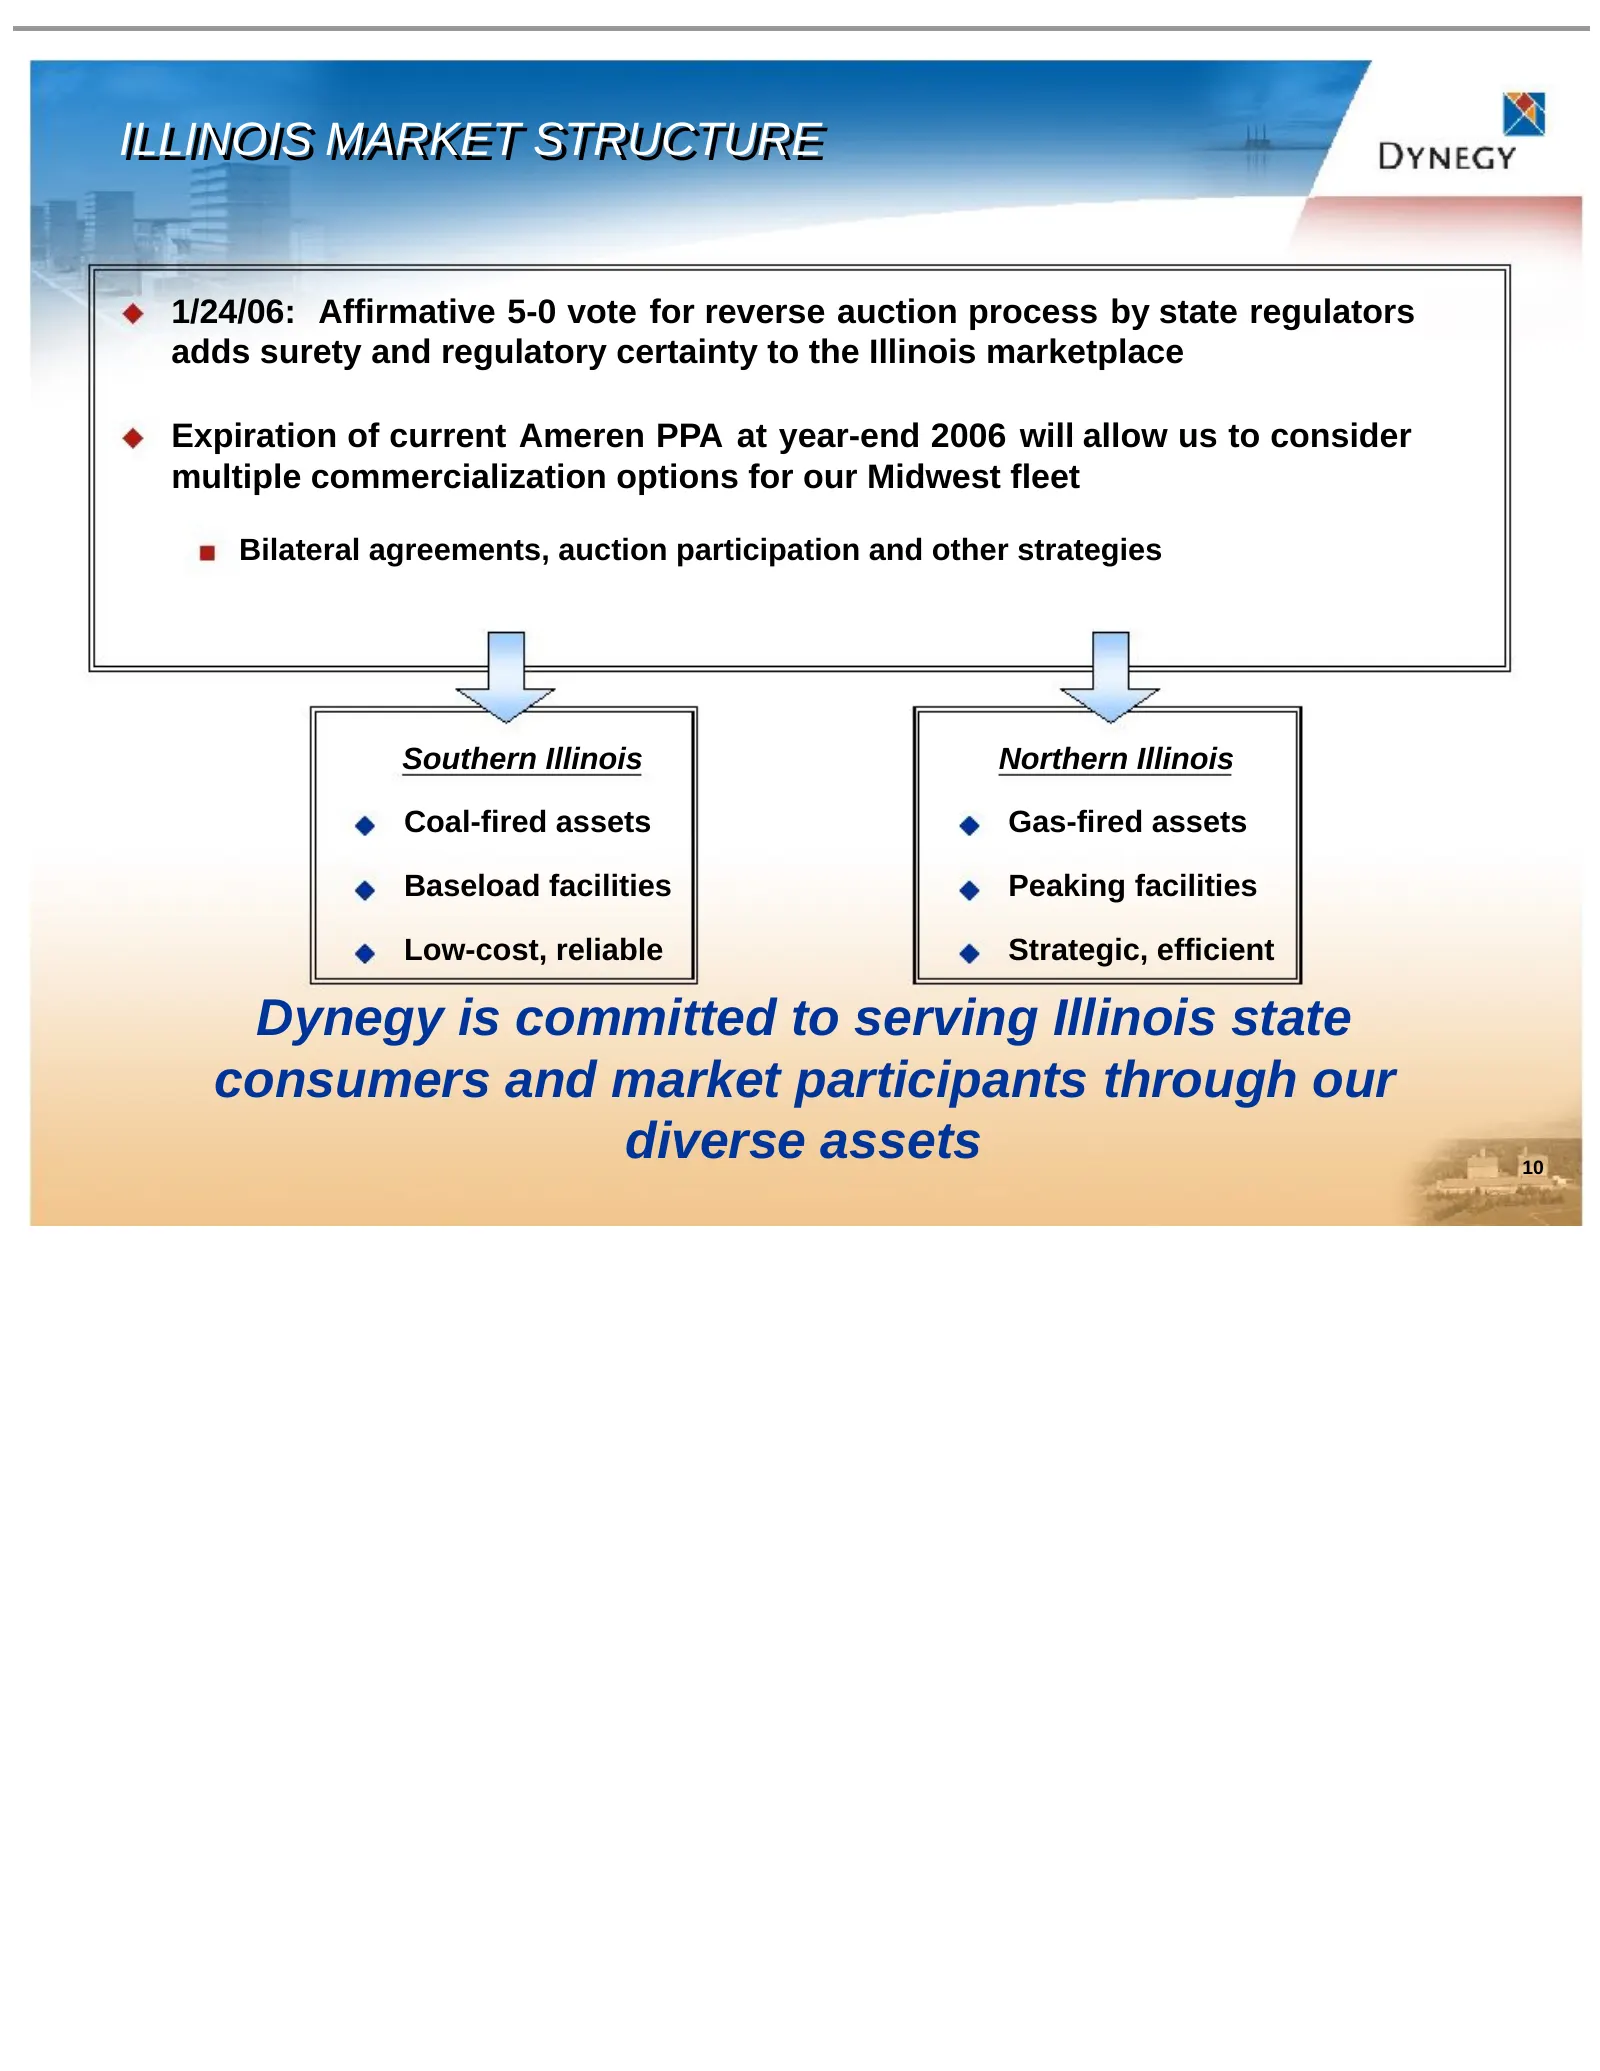
ILLINOIS ILLINOIS MARKET MARKET STRUCTURE STRUCTURE 1/24/06: Affirmative 5-0 vote for reverse auction process by state regulators adds surety and regulatory certainty to the Illinois marketplace Expiration of current Ameren PPA at year-end 2006 will allow us to consider multiple commercialization op

Slide 11: Financial Overview
DYNEGY Financial Overview
Slide 12: Par Offer to Repurchase SPNs
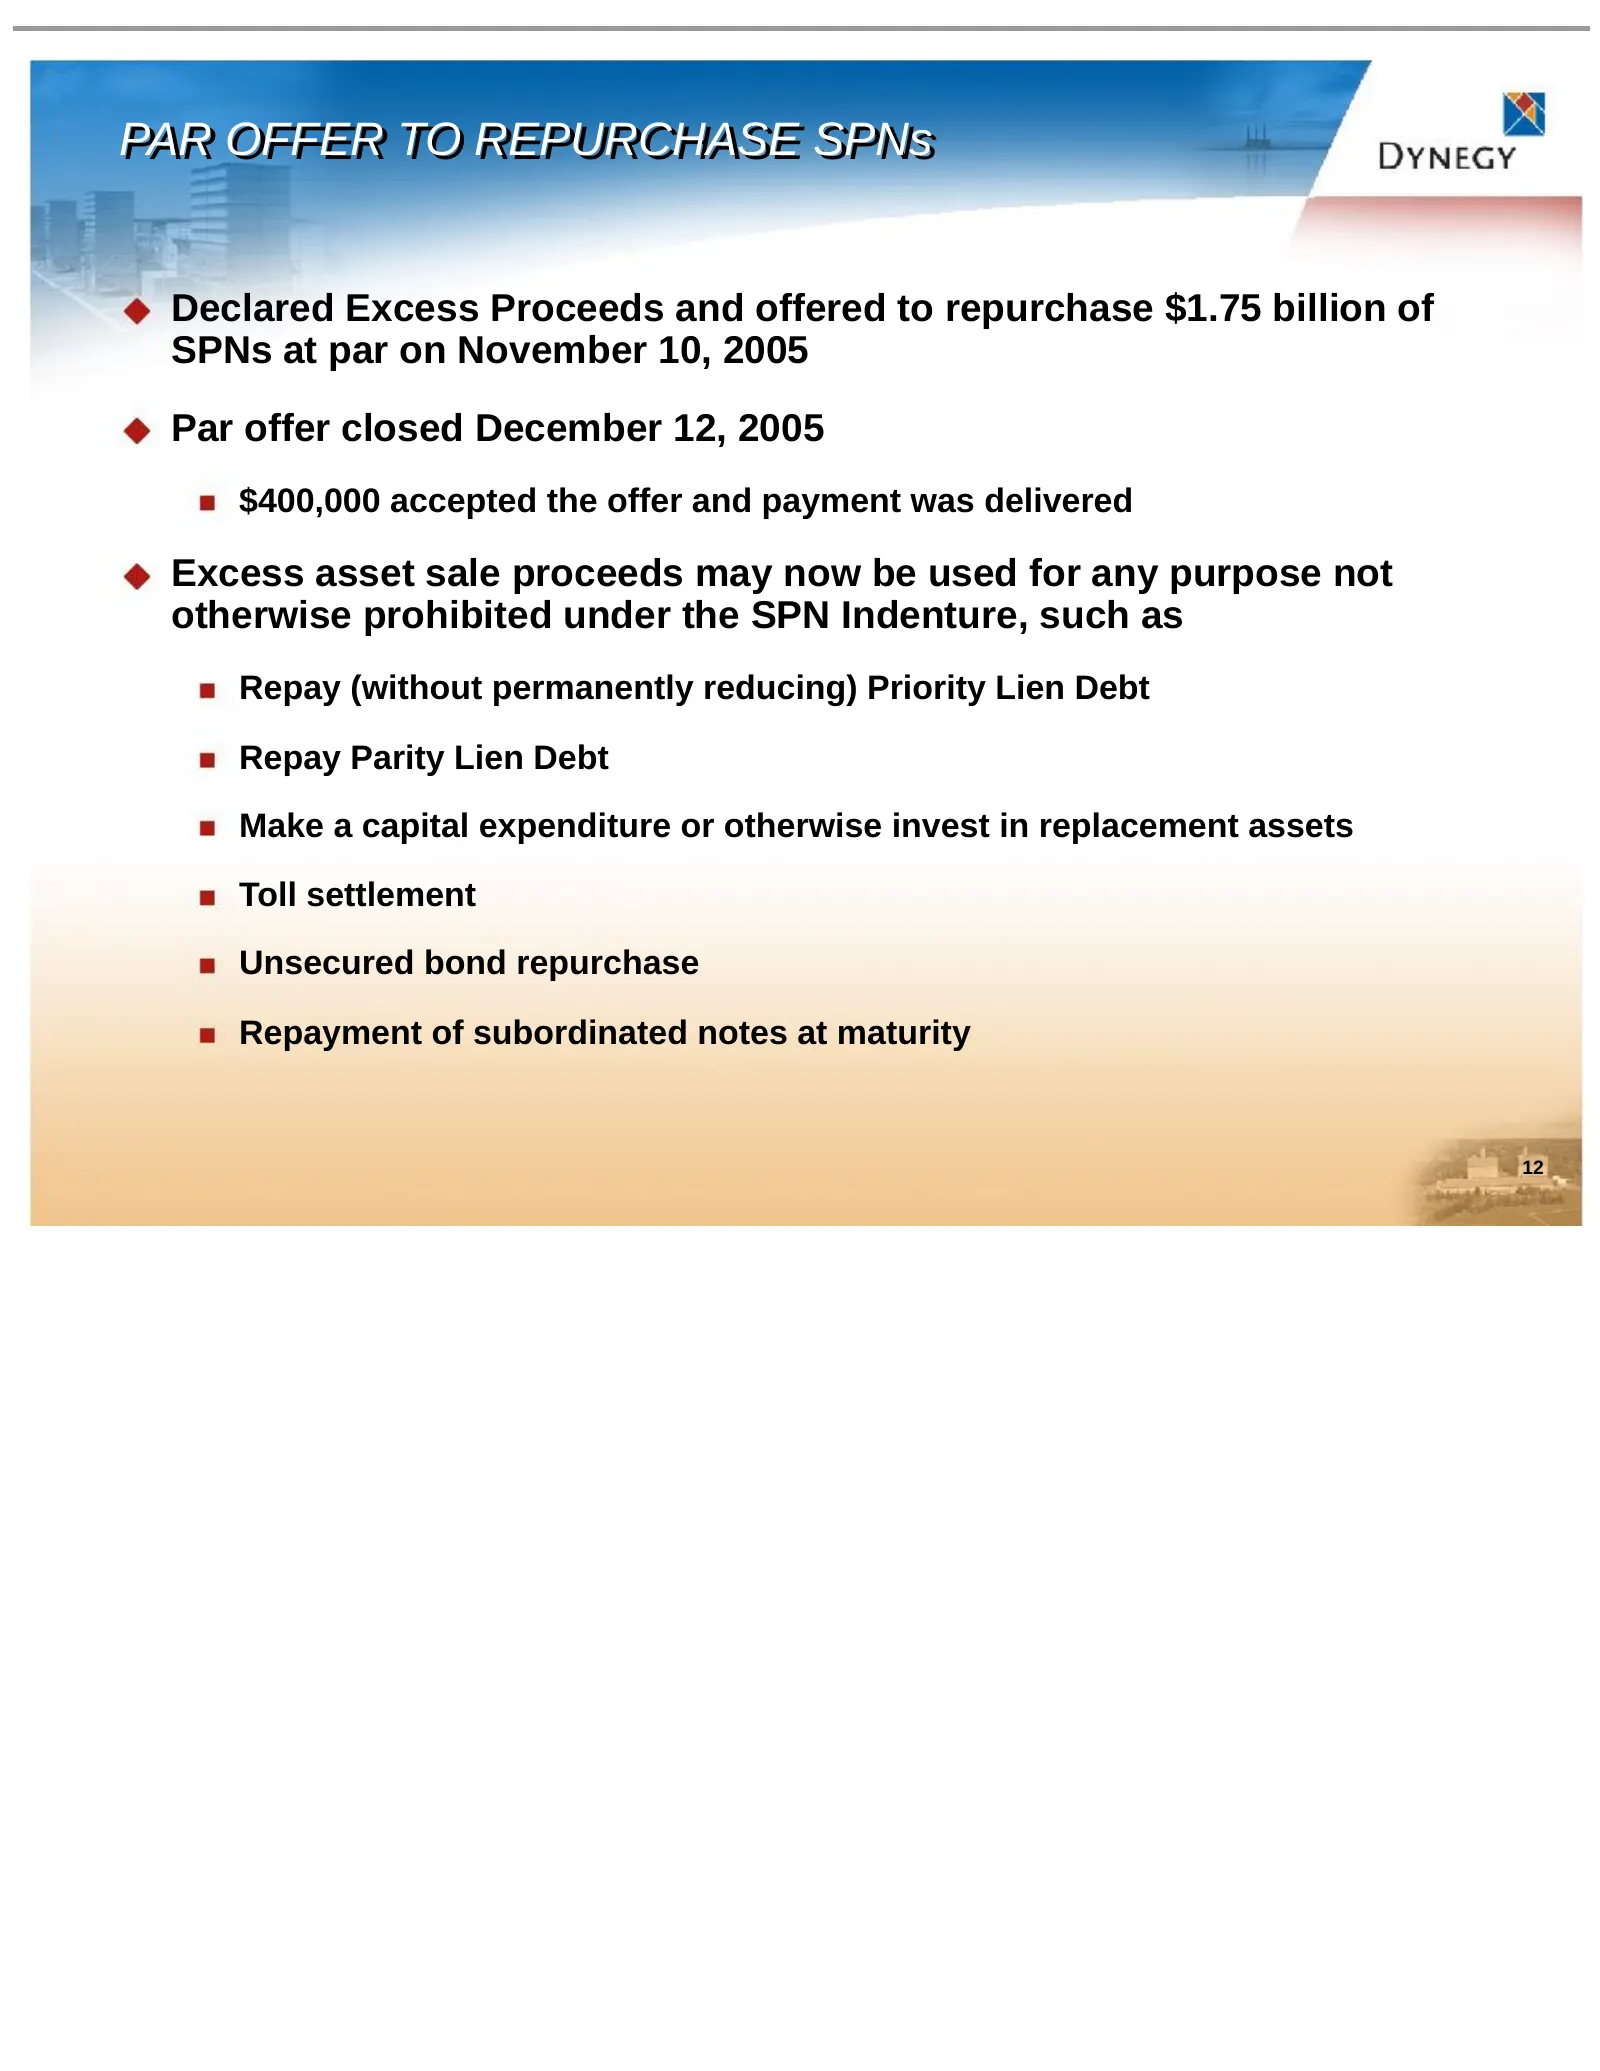
PAR PAR OFFER OFFER TO TO REPURCHASE REPURCHASE SPNs SPNs Declared Excess Proceeds and offered to repurchase $1.75 billion of SPNs at par on November 10, 2005 Par offer closed December 12, 2005 $400,000 accepted the offer and payment was delivered Excess asset sale proceeds may now be used for any p
Slide 13: Debt Chart (12/31/05)
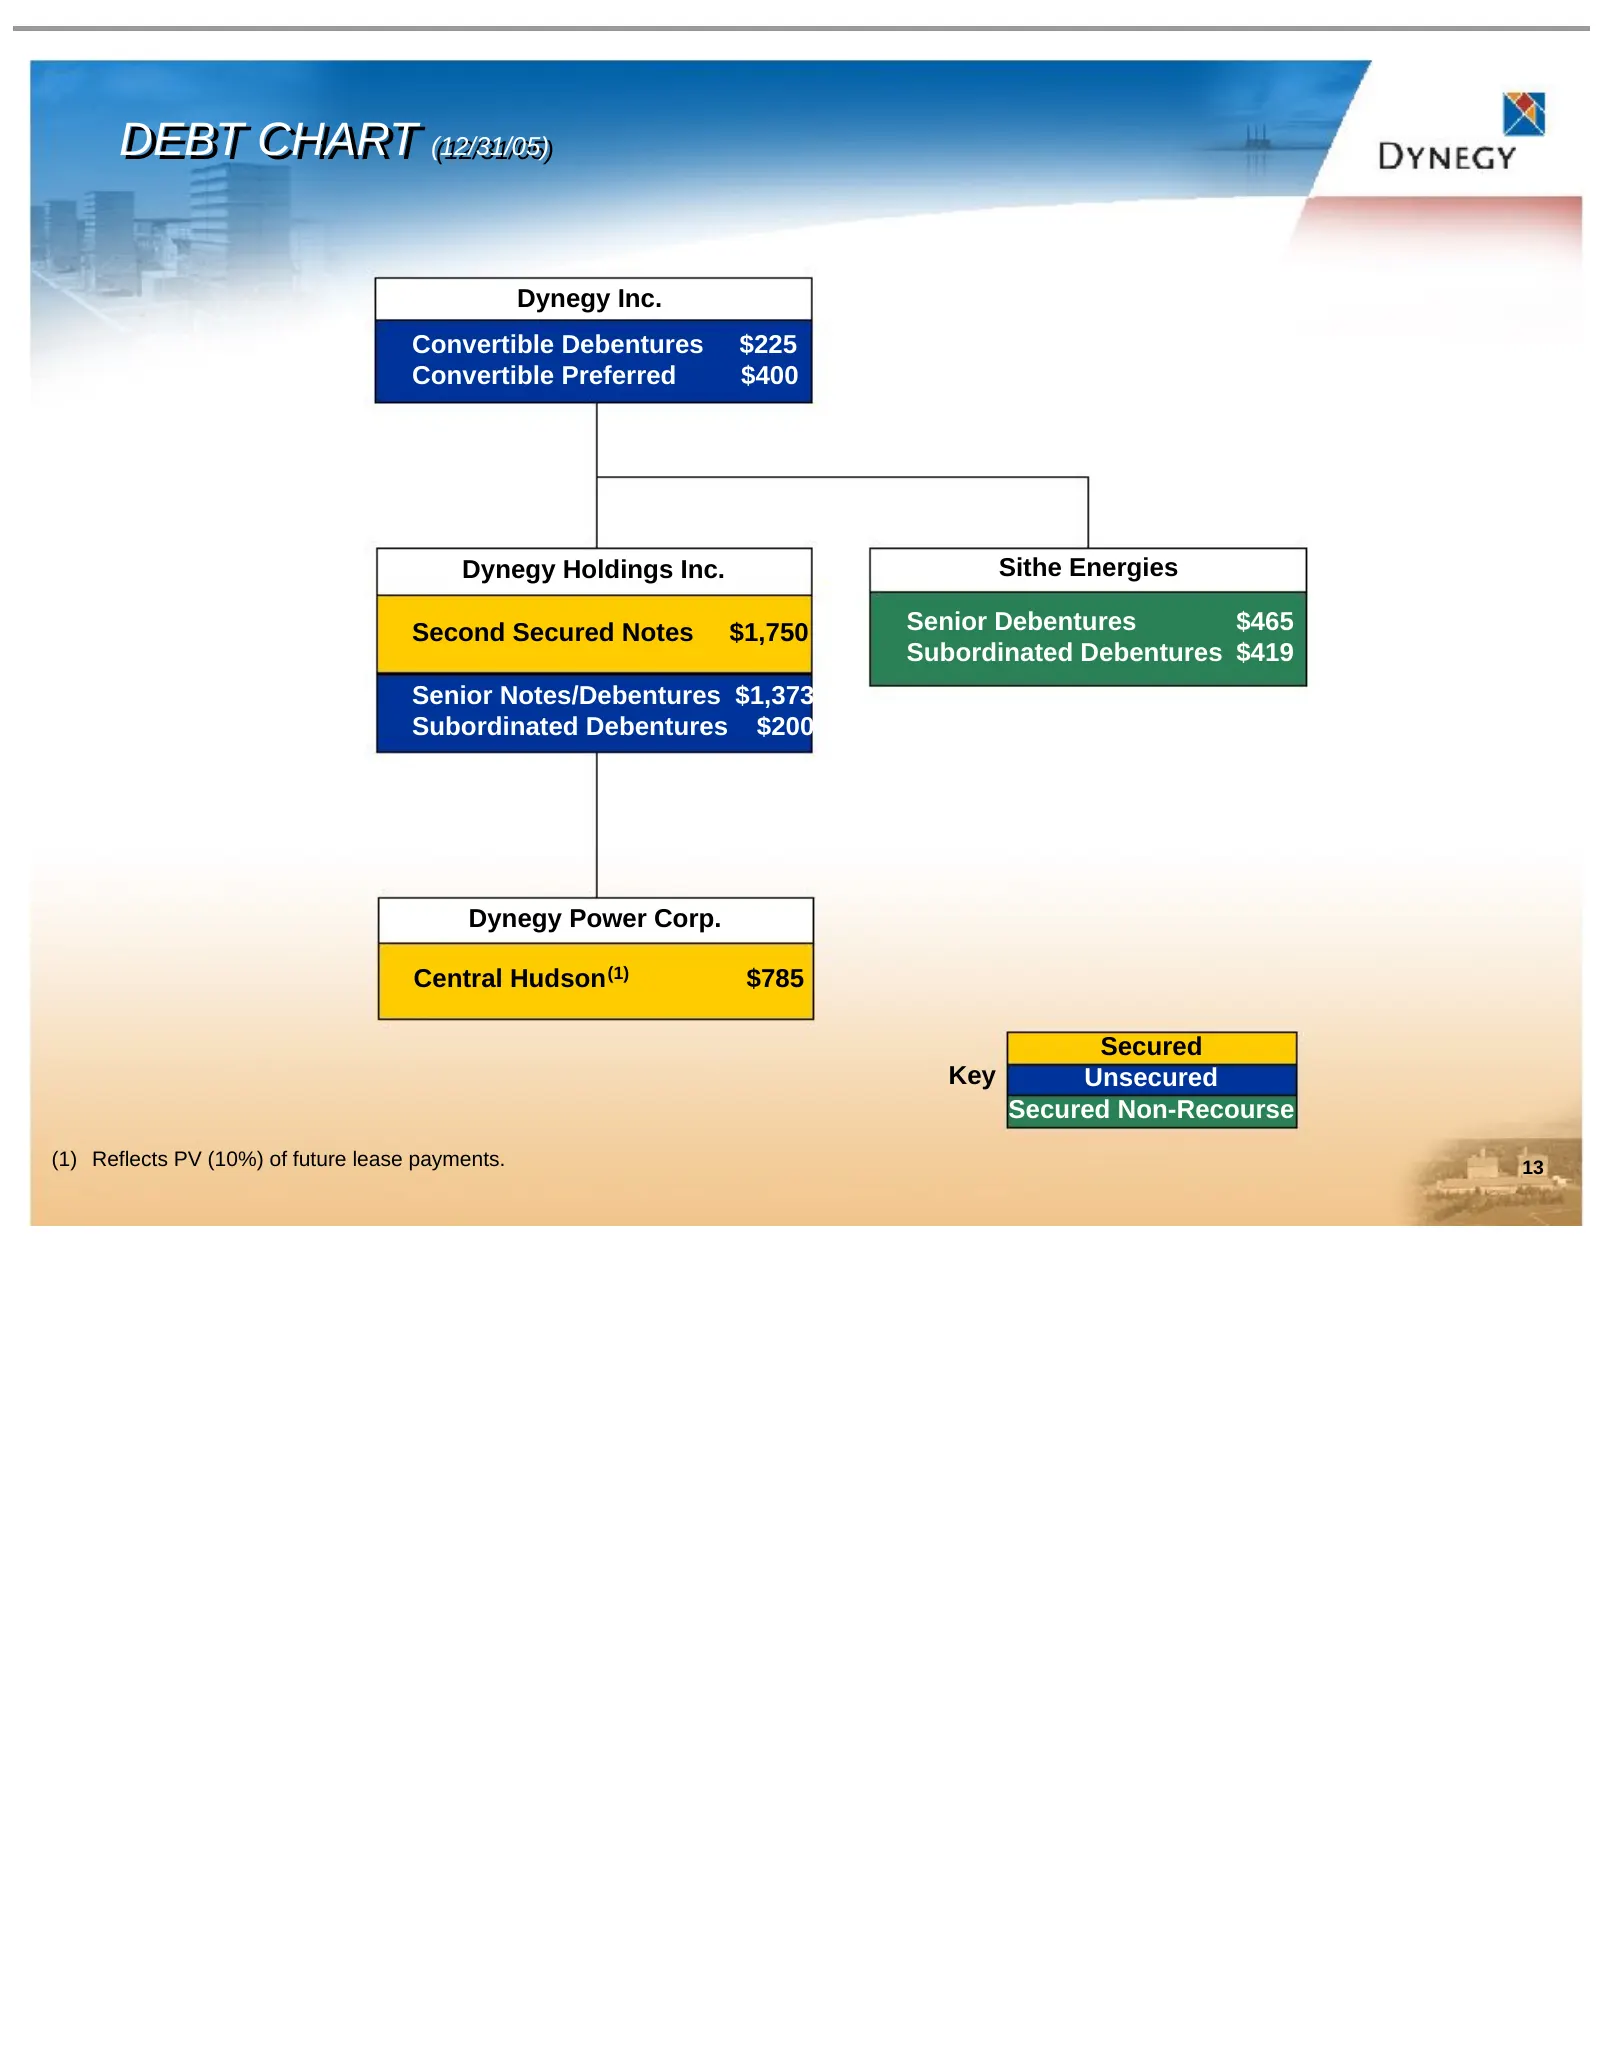
DEBT DEBT CHART CHART (12/31/05) (12/31/05) Dynegy Inc.. Convertible Debentures $225 Convertible Preferred $400 Dynegy Holdings Inc. Sithe Energies Second Secured Notes $1,750 Senior Debentures $465 Subordinated Debentures $419 Senior Notes/Debentures $1,373 Subordinated Debentures $200 Dynegy Power
Slide 14: Liability Management Considerations
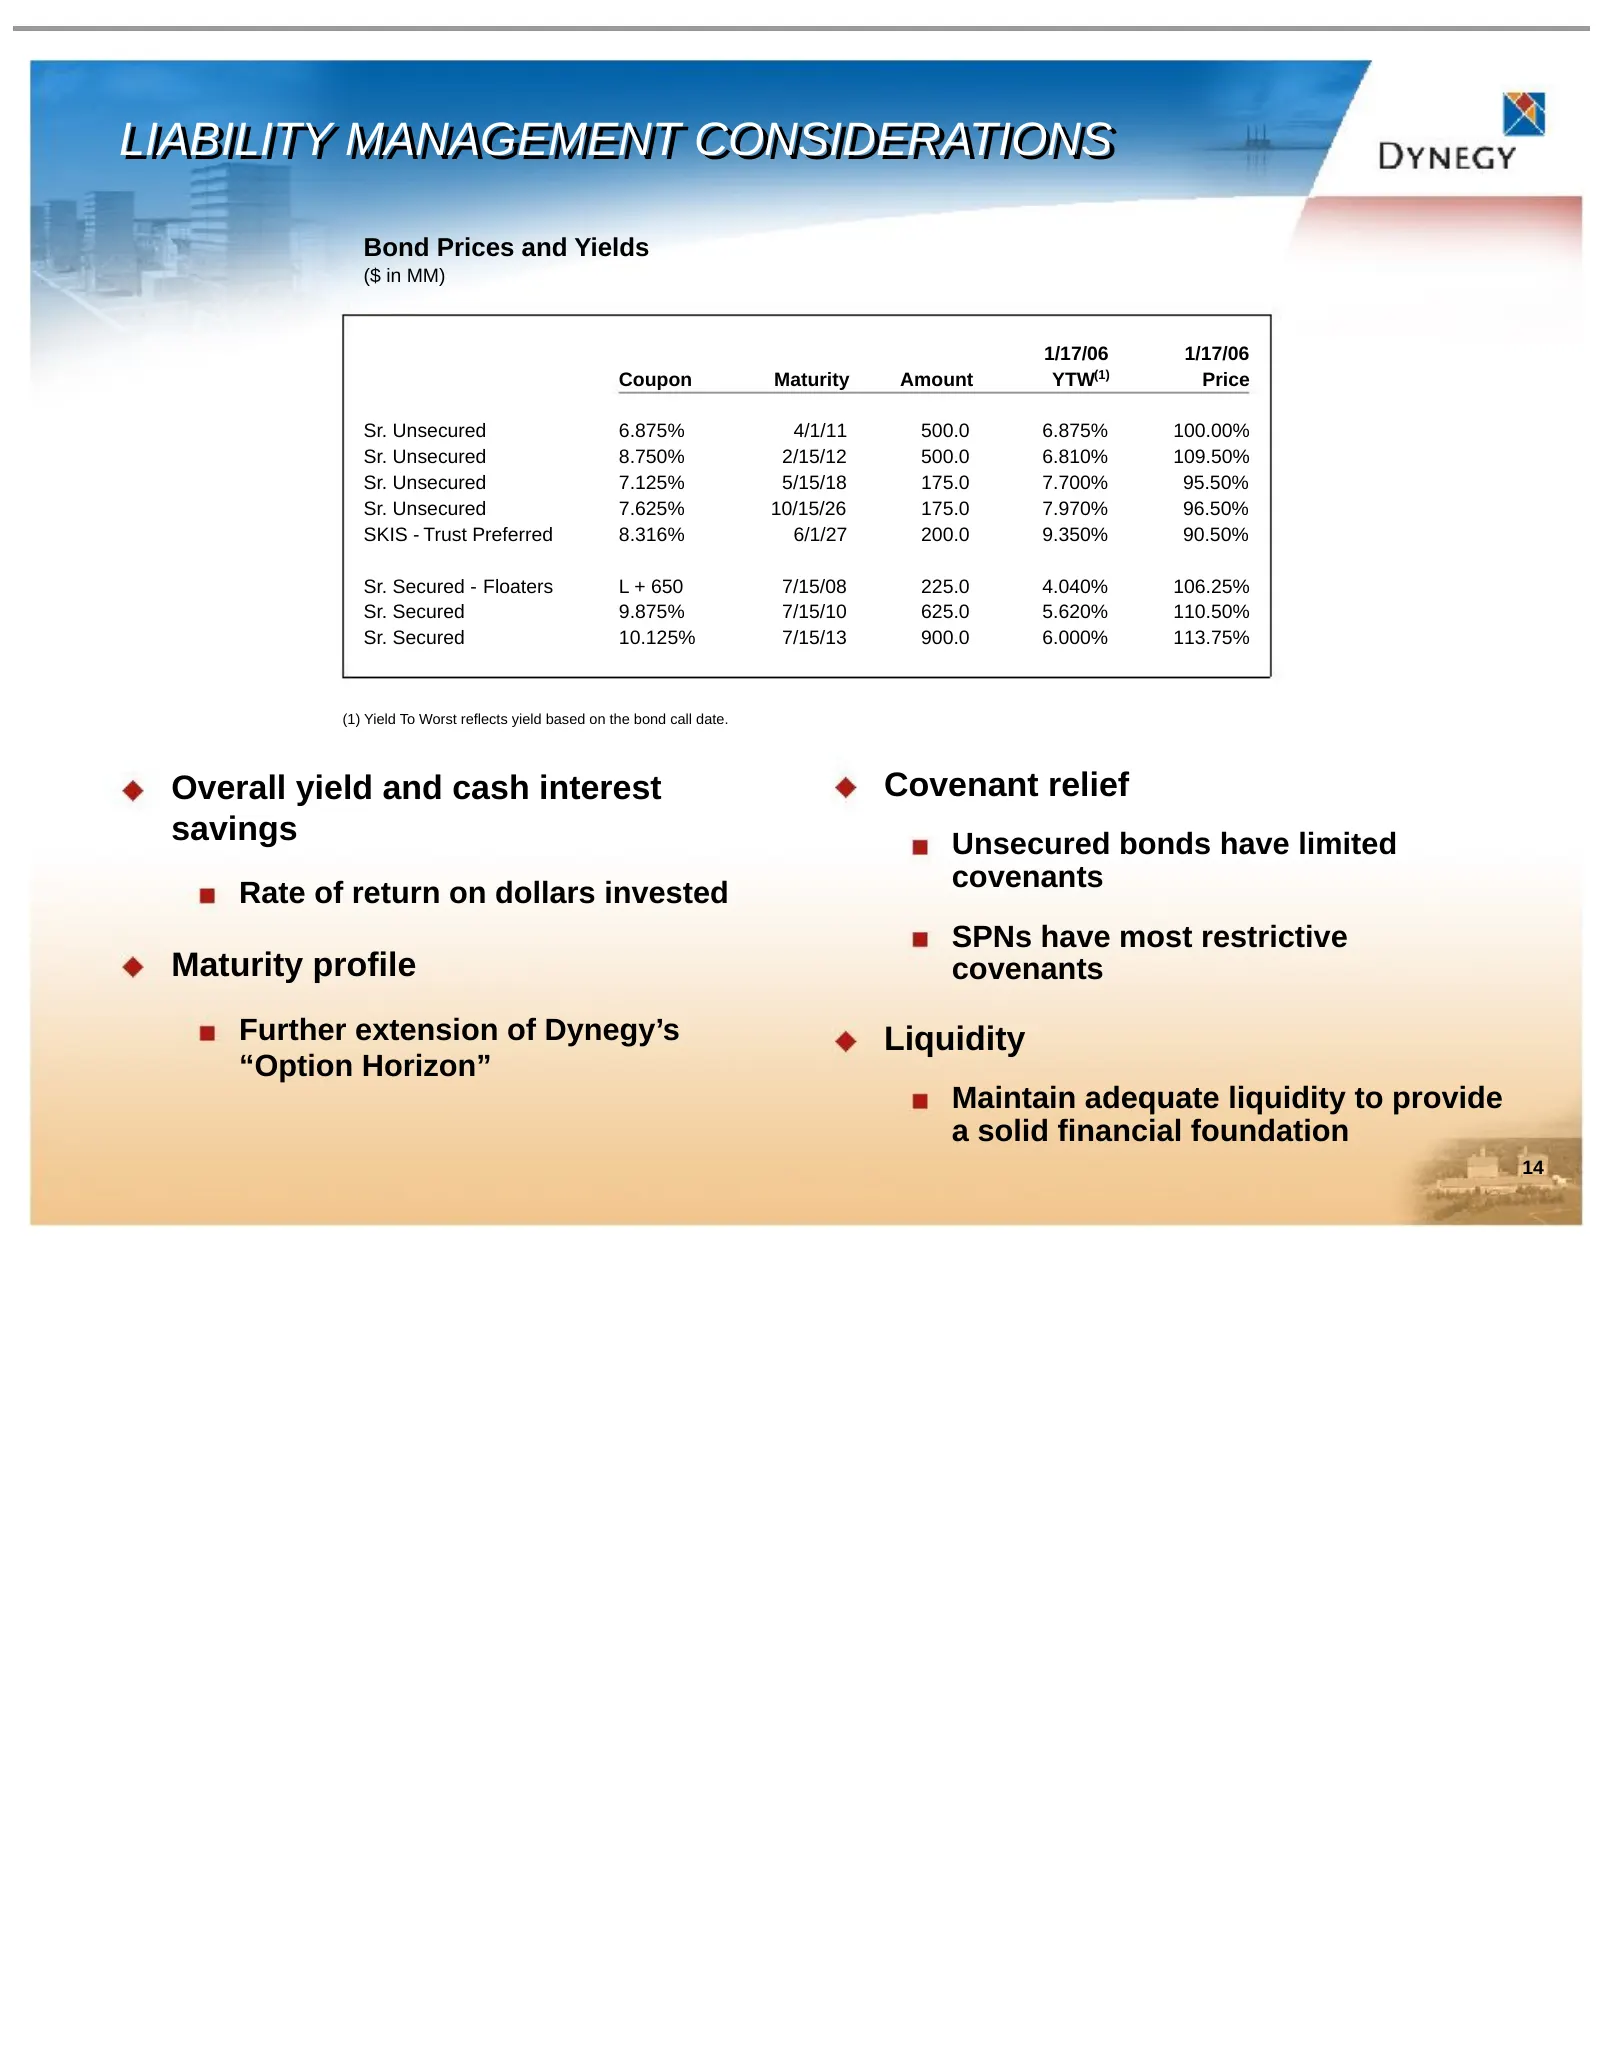
LIABILITY LIABILITY MANAGEMENT MANAGEMENT CONSIDERATIONS CONSIDERATIONS Bond Prices and Yields ($ in MM) 1/17/06 1/17/06 Coupon Maturity Amount YTW(1) Price Sr. Unsecured 6.875% 4/1/11 500.0 6.875% 100.00% Sr. Unsecured 8.750% 2/15/12 500.0 6.810% 109.50% Sr. Unsecured 7.125% 5/15/18 175.0 7.700% 95
Slide 15: Looking Ahead
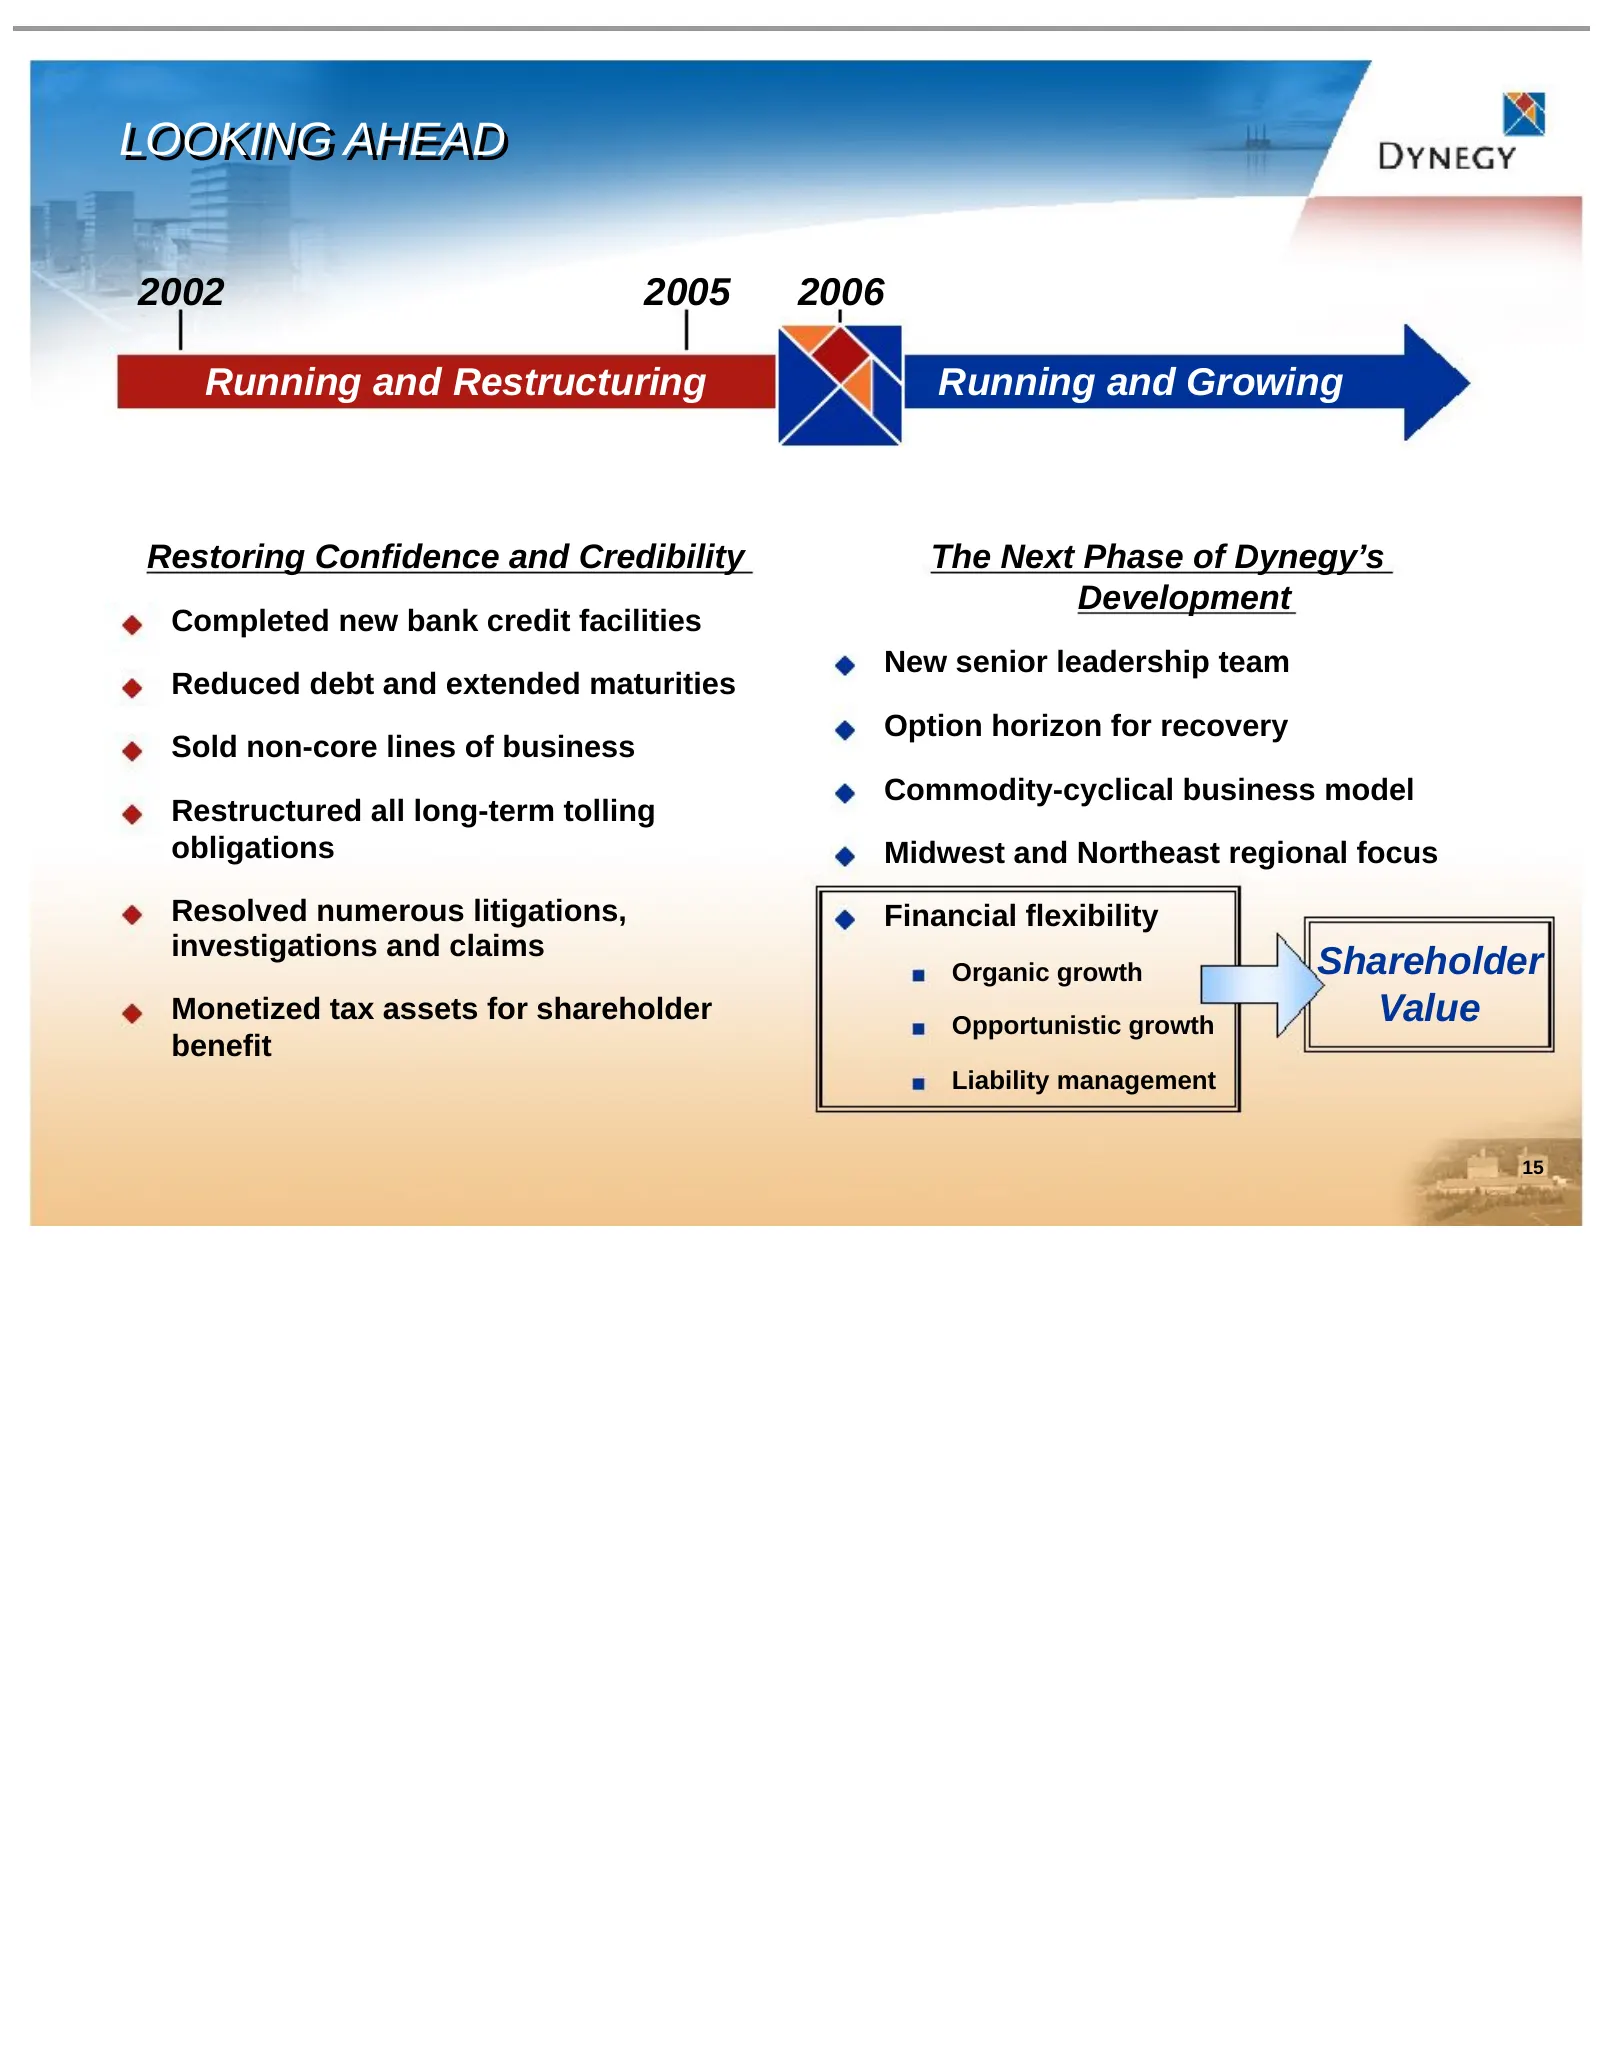
LOOKING LOOKING AHEAD AHEAD 2002 2005 2006 Running and Restructuring Running and Growing Restoring Confidence and Credibility The Next Phase of Dynegy’s Development Completed new bank credit facilities New senior leadership team Reduced debt and extended maturities Option horizon for recovery Sold n
Slide 16: Appendix
DYNEGY Appendix
Slide 17: Dynegy Post-Midstream Sale: A Pure Power Generation Play
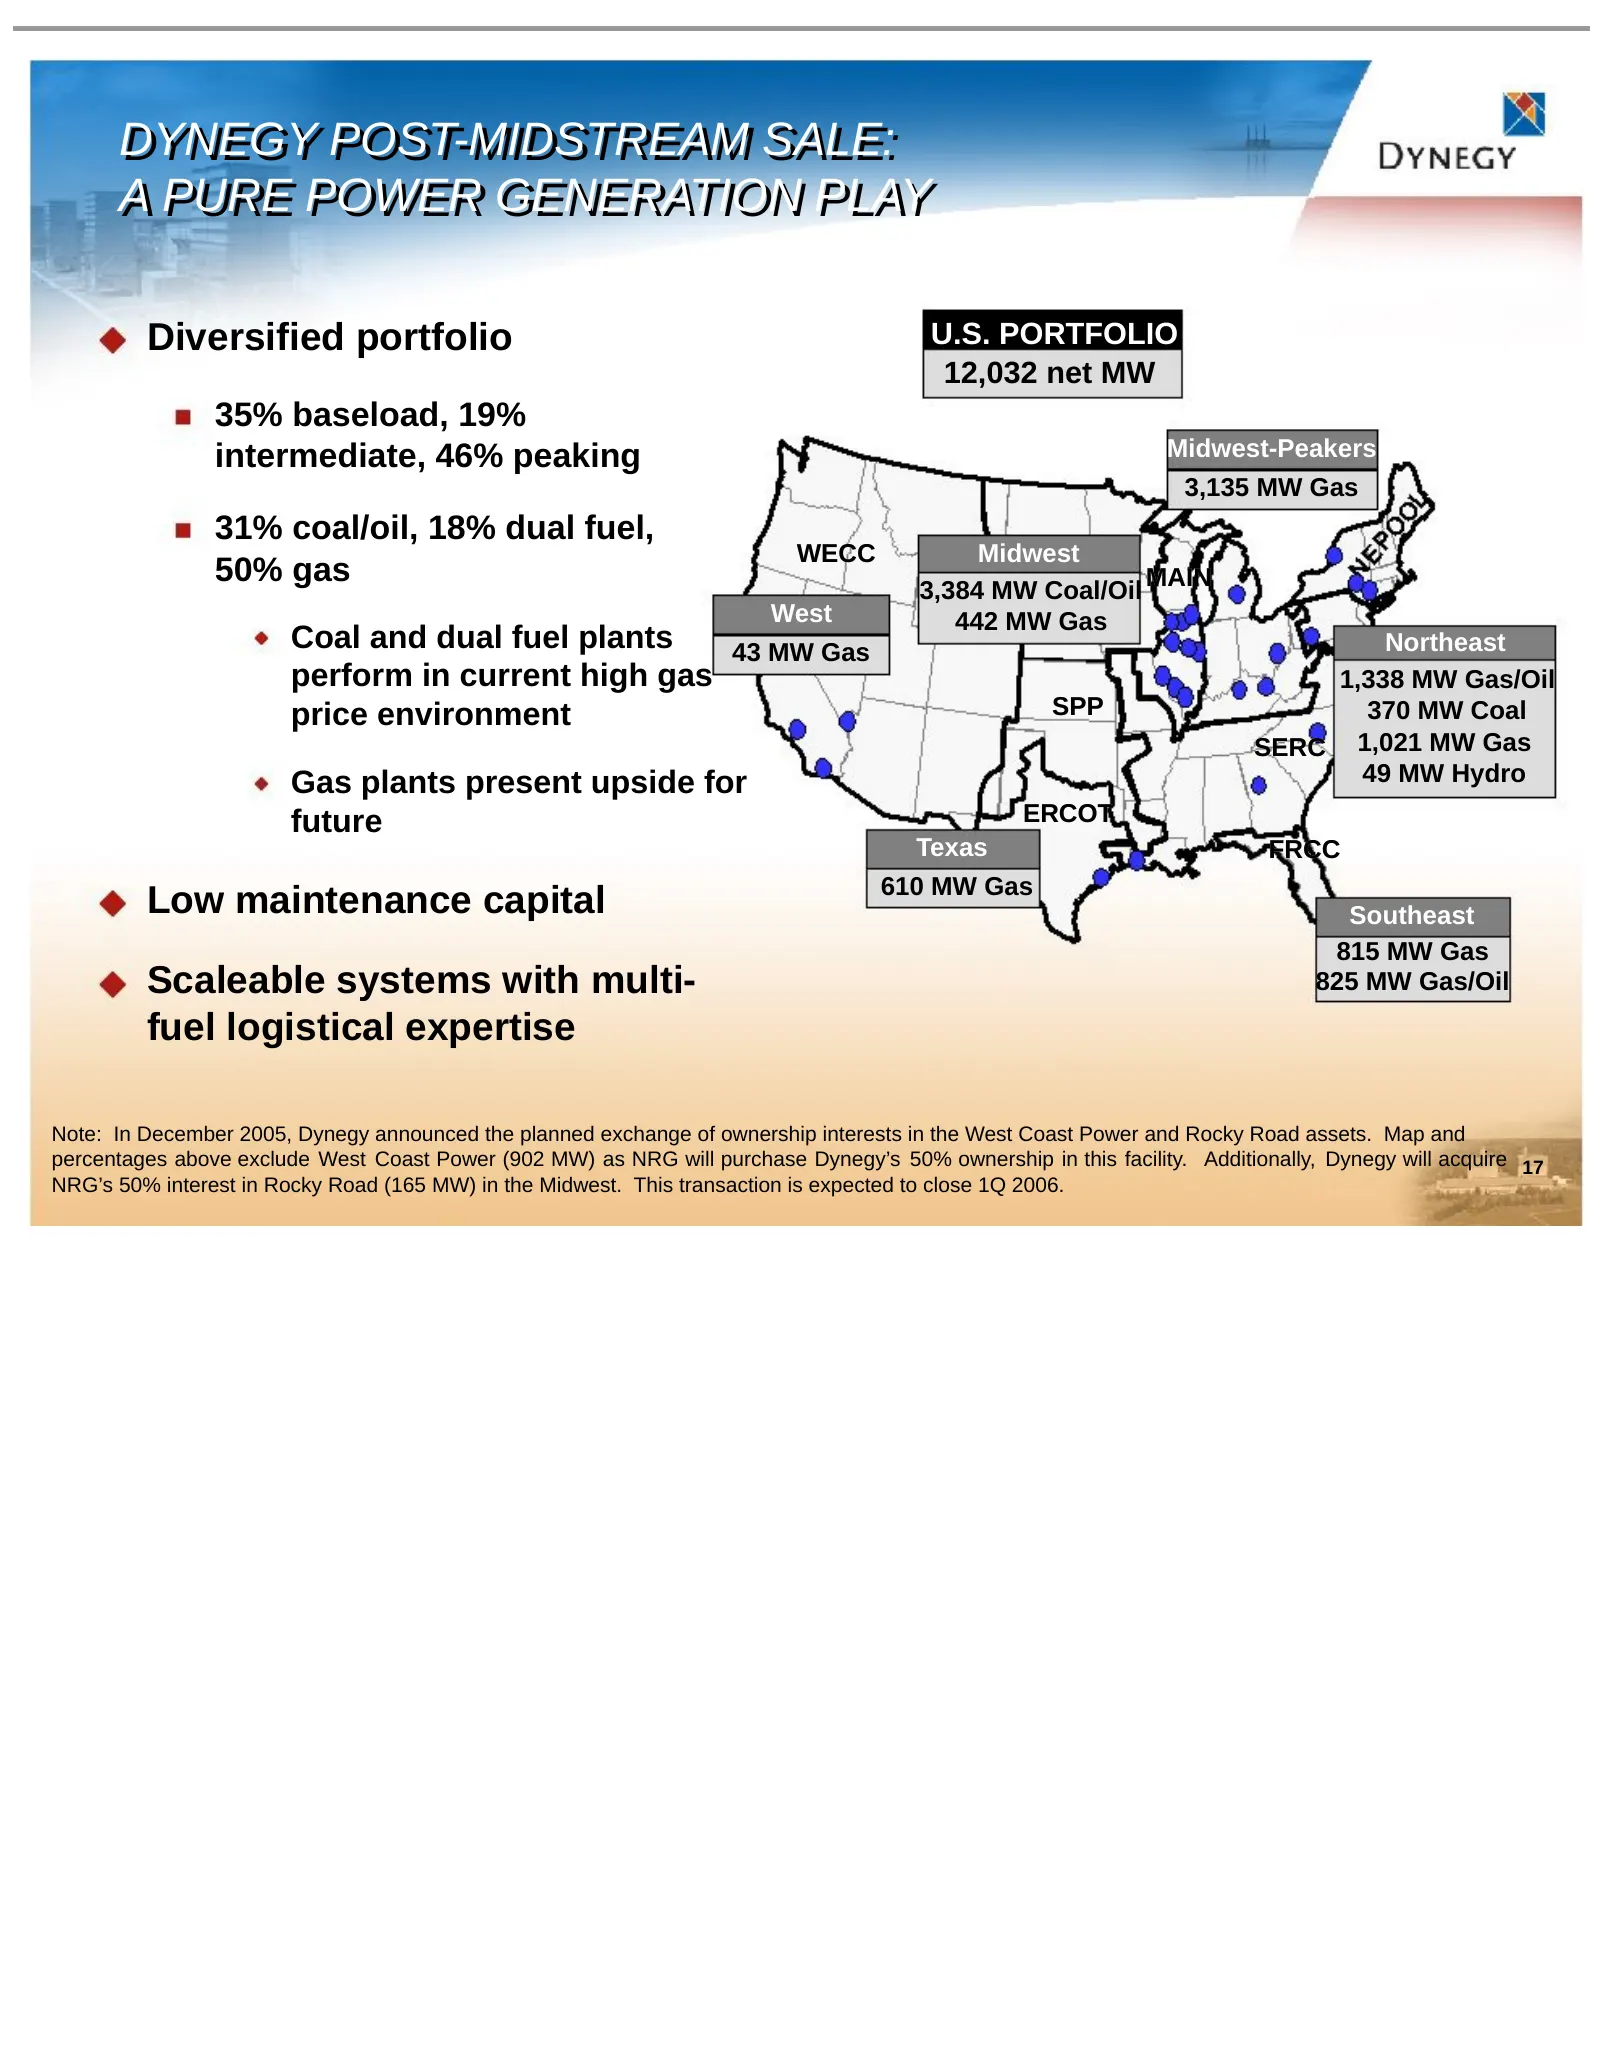
DYNEGY DYNEGY POST-MIDSTREAM POST-MIDSTREAM SALE: SALE: A A PURE PURE POWER POWER GENERATION GENERATION PLAY PLAY Diversified portfolio U.S. PORTFOLIO 12,032 net MW 35% baseload, 19% intermediate, 46% peaking Midwest-Peakers 3,135 MW Gas 31% coal/oil, 18% dual fuel, WECC Midwest 50% gas MAIN 3,384 M
Slide 18: Funded Debt and Other Obligations Maturity Profile
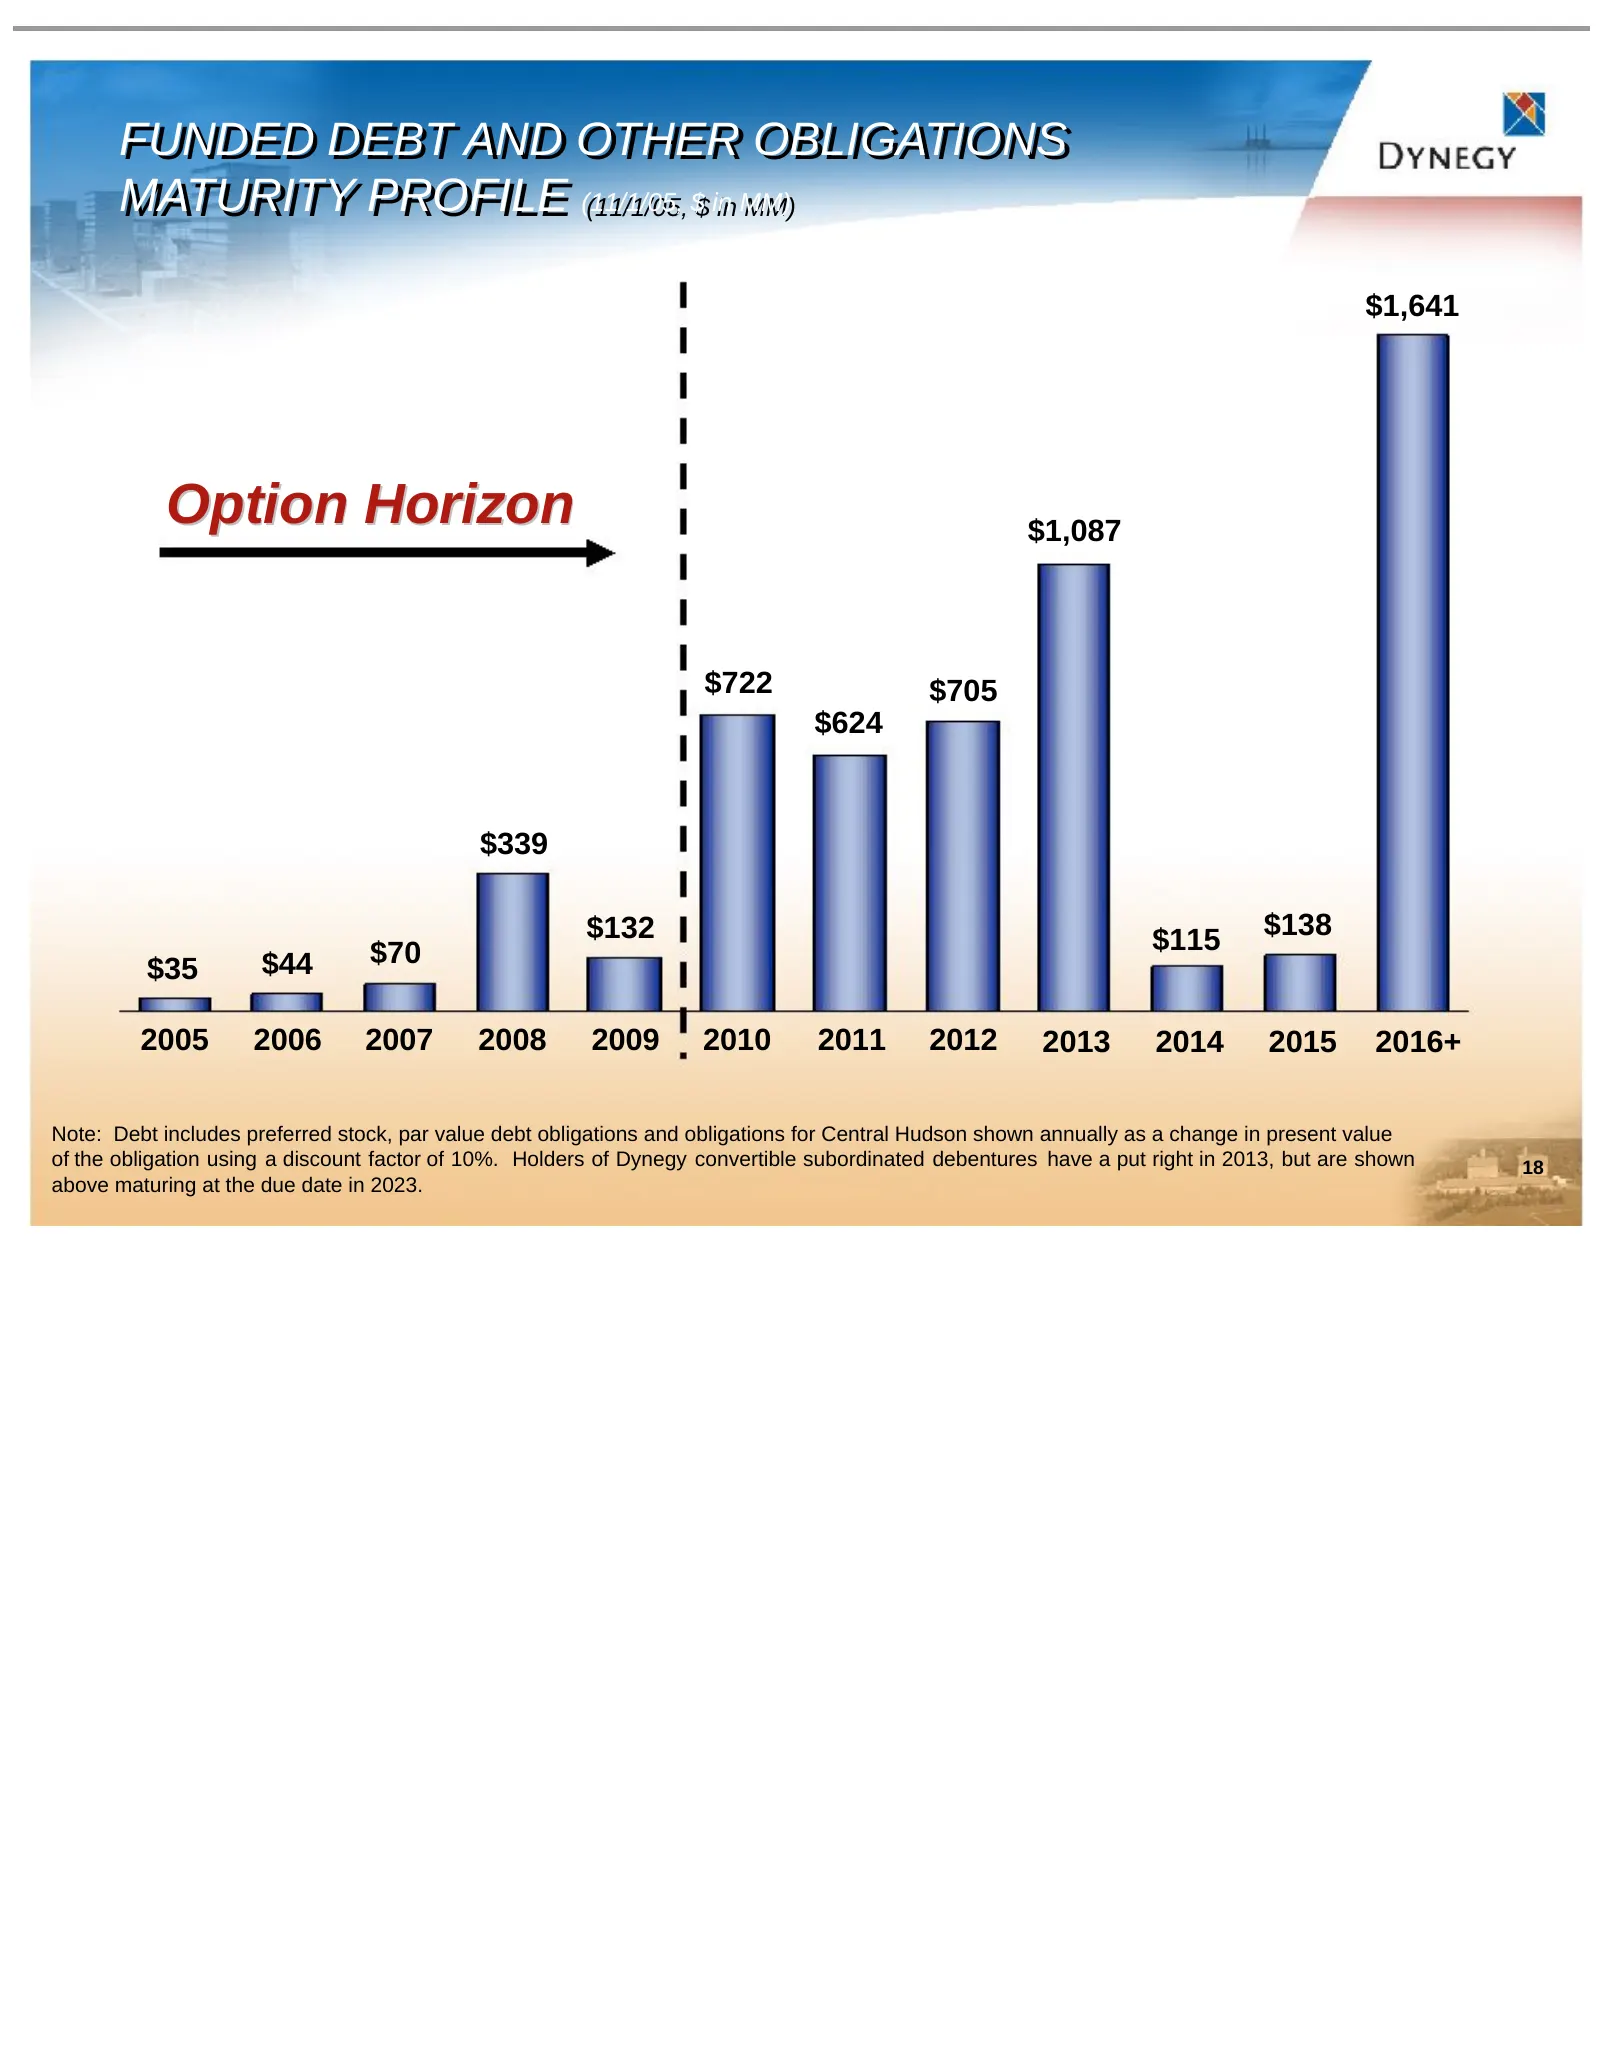
FUNDED FUNDED DEBT DEBT AND AND OTHER OTHER OBLIGATIONS OBLIGATIONS MATURITY MATURITY PROFILE PROFILE (11/1/05, (11/1/05, $$ in in MM) MM) $1,641 Option Horizon $1,087 $722 $705 $624 $339 $132 $115 $138 $44 $70 $35 2005 2006 2007 2008 2009 2010 2011 2012 2013 2014 2015 2016+ Note: Debt includes pref
Slide 19: Debt and Other Obligations
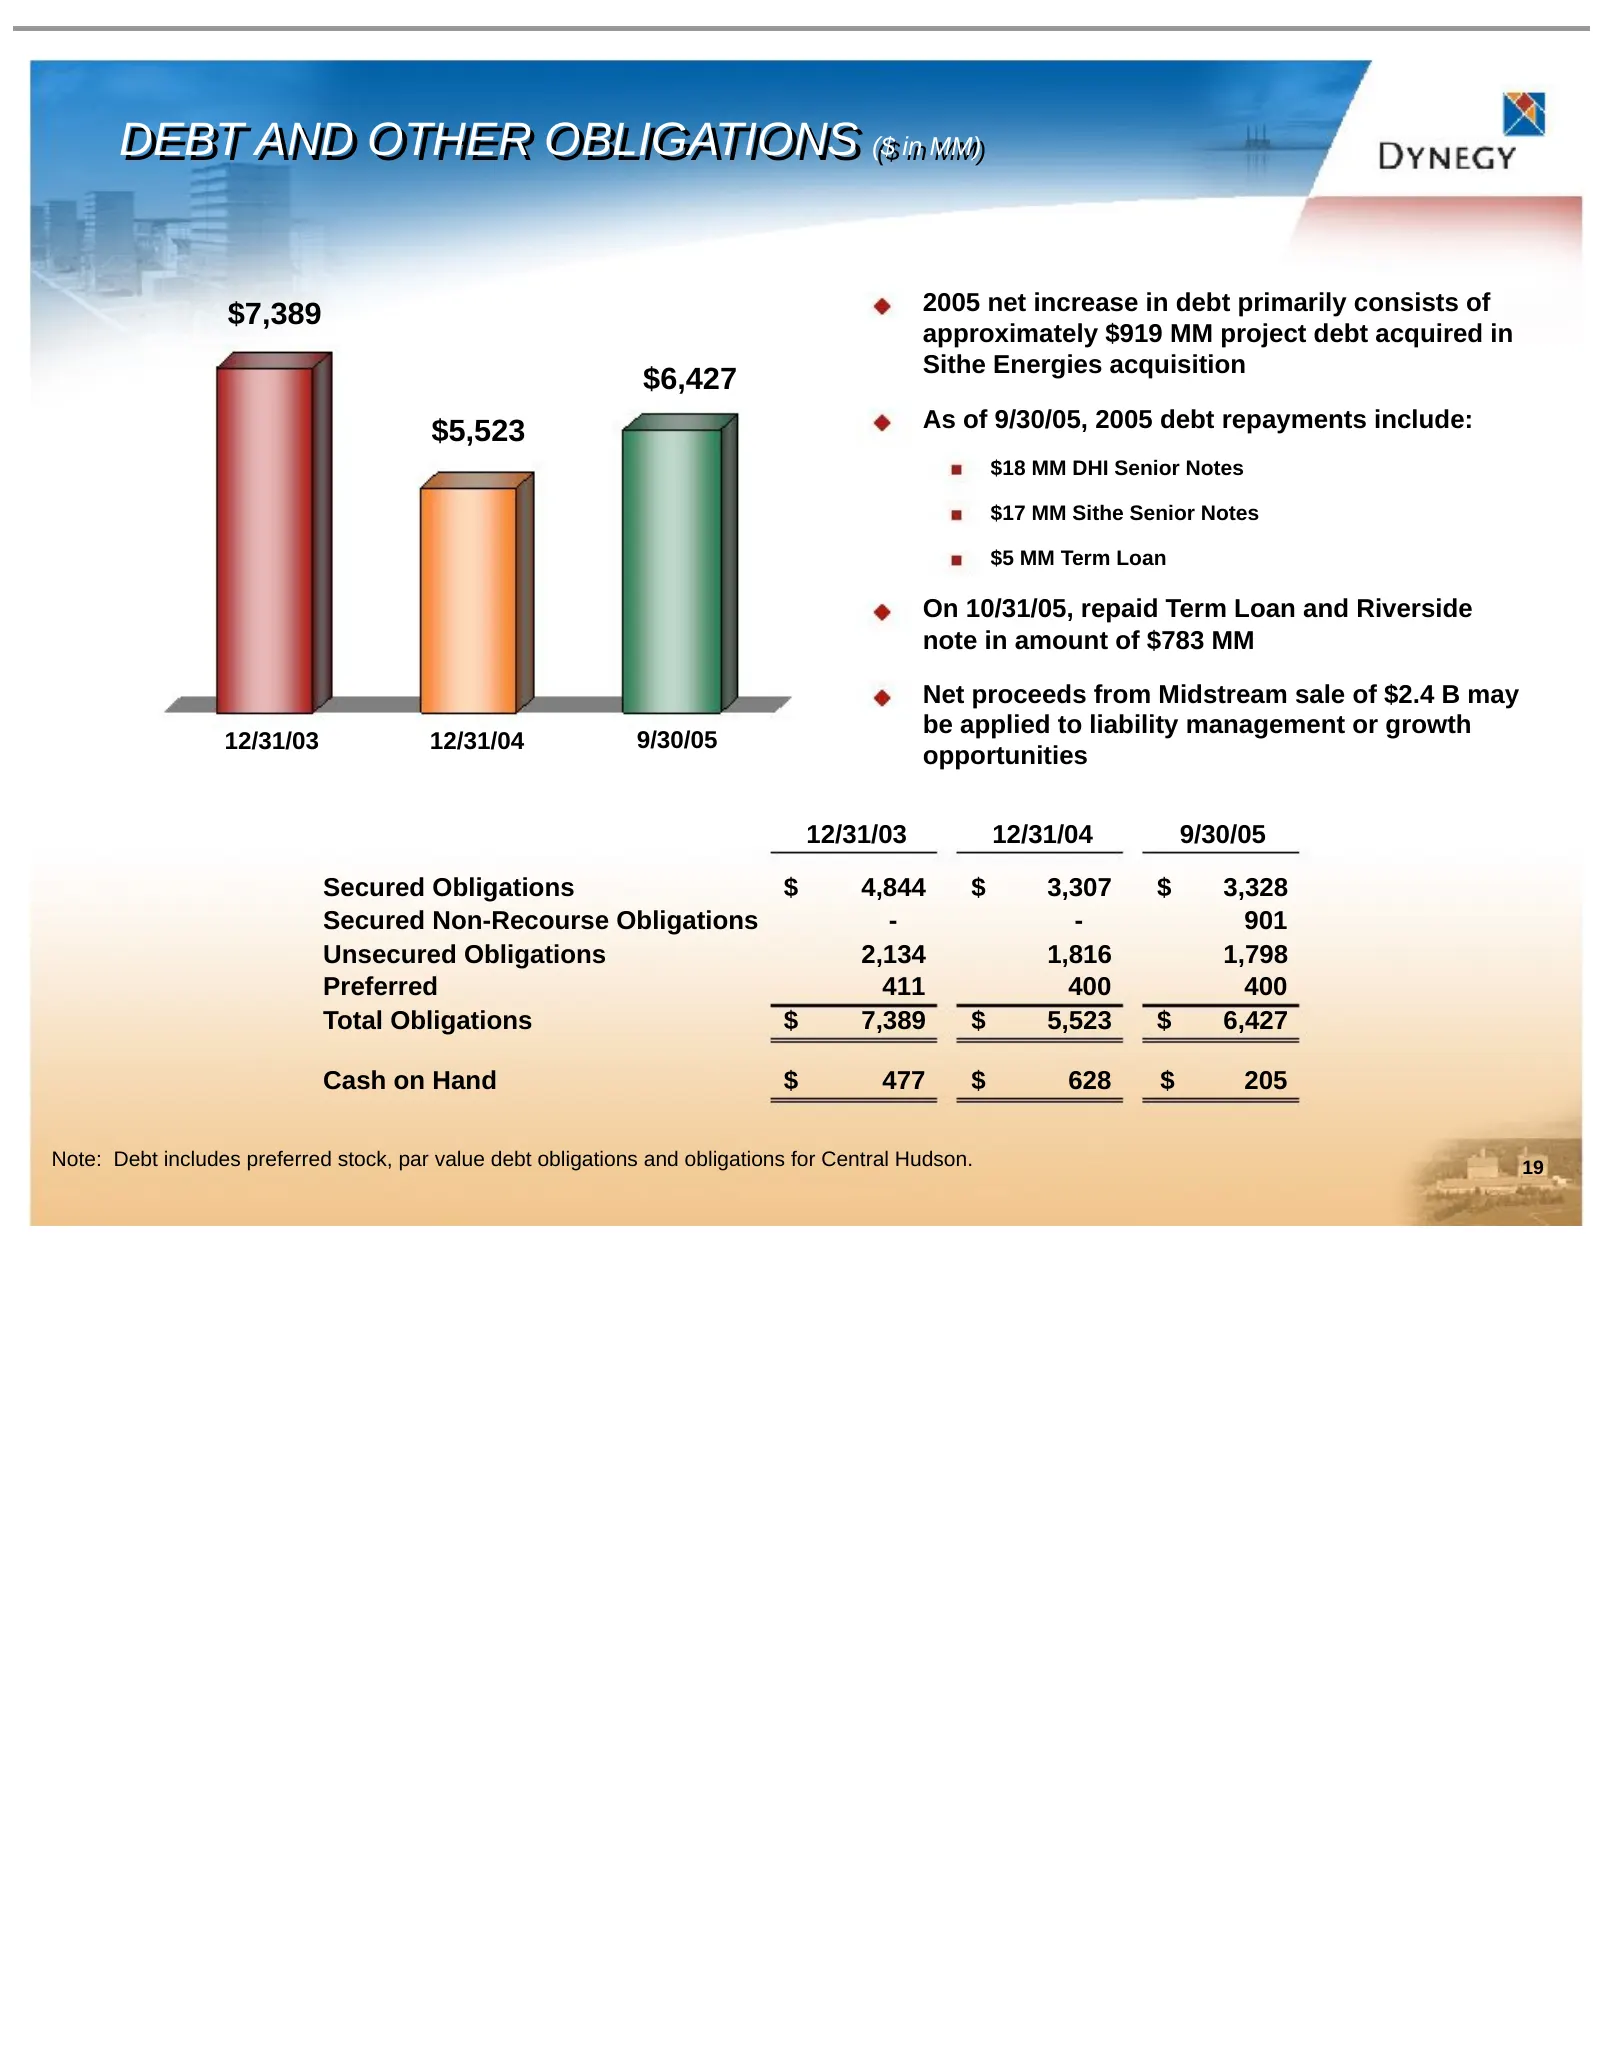
DEBT DEBT AND AND OTHER OTHER OBLIGATIONS OBLIGATIONS ($($ inin MM) MM) $7,389 2005 net increase in debt primarily consists of approximately $919 MM project debt acquired in Sithe Energies acquisition $6,427 $5,523 As of 9/30/05, 2005 debt repayments include: $18 MM DHI Senior Notes $17 MM Sithe Sen
Slide 20: Collateral Posted
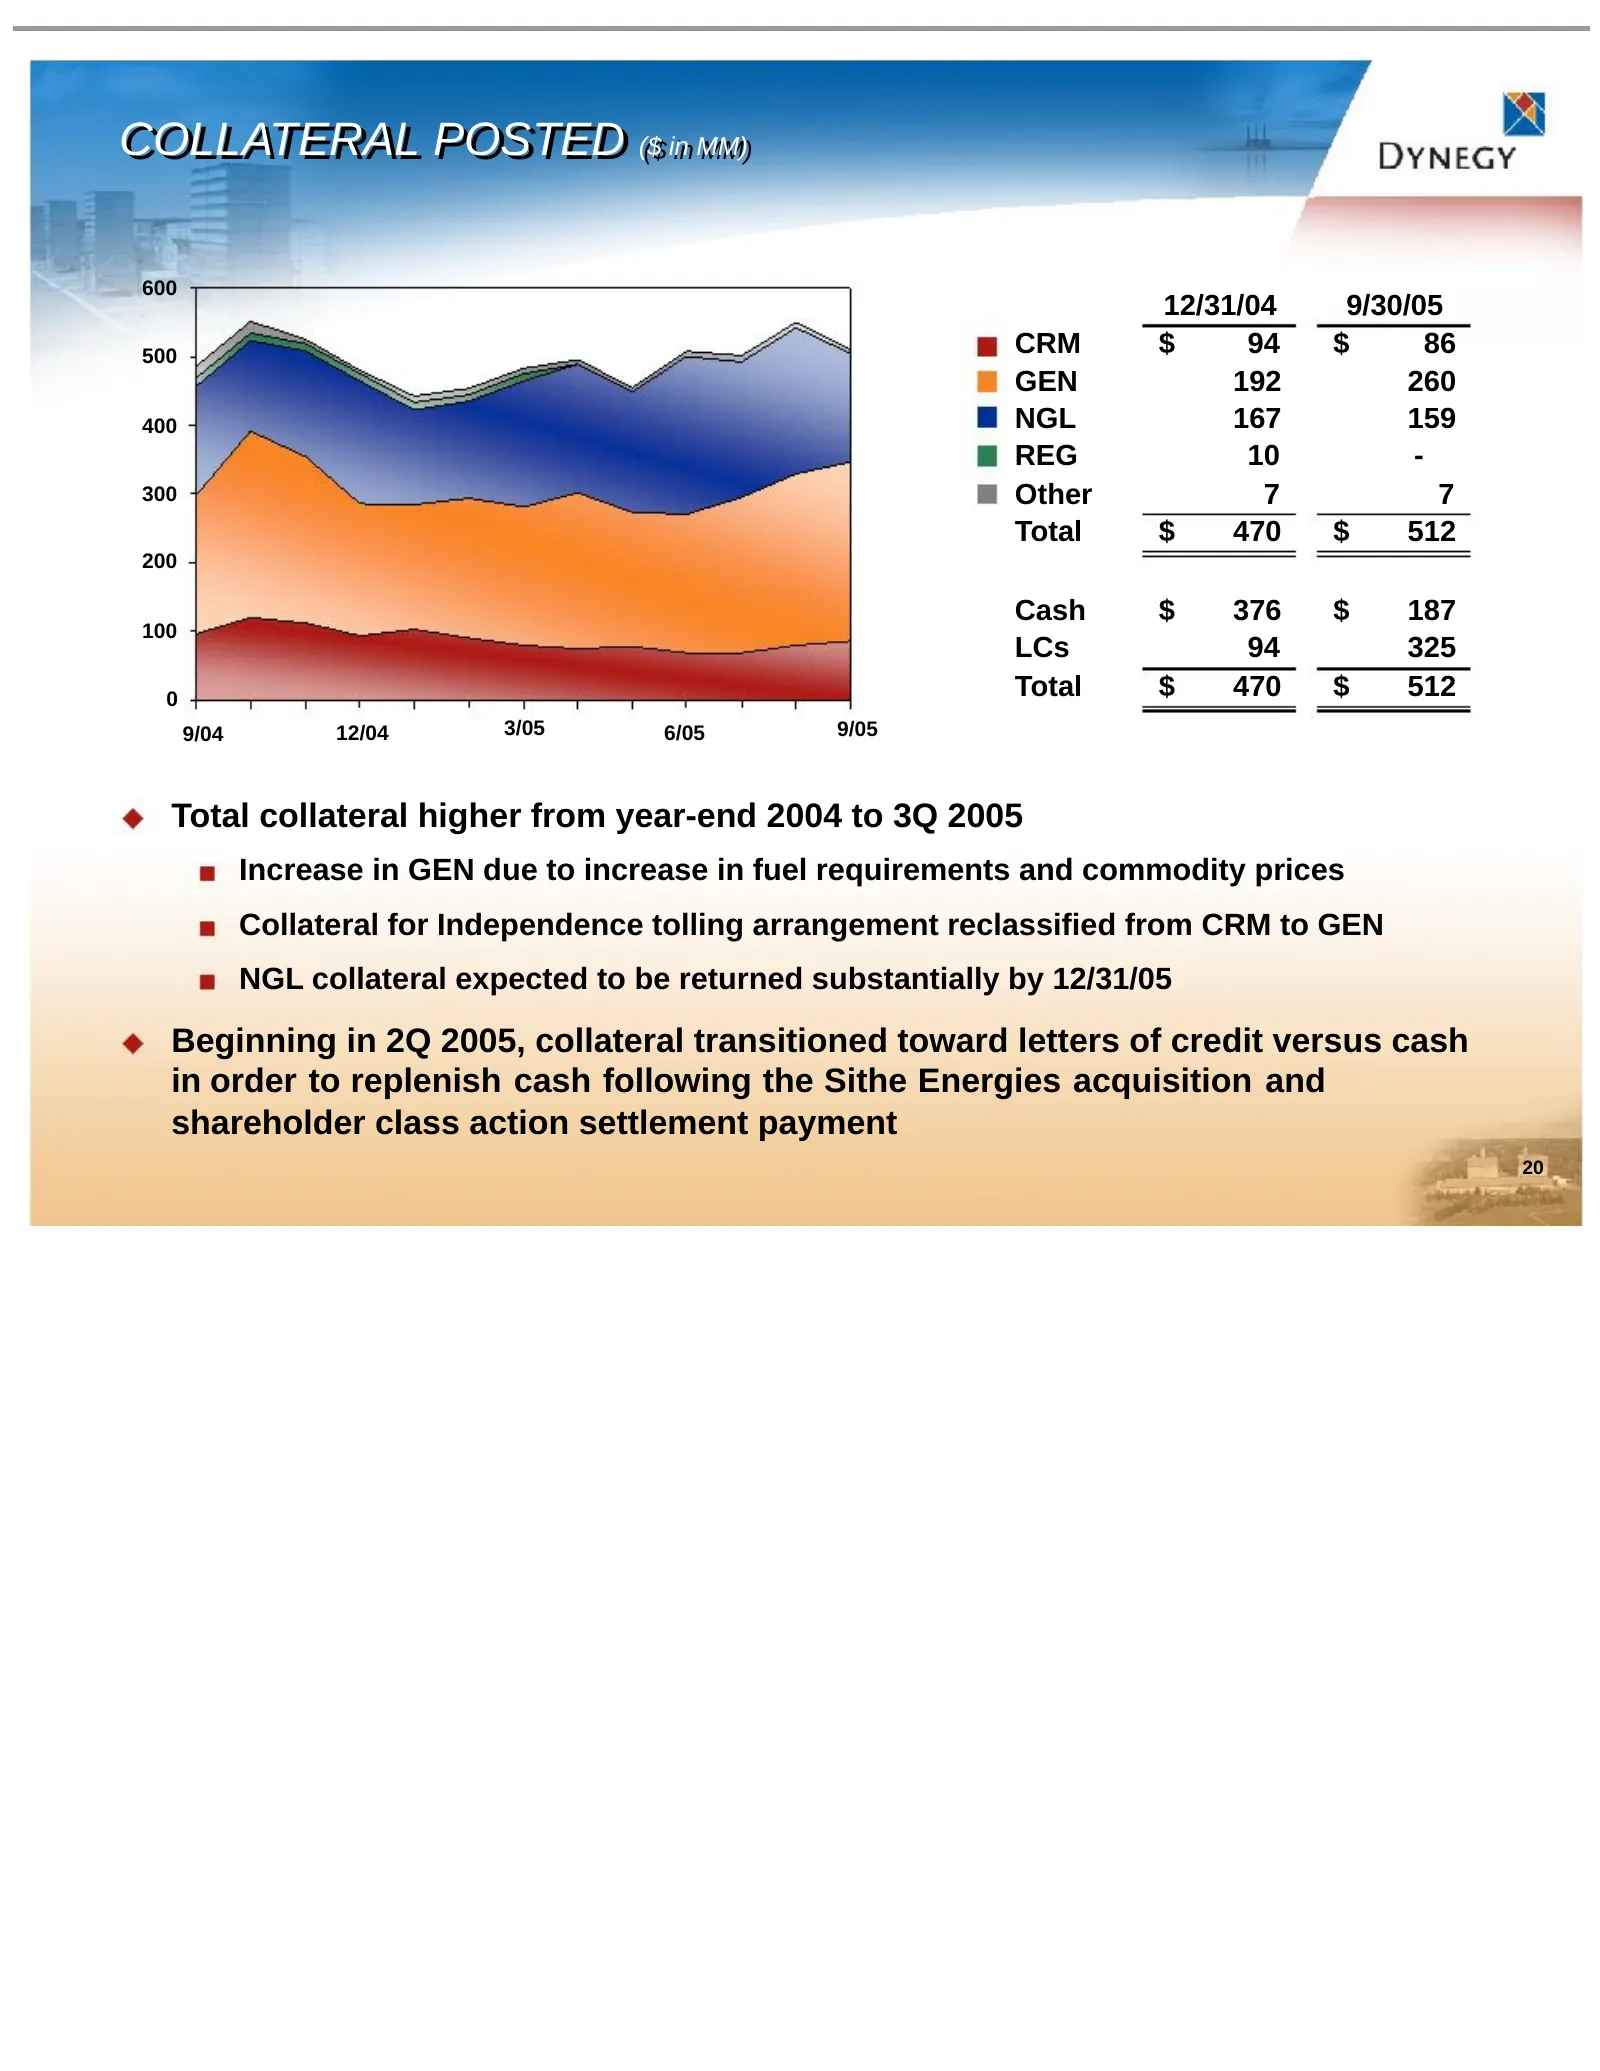
COLLATERAL COLLATERAL POSTED POSTED ($($ inin MM) MM) 600 12/31/04 9/30/05 500 CRM $ 94 $ 86 GEN 192 260 400 NGL 167 159 REG 10 - 300 Other 7 7 Total $ 470 $ 512 200 Cash $ 376 $ 187 100 LCs 94 325 0 Total $ 470 $ 512 9/04 12/04 3/05 6/05 9/05 Total collateral higher from year-end 2004 to 3Q 2005 In
Slide 21: Liquidity
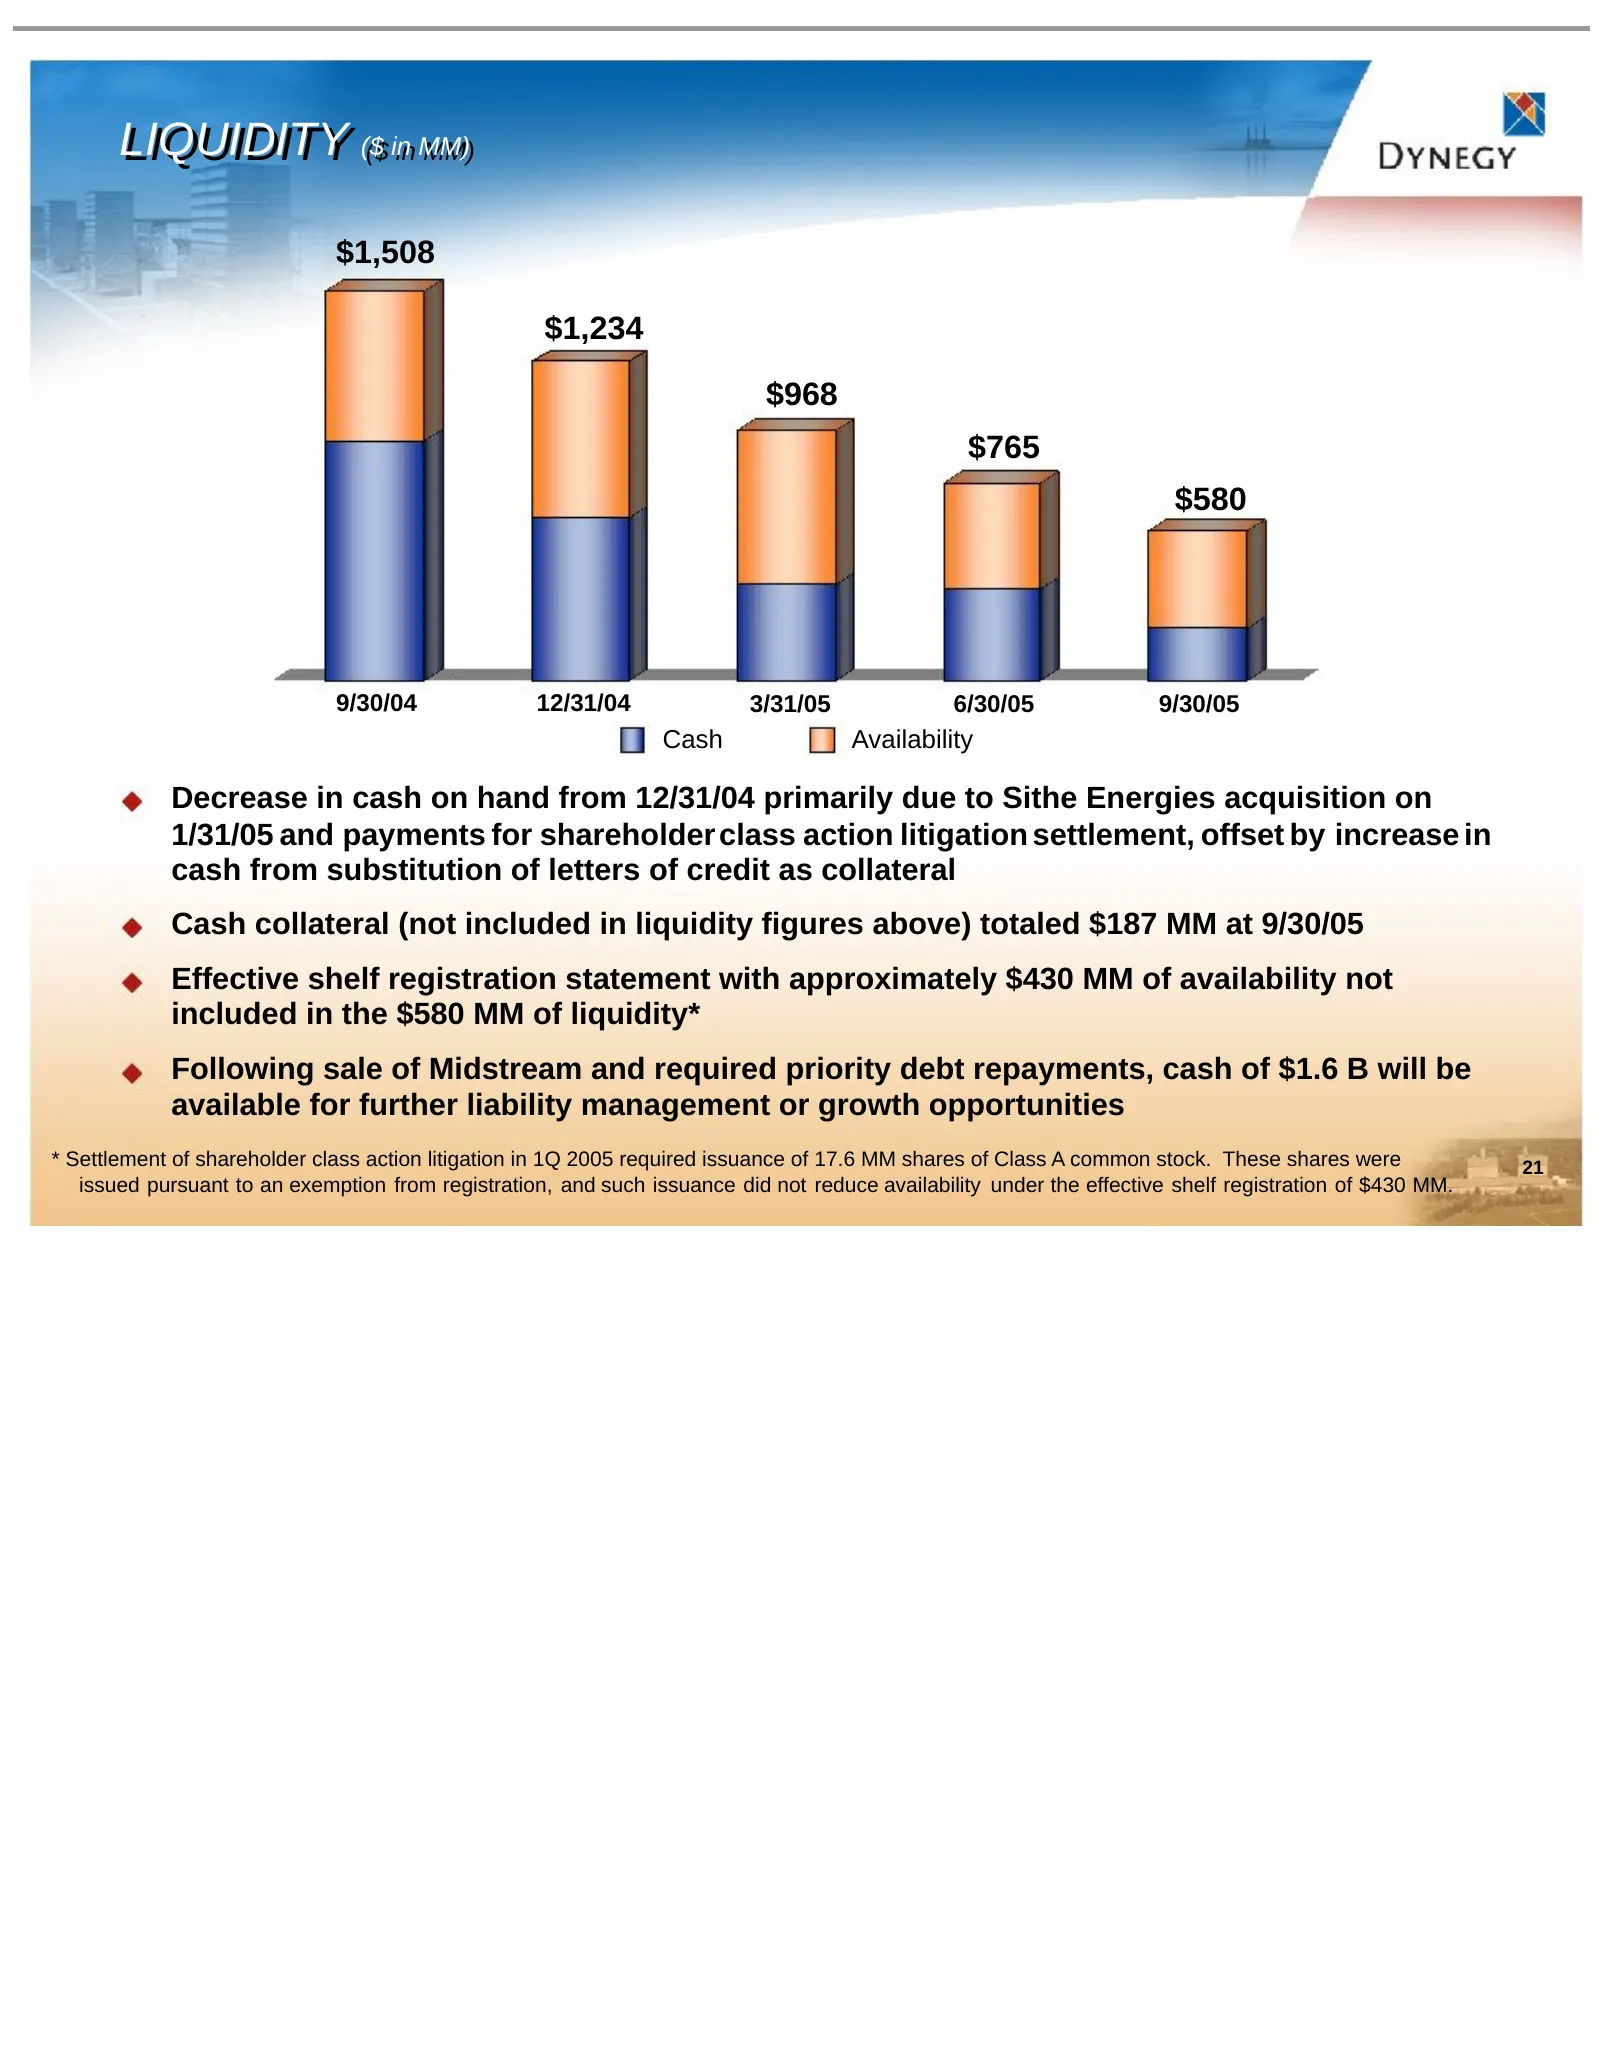
LIQUIDITY LIQUIDITY ($($ inin MM) MM) $1,508 $1,234 $968 $765 $580 9/30/04 12/31/04 3/31/05 6/30/05 9/30/05 Cash Availability Decrease in cash on hand from 12/31/04 primarily due to Sithe Energies acquisition on 1/31/05 and payments for shareholder class action litigation settlement, offset by incre
Slide 22: Reported Financial Performance
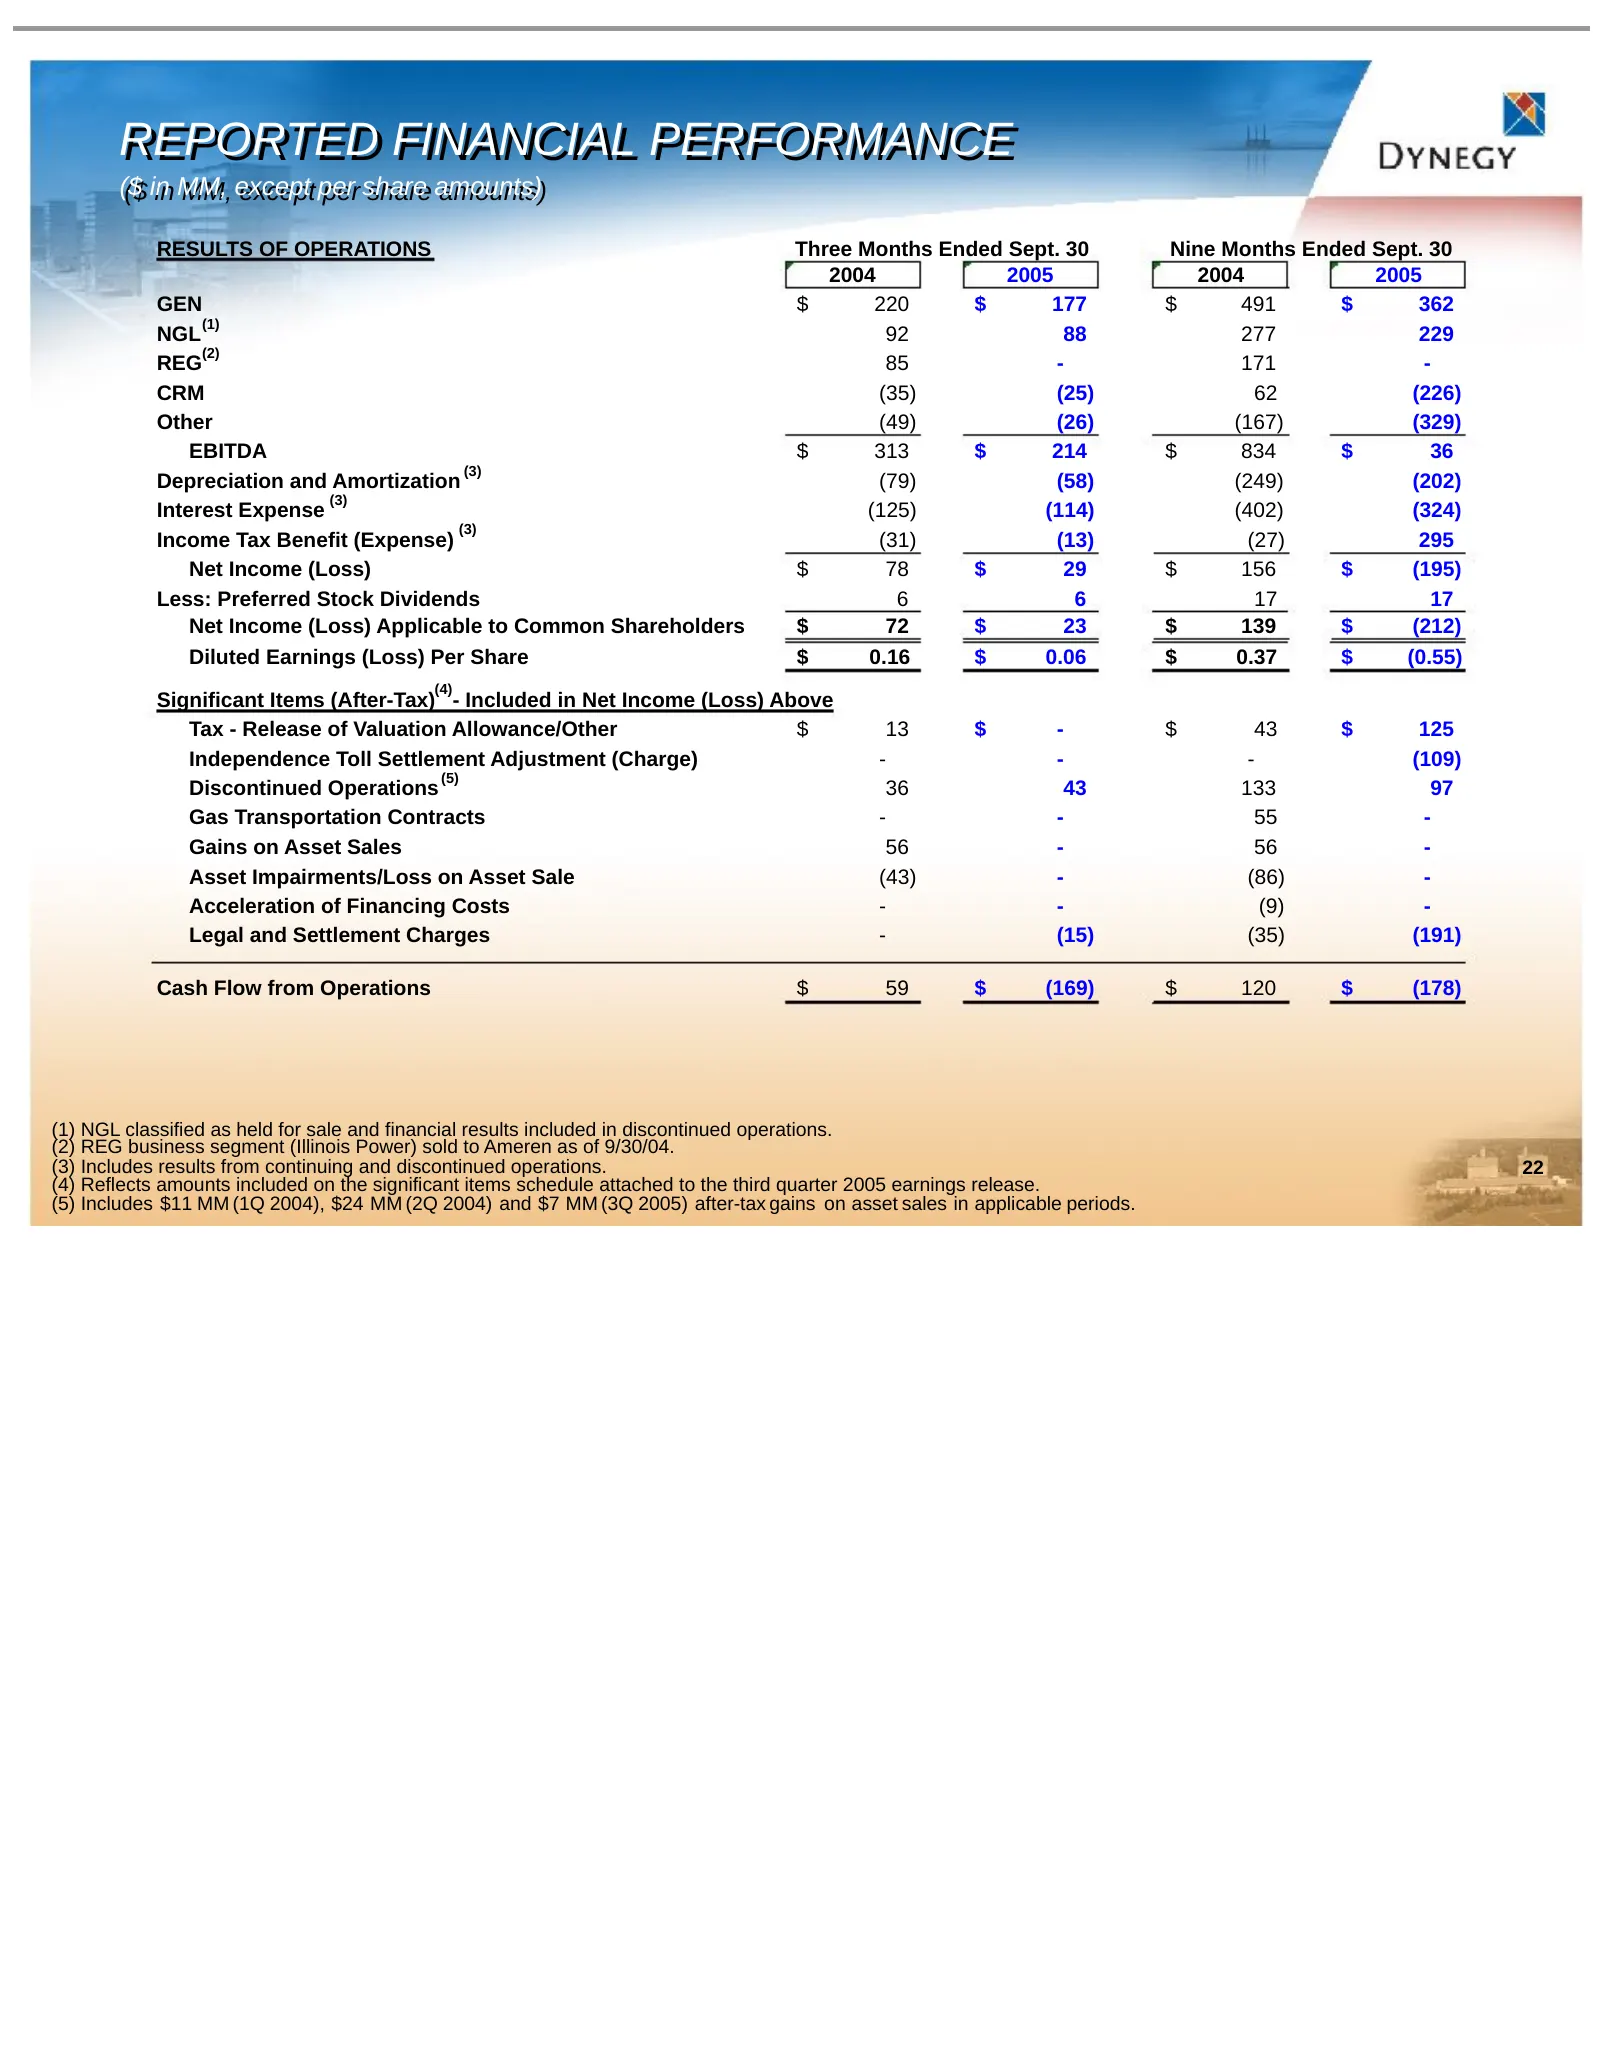
REPORTED REPORTED FINANCIAL FINANCIAL PERFORMANCE PERFORMANCE ($ ($ in in MM, MM, except except per per share share amounts) amounts) RESULTS OF OPERATIONS Three Months Ended Sept. 30 Nine Months Ended Sept. 30 2004 2005 2004 2005 GEN $ 220 $ 177 $ 491 $ 362 (1) NGL 92 88 277 229 (2) REG 85 - 171 -
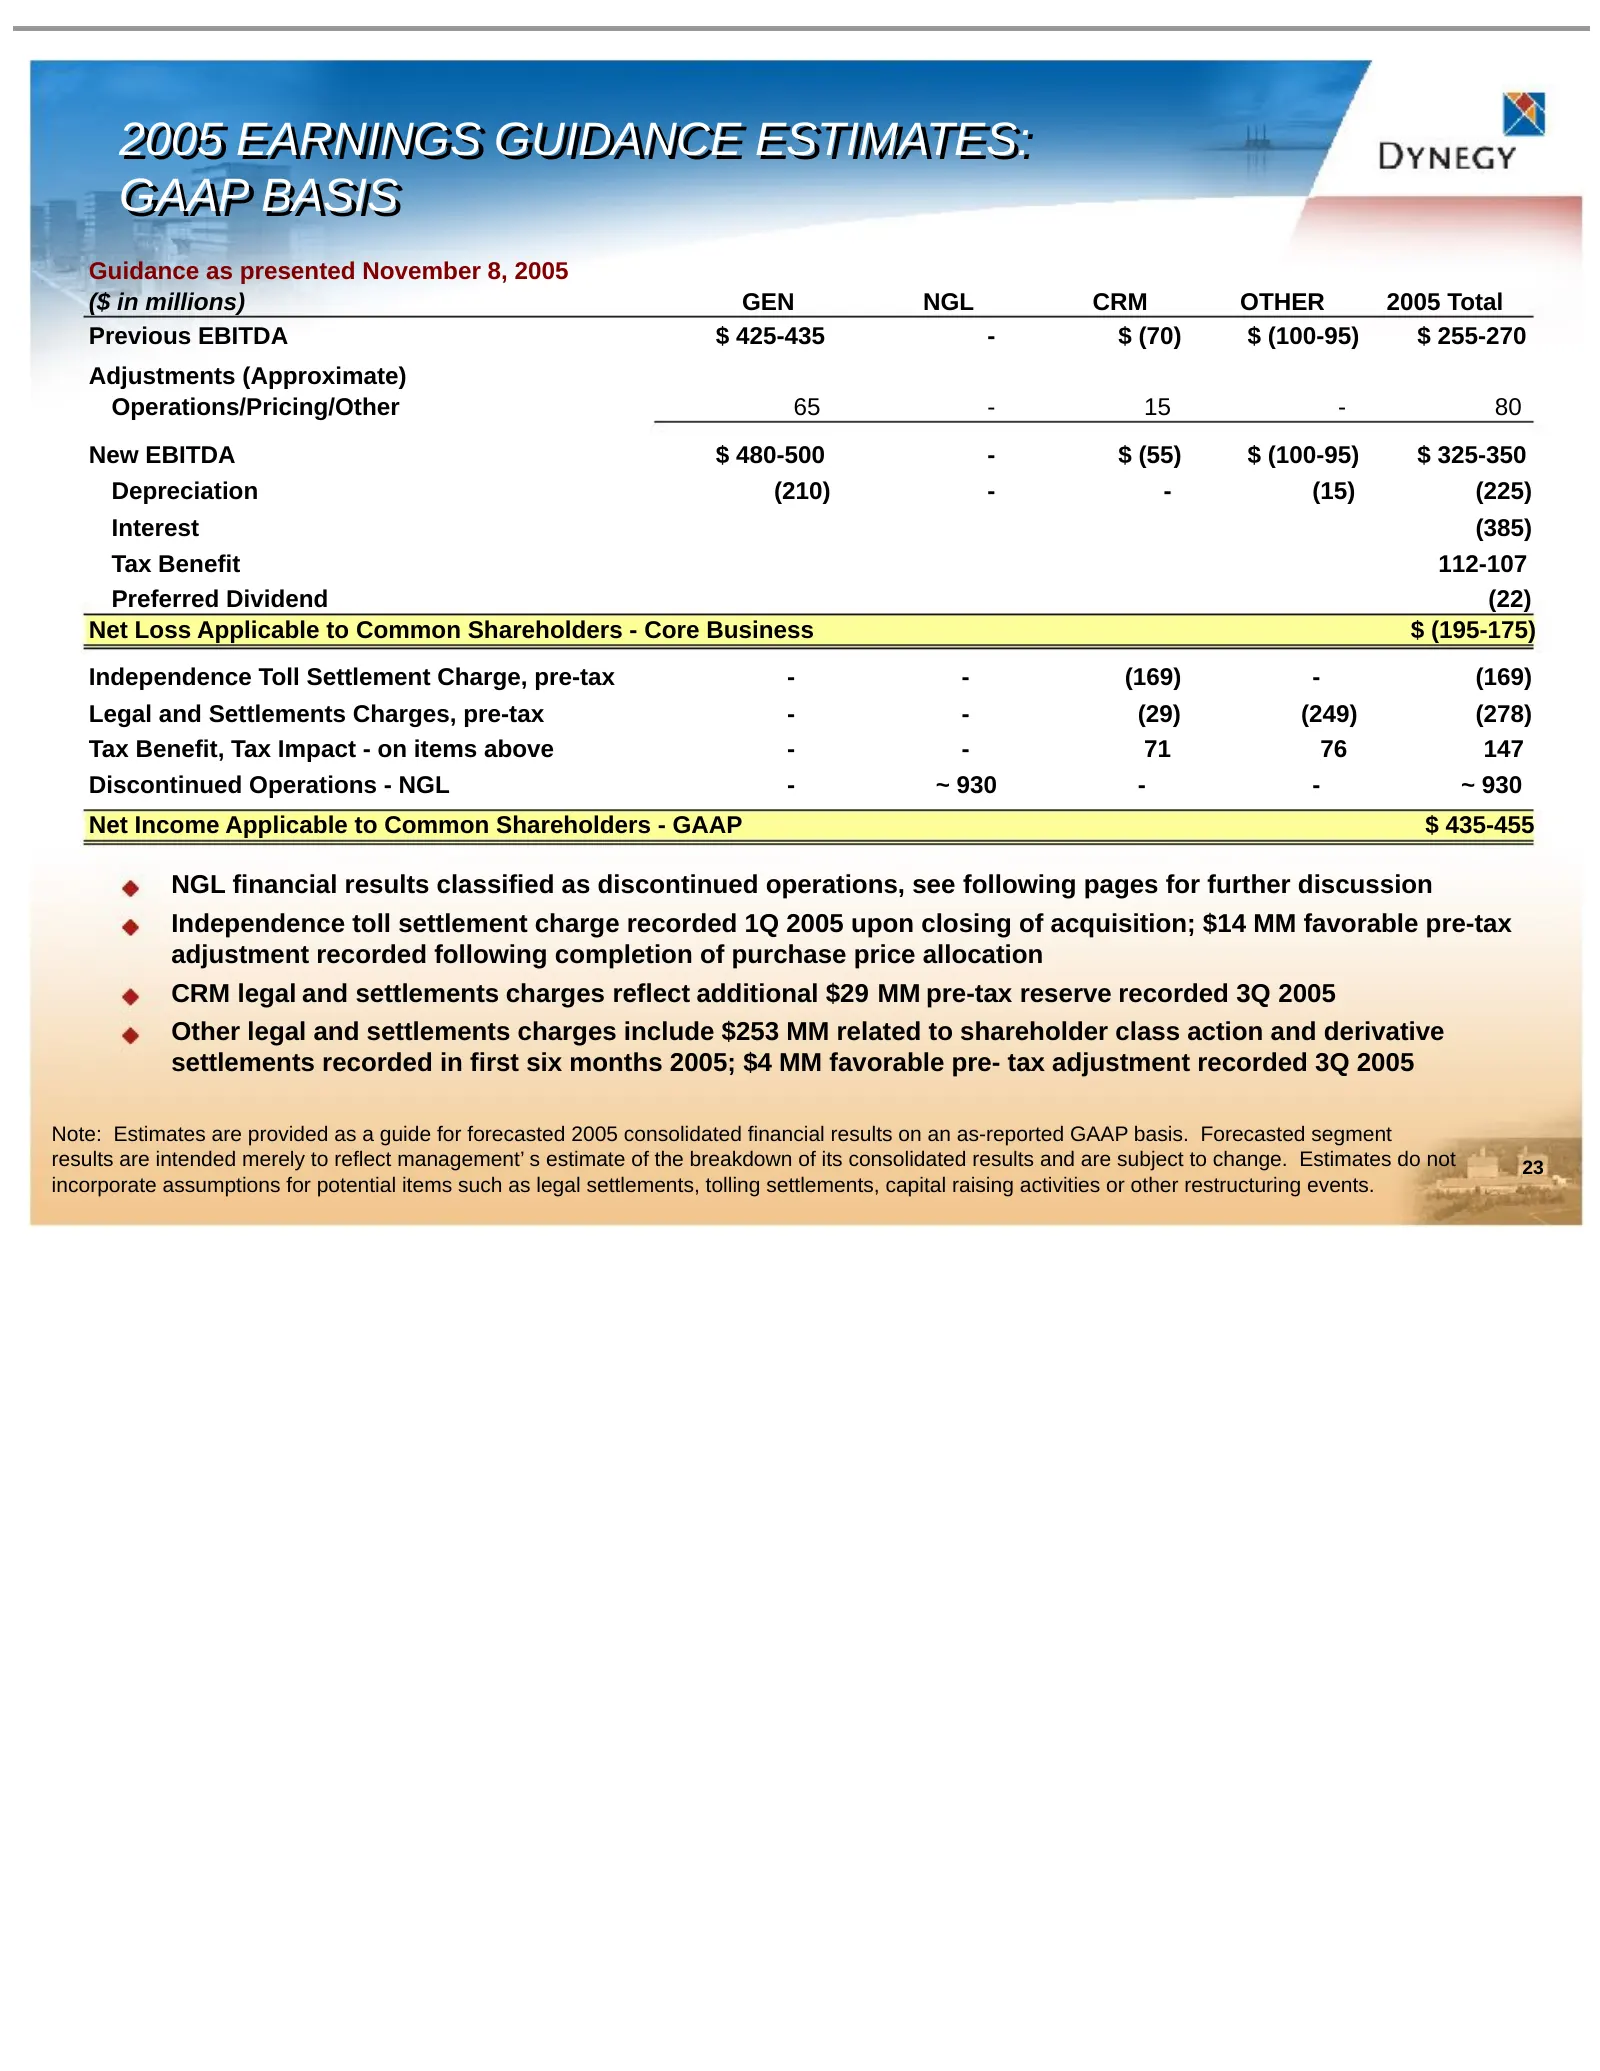
Slide 23: 2005 Earnings Guidance Estimates: GAAP Basis
2005 2005 EARNINGS EARNINGS GUIDANCE GUIDANCE ESTIMATES: ESTIMATES: GAAP GAAP BASIS BASIS Guidance as presented November 8, 2005 ($ in millions) GEN NGL CRM OTHER 2005 Total Previous EBITDA $ 425-435 - $ (70) $ (100-95) $ 255-270 Adjustments (Approximate) Operations/Pricing/Other 65 - 15 - 80 New EB
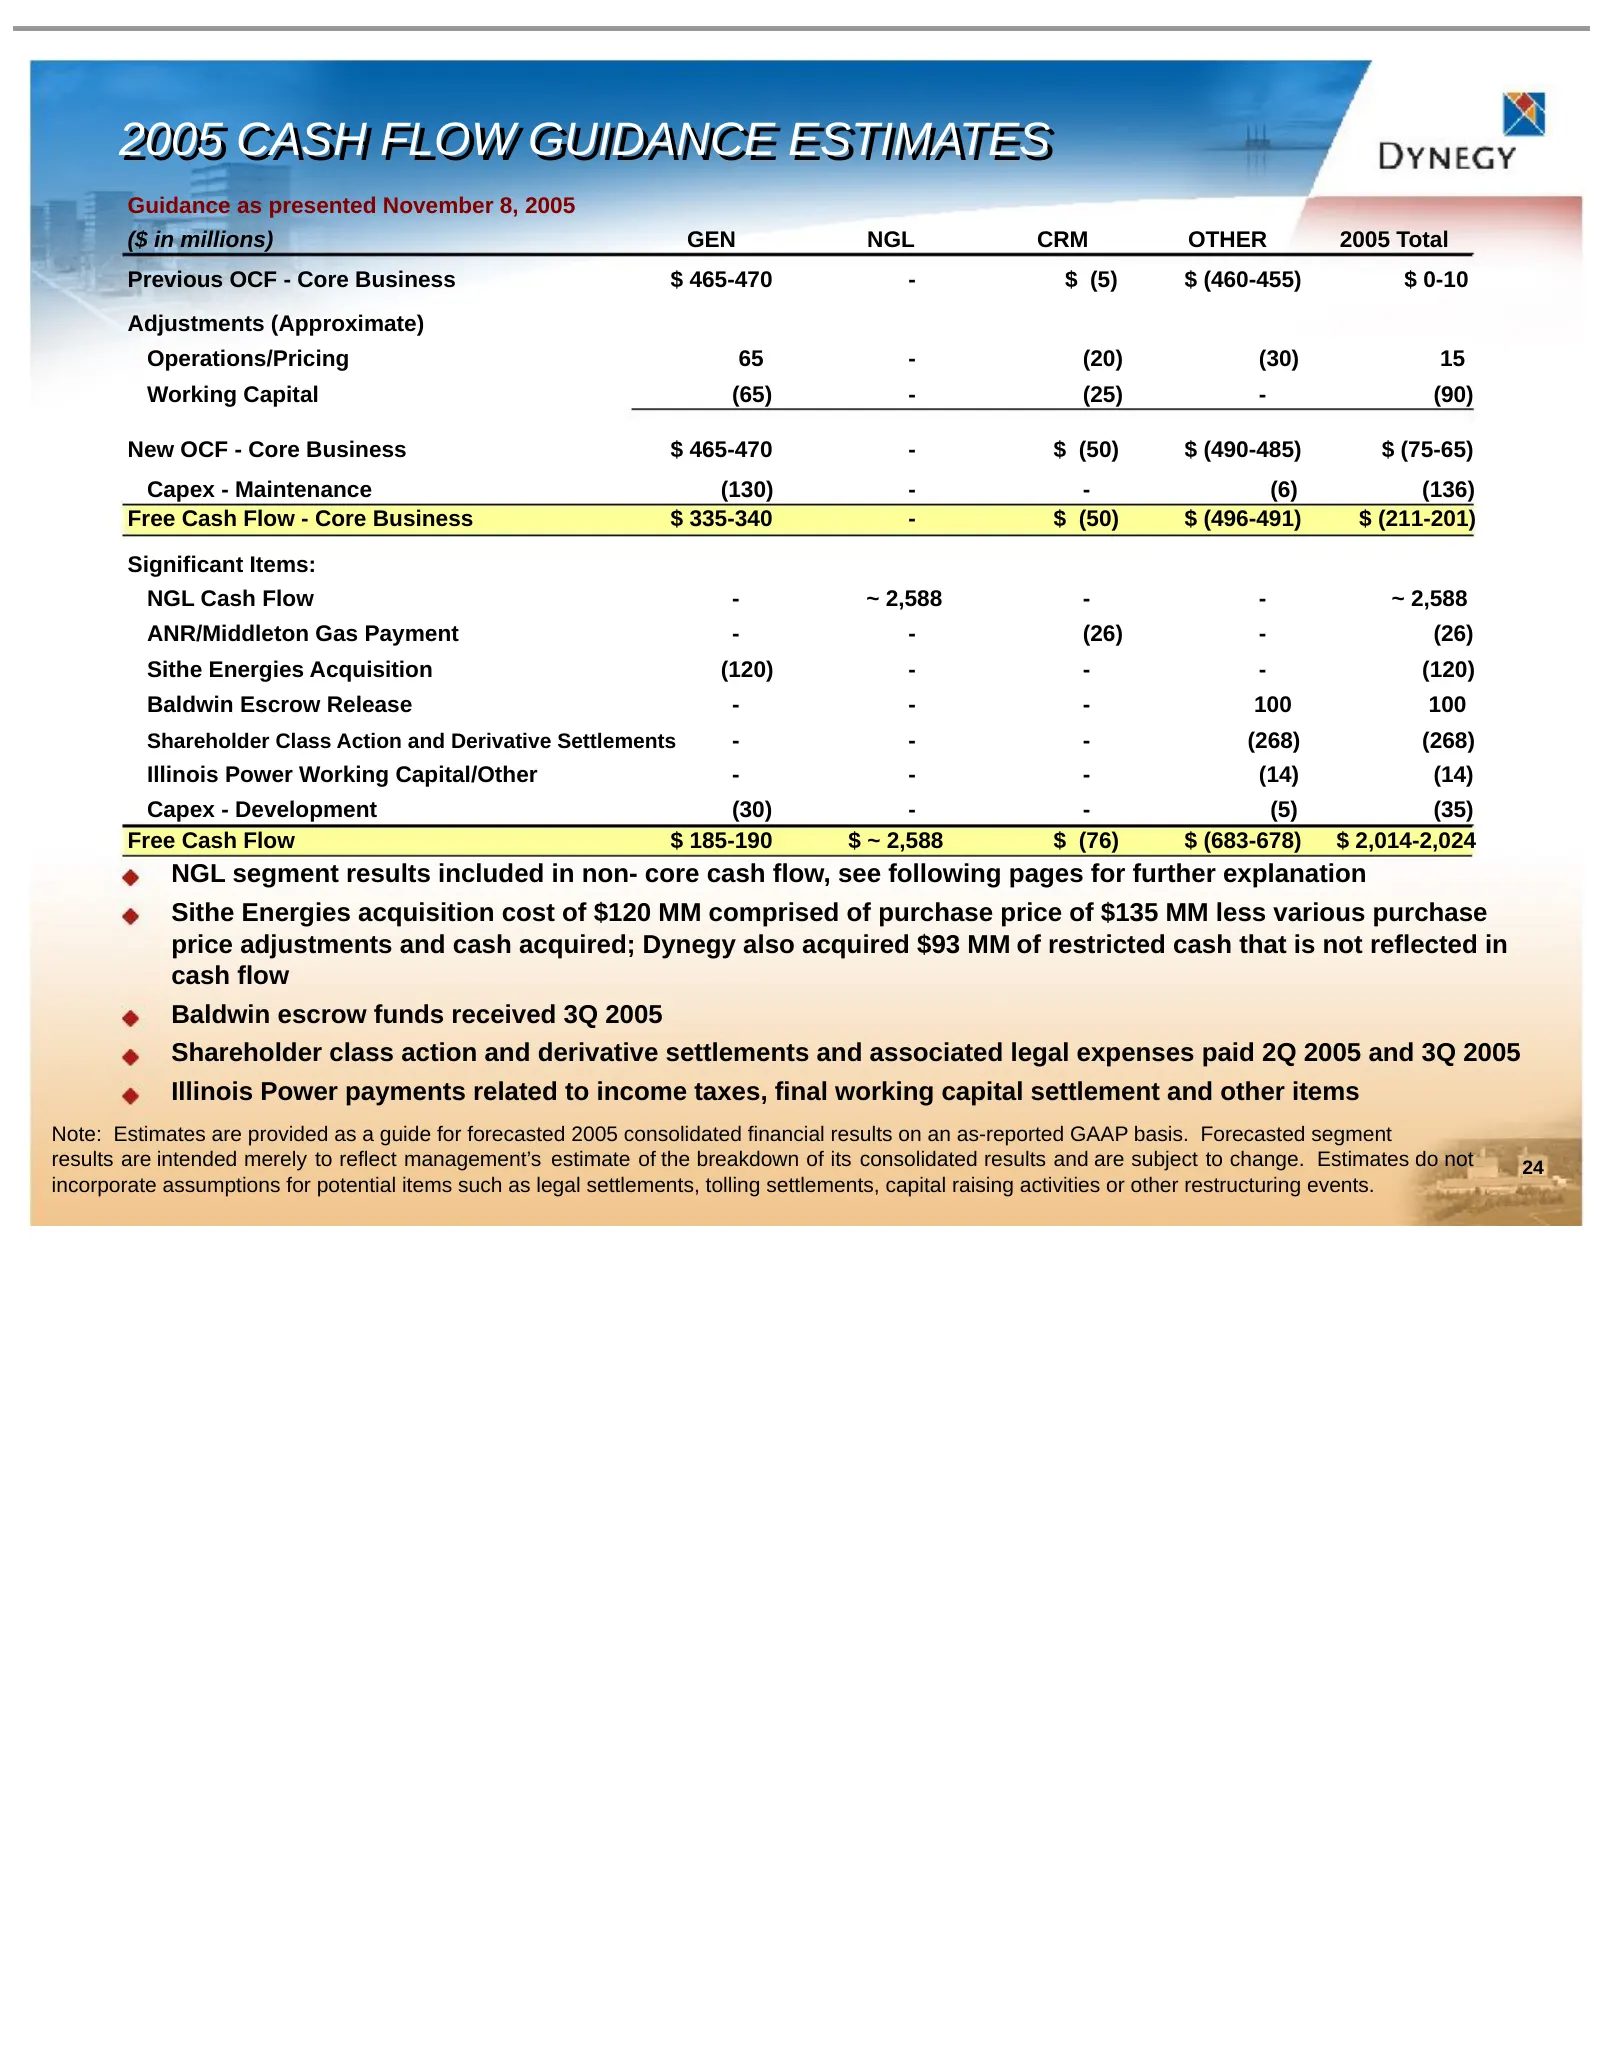
Slide 24: 2005 Cash Flow Guidance Estimates
2005 2005 CASH CASH FLOW FLOW GUIDANCE GUIDANCE ESTIMATES ESTIMATES Guidance as presented November 8, 2005 ($ in millions) GEN NGL CRM OTHER 2005 Total Previous OCF - Core Business $ 465-470 - $ (5) $ (460-455) $ 0-10 Adjustments (Approximate) Operations/Pricing 65 - (20) (30) 15 Working Capital (65
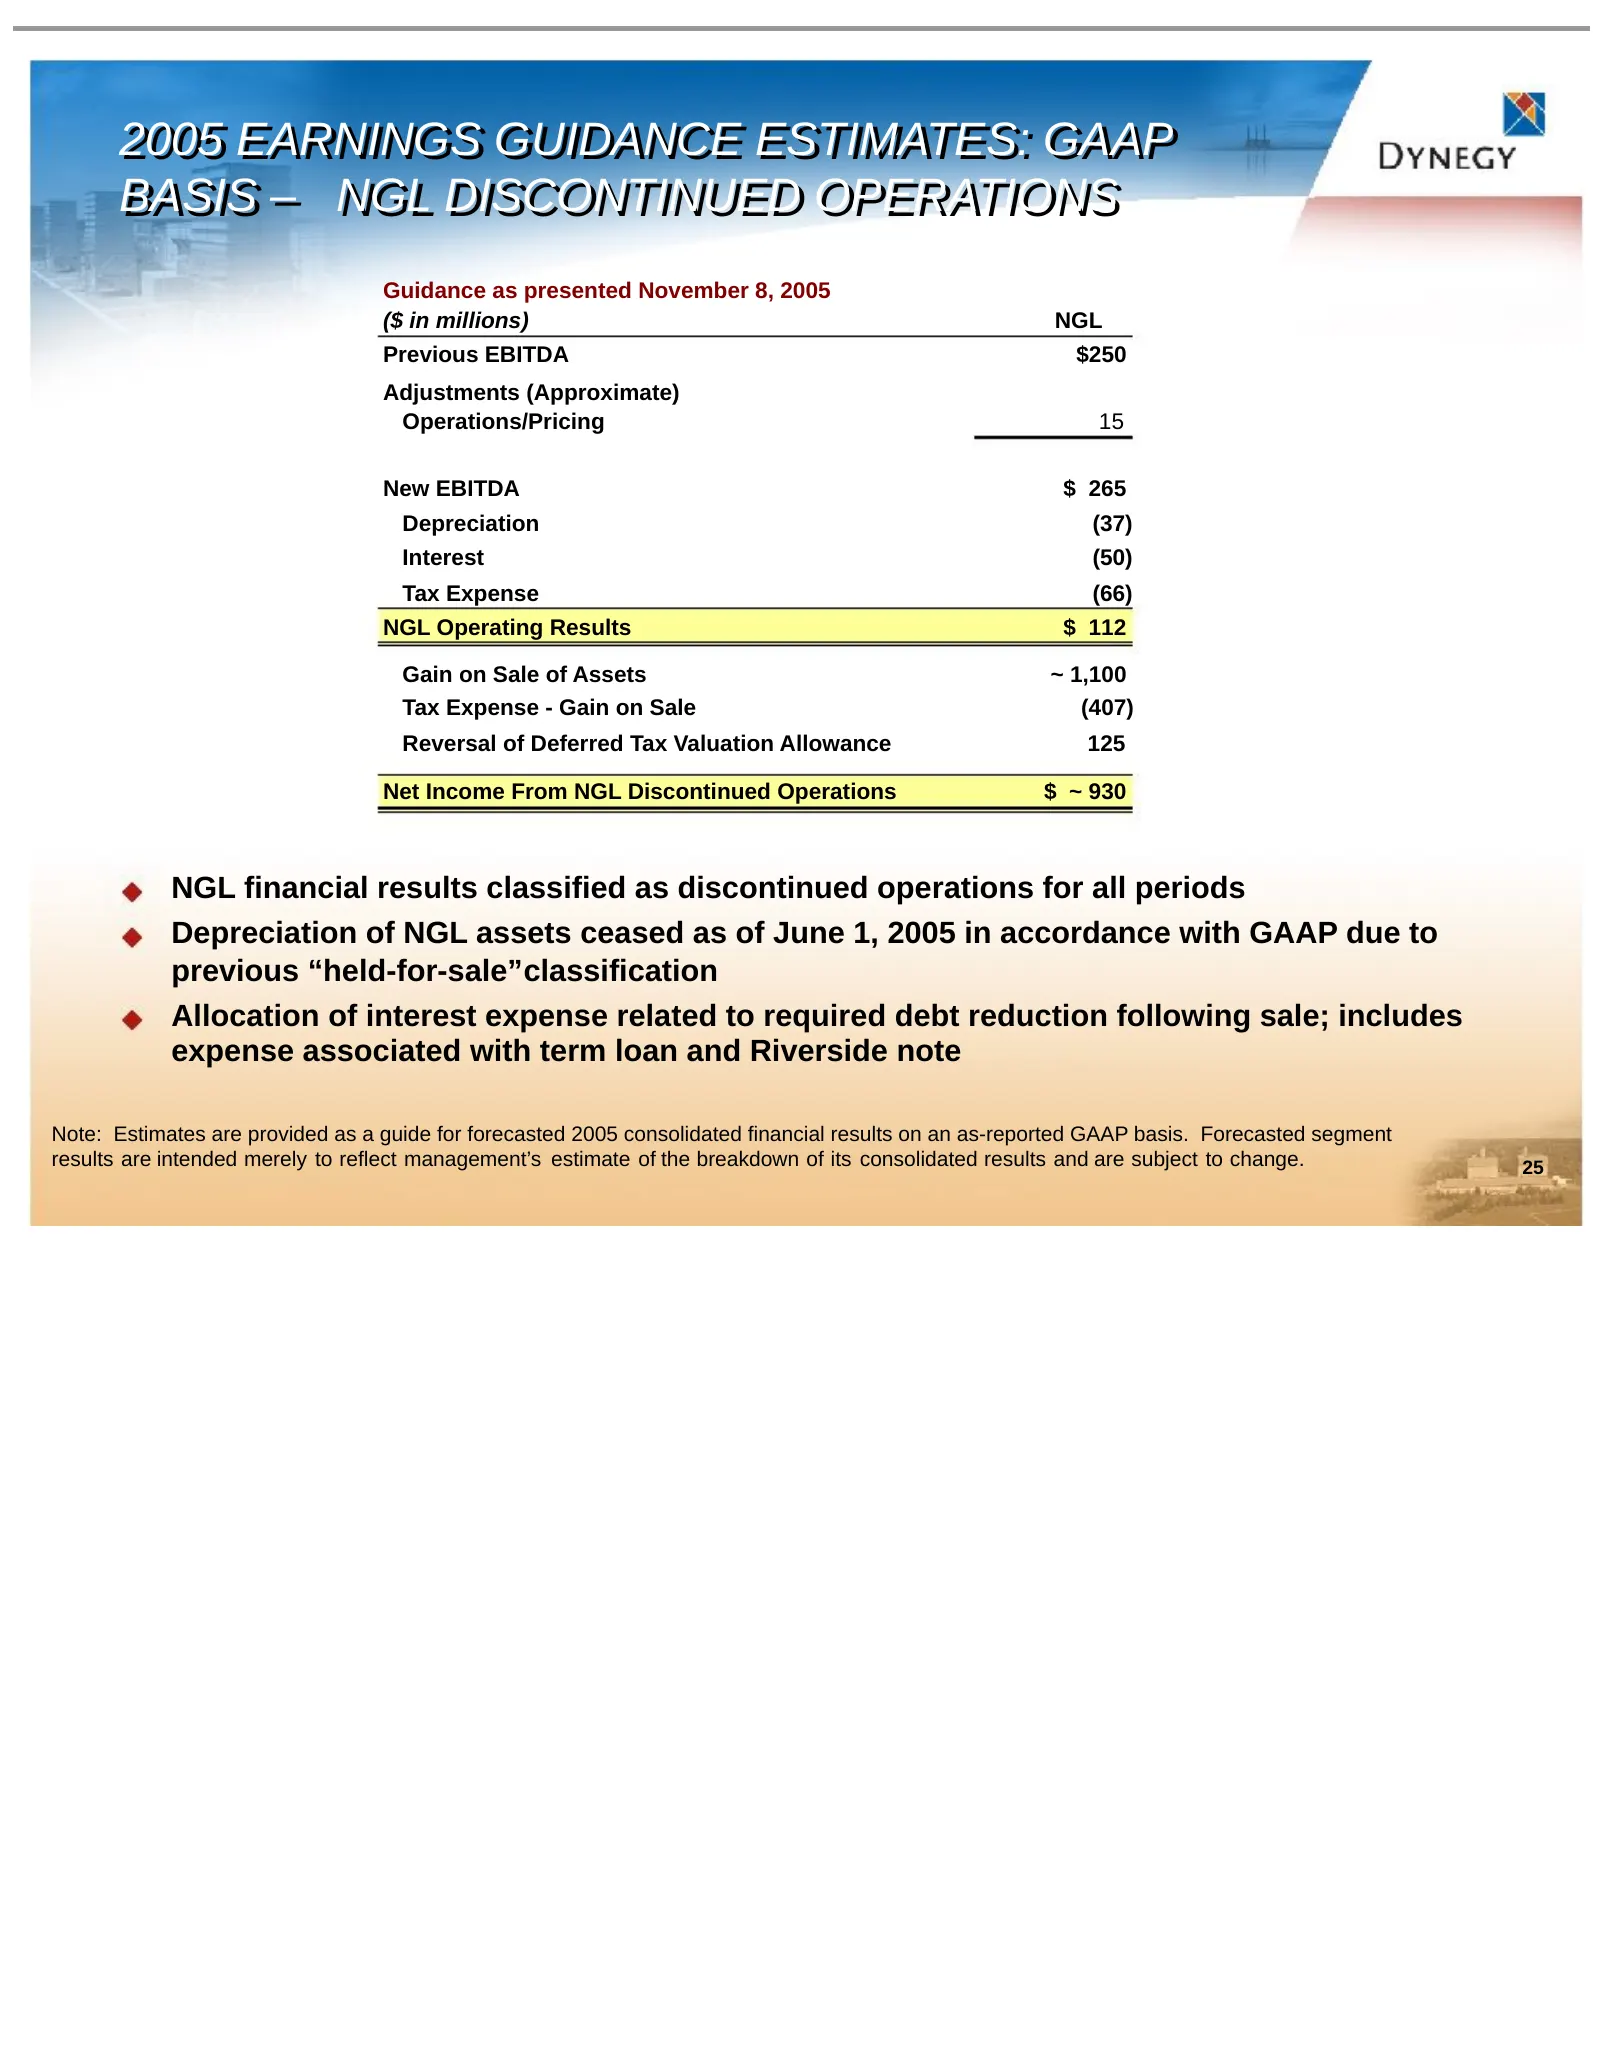
Slide 25: 2005 Earnings Guidance: NGL Discontinued Operations
2005 2005 EARNINGS EARNINGS GUIDANCE GUIDANCE ESTIMATES: ESTIMATES: GAAP GAAP BASIS BASIS –– NGL NGL DISCONTINUED DISCONTINUED OPERATIONS OPERATIONS Guidance as presented November 8, 2005 ($ in millions) NGL Previous EBITDA $250 Adjustments (Approximate) Operations/Pricing 15 New EBITDA $ 265 Deprec
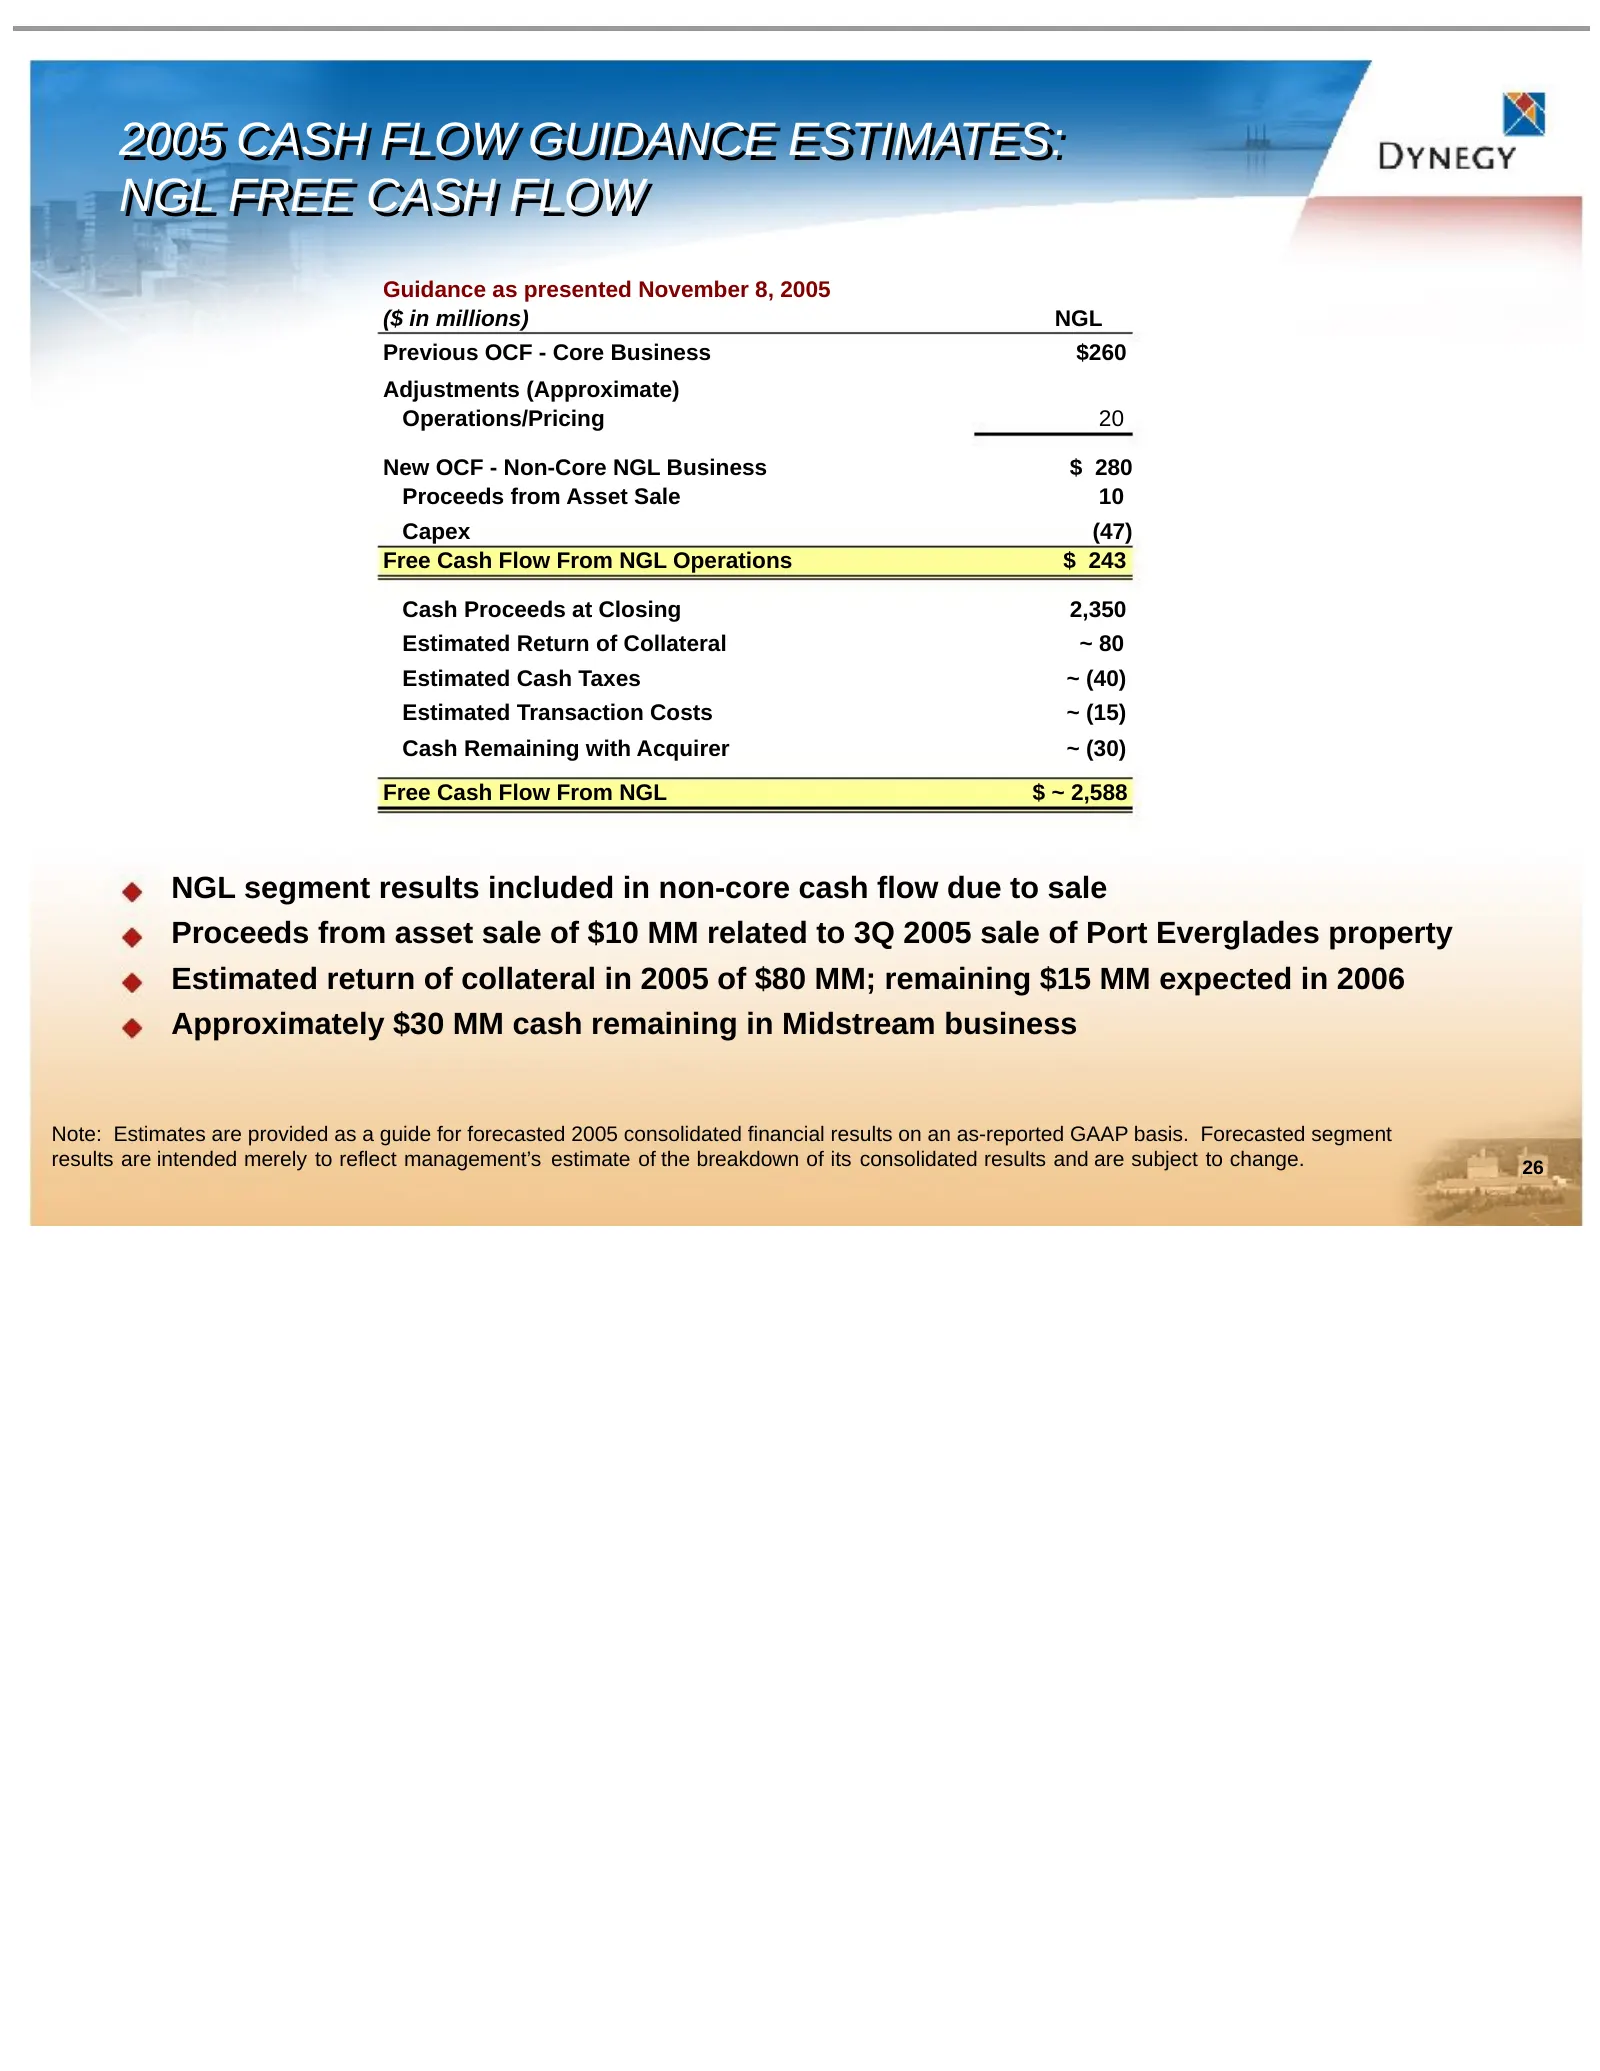
Slide 26: 2005 Cash Flow Guidance: NGL Free Cash Flow
2005 2005 CASH CASH FLOW FLOW GUIDANCE GUIDANCE ESTIMATES: ESTIMATES: NGL NGL FREE FREE CASH CASH FLOW FLOW Guidance as presented November 8, 2005 ($ in millions) NGL Previous OCF - Core Business $260 Adjustments (Approximate) Operations/Pricing 20 New OCF - Non-Core NGL Business $ 280 Proceeds from
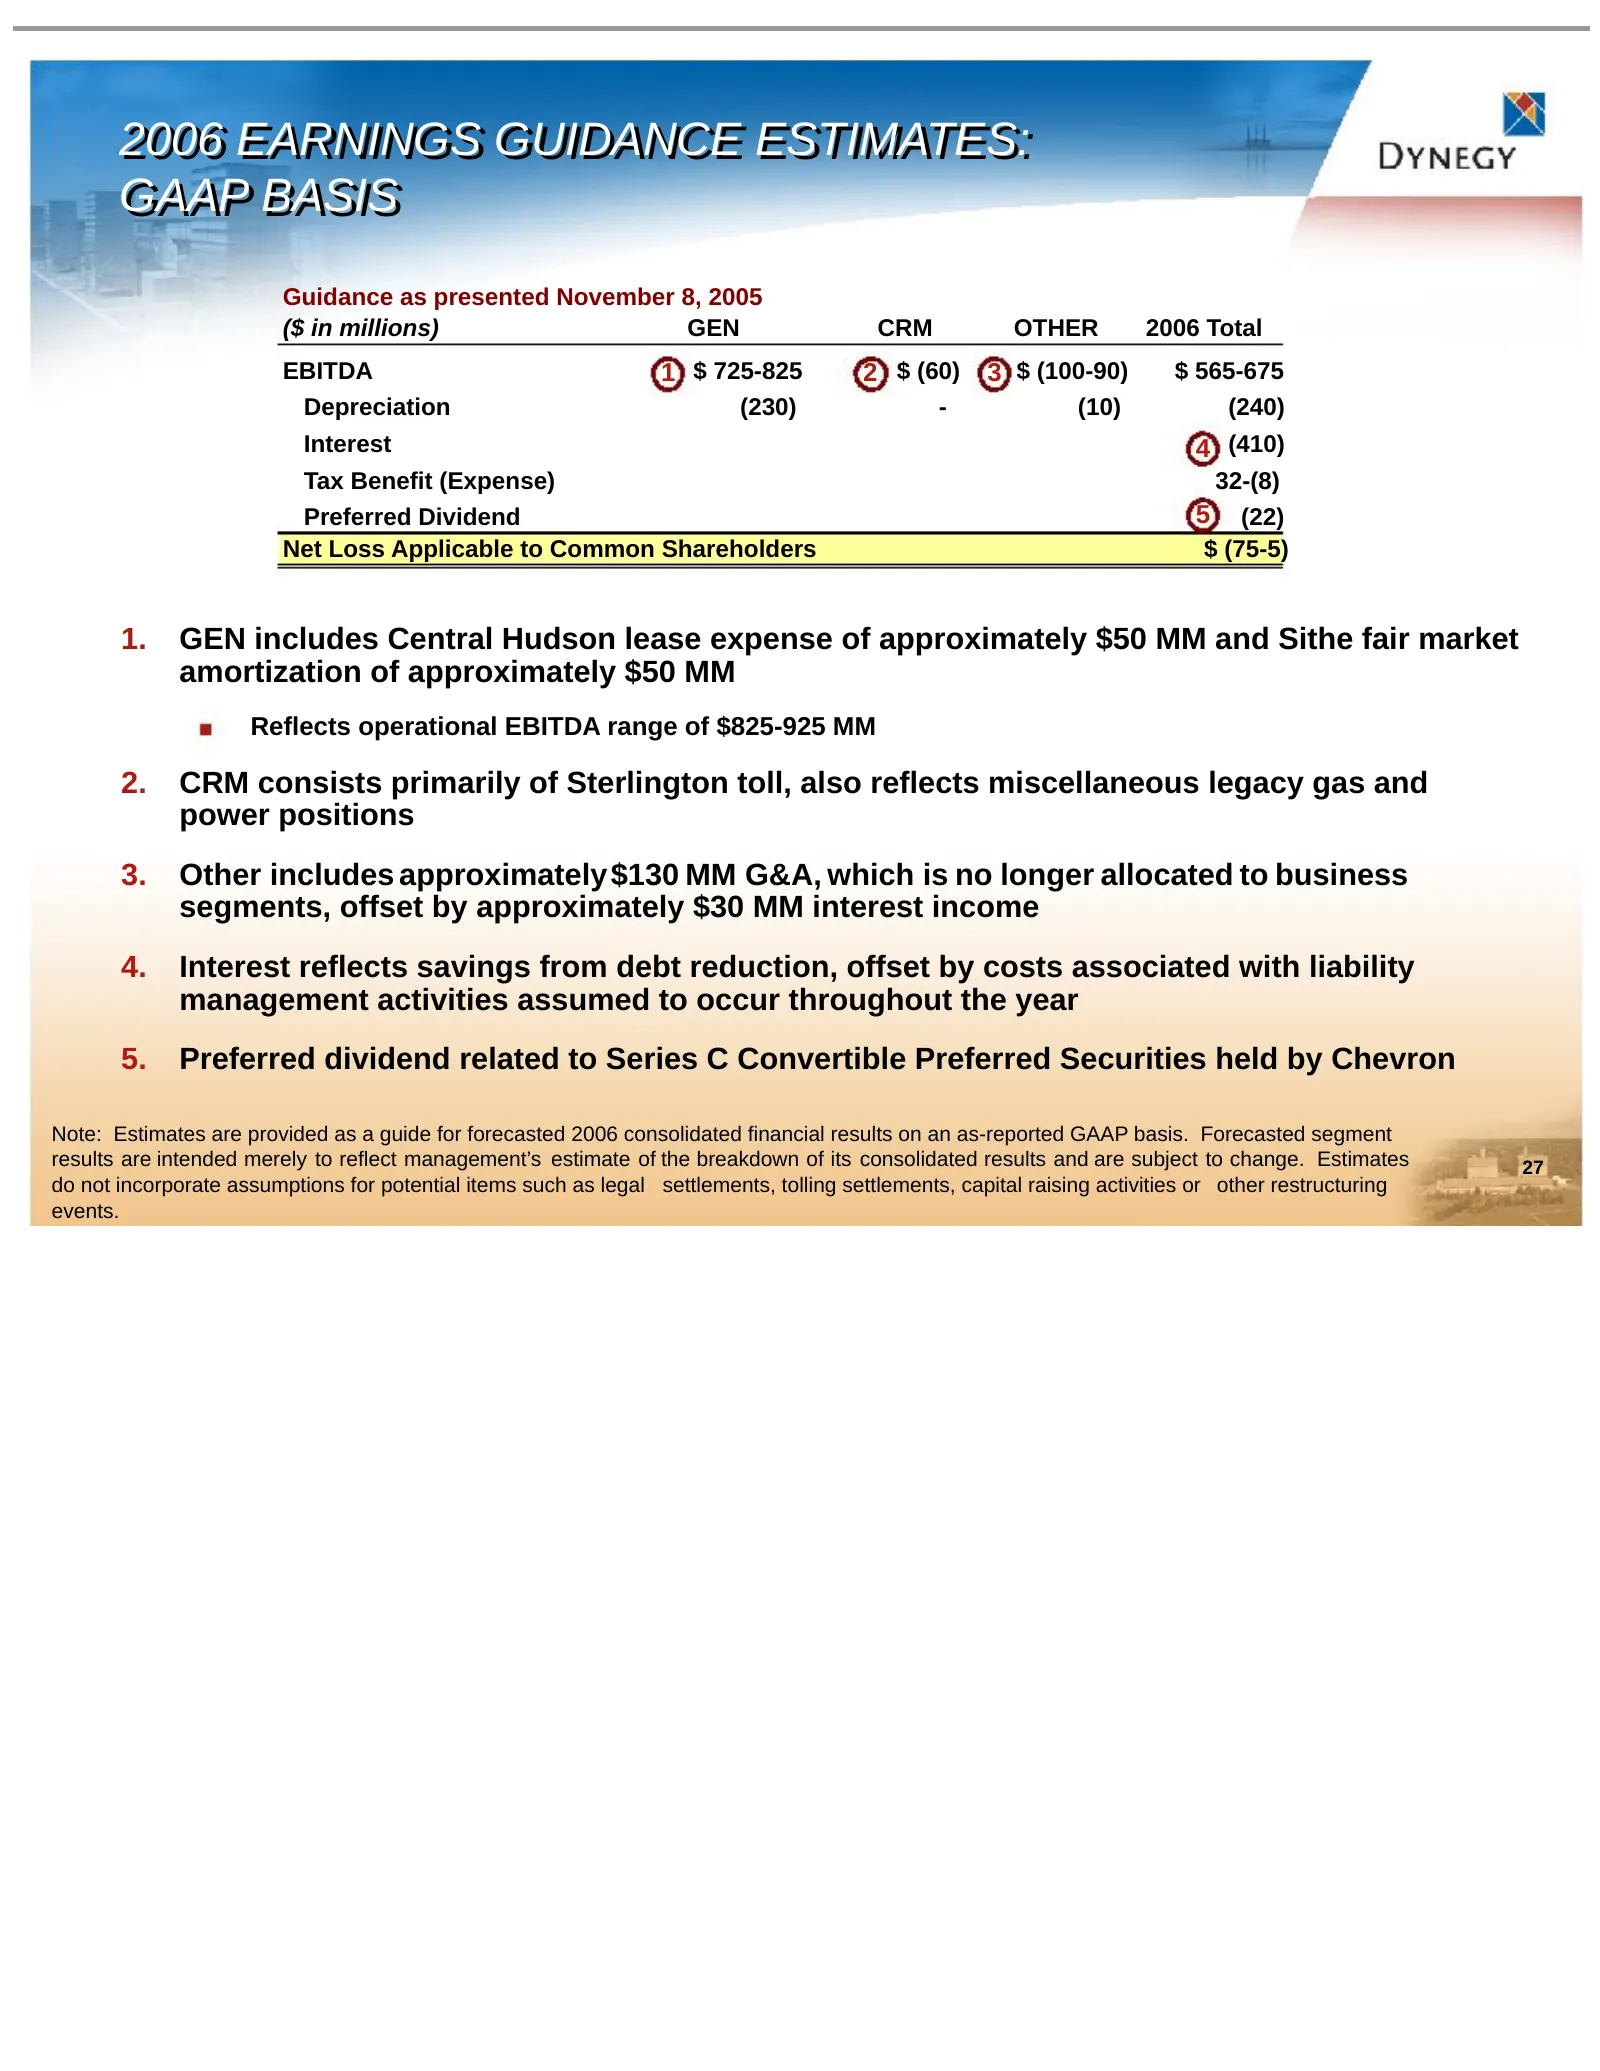
Slide 27: 2006 Earnings Guidance Estimates: GAAP Basis
2006 2006 EARNINGS EARNINGS GUIDANCE GUIDANCE ESTIMATES: ESTIMATES: GAAP GAAP BASIS BASIS Guidance as presented November 8, 2005 ($ in millions) GEN CRM OTHER 2006 Total EBITDA 1 $ 725-825 2 $ (60) 3 $ (100-90) $ 565-675 Depreciation (230) - (10) (240) Interest 4 (410) Tax Benefit (Expense) 32-(8) P
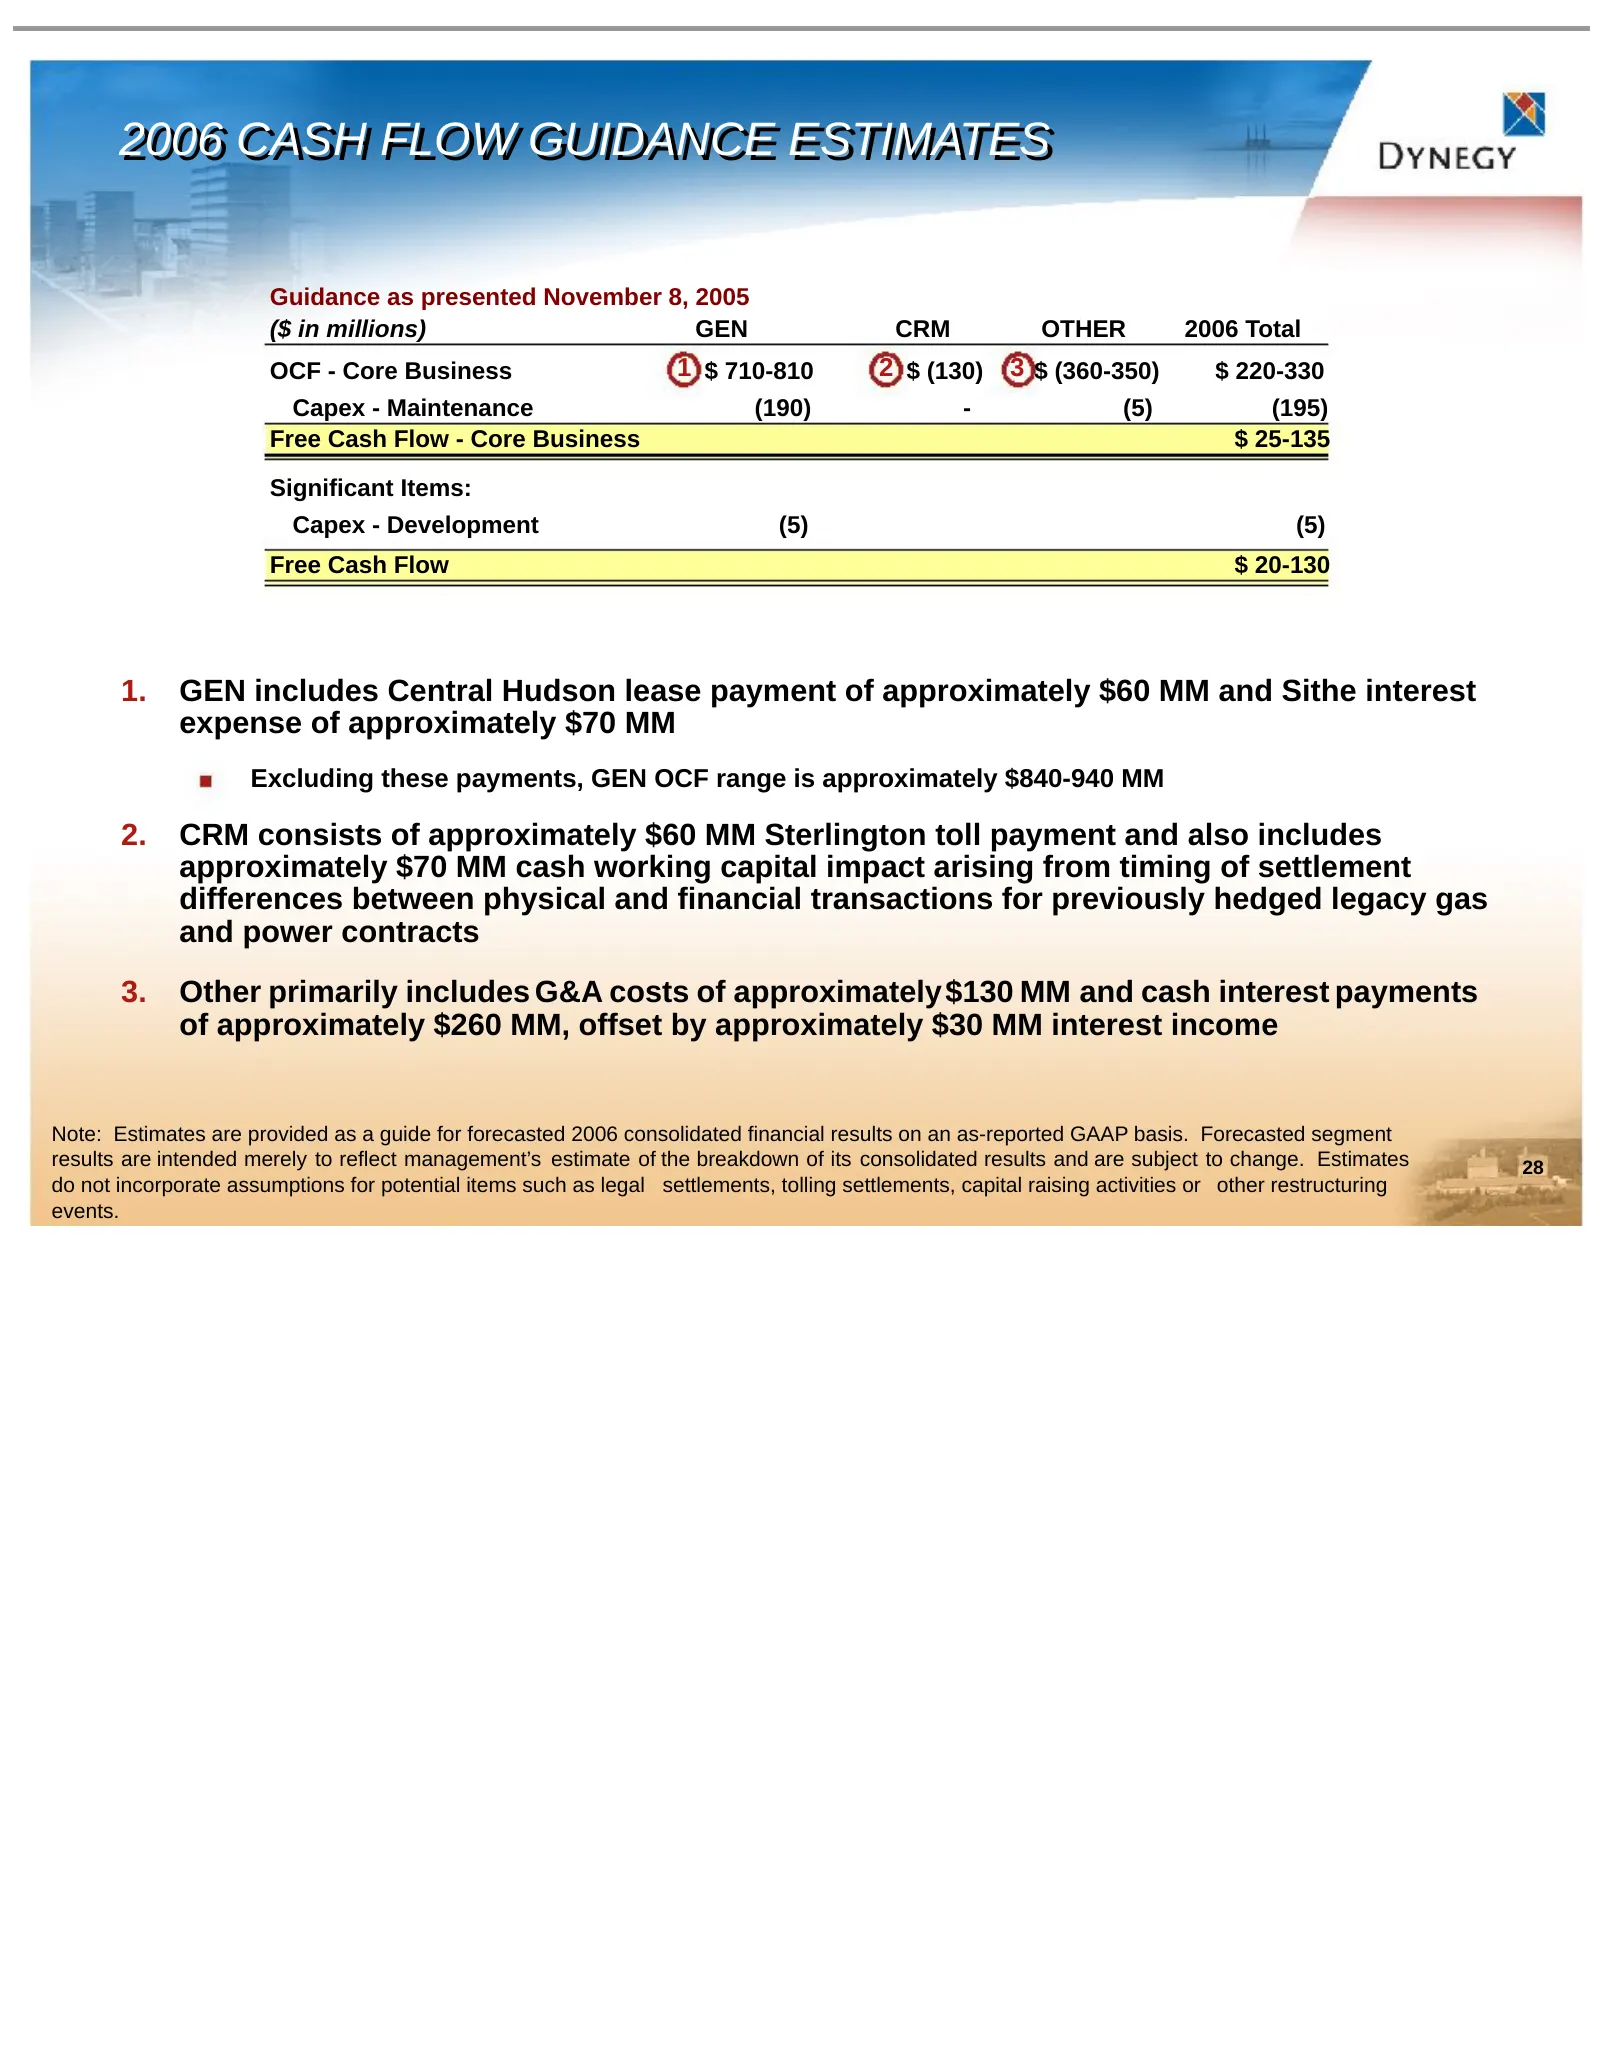
Slide 28: 2006 Cash Flow Guidance Estimates
2006 2006 CASH CASH FLOW FLOW GUIDANCE GUIDANCE ESTIMATES ESTIMATES Guidance as presented November 8, 2005 ($ in millions) GEN CRM OTHER 2006 Total OCF - Core Business 1 $ 710-810 2 $ (130) 3 $ (360-350) $ 220-330 Capex - Maintenance (190) - (5) (195) Free Cash Flow - Core Business $ 25-135 Signific
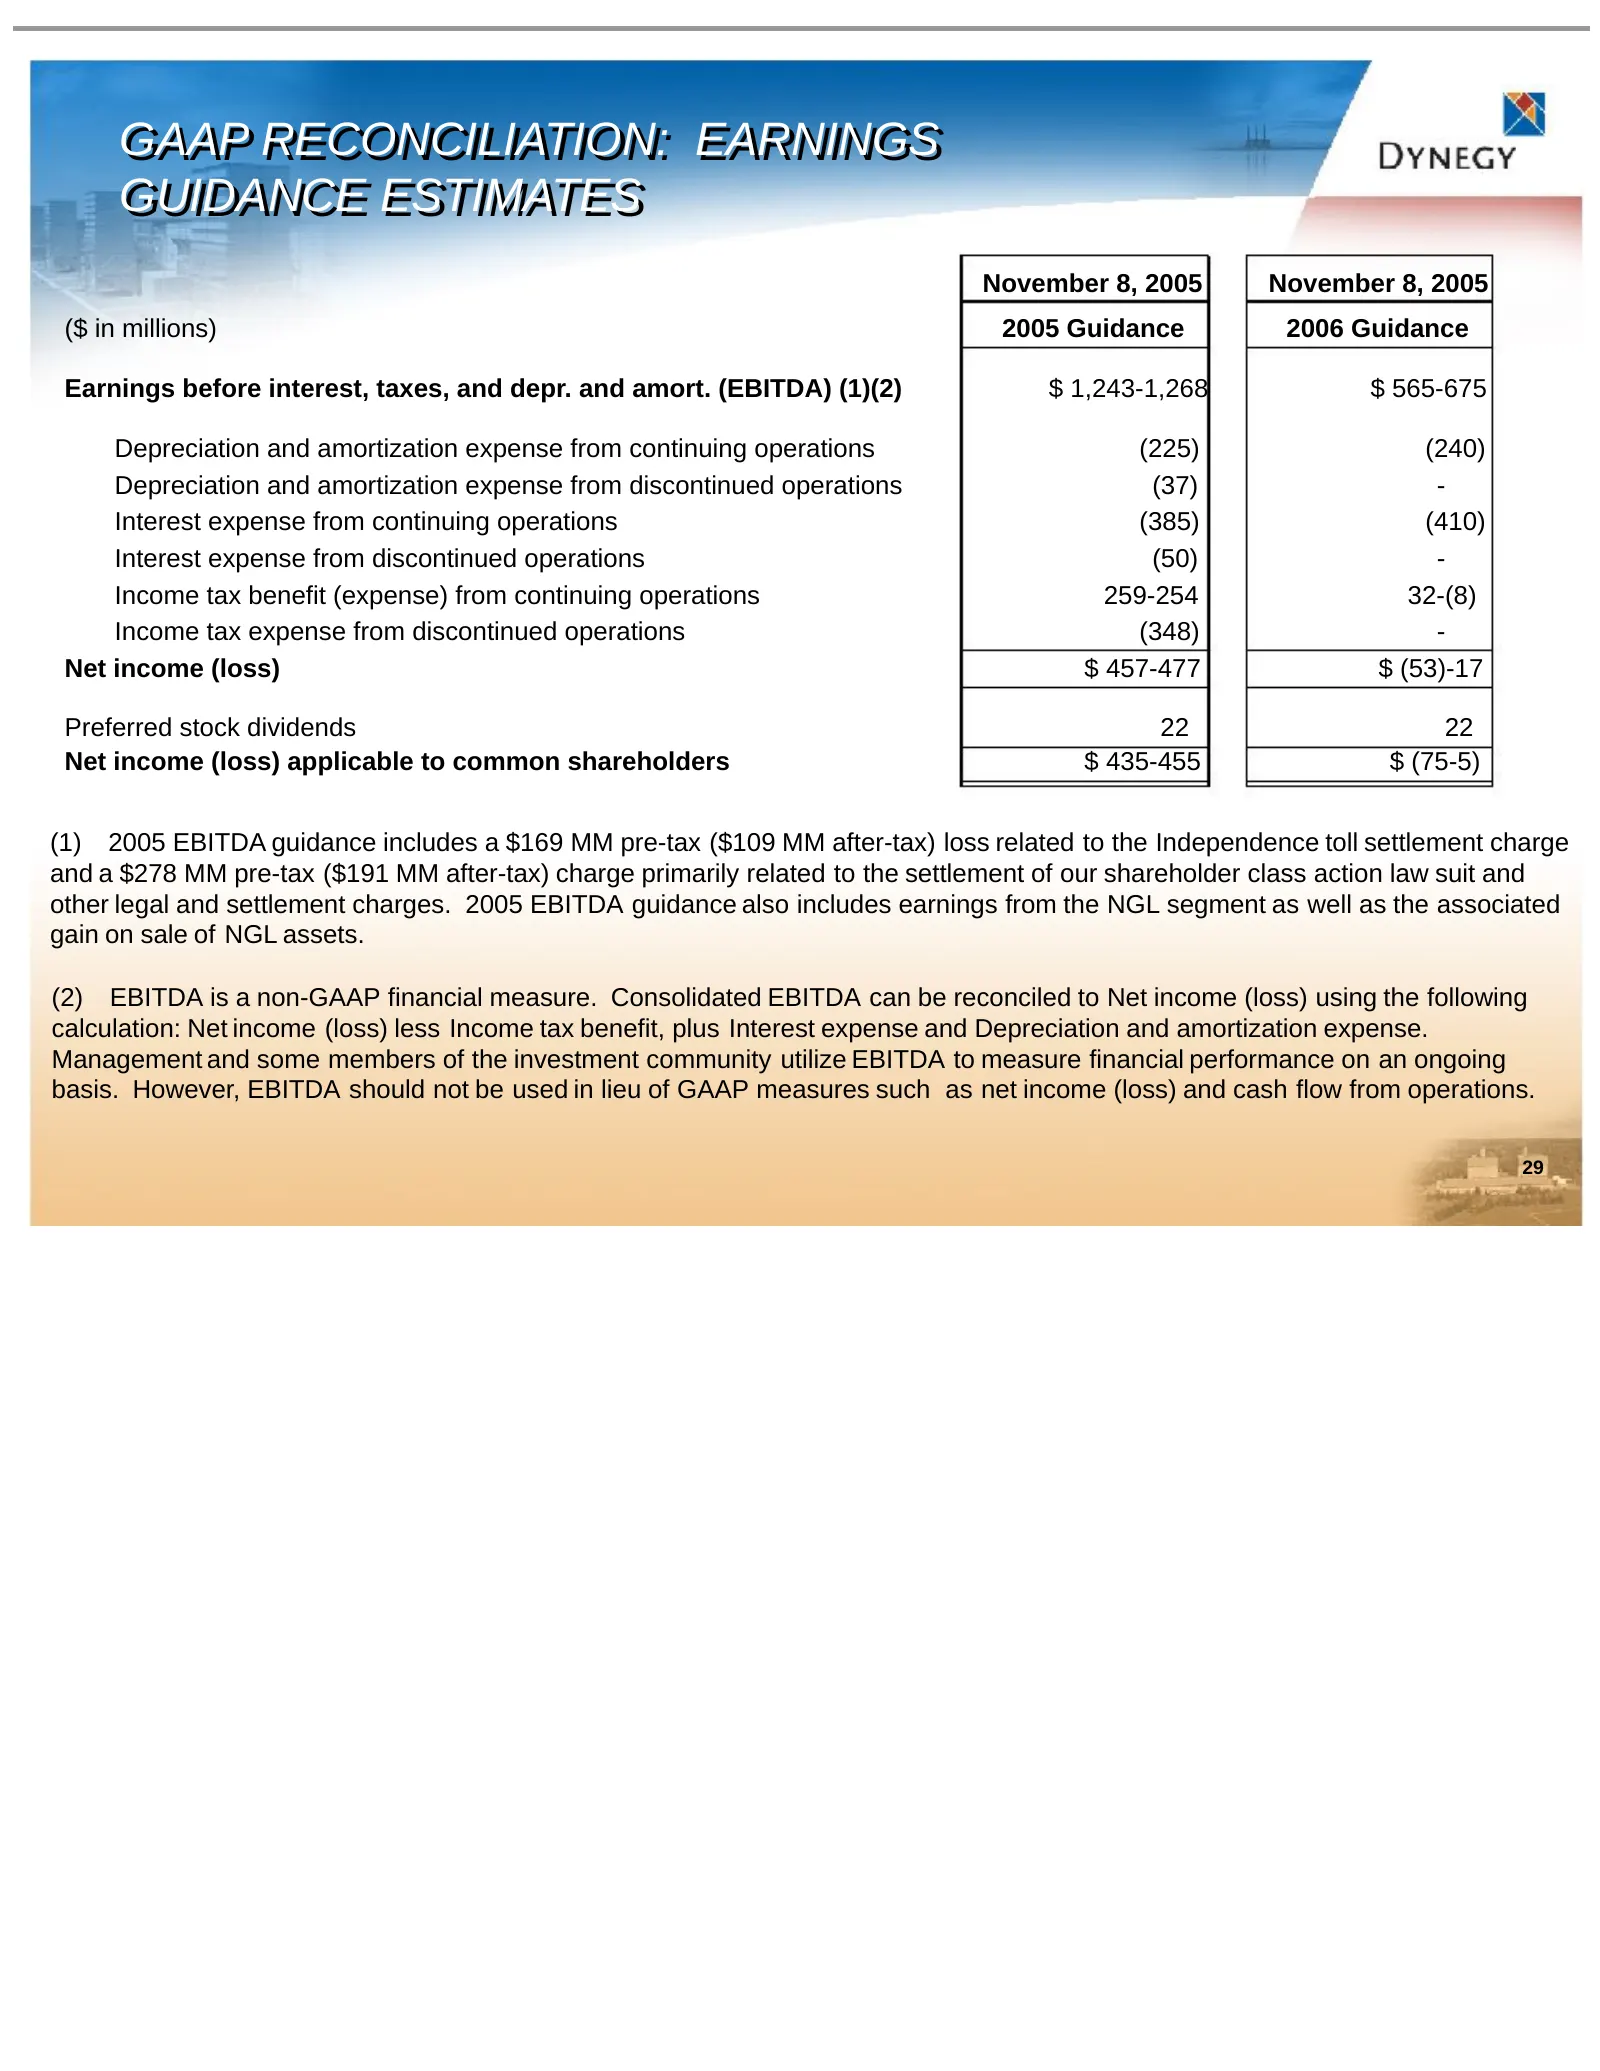
Slide 29: GAAP Reconciliation: Earnings Guidance Estimates
GAAP GAAP RECONCILIATION: RECONCILIATION: EARNINGS EARNINGS GUIDANCE GUIDANCE ESTIMATES ESTIMATES November 8, 2005 November 8, 2005 ($ in millions) 2005 Guidance 2006 Guidance Earnings before interest, taxes, and depr. and amort. (EBITDA) (1)(2) $ 1,243-1,268 $ 565-675 Depreciation and amortization
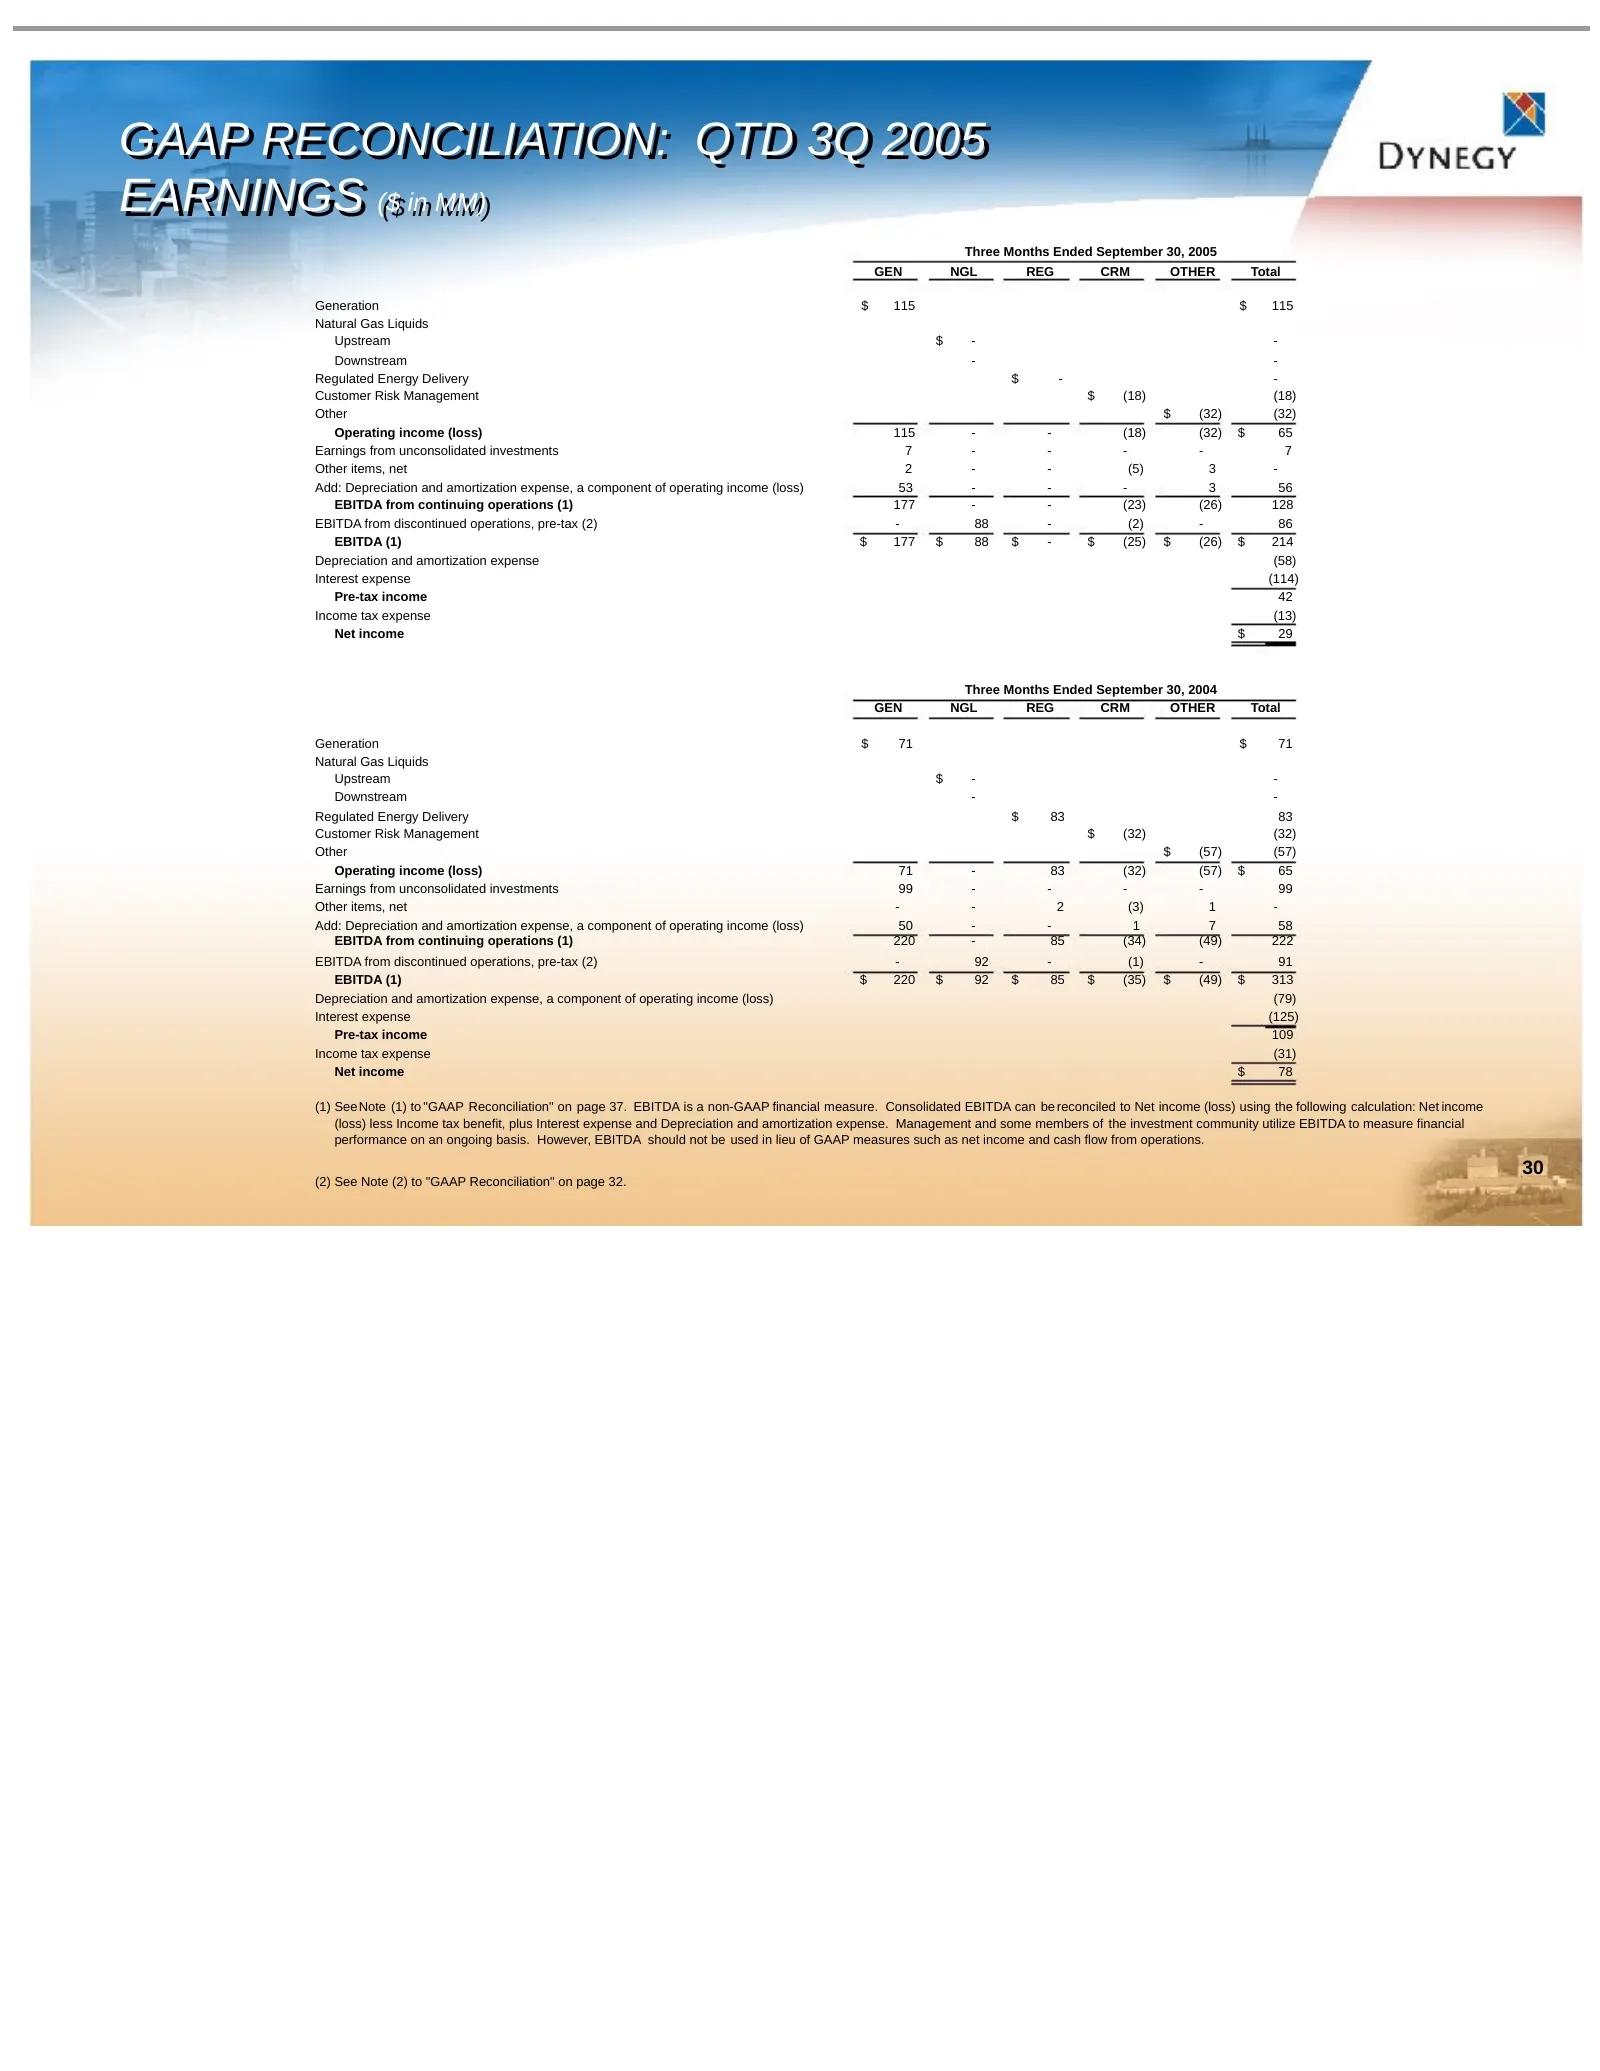
Slide 30: GAAP Reconciliation: QTD 3Q 2005 Earnings
GAAP GAAP RECONCILIATION: RECONCILIATION: QTD QTD 3Q 3Q 2005 2005 EARNINGS EARNINGS ($($ inin MM) MM) Three Months Ended September 30, 2005 GEN NGL REG CRM OTHER Total Generation $ 115 $ 115 Natural Gas Liquids Upstream $ - - Downstream - - Regulated Energy Delivery $ - - Customer Risk Management $
Slide 31: GAAP Reconciliation: YTD 3Q 2005 Earnings
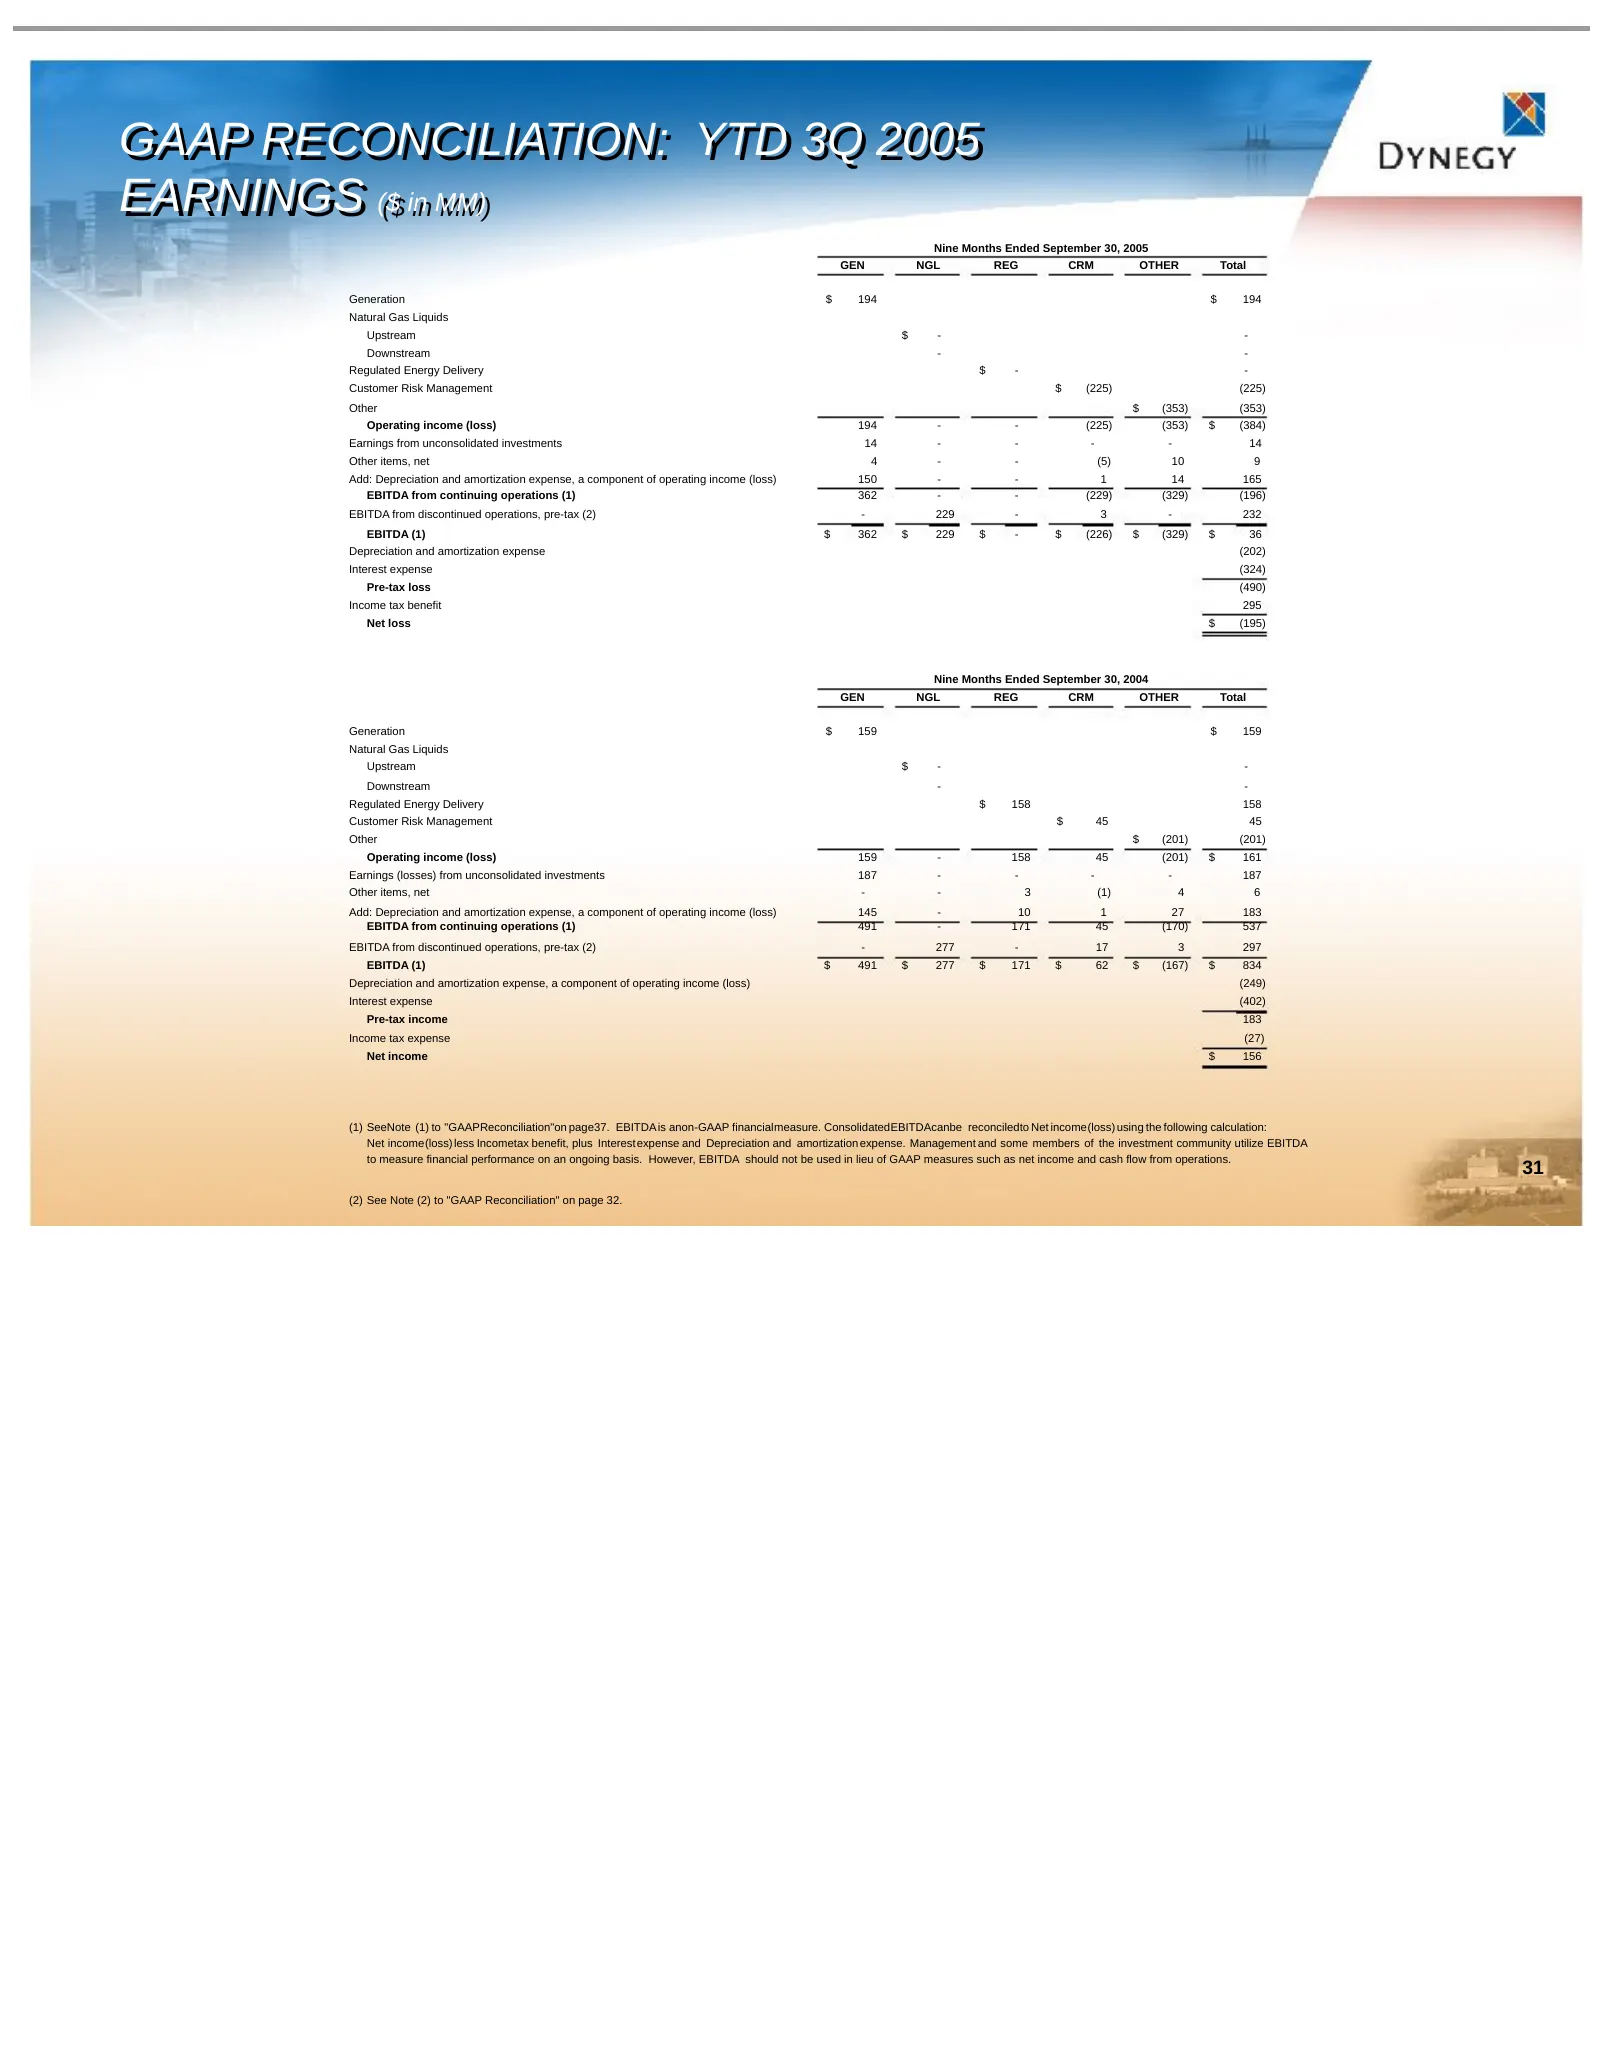
GAAP GAAP RECONCILIATION: RECONCILIATION: YTD YTD 3Q 3Q 2005 2005 EARNINGS EARNINGS ($($ inin MM) MM) Nine Months Ended September 30, 2005 GEN NGL REG CRM OTHER Total Generation $ 194 $ 194 Natural Gas Liquids Upstream $ - - Downstream - - Regulated Energy Delivery $ - - Customer Risk Management $ (
Slide 32: GAAP Reconciliation
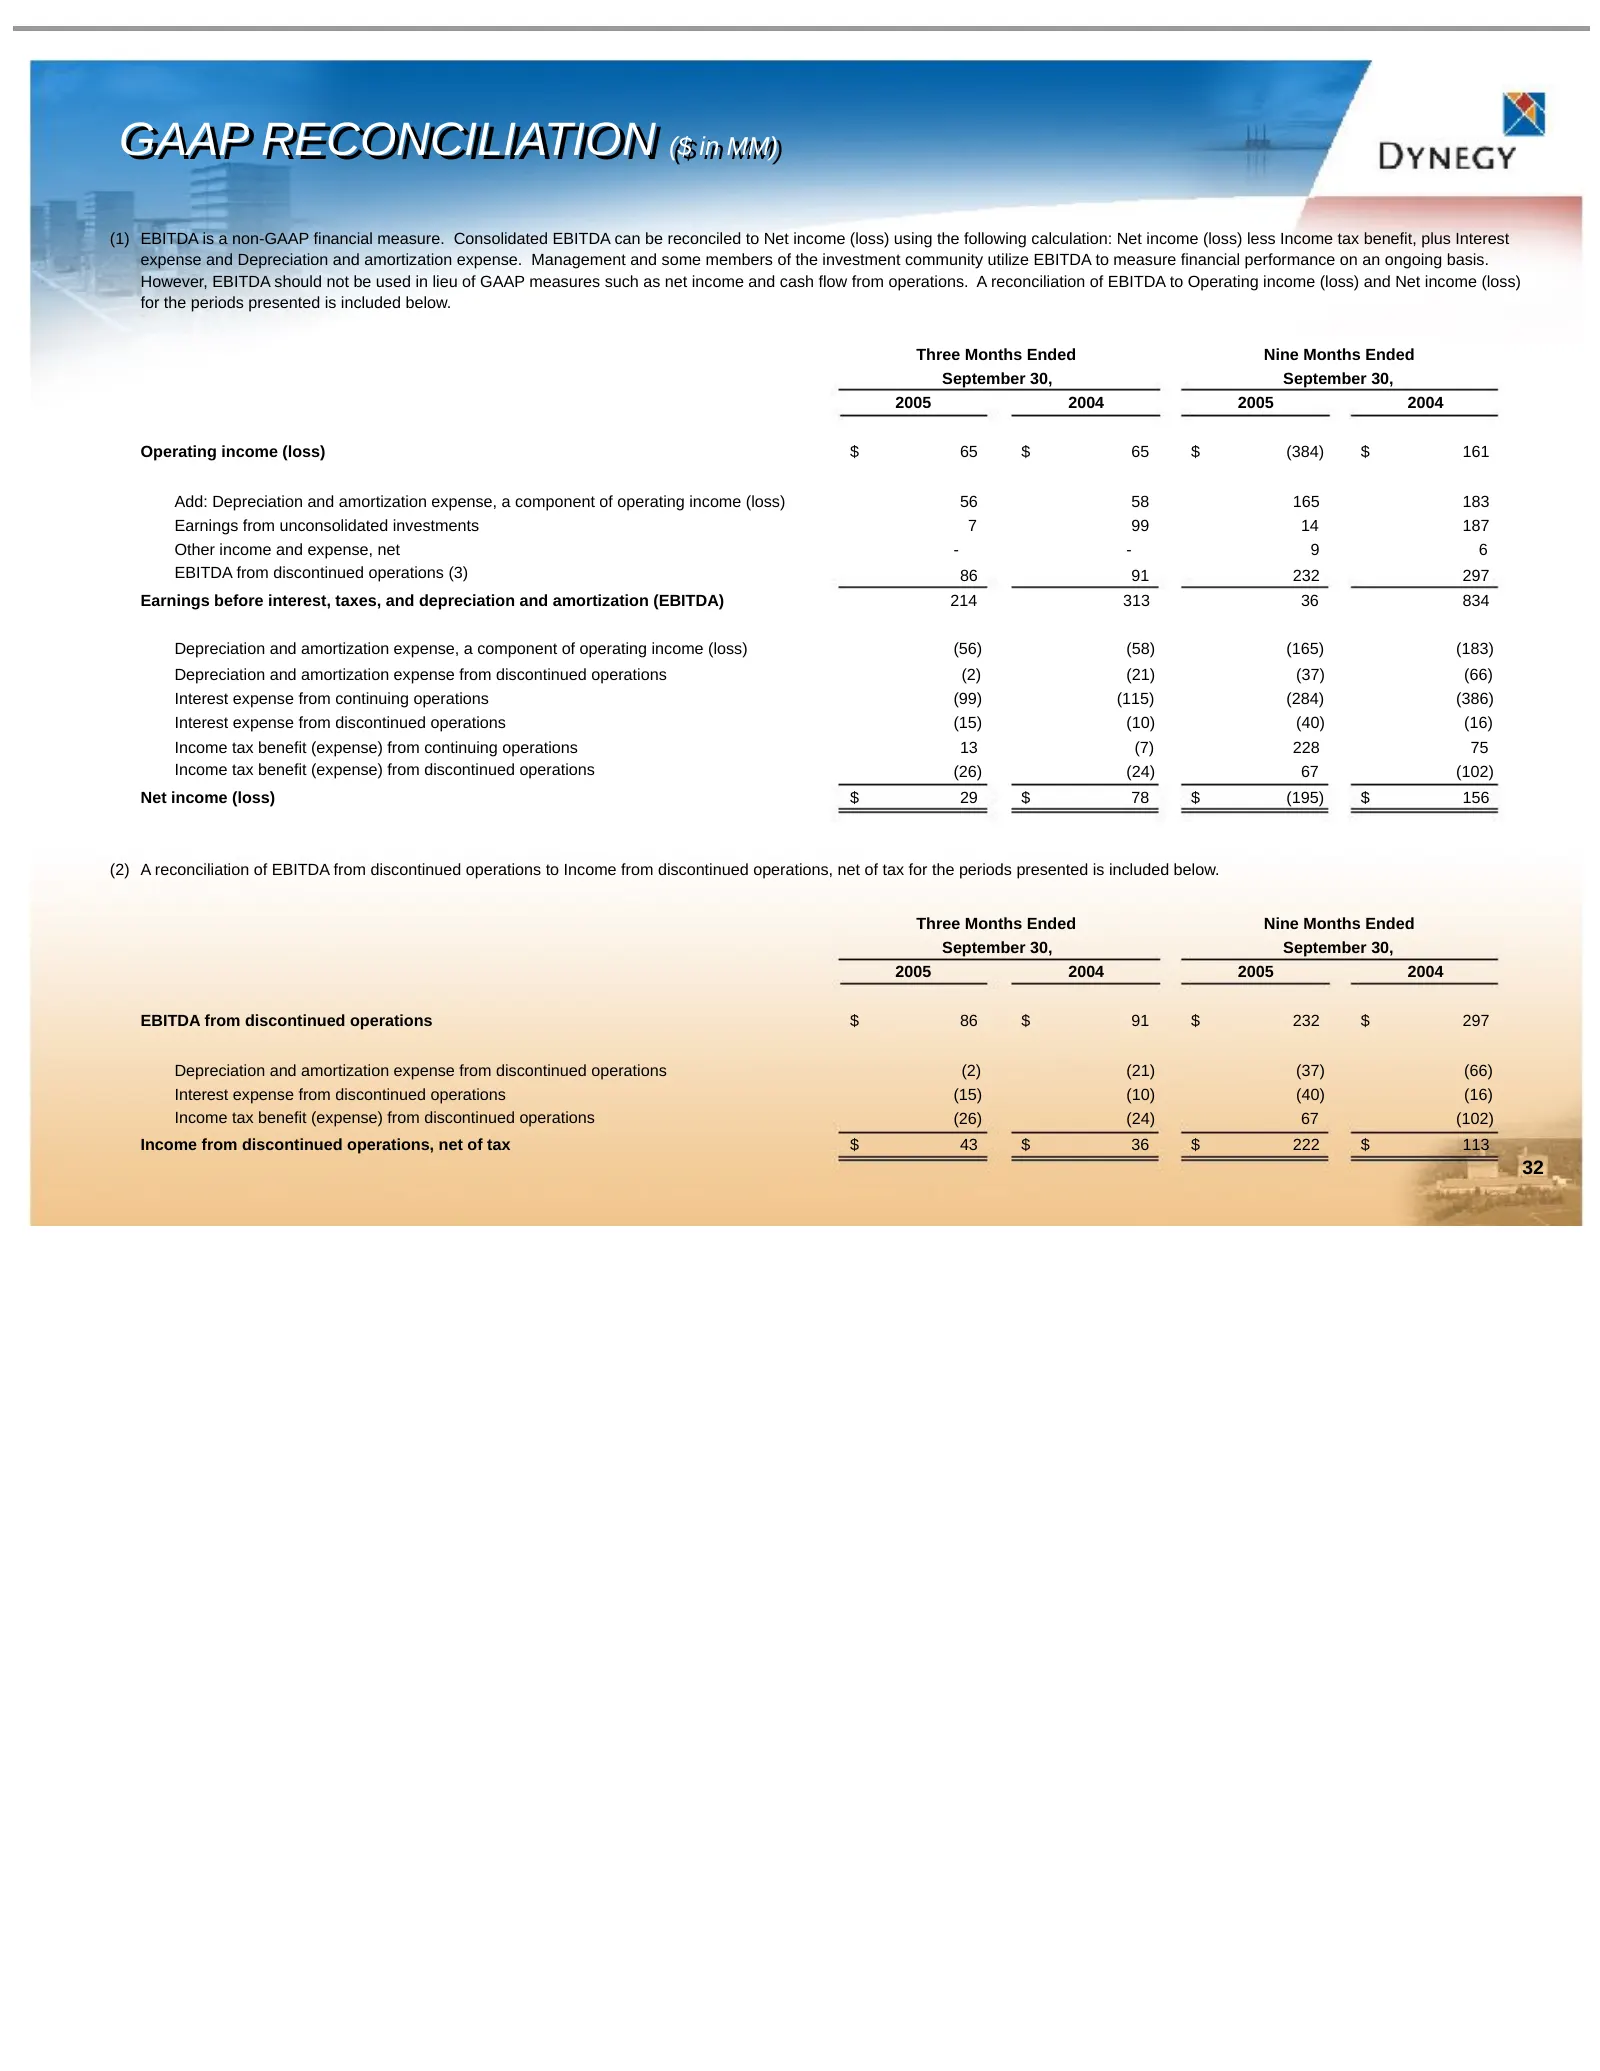
GAAP GAAP RECONCILIATION RECONCILIATION ($($ inin MM) MM) (1) EBITDA is a non-GAAP financial measure. Consolidated EBITDA can be reconciled to Net income (loss) using the following calculation: Net income (loss) less Income tax benefit, plus Interest expense and Depreciation and amortization expense
Slide 33: GAAP Reconciliation: Cash Flow Estimates
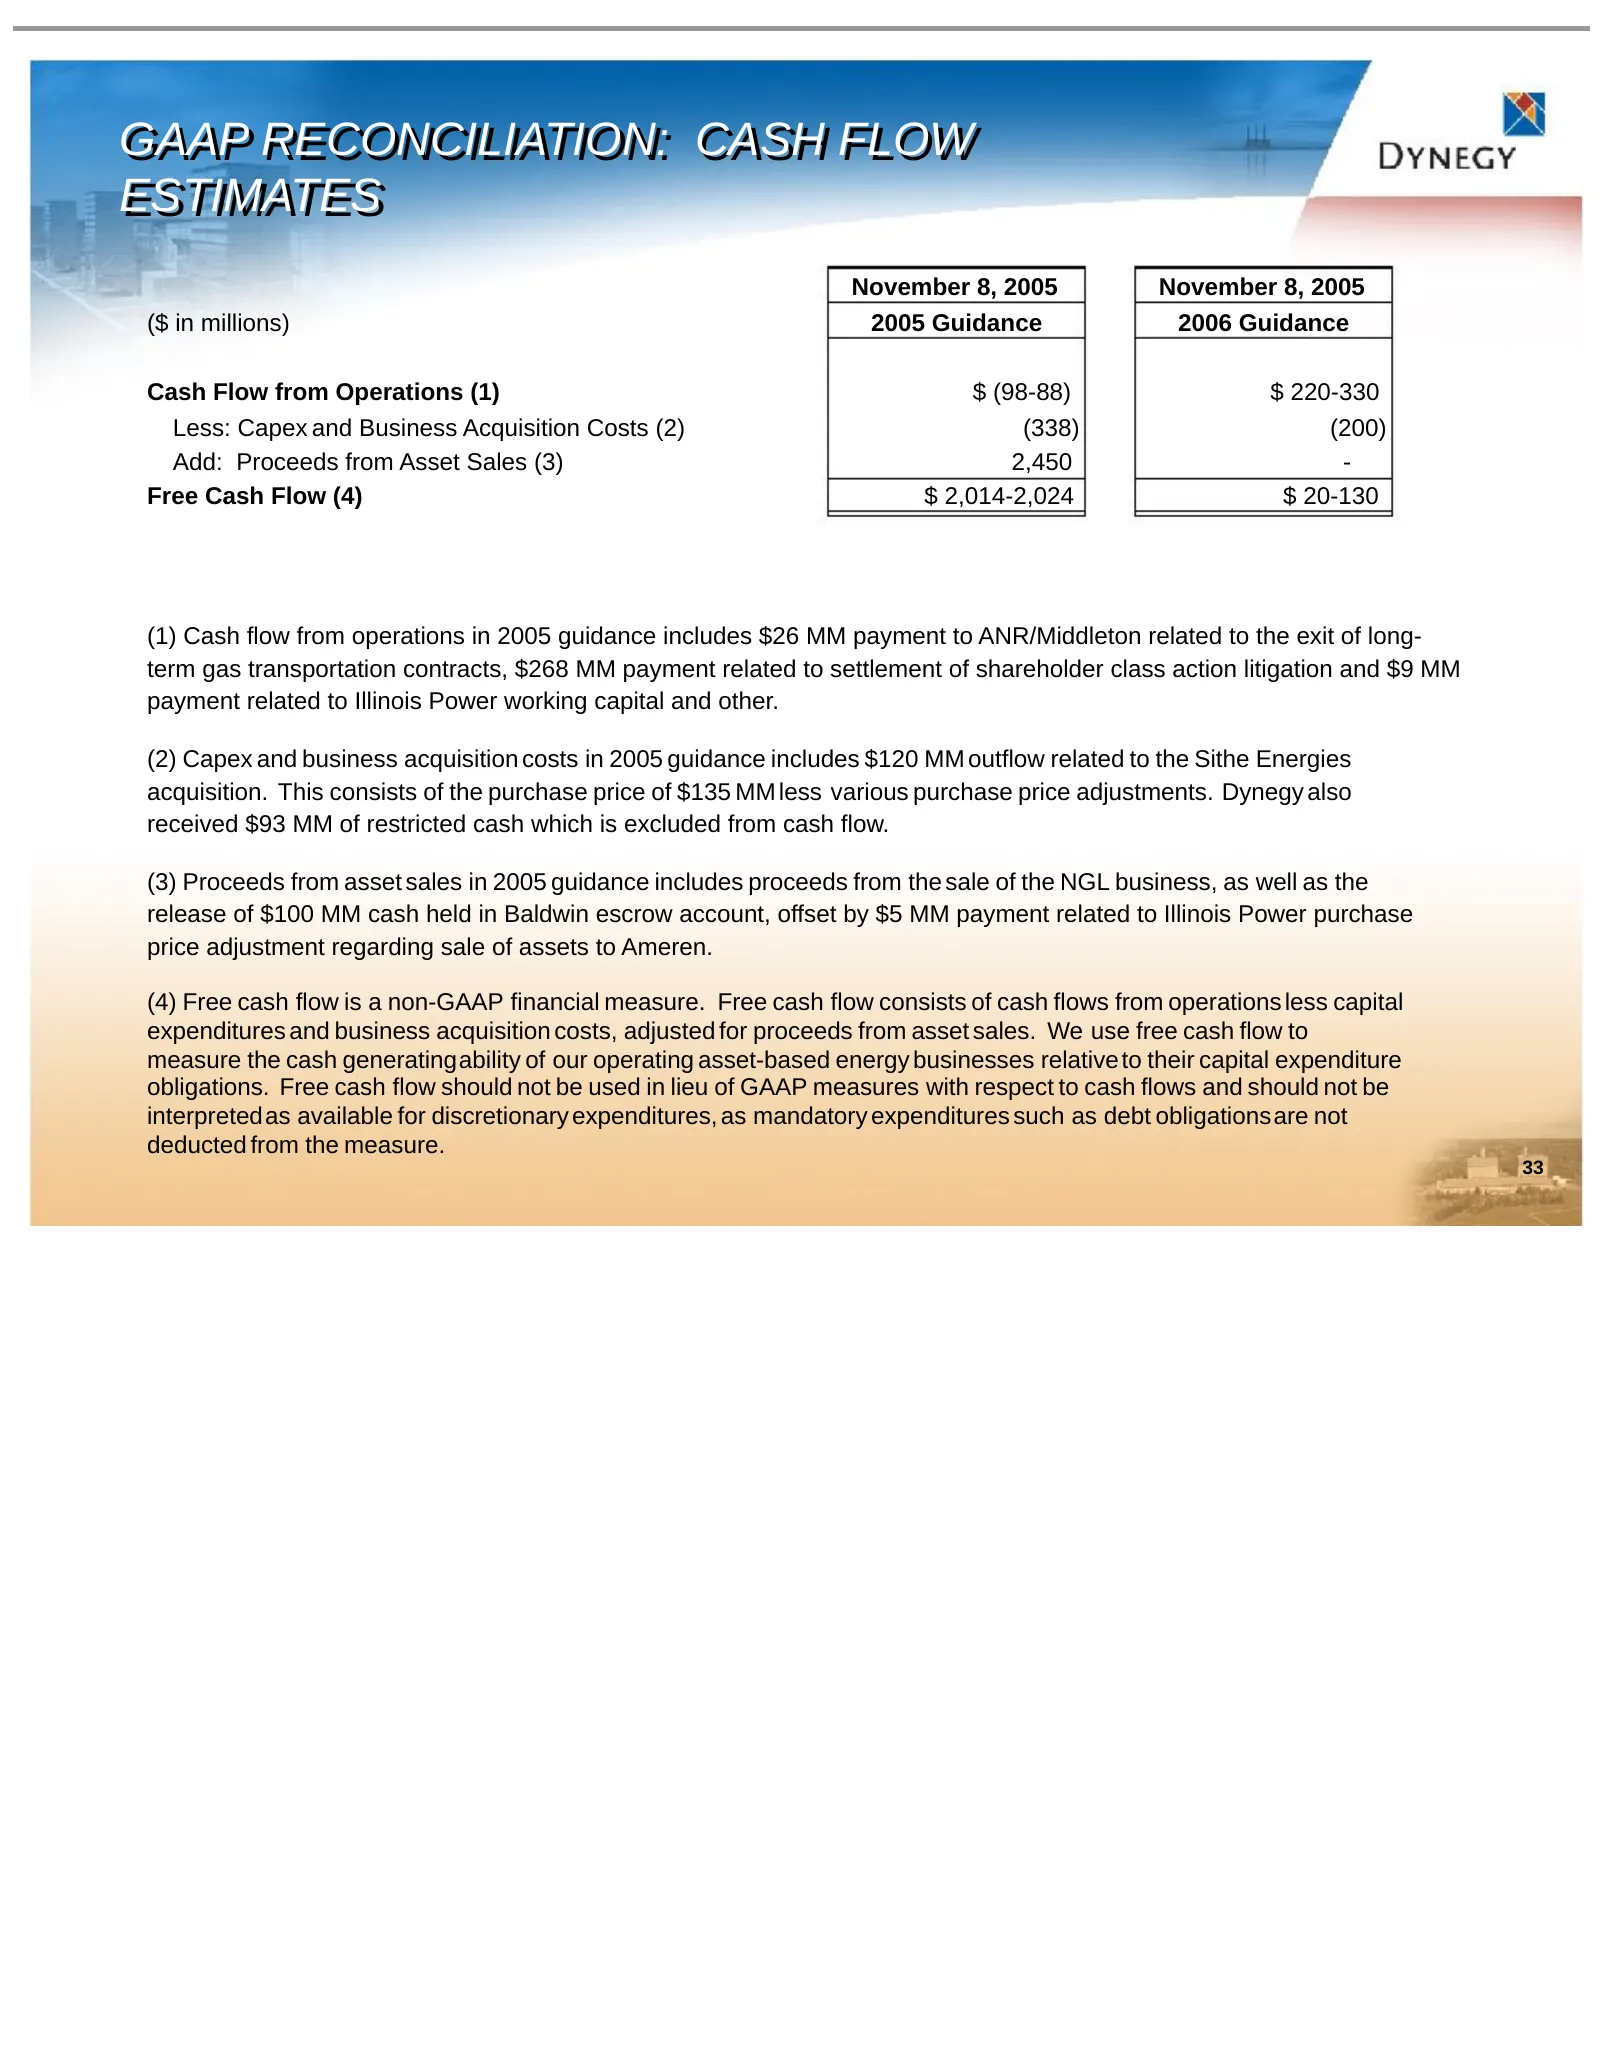
GAAP GAAP RECONCILIATION: RECONCILIATION: CASH CASH FLOW FLOW ESTIMATES ESTIMATES November 8, 2005 November 8, 2005 ($ in millions) 2005 Guidance 2006 Guidance Cash Flow from Operations (1) $ (98-88) $ 220-330 Less: Capex and Business Acquisition Costs (2) (338) (200) Add: Proceeds from Asset Sales
Slide 34: GAAP Reconciliation: Cash Flow
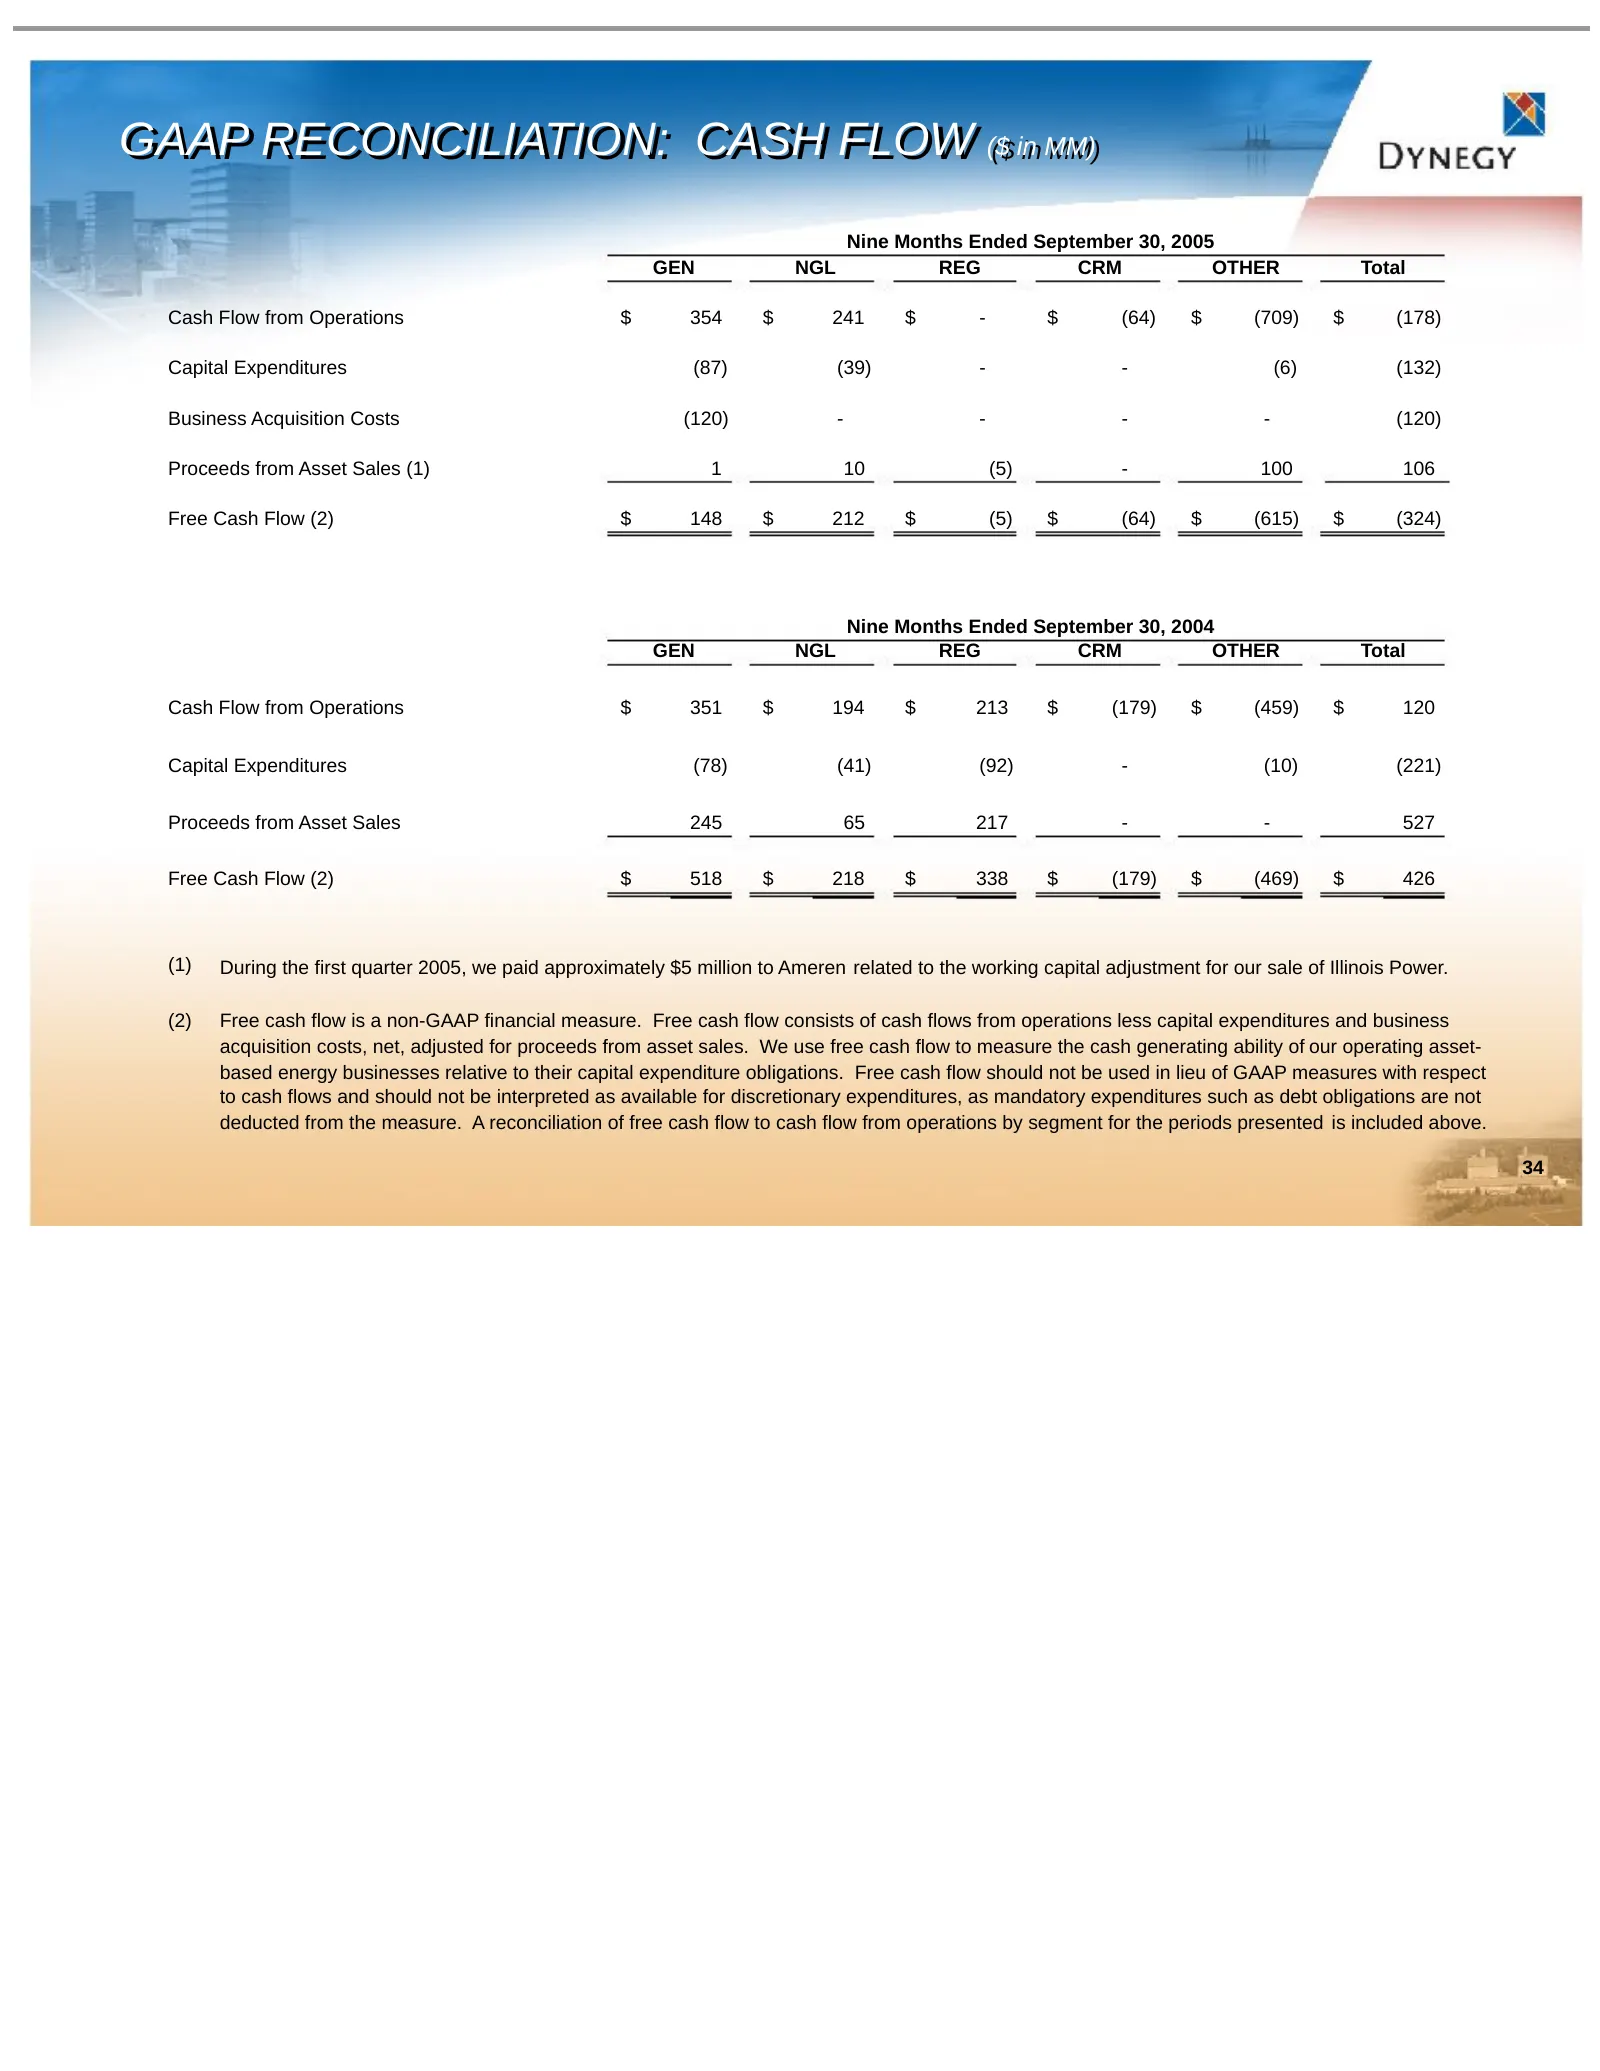
GAAP GAAP RECONCILIATION: RECONCILIATION: CASH CASH FLOW FLOW ($($ inin MM) MM) Nine Months Ended September 30, 2005 GEN NGL REG CRM OTHER Total Cash Flow from Operations $ 354 $ 241 $ - $ (64) $ (709) $ (178) Capital Expenditures (87) (39) - - (6) (132) Business Acquisition Costs (120) - - - - (120
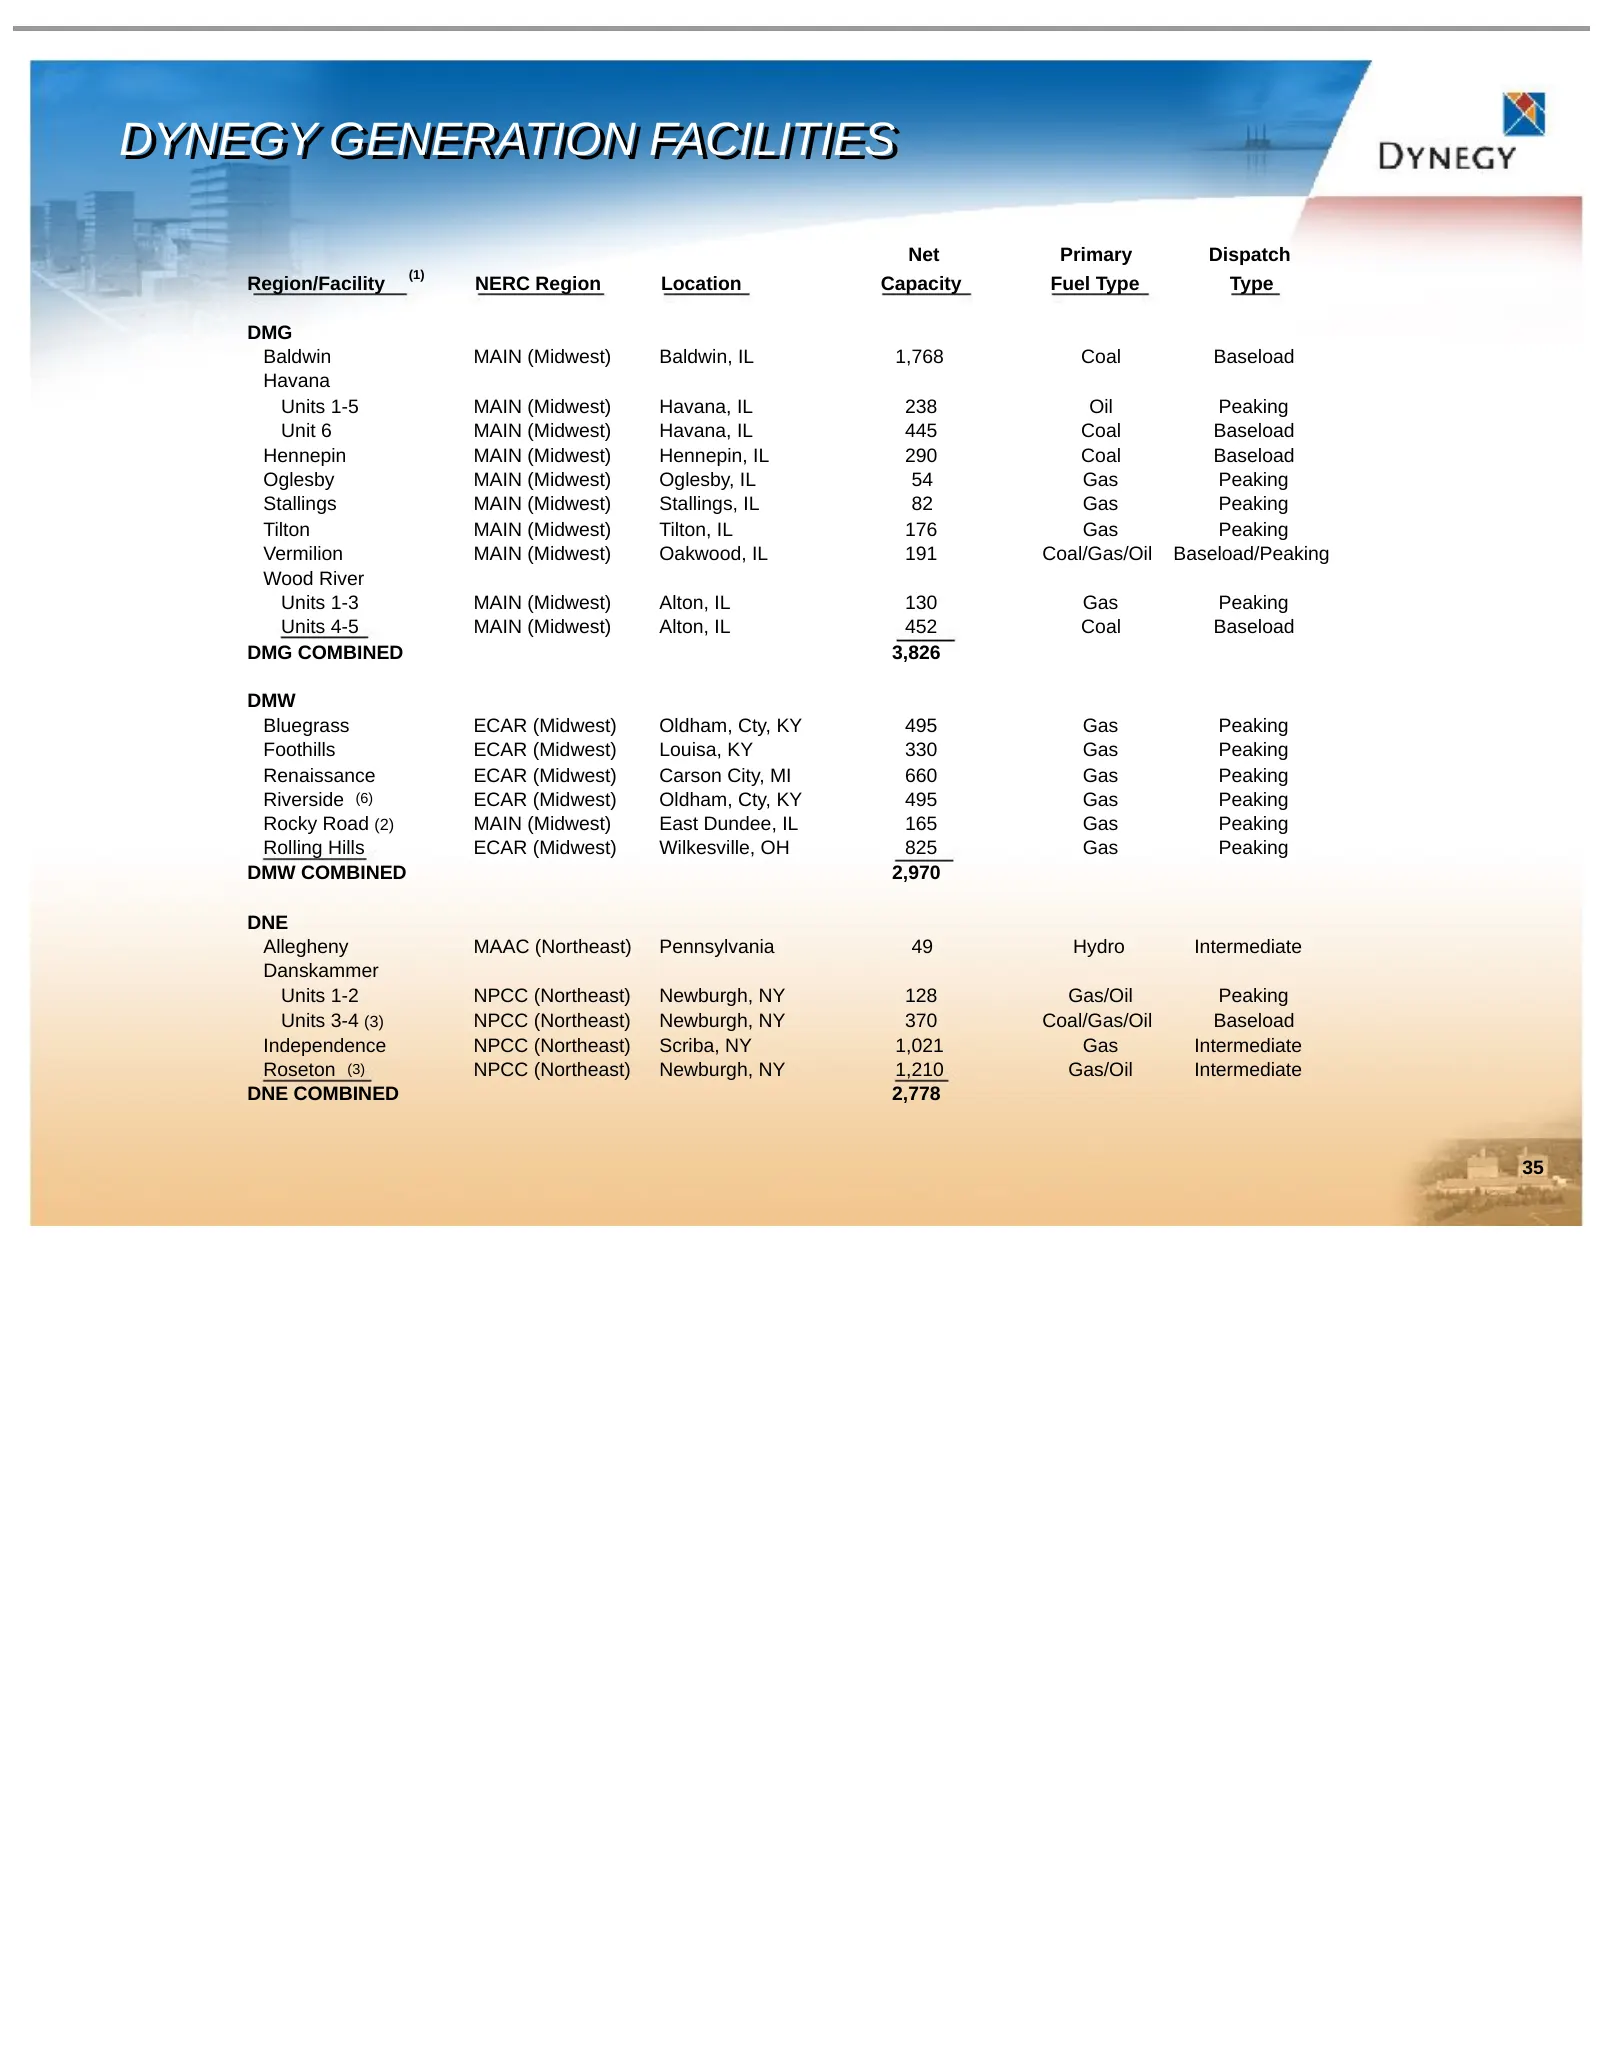
Slide 35: Dynegy Generation Facilities
DYNEGY DYNEGY GENERATION GENERATION FACILITIES FACILITIES Net Primary Dispatch (1) Region/Facility NERC Region Location Capacity Fuel Type Type DMG Baldwin MAIN (Midwest) Baldwin, IL 1,768 Coal Baseload Havana Units 1-5 MAIN (Midwest) Havana, IL 238 Oil Peaking Unit 6 MAIN (Midwest) Havana, IL 445 C
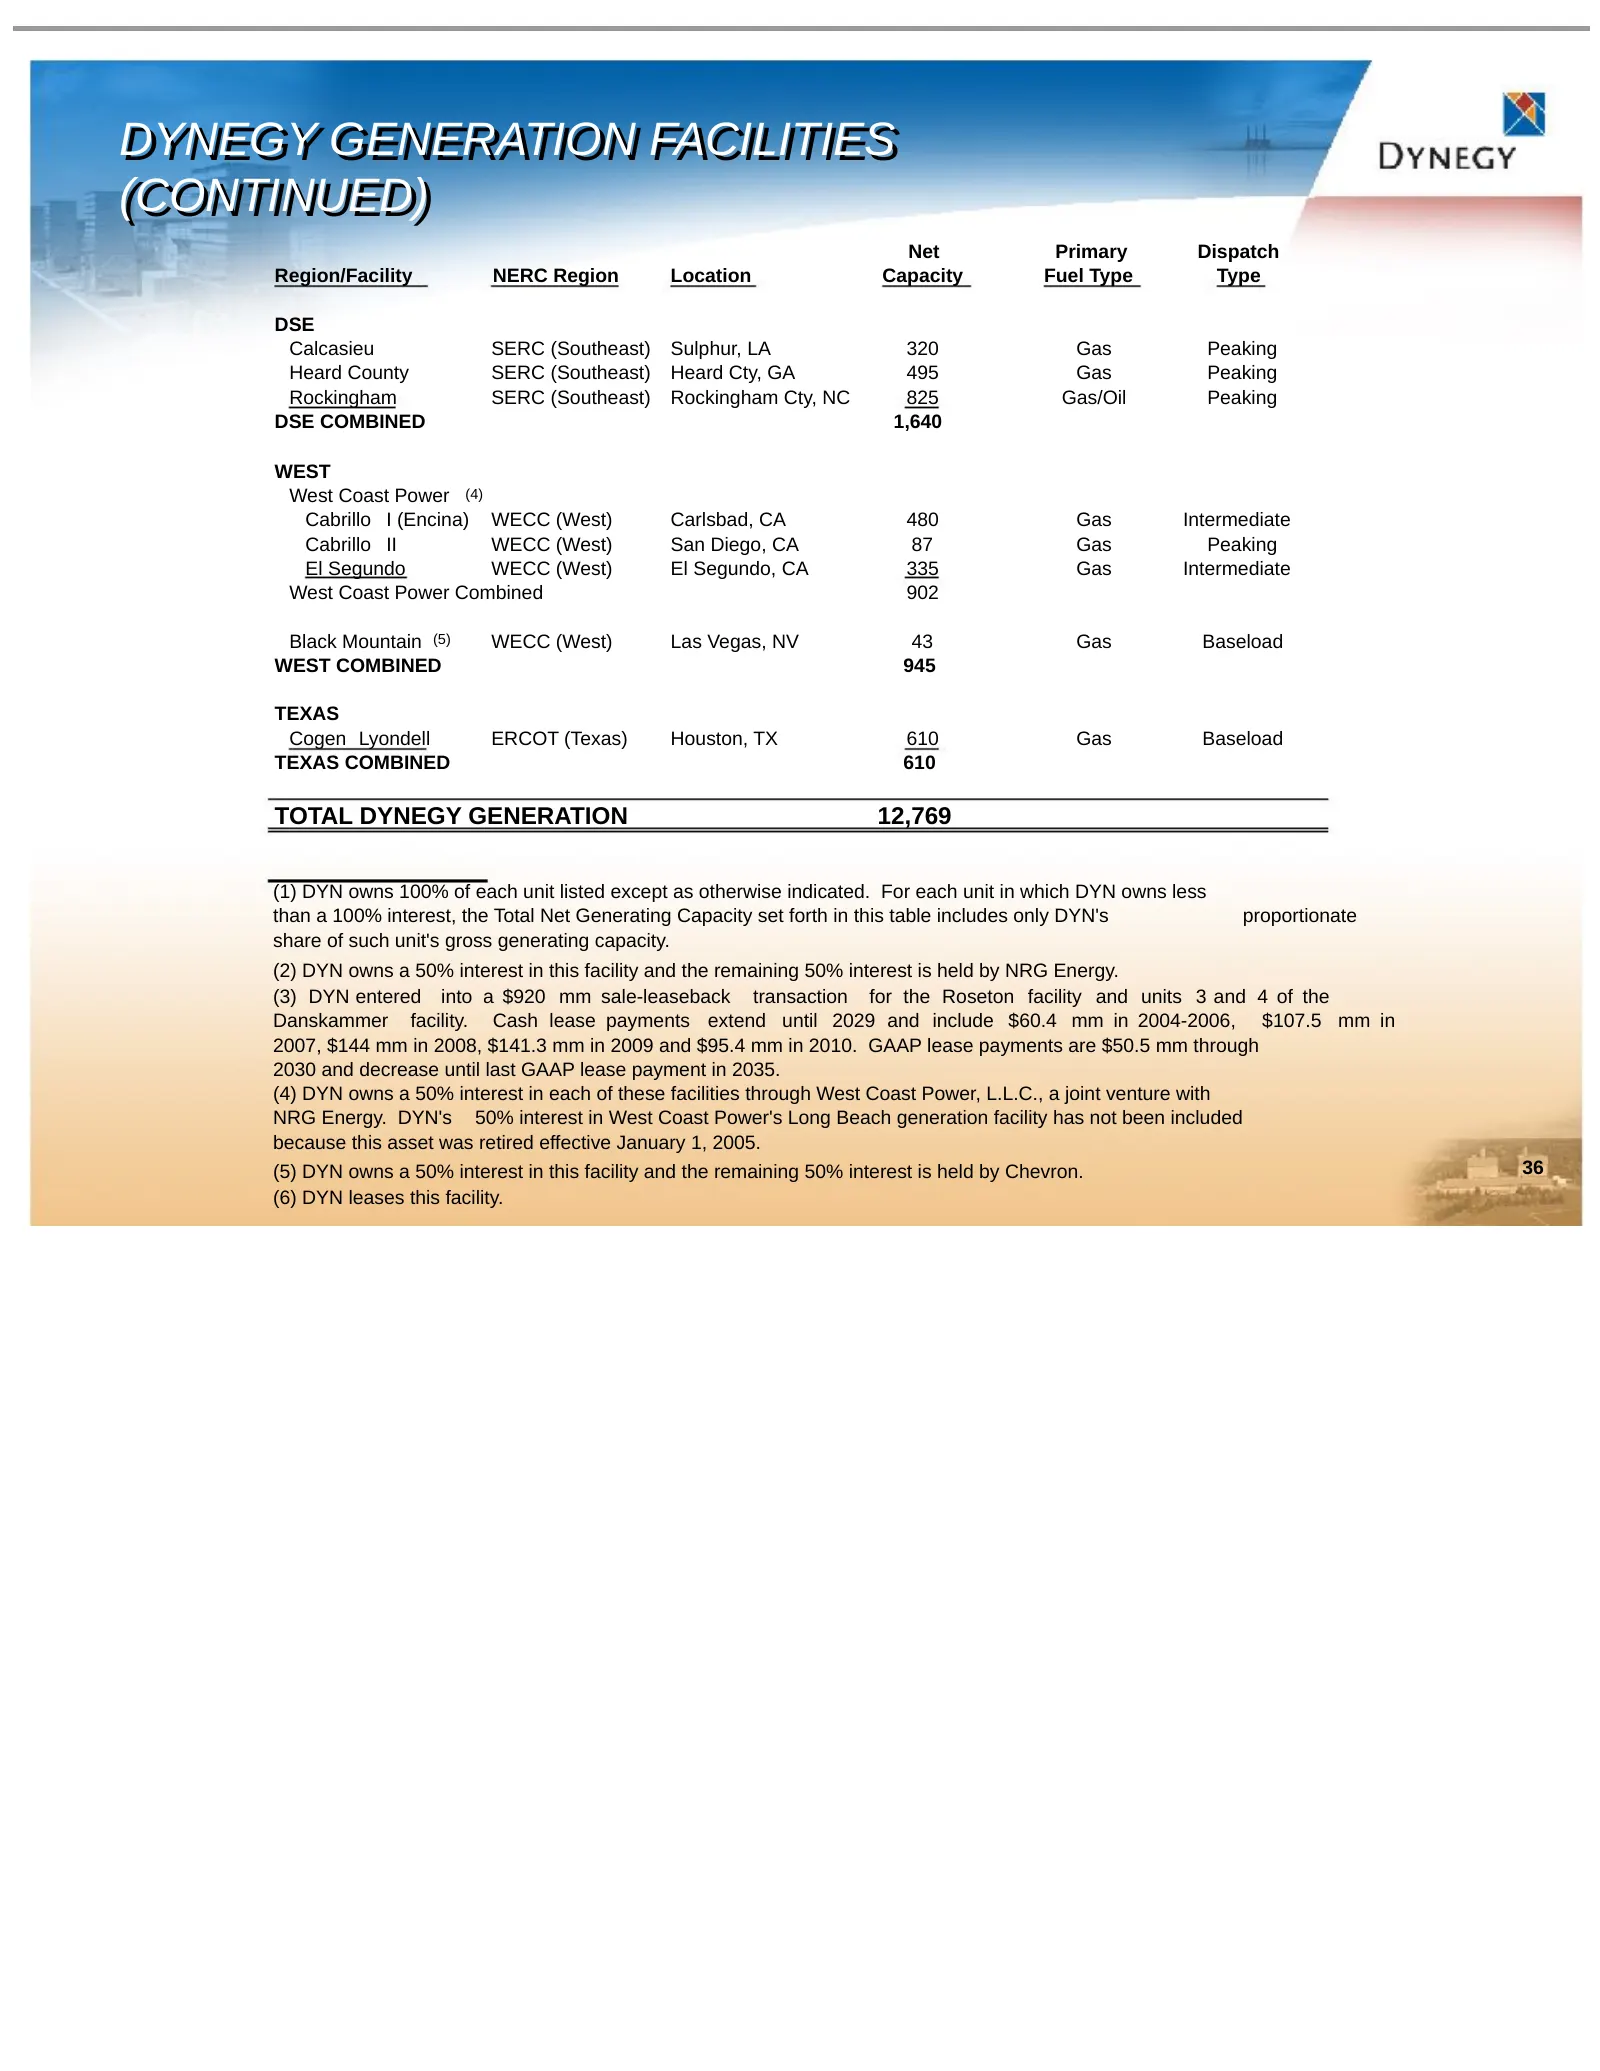
Slide 36: Dynegy Generation Facilities (Continued)
DYNEGY DYNEGY GENERATION GENERATION FACILITIES FACILITIES (CONTINUED) (CONTINUED) Net Primary Dispatch Region/Facility NERC Region Location Capacity Fuel Type Type DSE Calcasieu SERC (Southeast) Sulphur, LA 320 Gas Peaking Heard County SERC (Southeast) Heard Cty, GA 495 Gas Peaking Rockingham SERC (
Source: SEC EDGAR · 8-K filed Jan 31, 2006
More decks from Dynegy Inc
 FY2017 Earnings Presentation30 slides · Feb 26, 2018
 Debt Investor Presentation (December 2017)10 slides · Dec 11, 2017
 Merger or Acquisition (October 2017)28 slides · Oct 31, 2017
 Debt Investor Presentation (October 2016)44 slides · Oct 3, 2016
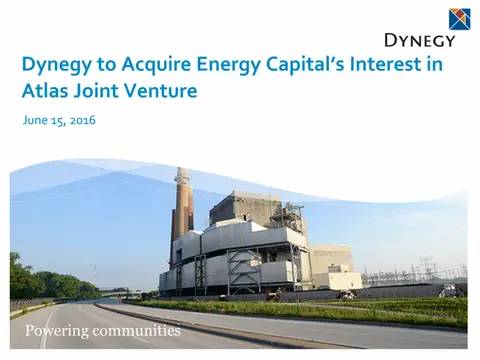 IPO Roadshow (June 2016)17 slides · Jun 15, 2016
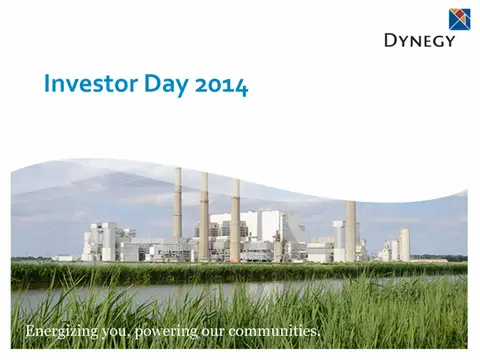 Investor Day (April 2014)94 slides · Apr 11, 2014