Subsea 7 S.A. · OSL:SUBC
Subsea 7 — Q2 2019 Earnings Presentation
28 slides from Subsea 7's earnings presentation, Jul 25, 2019
Slide 1: Second Quarter 2019 Earnings Presentation
Second Quarter 2019 Earnings Presentation 25 July 2019 1 © Subsea 7 - 2019 subsea7.com
Slide 2: Forward-looking statements
Forward-looking statements Certain statements made in this presentation may include ‘forward-looking statements’. These statements may be identified by the use of words like ‘anticipate’, ‘believe’, ‘could’, ‘estimate’, ‘expect’, ‘forecast’, ‘intend’, ‘may’, ‘might’, ‘plan’, ‘predict’, ‘project’, ‘s
Slide 3: Second Quarter 2019
Second Quarter 2019 Jean Cahuzac, CEO - Highlights Ricardo Rosa, CFO - Financial performance Jean Cahuzac, CEO - Outlook - Q&A 3 © Subsea 7 - 2019 subsea7.com
Slide 4: Q2 2019 results
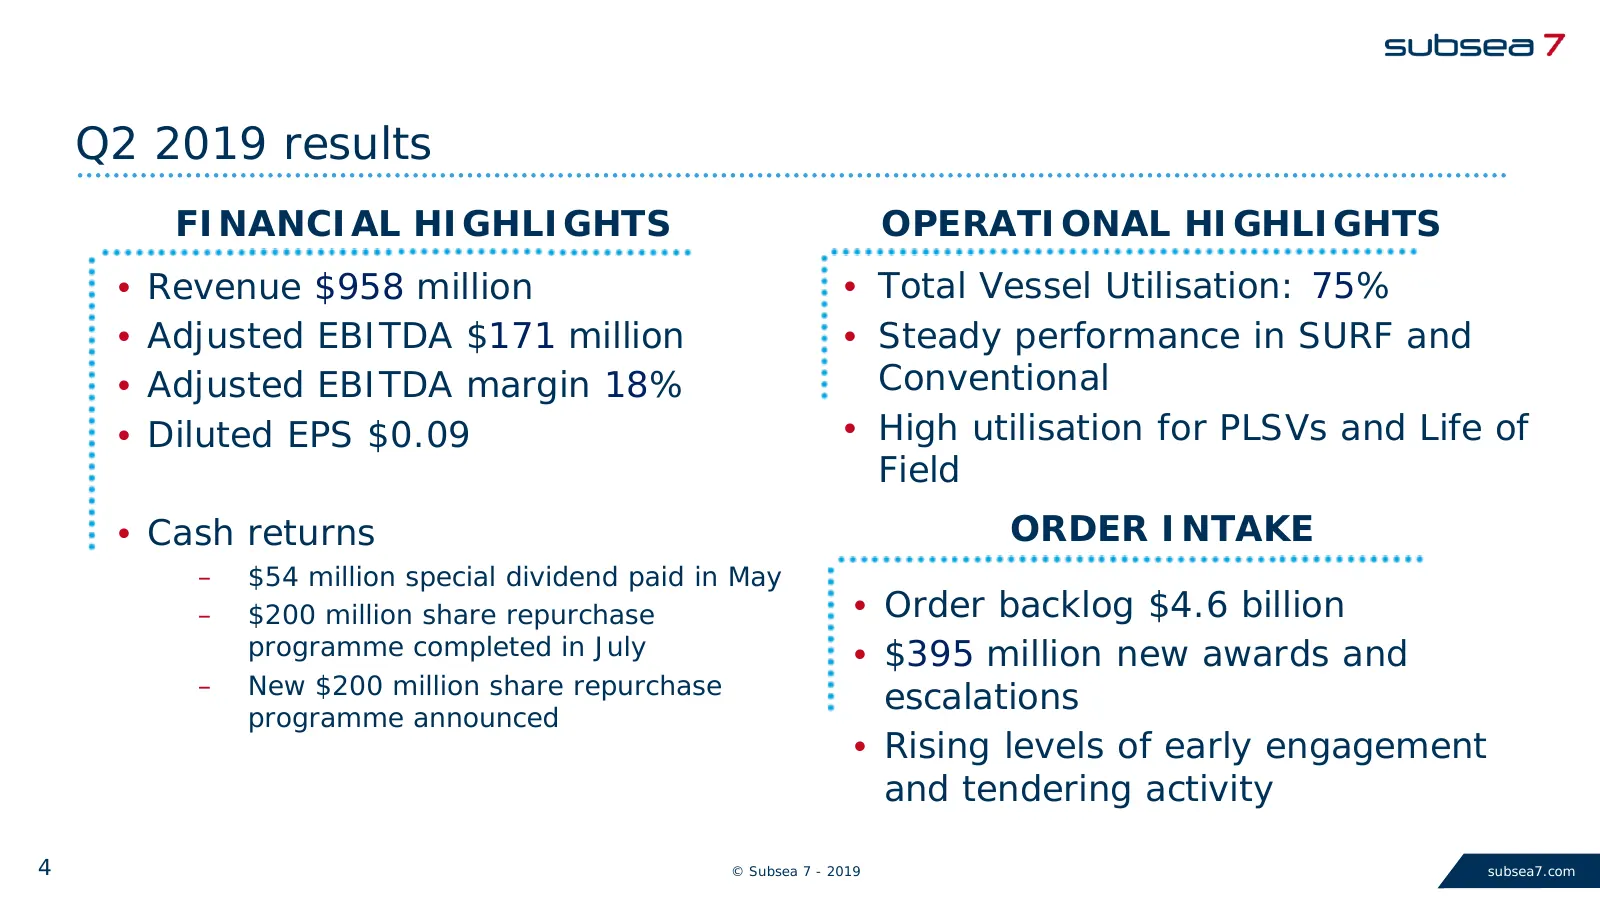
Q2 2019 results FINANCIAL HIGHLIGHTS OPERATIONAL HIGHLIGHTS • Revenue $958 million • Total Vessel Utilisation: 75% • Adjusted EBITDA $171 million • Steady performance in SURF and • Adjusted EBITDA margin 18% Conventional • Diluted EPS $0.09 • High utilisation for PLSVs and Life of Field • Cash retur
Slide 5: Operational highlights
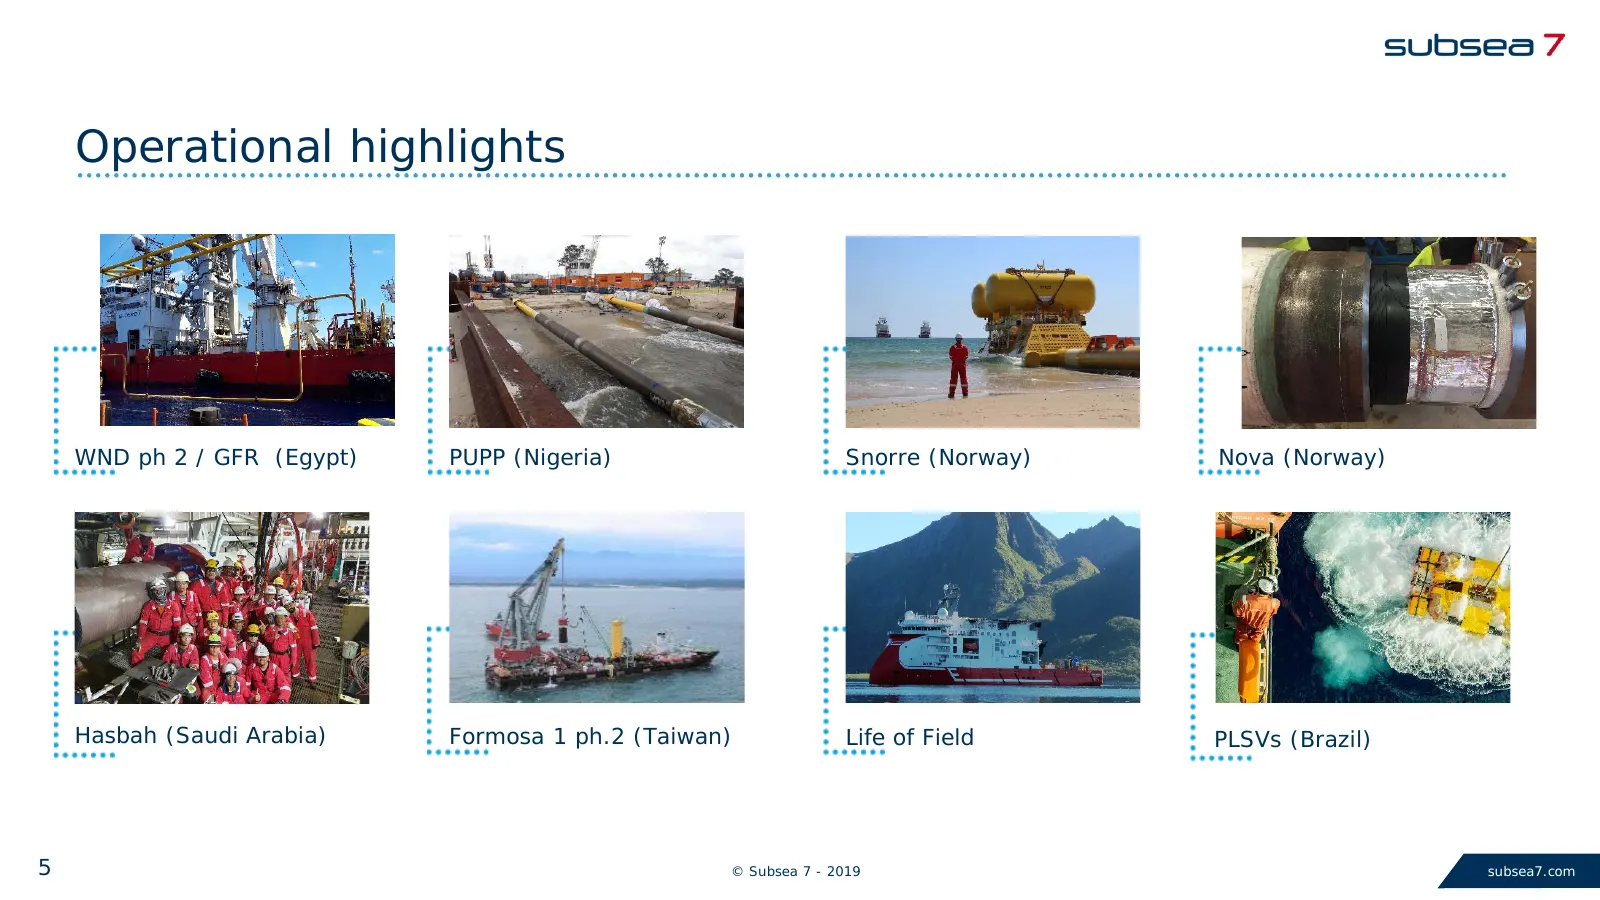
Operational highlights WND ph 2 / GFR (Egypt) PUPP (Nigeria) Snorre (Norway) Nova (Norway) Hasbah (Saudi Arabia) Formosa 1 ph.2 (Taiwan) Life of Field PLSVs (Brazil) 5 © Subsea 7 - 2019 subsea7.com
Slide 6: Backlog and order intake
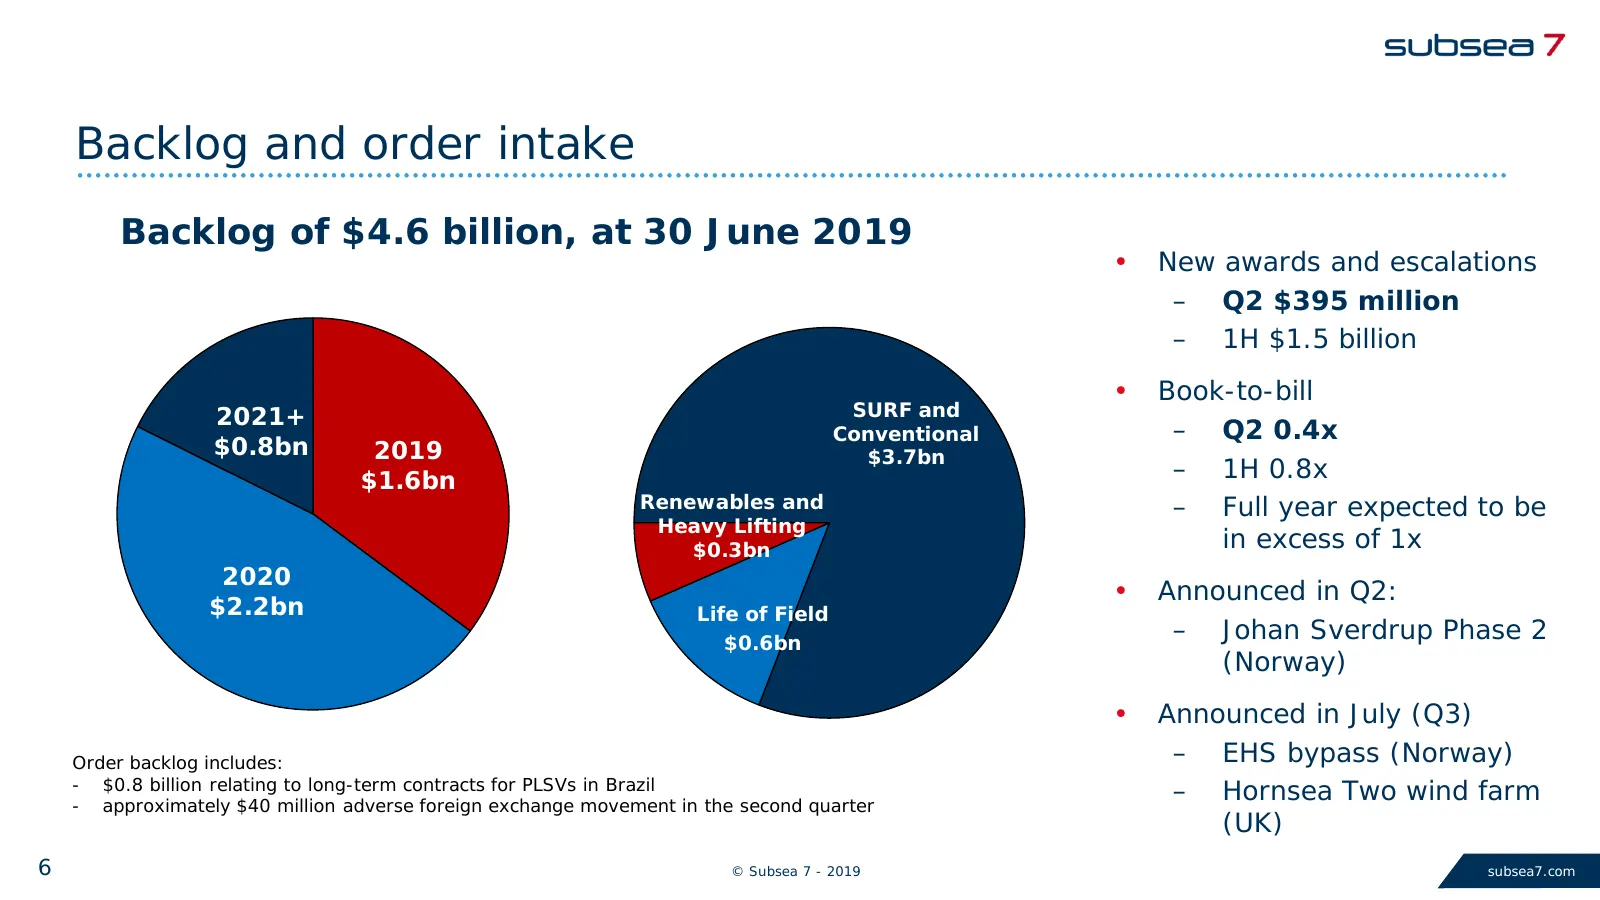
Backlog and order intake Backlog of $4.6 billion, at 30 June 2019 • New awards and escalations – Q2 $395 million – 1H $1.5 billion • Book-to-bill 2021+ SURF and Conventional – Q2 0.4x $0.8bn 2019 $3.7bn $1.6bn – 1H 0.8x Renewables and – Full year expected to be Heavy Lifting $0.3bn in excess of 1x 2
Slide 7: Income statement – Q2 highlights
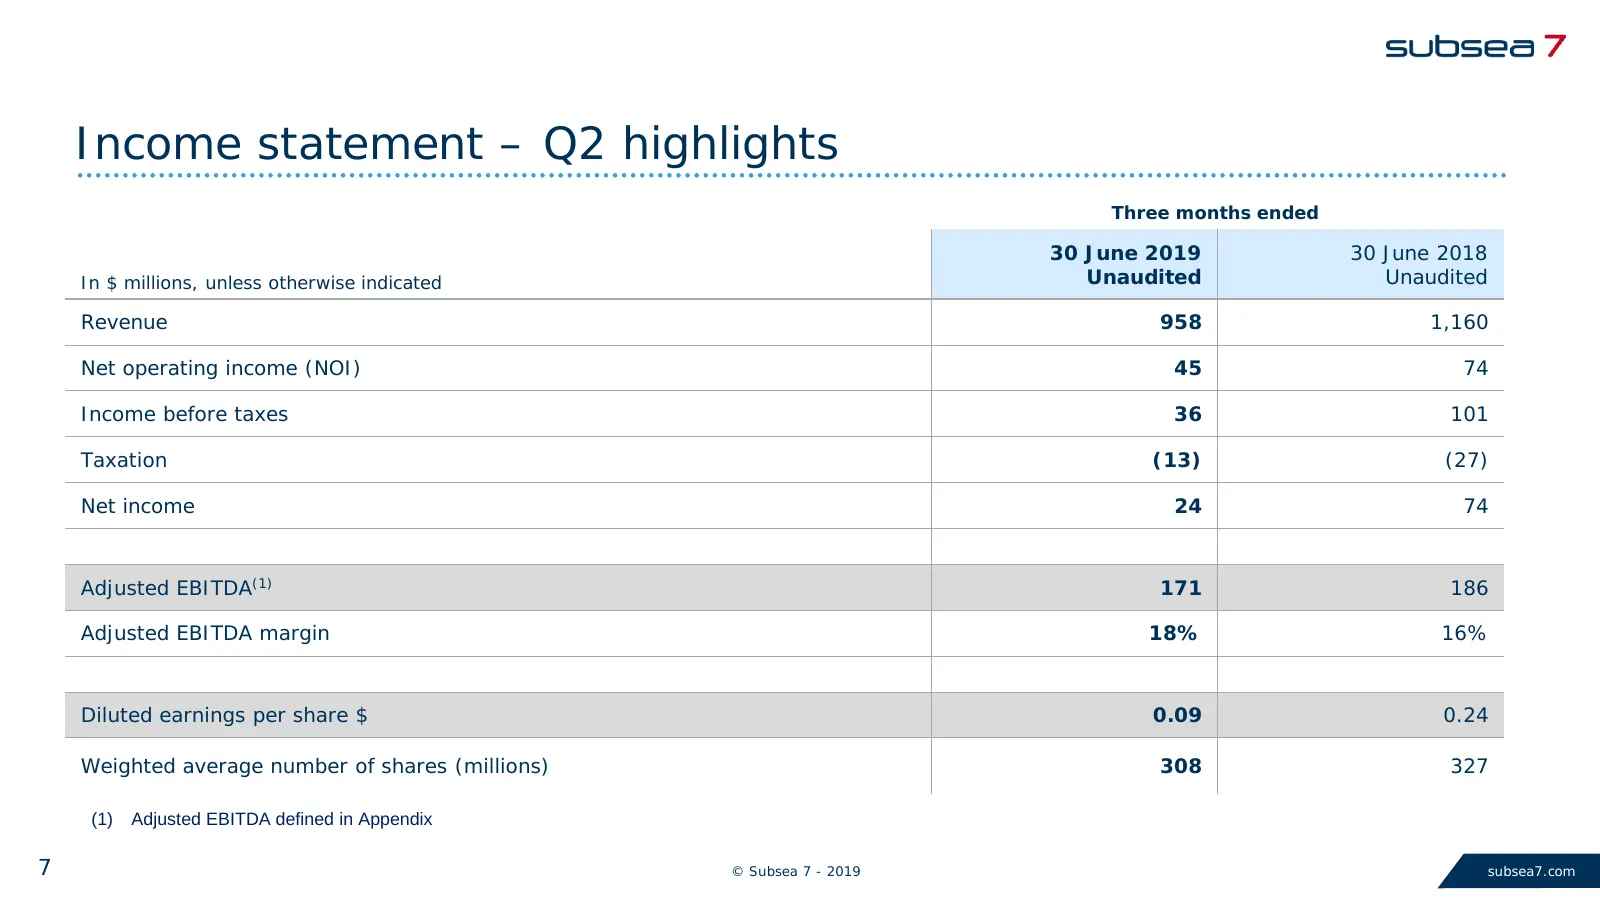
Income statement – Q2 highlights Three months ended 30 June 2019 30 June 2018 In $ millions, unless otherwise indicated Unaudited Unaudited Revenue 958 1,160 Net operating income (NOI) 45 74 Income before taxes 36 101 Taxation (13) (27) Net income 24 74 Adjusted EBITDA(1) 171 186 Adjusted EBITDA mar
Slide 8: Business Unit performance– Second quarter
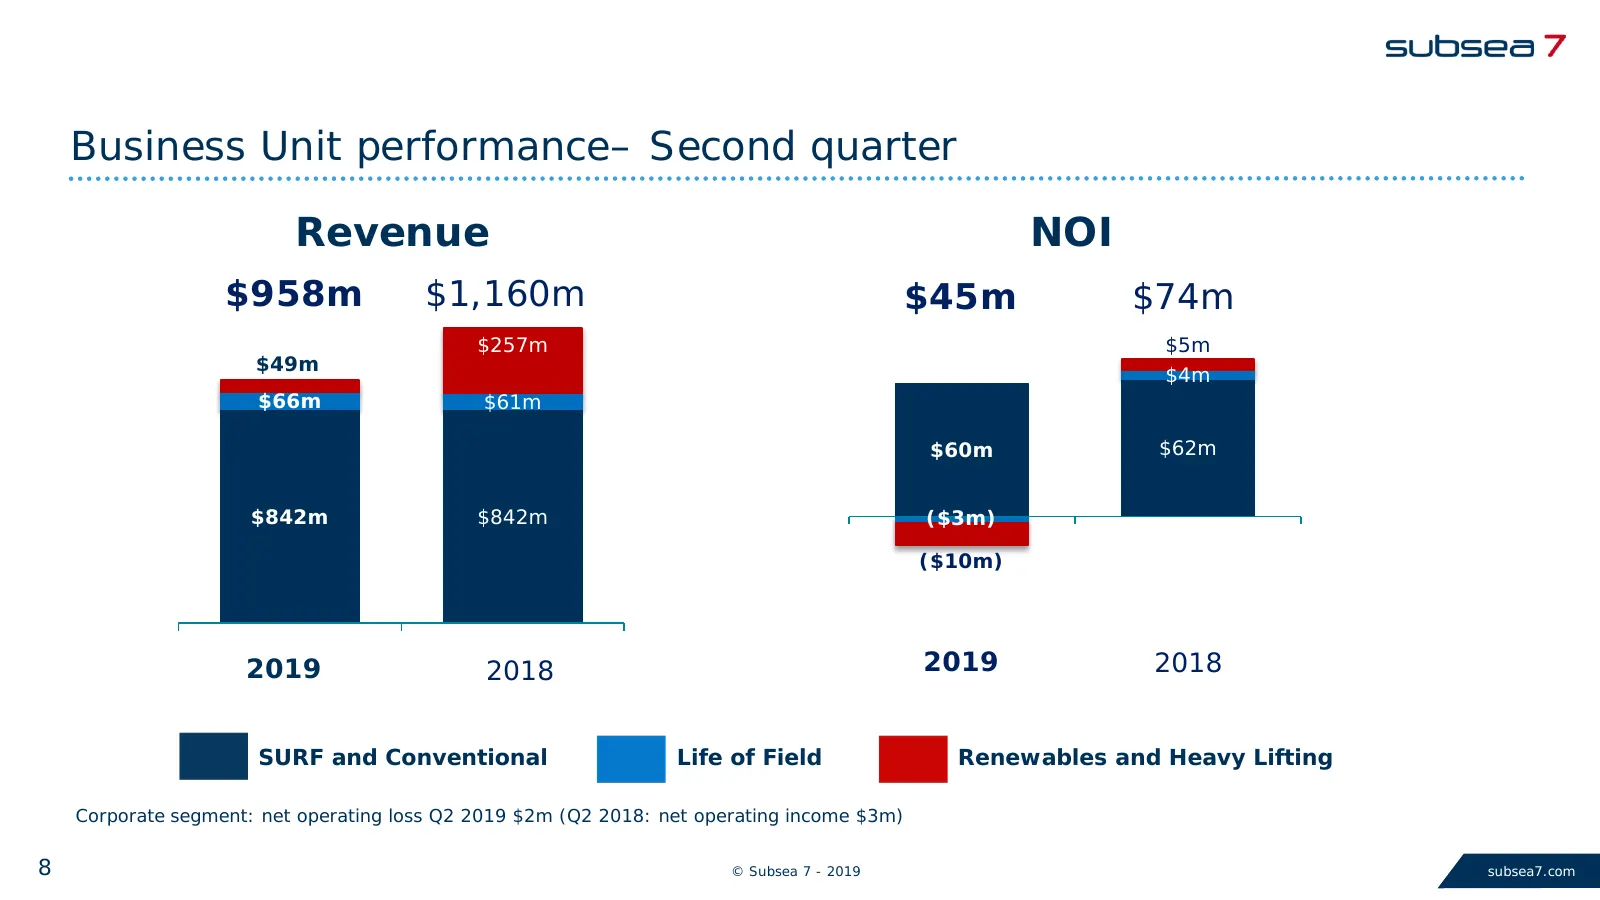
Business Unit performance– Second quarter Revenue NOI $958m $1,160m $45m $74m $257m $5m $49m $4m $66m $61m $60m $62m $842m $842m ($3m) ($10m) 2019 2018 2019 2018 SURF and Conventional Life of Field Renewables and Heavy Lifting Corporate segment: net operating loss Q2 2019 $2m (Q2 2018: net operating
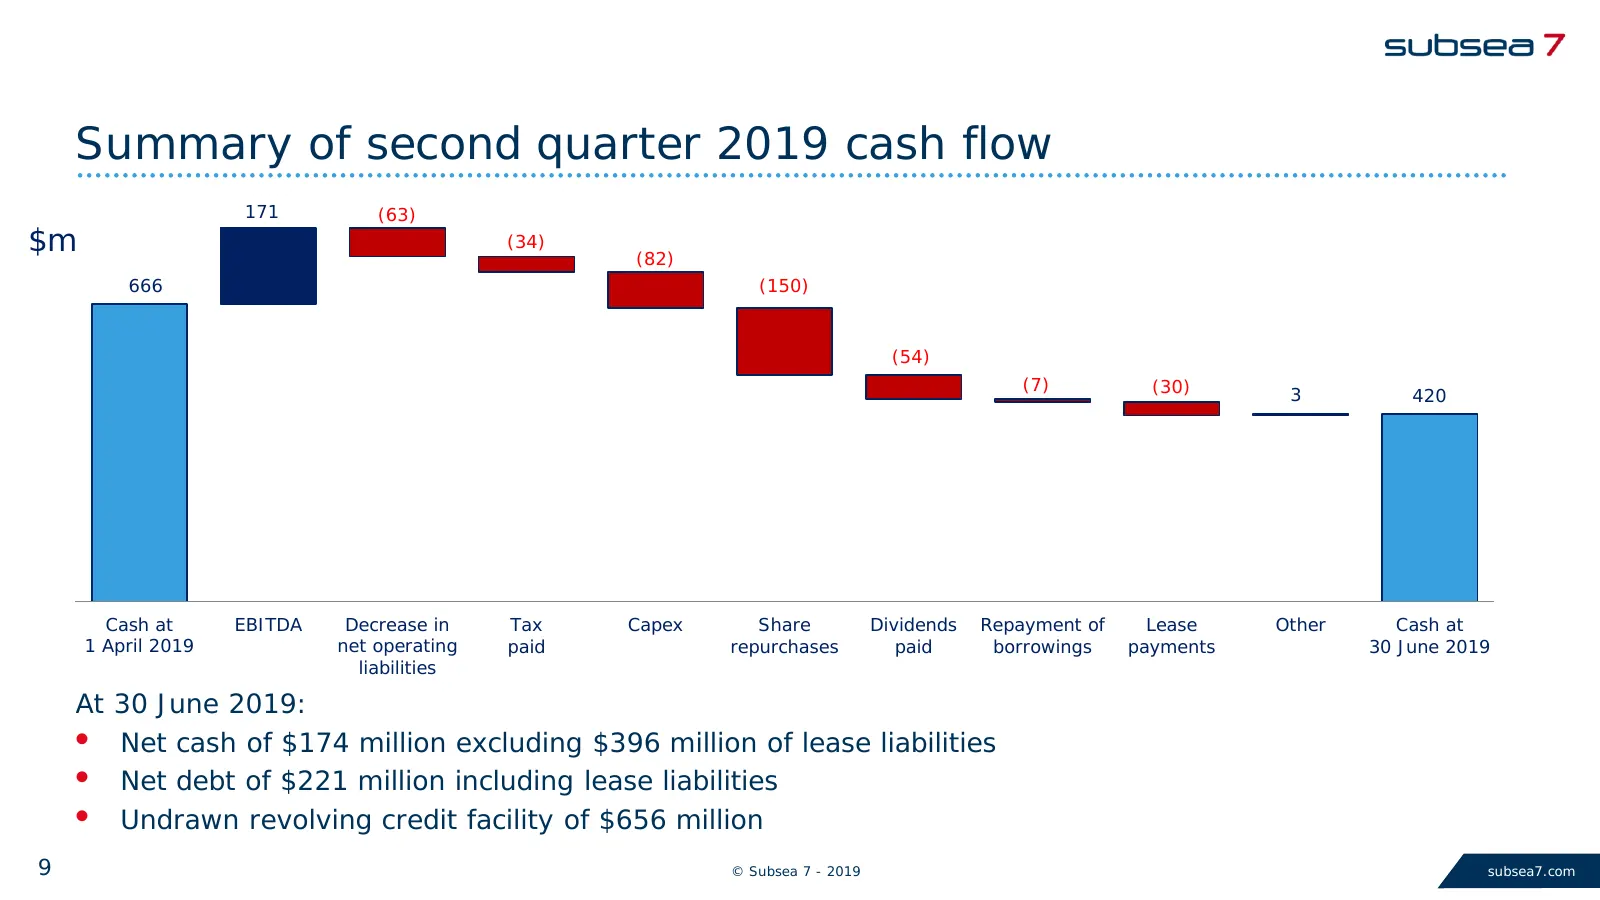
Slide 9: Summary of second quarter 2019 cash flow
Summary of second quarter 2019 cash flow 171 (63) $m (34) (82) 666 (150) (54) (7) (30) 3 420 Cash at EBITDA Decrease in Tax Capex Share Dividends Repayment of Lease Other Cash at 1 April 2019 net operating paid repurchases paid borrowings payments 30 June 2019 liabilities At 30 June 2019: • Net cash
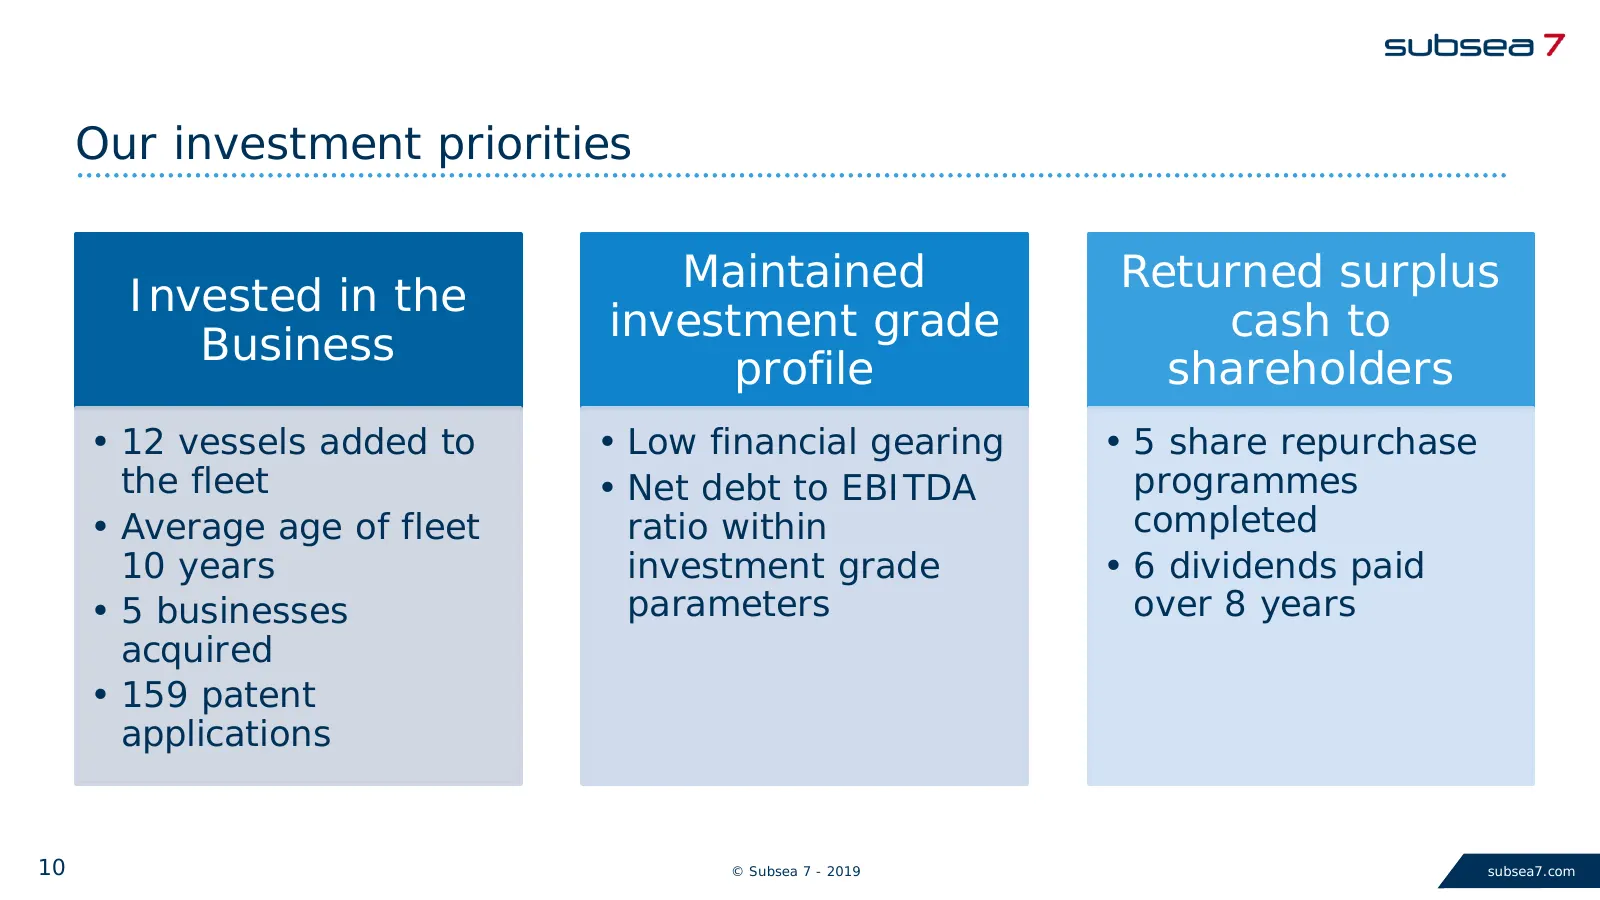
Slide 10: Our investment priorities
Our investment priorities Maintained Returned surplus Invested in the investment grade cash to Business profile shareholders • 12 vessels added to • Low financial gearing • 5 share repurchase the fleet • Net debt to EBITDA programmes • Average age of fleet ratio within completed 10 years investment
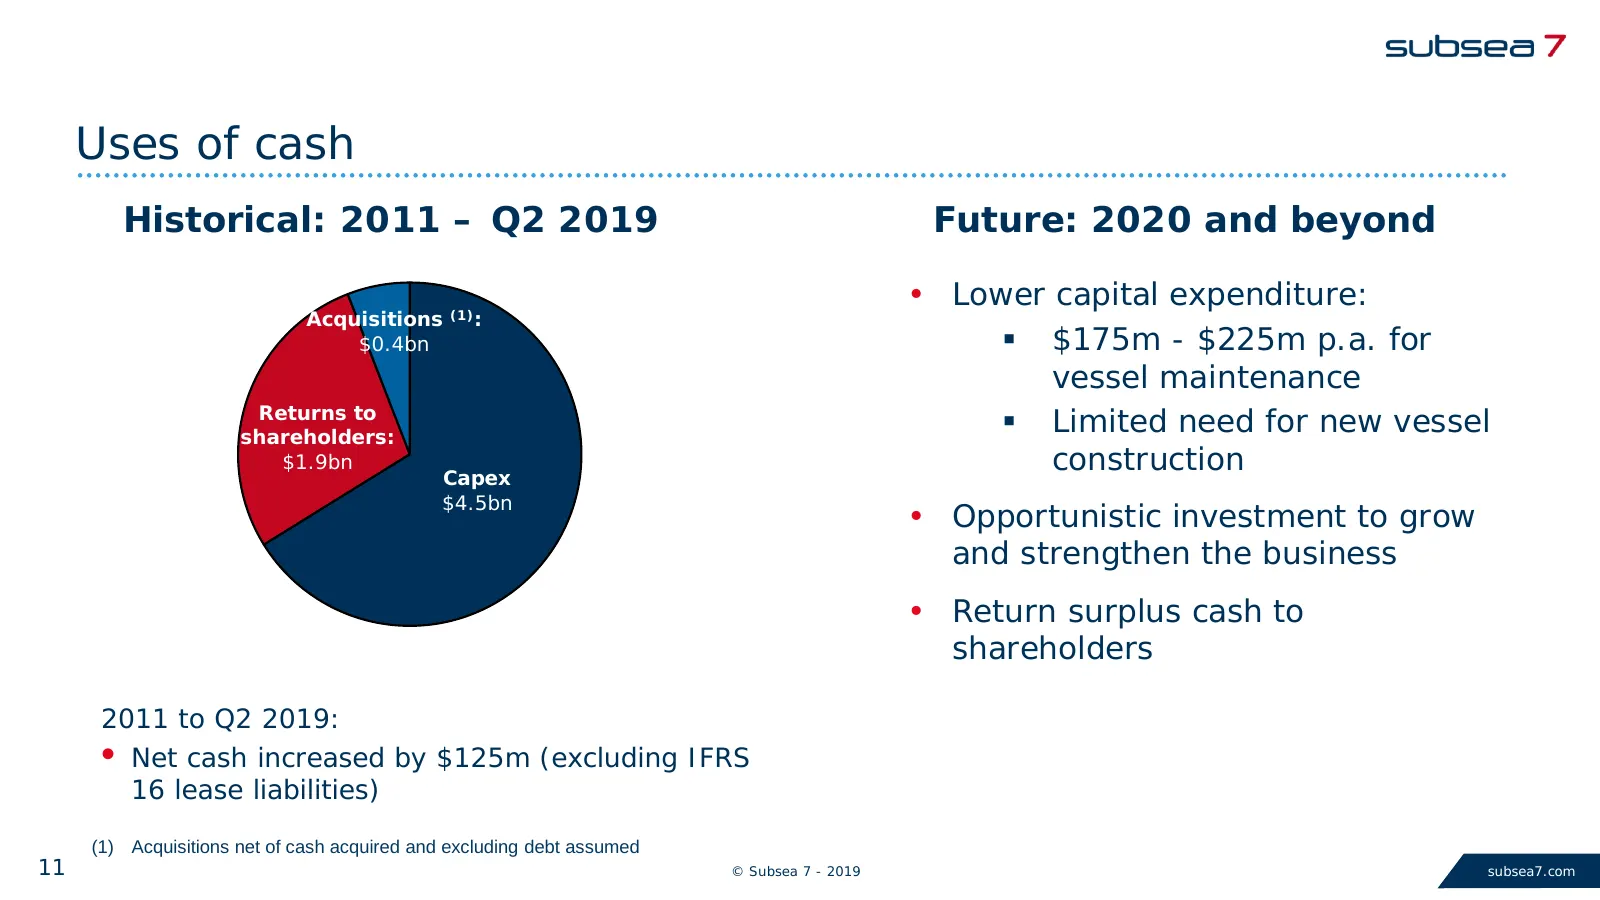
Slide 11: Uses of cash
Uses of cash Historical: 2011 – Q2 2019 Future: 2020 and beyond • Lower capital expenditure: Acquisitions (1): $0.4bn $175m - $225m p.a. for vessel maintenance Returns to shareholders: Limited need for new vessel $1.9bn Capex construction $4.5bn • Opportunistic investment to grow and strengthen
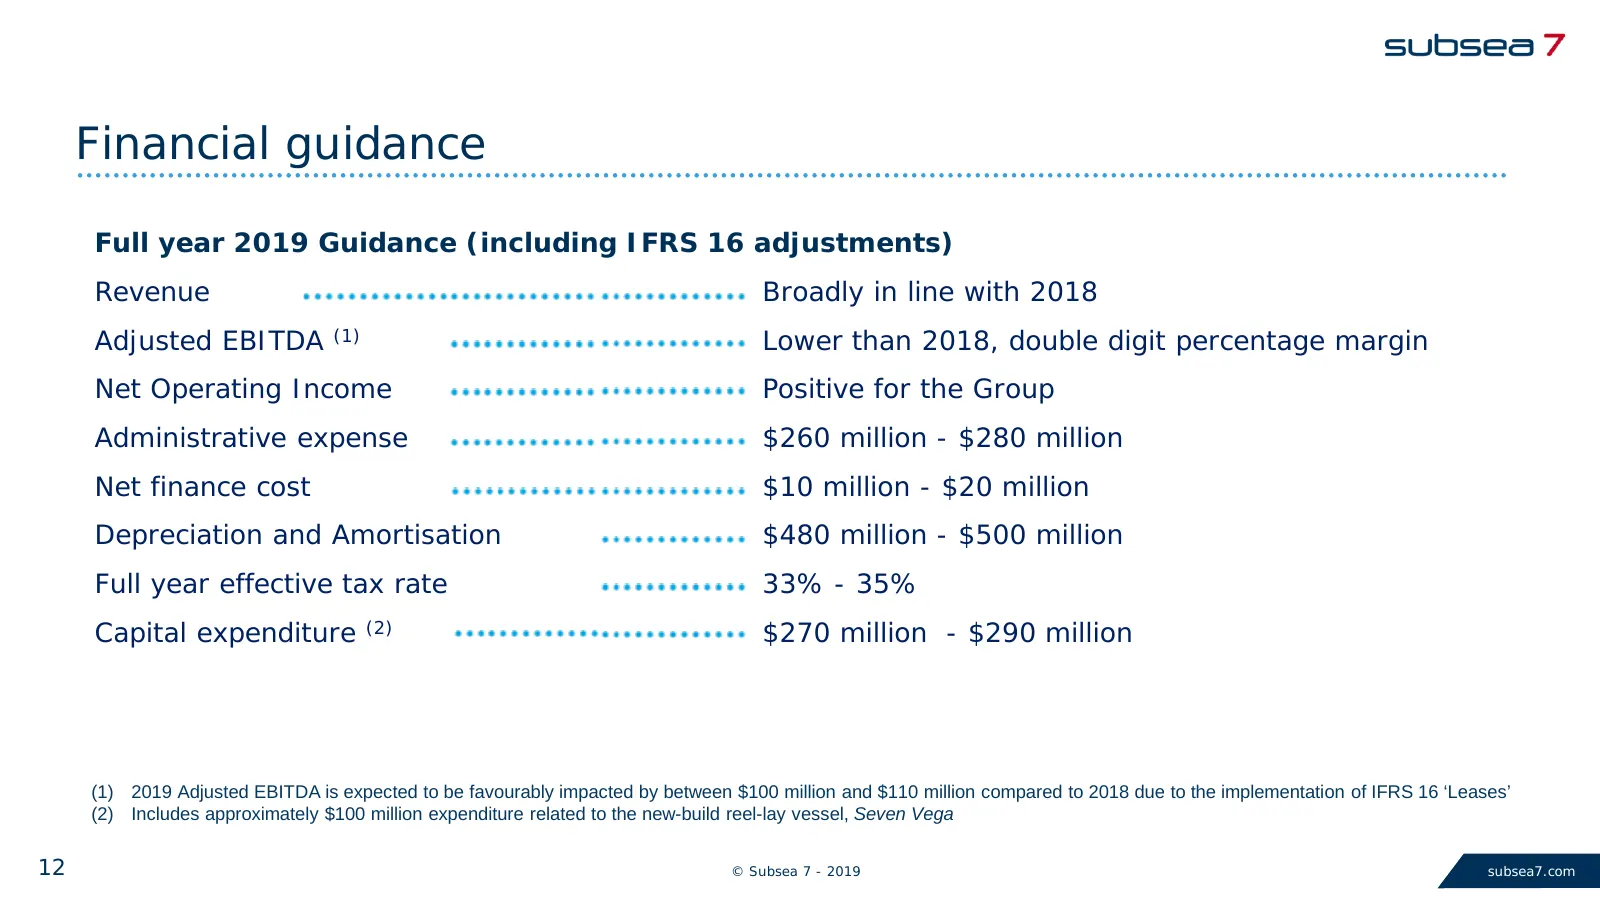
Slide 12: Financial guidance
Financial guidance Full year 2019 Guidance (including IFRS 16 adjustments) Revenue Broadly in line with 2018 Adjusted EBITDA (1) Lower than 2018, double digit percentage margin Net Operating Income Positive for the Group Administrative expense $260 million - $280 million Net finance cost $10 million
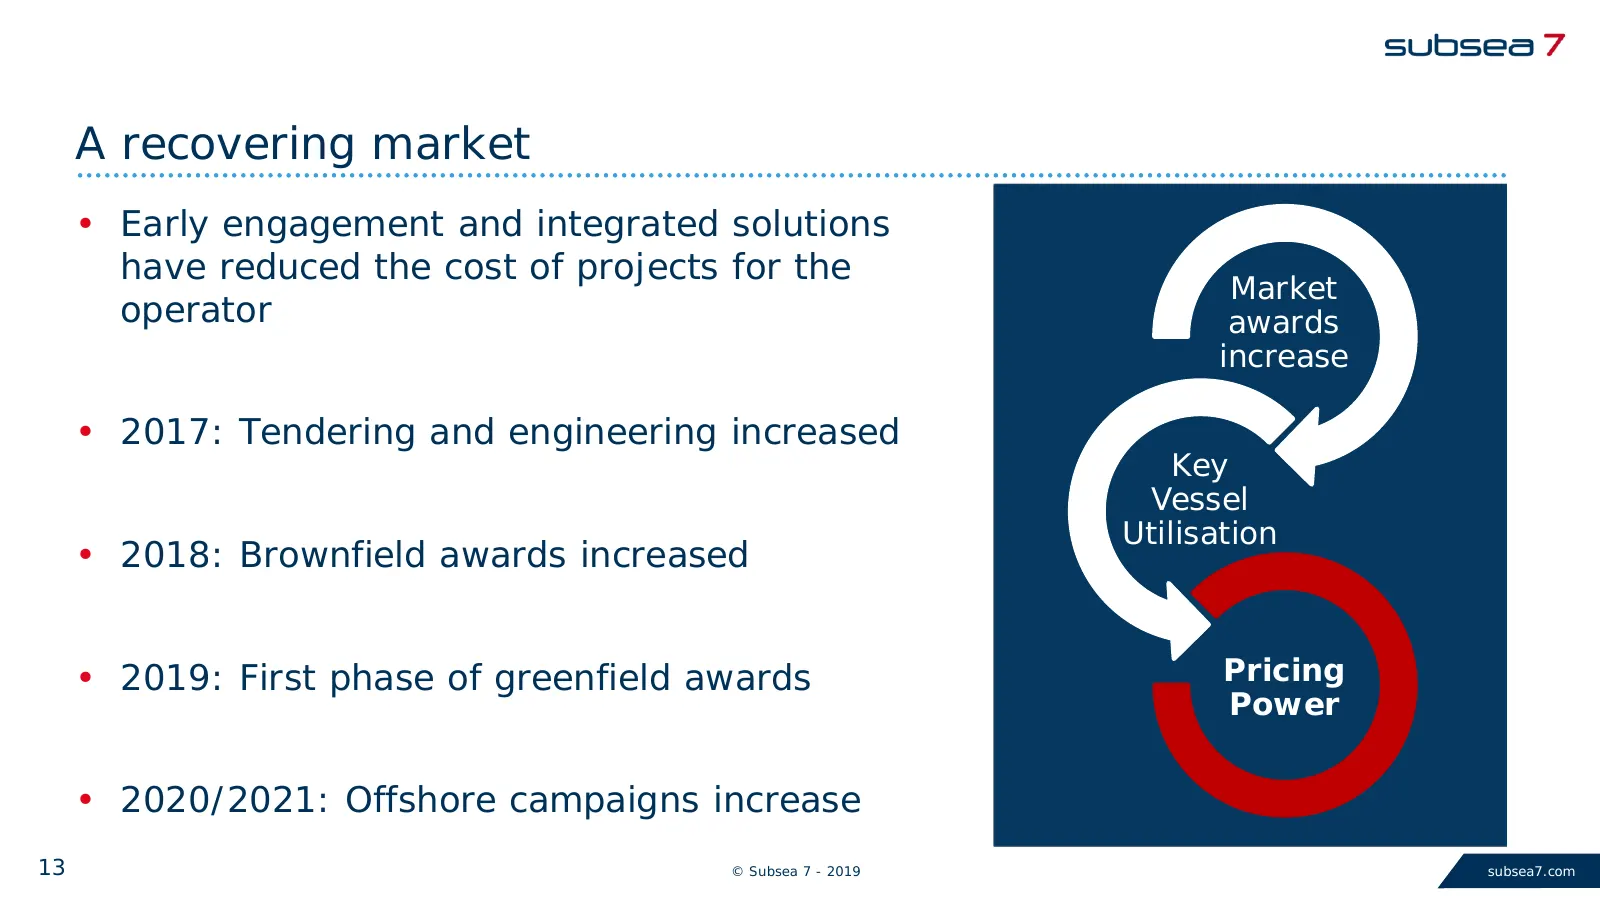
Slide 13: A recovering market
A recovering market • Early engagement and integrated solutions have reduced the cost of projects for the Market operator awards increase • 2017: Tendering and engineering increased Key Vessel Utilisation • 2018: Brownfield awards increased • 2019: First phase of greenfield awards Pricing Power • 20
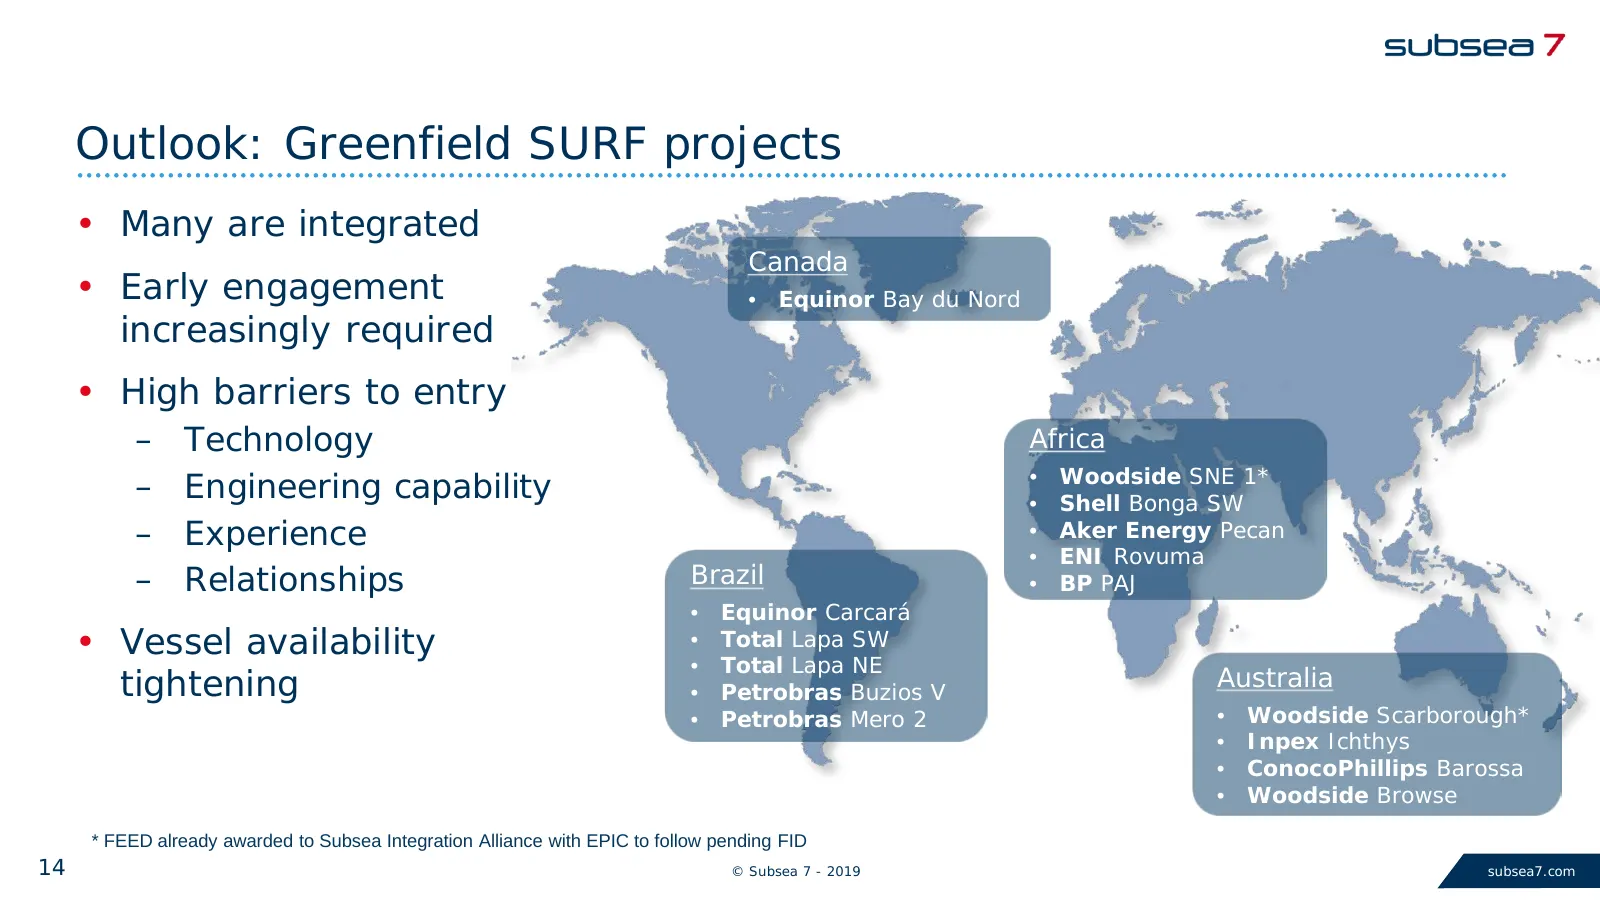
Slide 14: Outlook: Greenfield SURF projects
Outlook: Greenfield SURF projects • Many are integrated Canada • Early engagement • Equinor Bay du Nord increasingly required • High barriers to entry – Technology Africa Woodside SNE 1* – Engineering capability • • Shell Bonga SW – Experience • Aker Energy Pecan • ENI Rovuma – Relationships Brazil
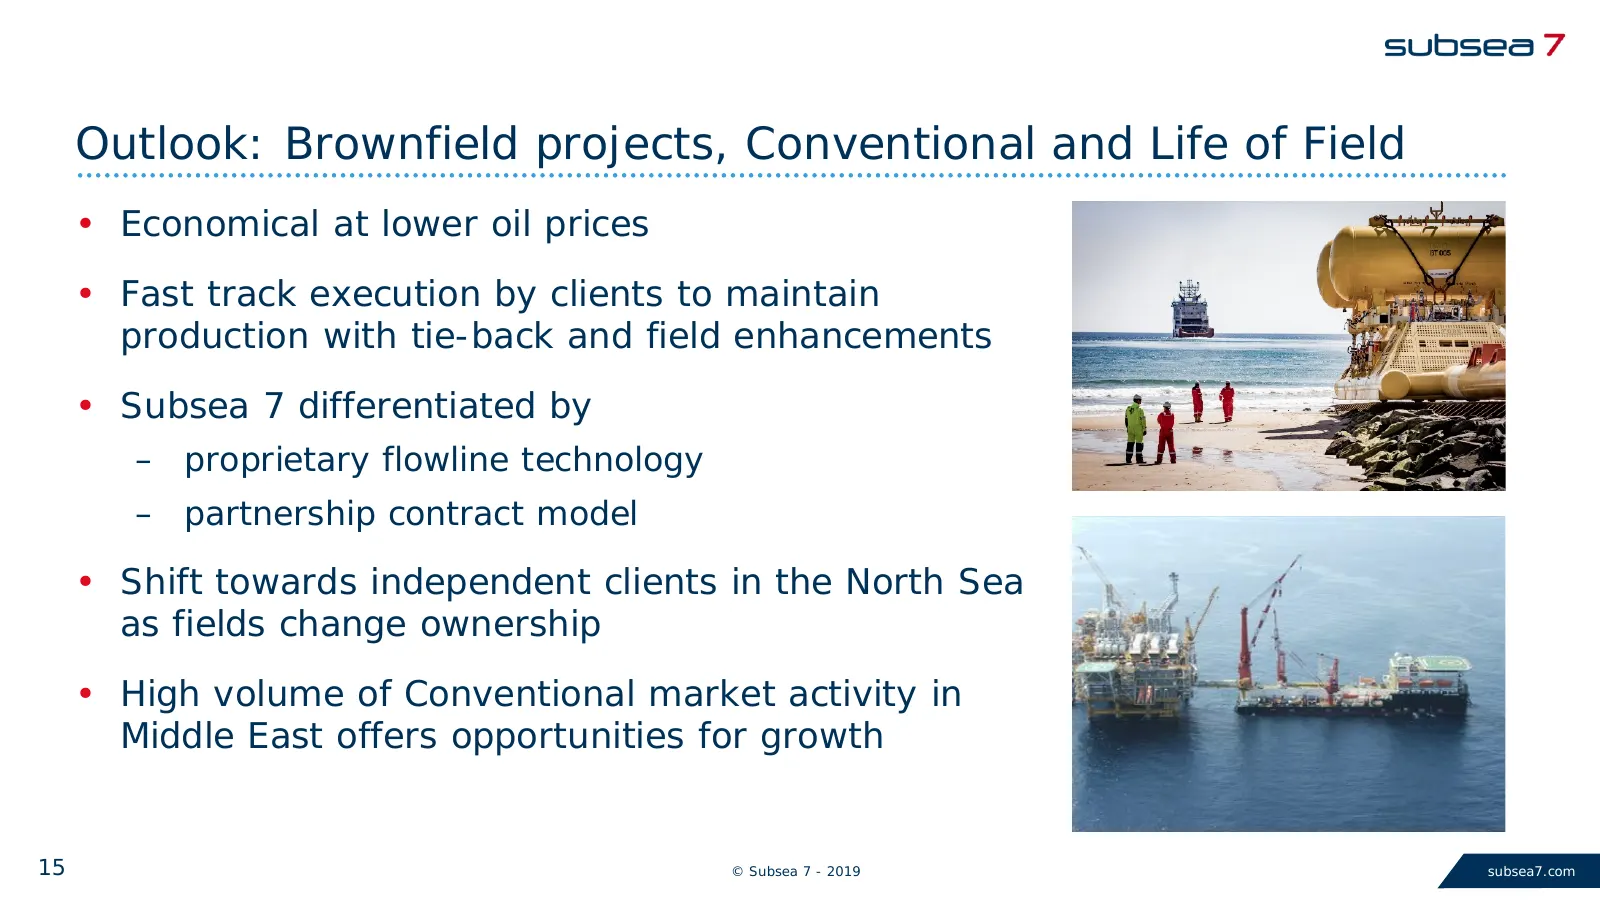
Slide 15: Outlook: Brownfield projects, Conventional and Life of Field
Outlook: Brownfield projects, Conventional and Life of Field • Economical at lower oil prices • Fast track execution by clients to maintain production with tie-back and field enhancements • Subsea 7 differentiated by – proprietary flowline technology – partnership contract model • Shift towards inde
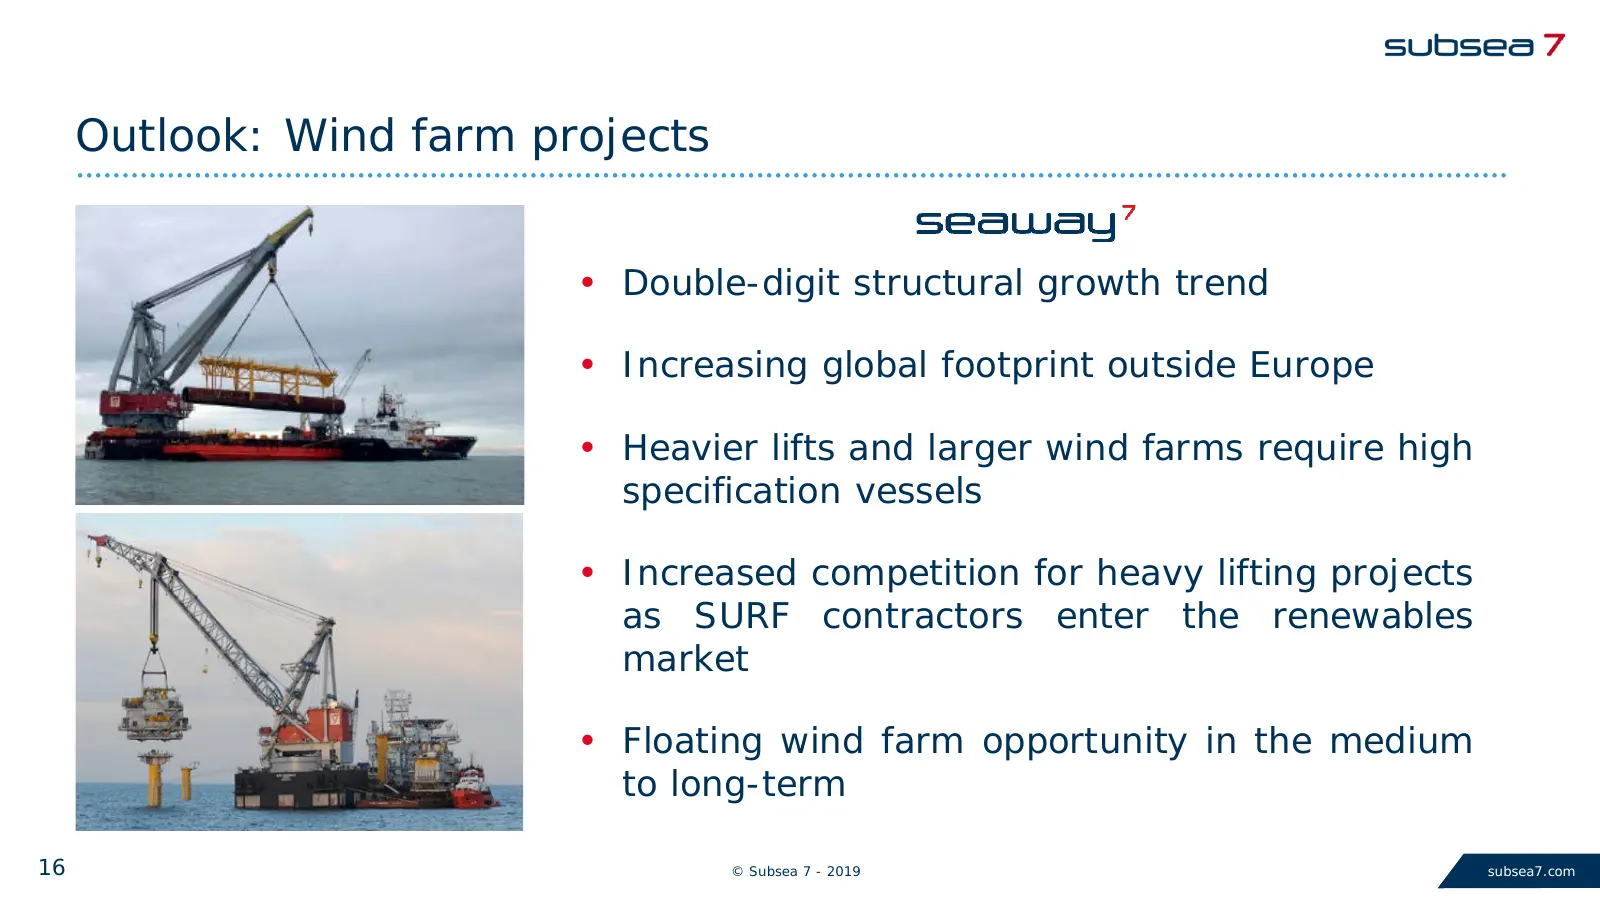
Slide 16: Outlook: Wind farm projects
Outlook: Wind farm projects • Double-digit structural growth trend • Increasing global footprint outside Europe • Heavier lifts and larger wind farms require high specification vessels • Increased competition for heavy lifting projects as SURF contractors enter the renewables market • Floating wind
Slide 17: Summary
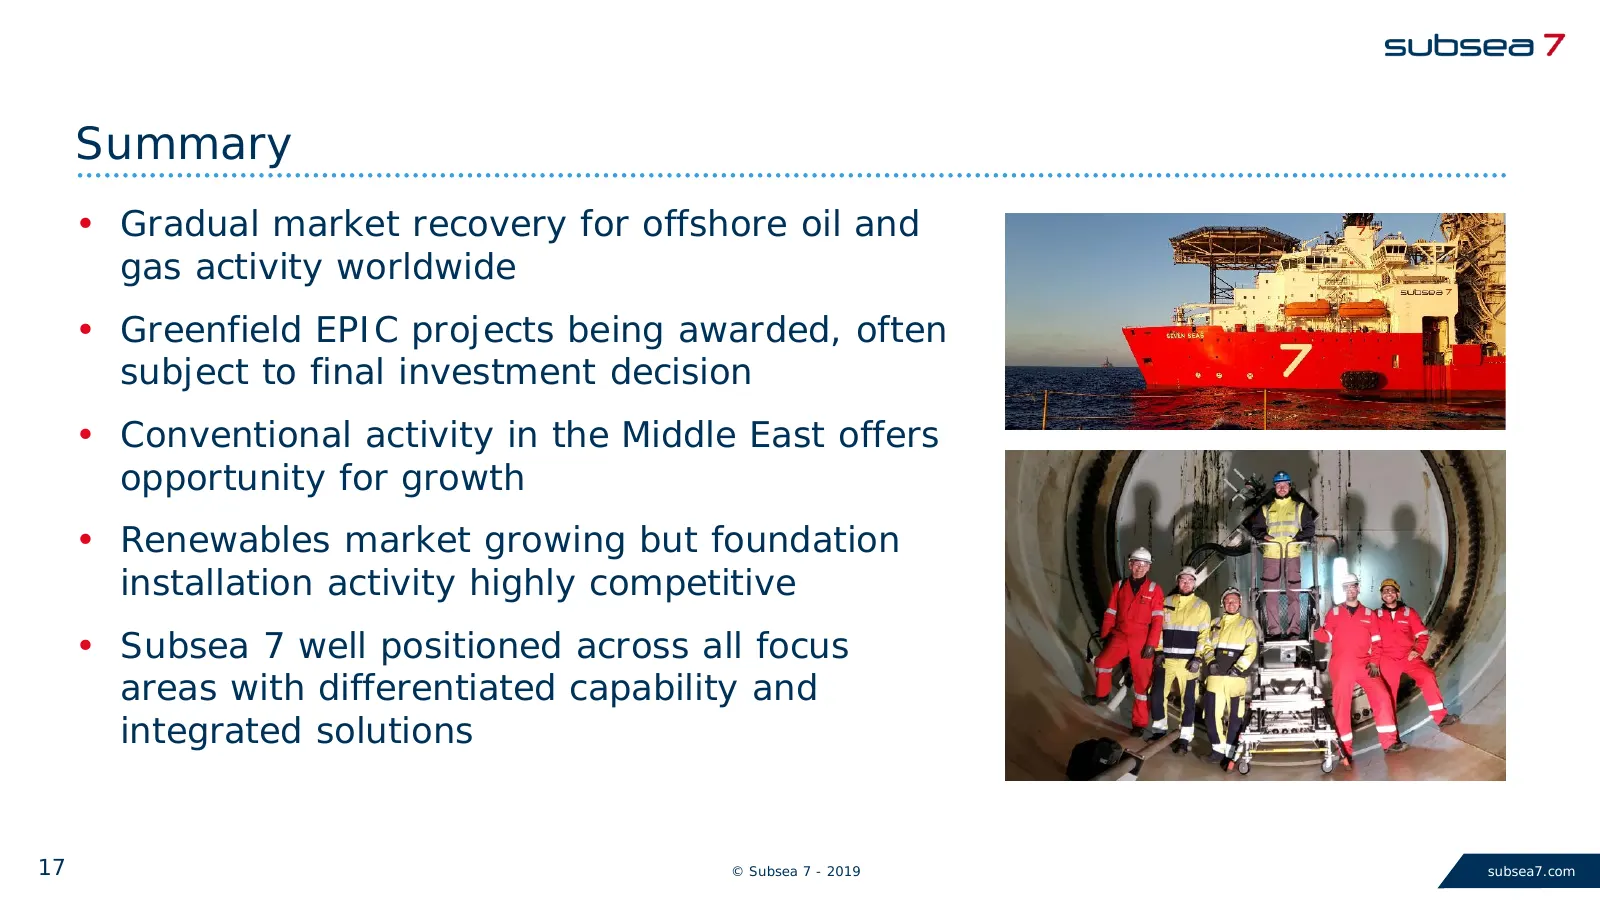
Summary • Gradual market recovery for offshore oil and gas activity worldwide • Greenfield EPIC projects being awarded, often subject to final investment decision • Conventional activity in the Middle East offers opportunity for growth • Renewables market growing but foundation installation activity
Slide 18: © Subsea 7 - 2019 subsea7.com
18 © Subsea 7 - 2019 subsea7.com
Slide 19: Appendix
Appendix Major project progression Track Record Fleet Financial summaries 19 © Subsea 7 - 2019 subsea7.com
Slide 20: Major project progression
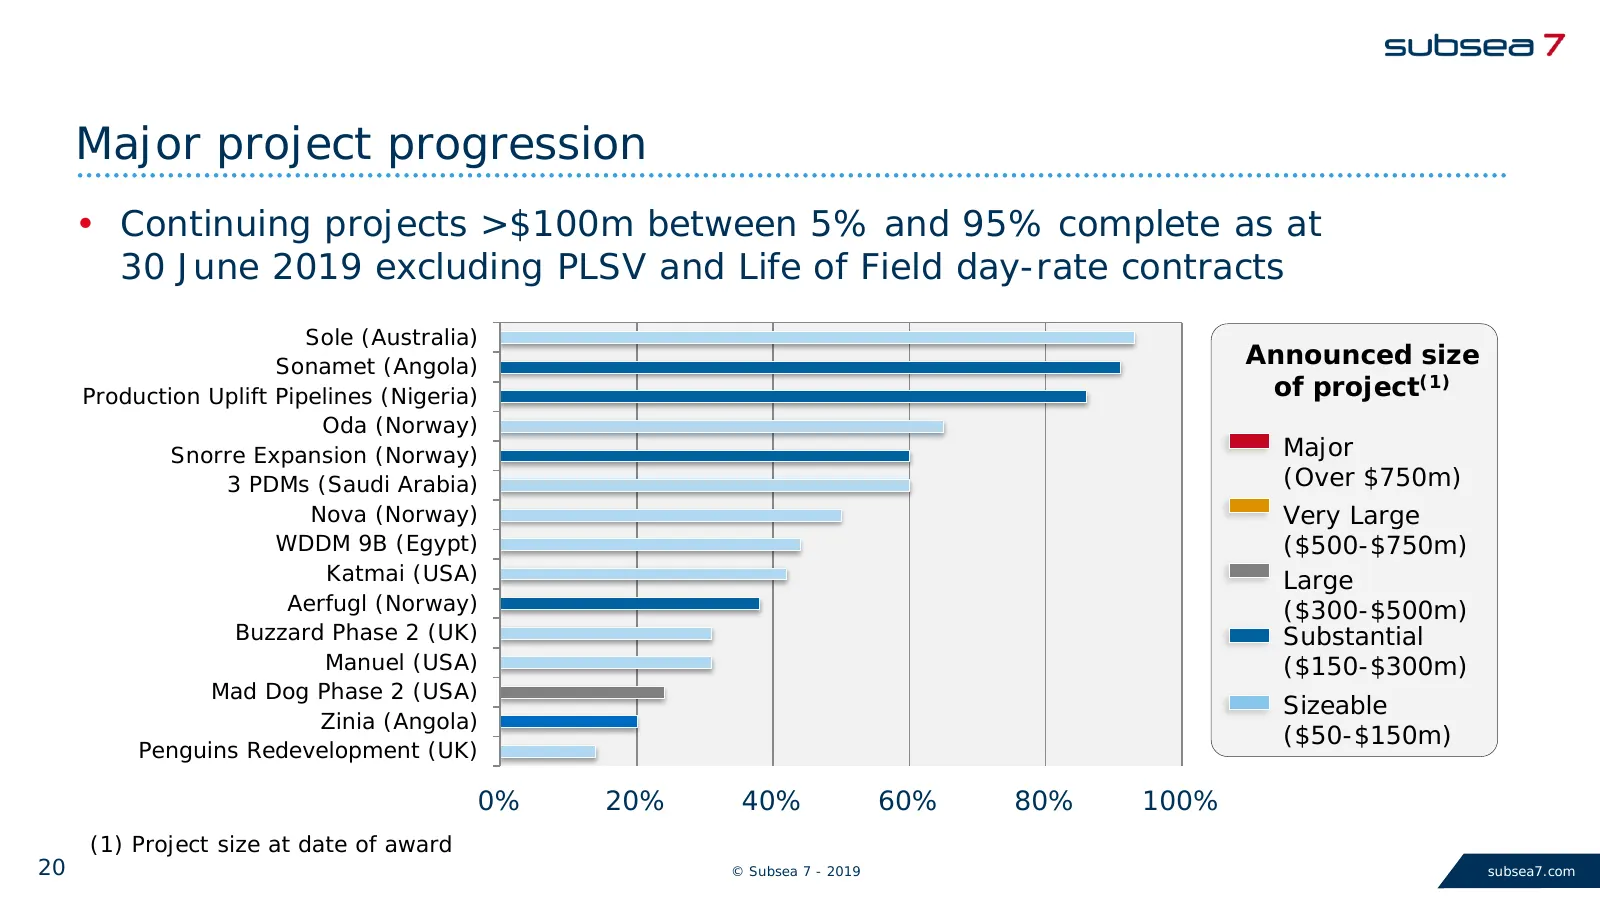
Major project progression • Continuing projects >$100m between 5% and 95% complete as at 30 June 2019 excluding PLSV and Life of Field day-rate contracts Sole (Australia) Sonamet (Angola) Announced size Production Uplift Pipelines (Nigeria) of project(1) Oda (Norway) Snorre Expansion (Norway) Major
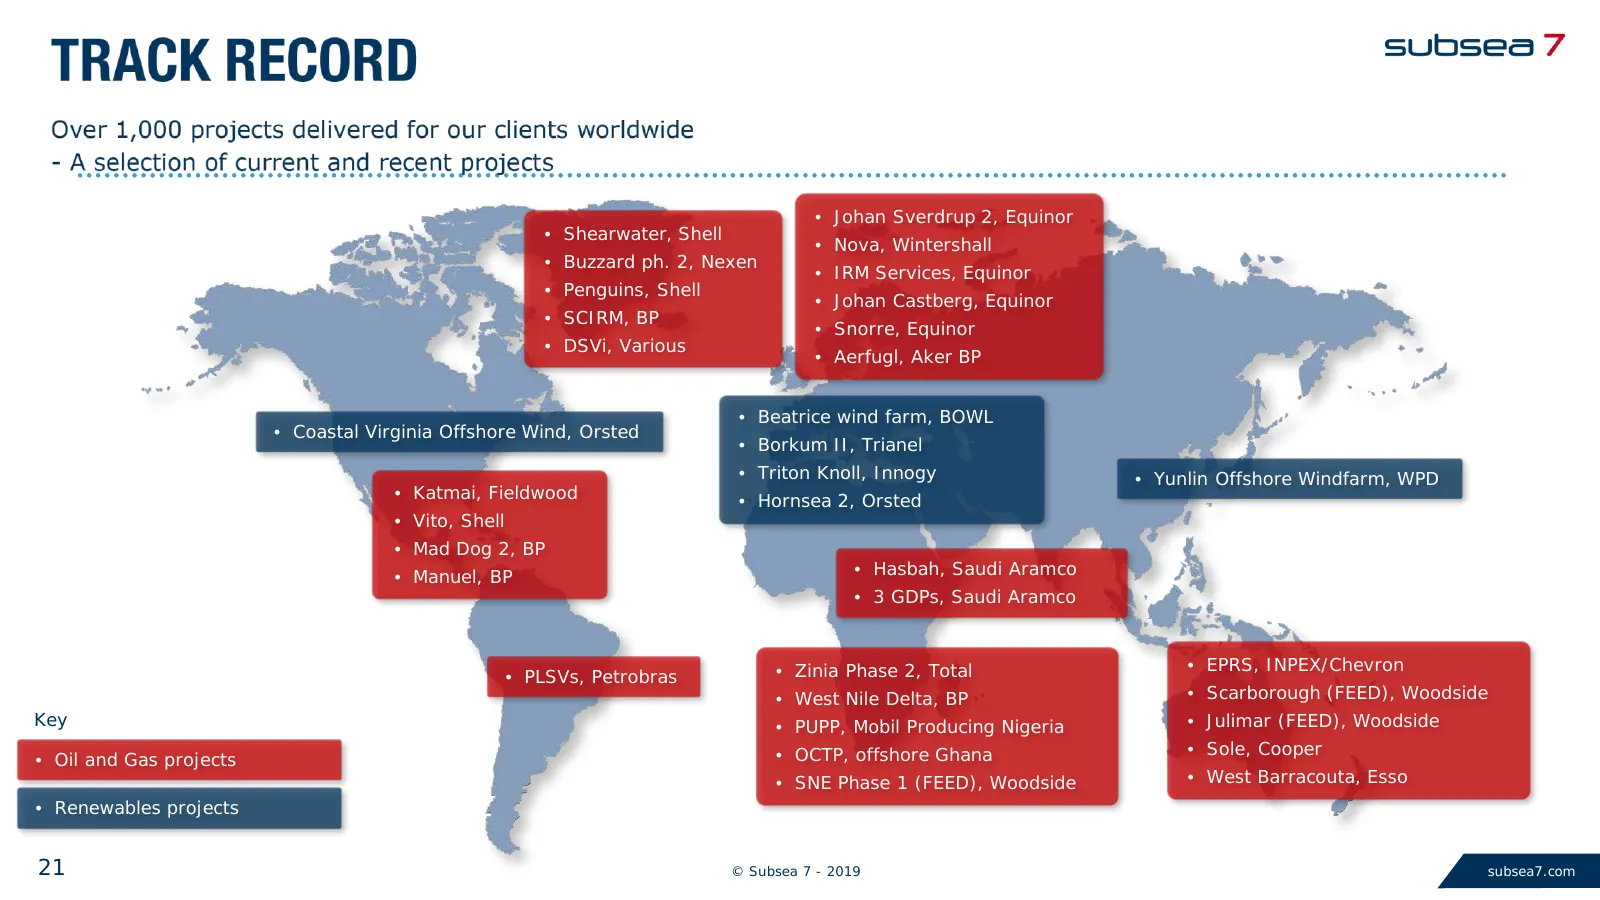
Slide 21: Track record: projects and clients
• Johan Sverdrup 2, Equinor • Shearwater, Shell • Nova, Wintershall • Buzzard ph. 2, Nexen • IRM Services, Equinor • Penguins, Shell • Johan Castberg, Equinor • SCIRM, BP • Snorre, Equinor • DSVi, Various • Aerfugl, Aker BP • Beatrice wind farm, BOWL • Coastal Virginia Offshore Wind, Orsted • Borkum
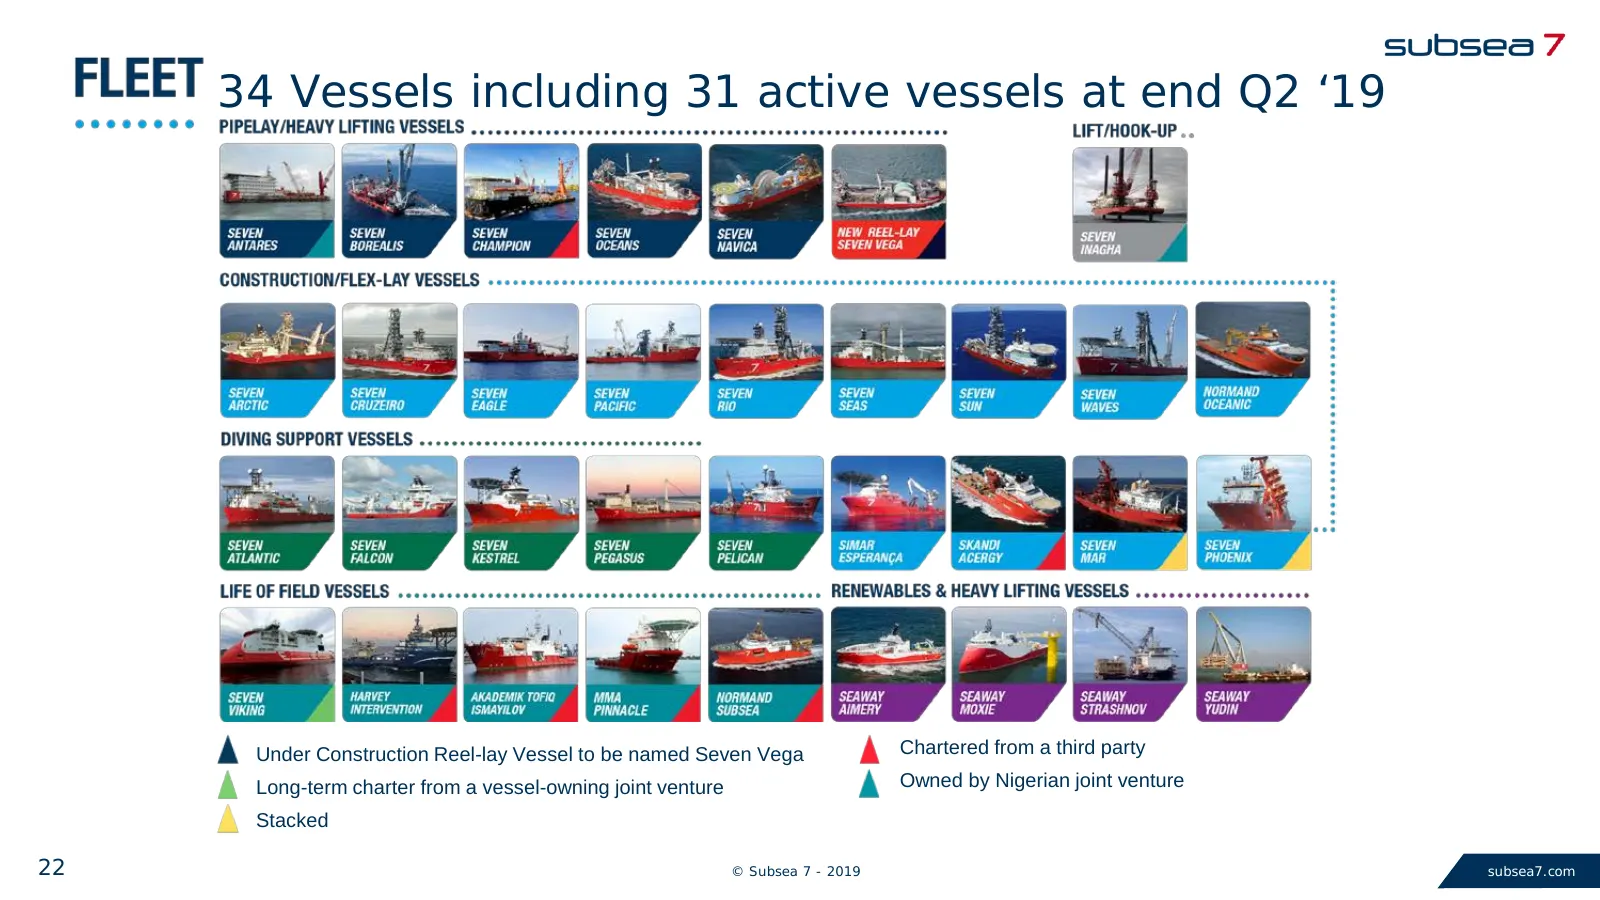
Slide 22: 34 Vessels including 31 active vessels at end Q2 '19
34 Vessels including 31 active vessels at end Q2 ‘19 Under Construction Reel-lay Vessel to be named Seven Vega Chartered from a third party Long-term charter from a vessel-owning joint venture Owned by Nigerian joint venture Stacked 22 © Subsea 7 - 2019 subsea7.com
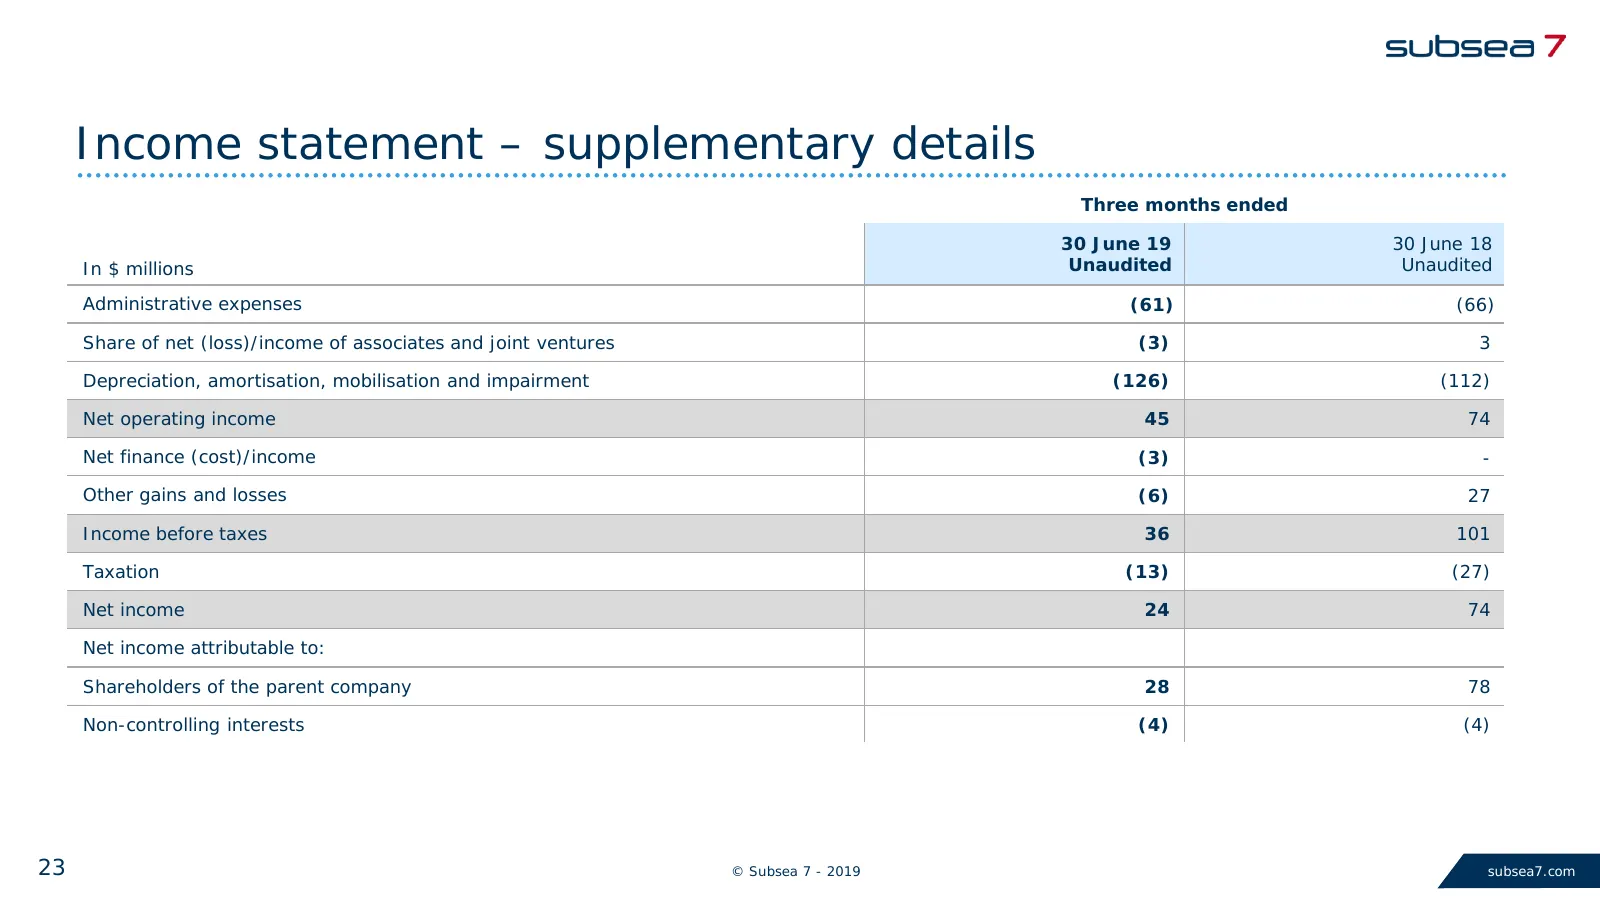
Slide 23: Income statement – supplementary details
Income statement – supplementary details Three months ended 30 June 19 30 June 18 In $ millions Unaudited Unaudited Administrative expenses (61) (66) Share of net (loss)/income of associates and joint ventures (3) 3 Depreciation, amortisation, mobilisation and impairment (126) (112) Net operating in
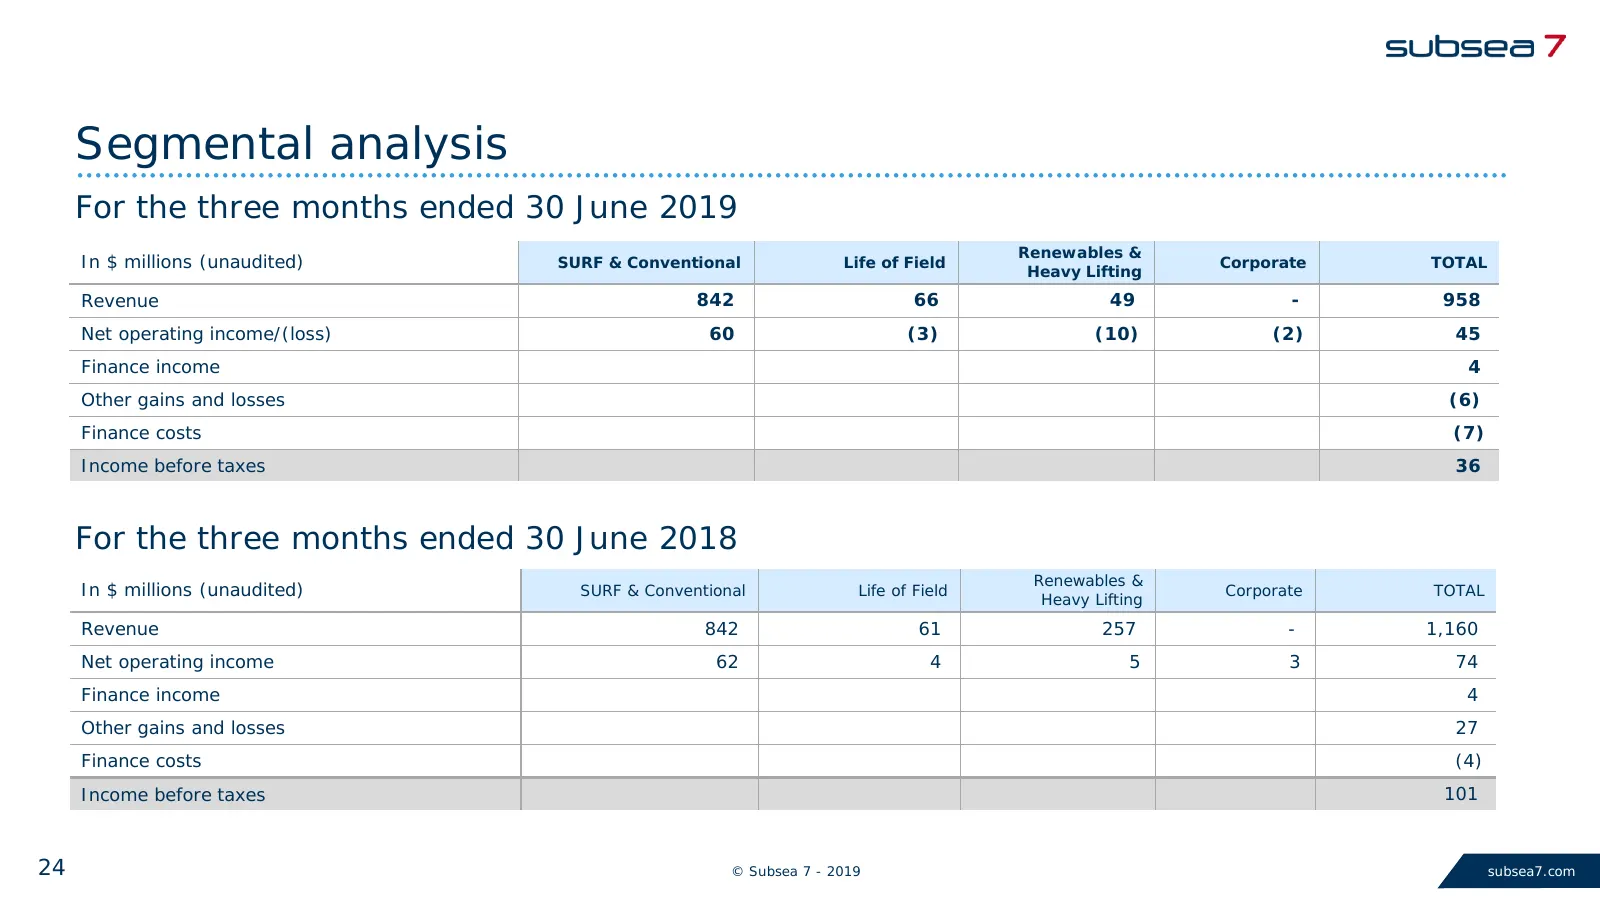
Slide 24: Segmental analysis
Segmental analysis For the three months ended 30 June 2019 Renewables & In $ millions (unaudited) SURF & Conventional Life of Field Heavy Lifting Corporate TOTAL Revenue 842 66 49 - 958 Net operating income/(loss) 60 (3) (10) (2) 45 Finance income 4 Other gains and losses (6) Finance costs (7) Incom
Slide 25: Summary balance sheet
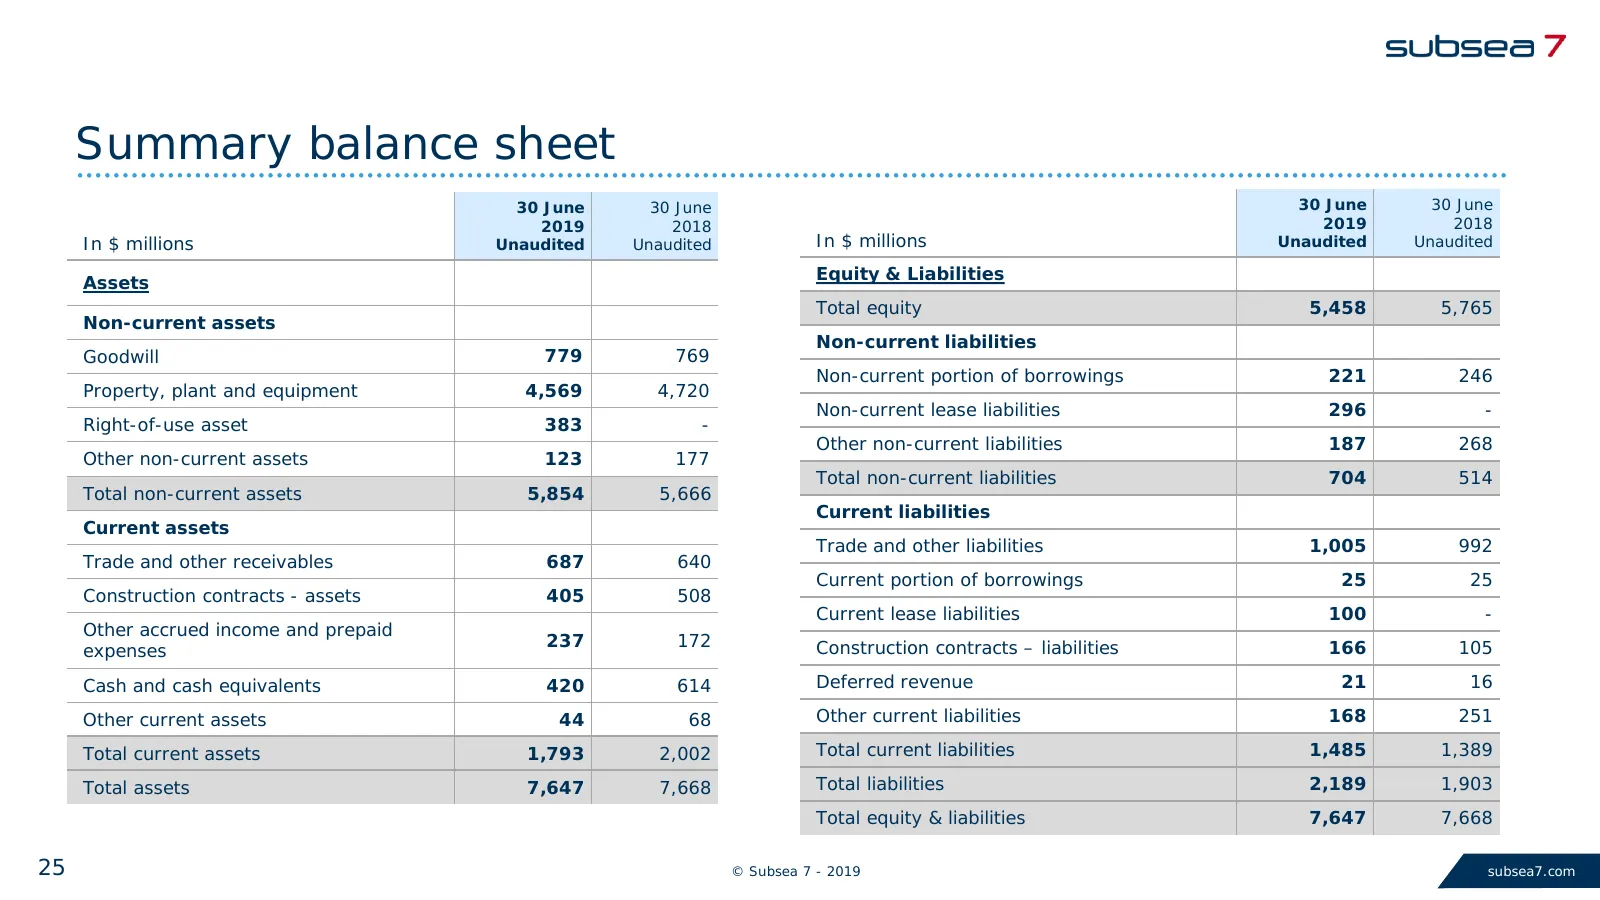
Summary balance sheet 30 June 30 June 30 June 30 June 2019 2018 2019 2018 In $ millions Unaudited Unaudited In $ millions Unaudited Unaudited Assets Equity & Liabilities Total equity 5,458 5,765 Non-current assets Non-current liabilities Goodwill 779 769 Non-current portion of borrowings 221 246 Pro
Slide 26: Reconciliation of Adjusted EBITDA
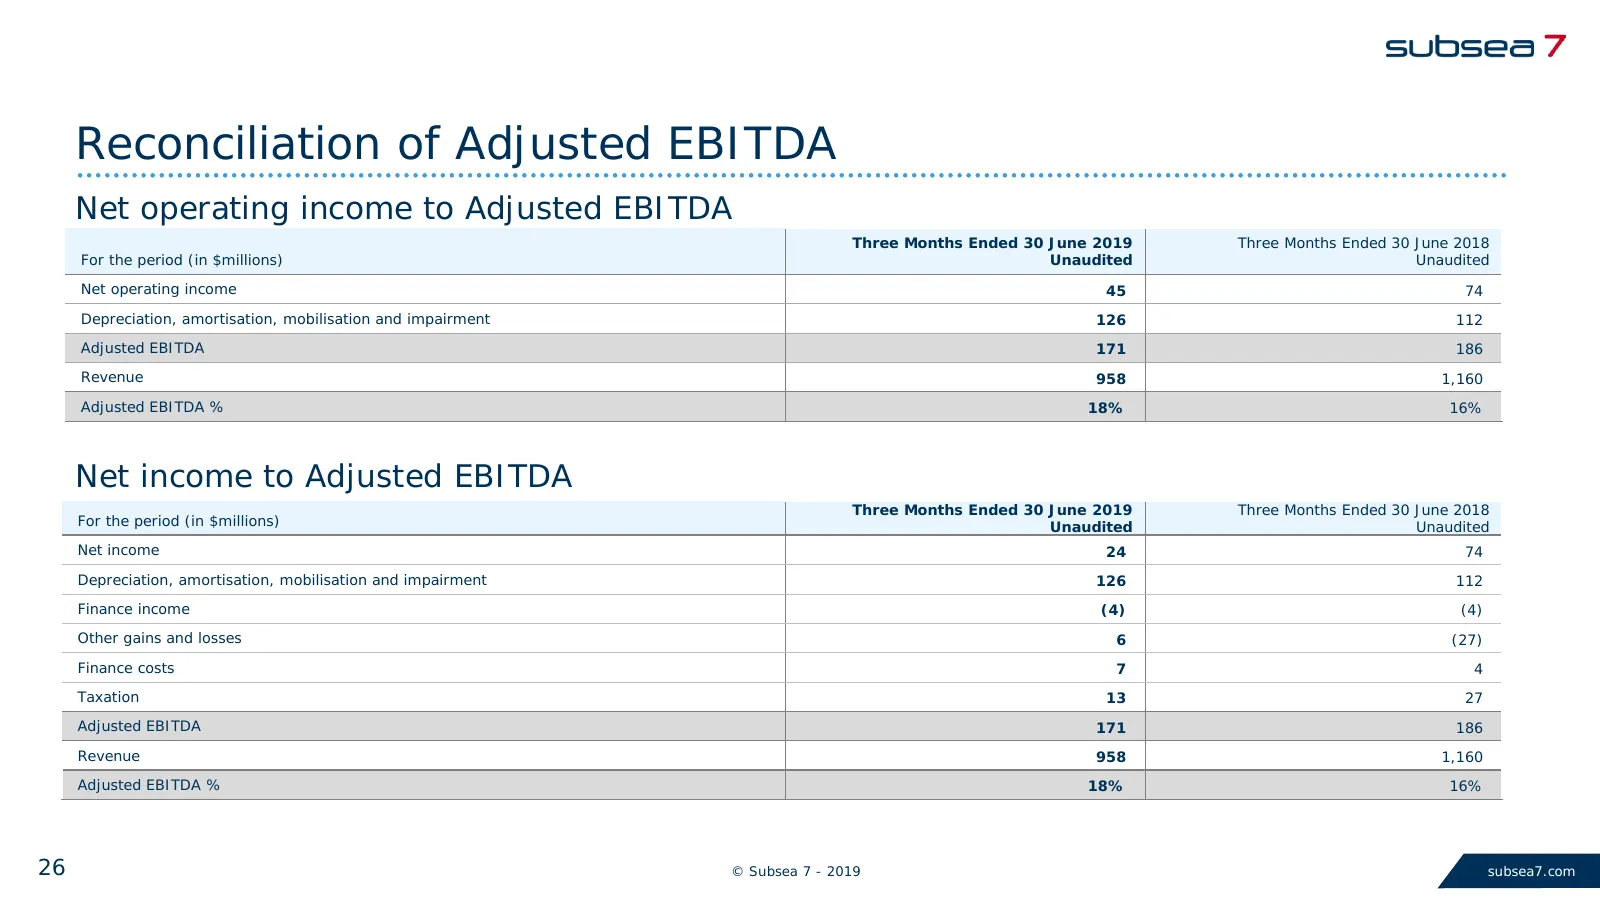
Reconciliation of Adjusted EBITDA Net operating income to Adjusted EBITDA Three Months Ended 30 June 2019 Three Months Ended 30 June 2018 For the period (in $millions) Unaudited Unaudited Net operating income 45 74 Depreciation, amortisation, mobilisation and impairment 126 112 Adjusted EBITDA 171 1
Slide 27: Summary of first half 2019 cash flow
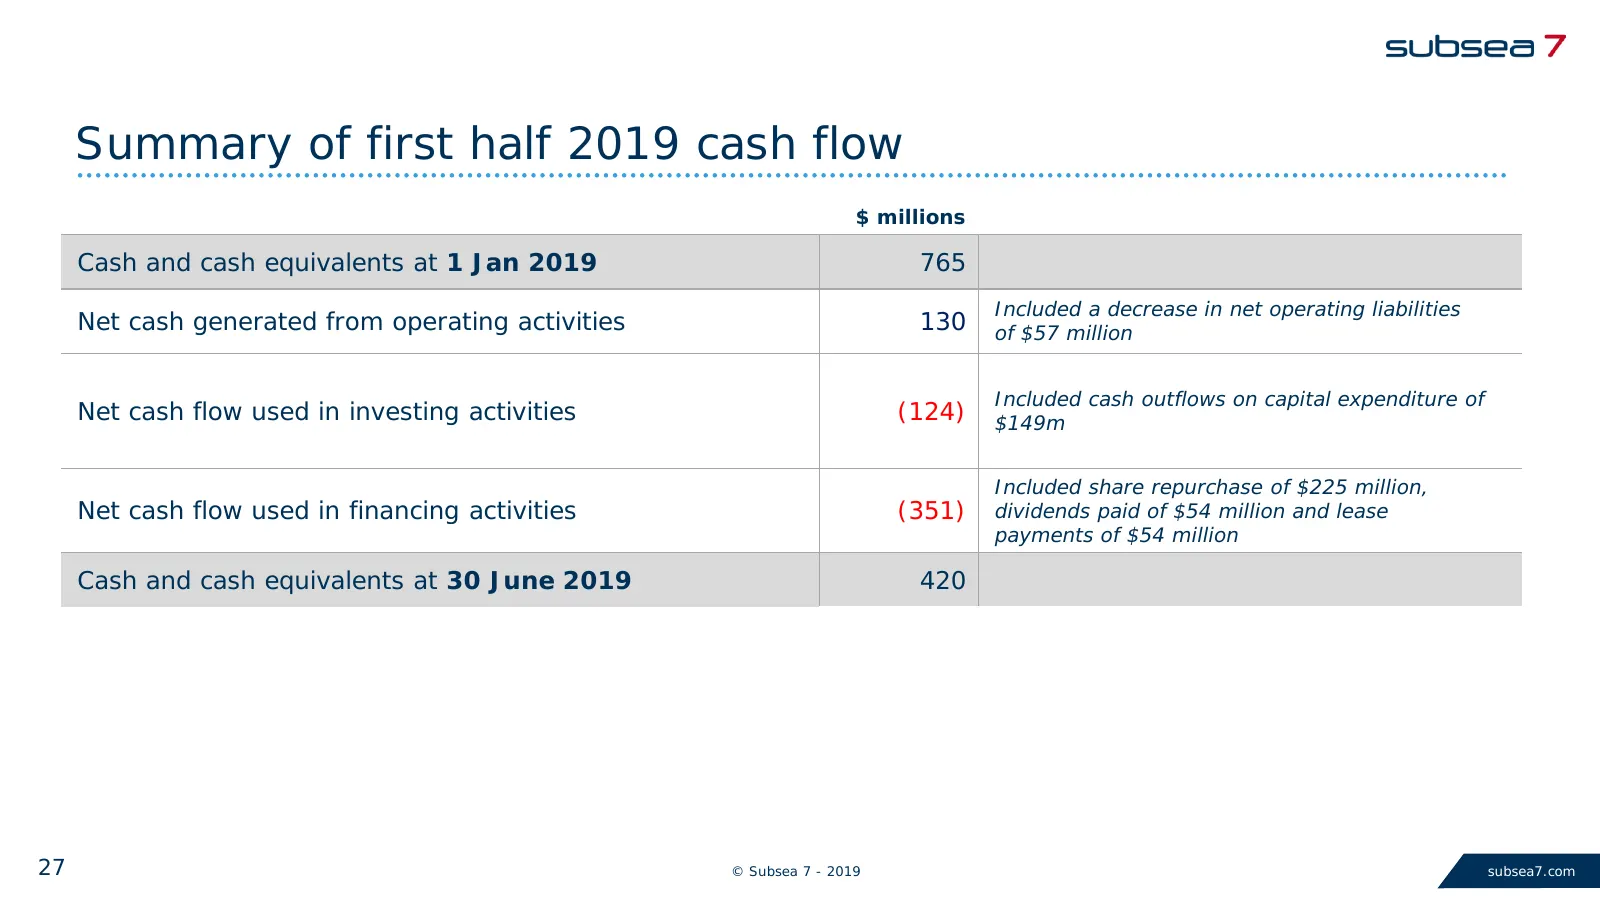
Summary of first half 2019 cash flow $ millions Cash and cash equivalents at 1 Jan 2019 765 Included a decrease in net operating liabilities Net cash generated from operating activities 130 of $57 million Included cash outflows on capital expenditure of Net cash flow used in investing activities (12
Slide 28: Contact: Isabel Green, Investor Relations Director
Contact: Isabel Green, Investor Relations Director eMail: isabel.green@subsea7.com Direct Line +44 20 8210 5568 Website www.subsea7.com 28 © Subsea 7 - 2019 subsea7.com
Source: Internet Archive copy of subsea7.com
More decks from Subsea 7 S.A.
 Q2 2026 Earnings Presentation17 slides · Jul 30, 2026
 Q1 2026 Earnings Presentation20 slides · Apr 30, 2026
 Q4 2025 Earnings Presentation17 slides · Feb 26, 2026
 Q3 2025 Earnings Presentation18 slides · Nov 20, 2025
 Q2 2025 Earnings Presentation18 slides · Jul 31, 2025
 Merger or Acquisition (July 2025)21 slides · Jul 24, 2025