Dynegy — Non-Deal Roadshow (April 2008)
40 slides from Dynegy's roadshow presentation, Apr 22, 2008
Slide 1: Positioned to Deliver Growth & Enhanced Stockholder Value
Positioned to Deliver Growth & Enhanced Stockholder Value Marketing Meetings April 2008 Investor & Public Relations | Norelle Lundy, Vice President | Nir Grossman, Senior Director | 713-507-6466 | ir@dynegy.com
Slide 2: Forward-looking Statements
Forward-looking Statements This presentation contains statements reflecting assumptions, expectations, projections, intentions or beliefs about future events that are intended as “forward- looking statements.” You can identify these statements, including those relating to Dynegy’s 2008 financial est
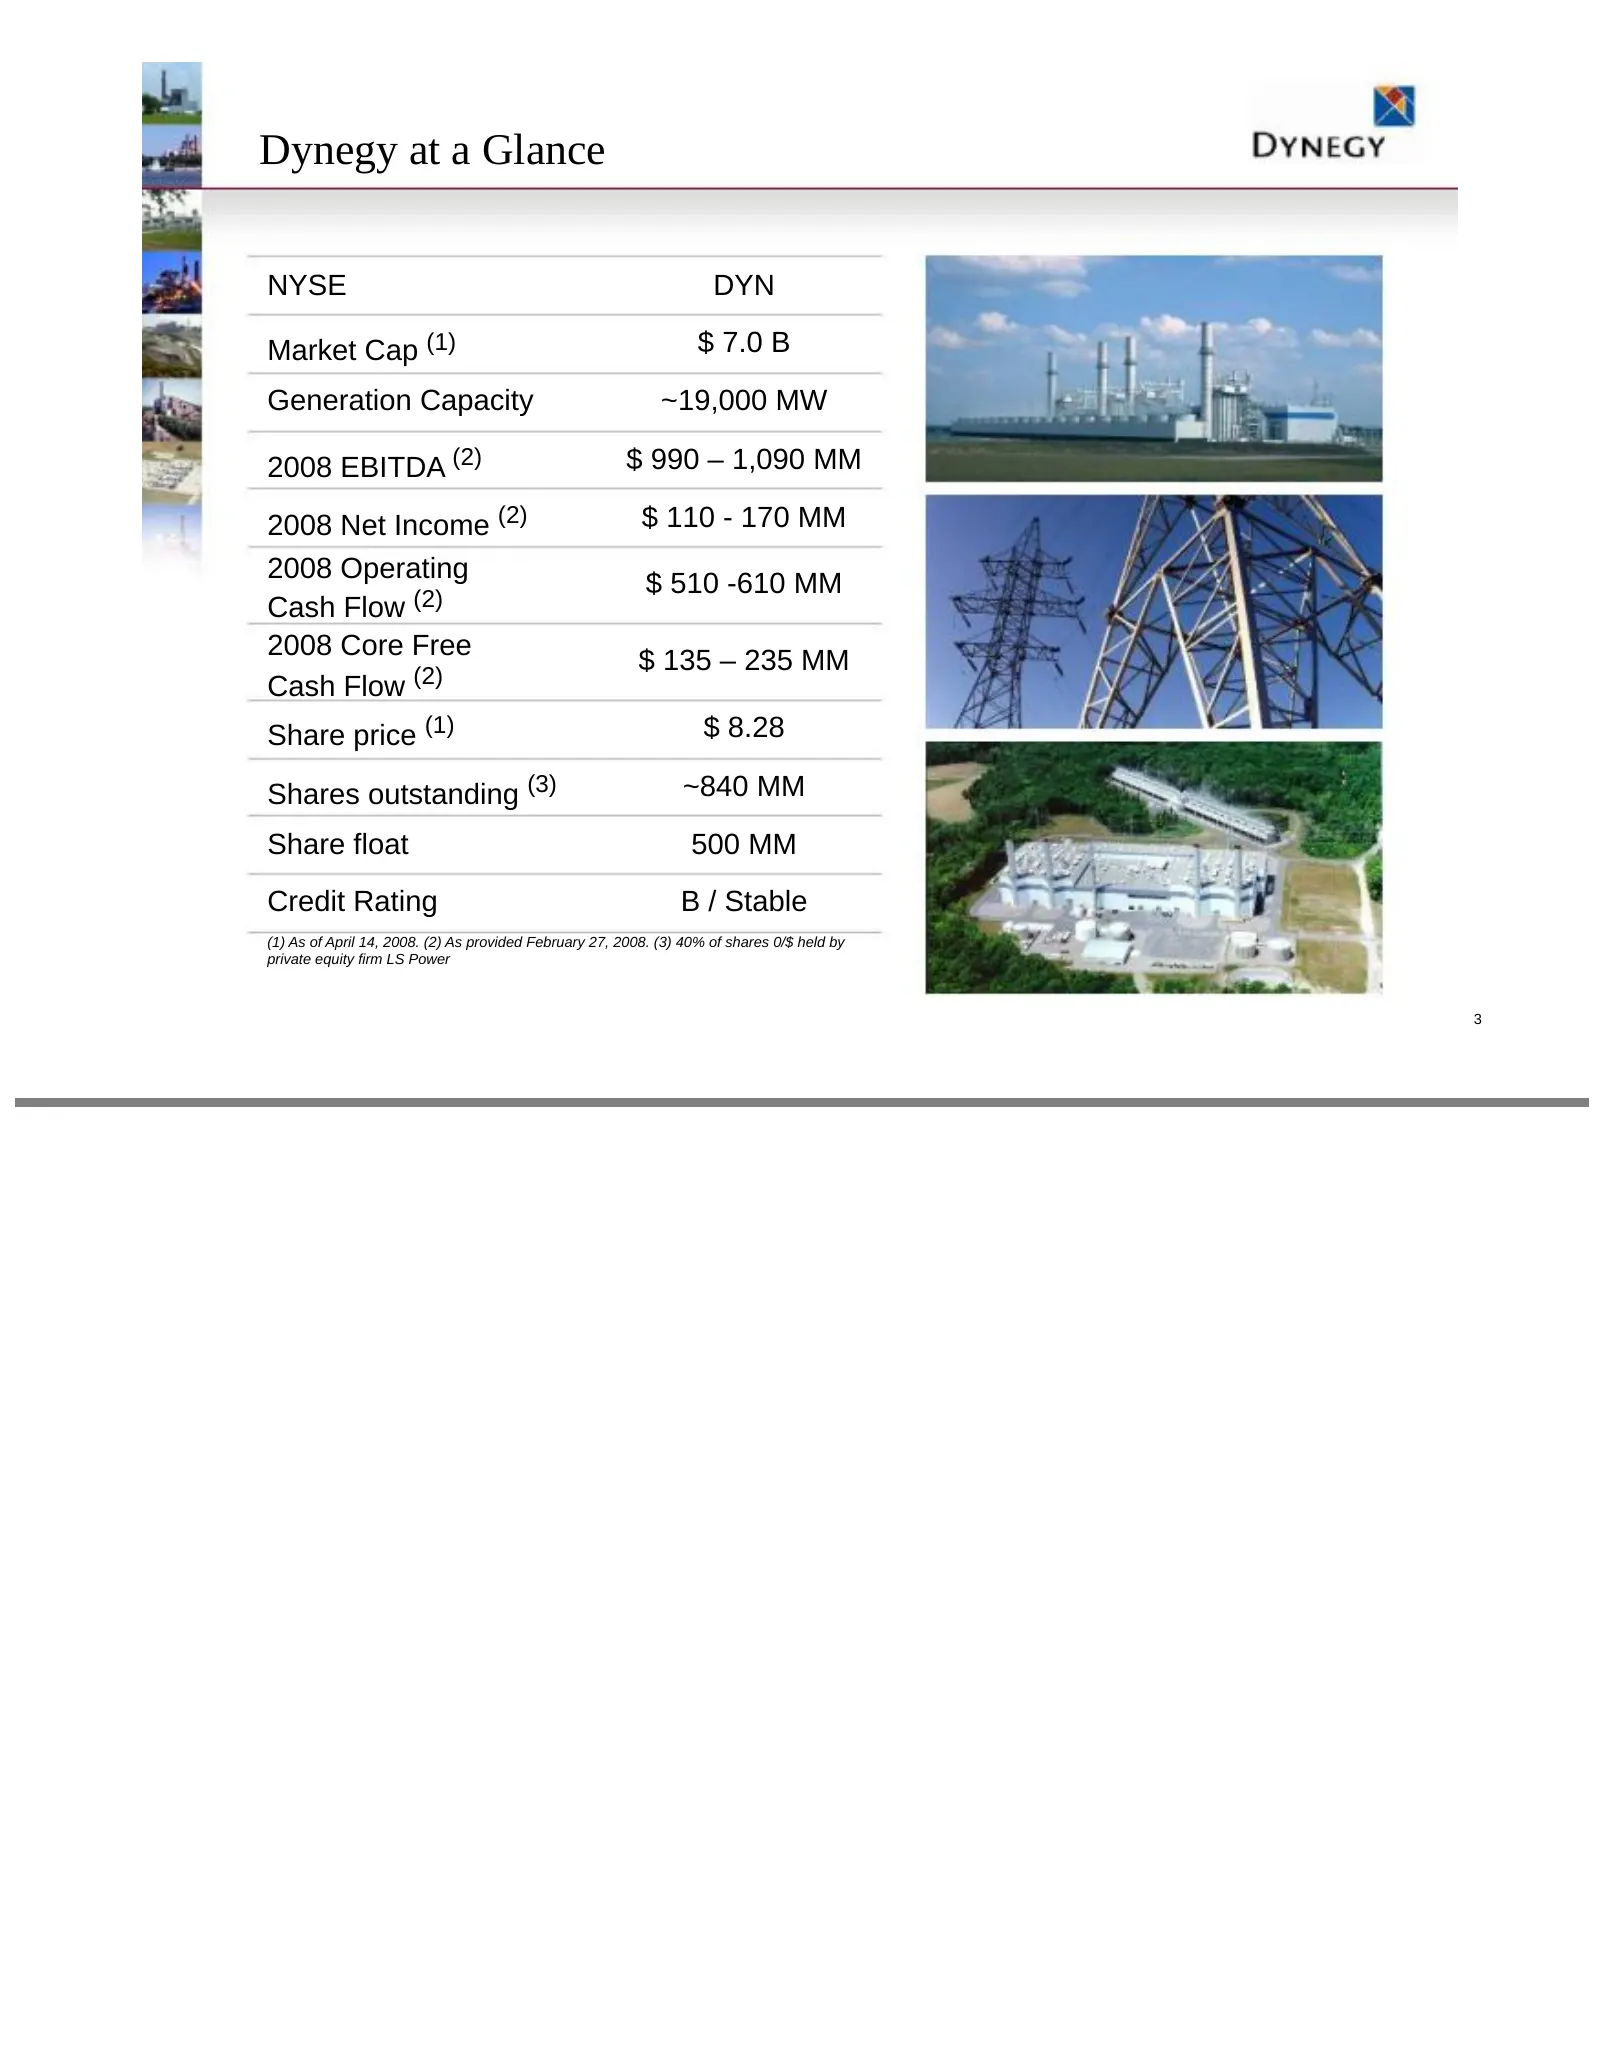
Slide 3: Dynegy at a Glance
Dynegy at a Glance NYSE DYN Market Cap (1) $ 7.0 B Generation Capacity ~19,000 MW 2008 EBITDA (2) $ 990 – 1,090 MM 2008 Net Income (2) $ 110 - 170 MM 2008 Operating $ 510 -610 MM Cash Flow (2) 2008 Core Free $ 135 – 235 MM Cash Flow (2) Share price (1) $ 8.28 Shares outstanding (3) ~840 MM Share flo
Slide 4: Power Industry Overview
Power Industry Overview DYNEGY
Slide 5: The Power Industry Value Chain
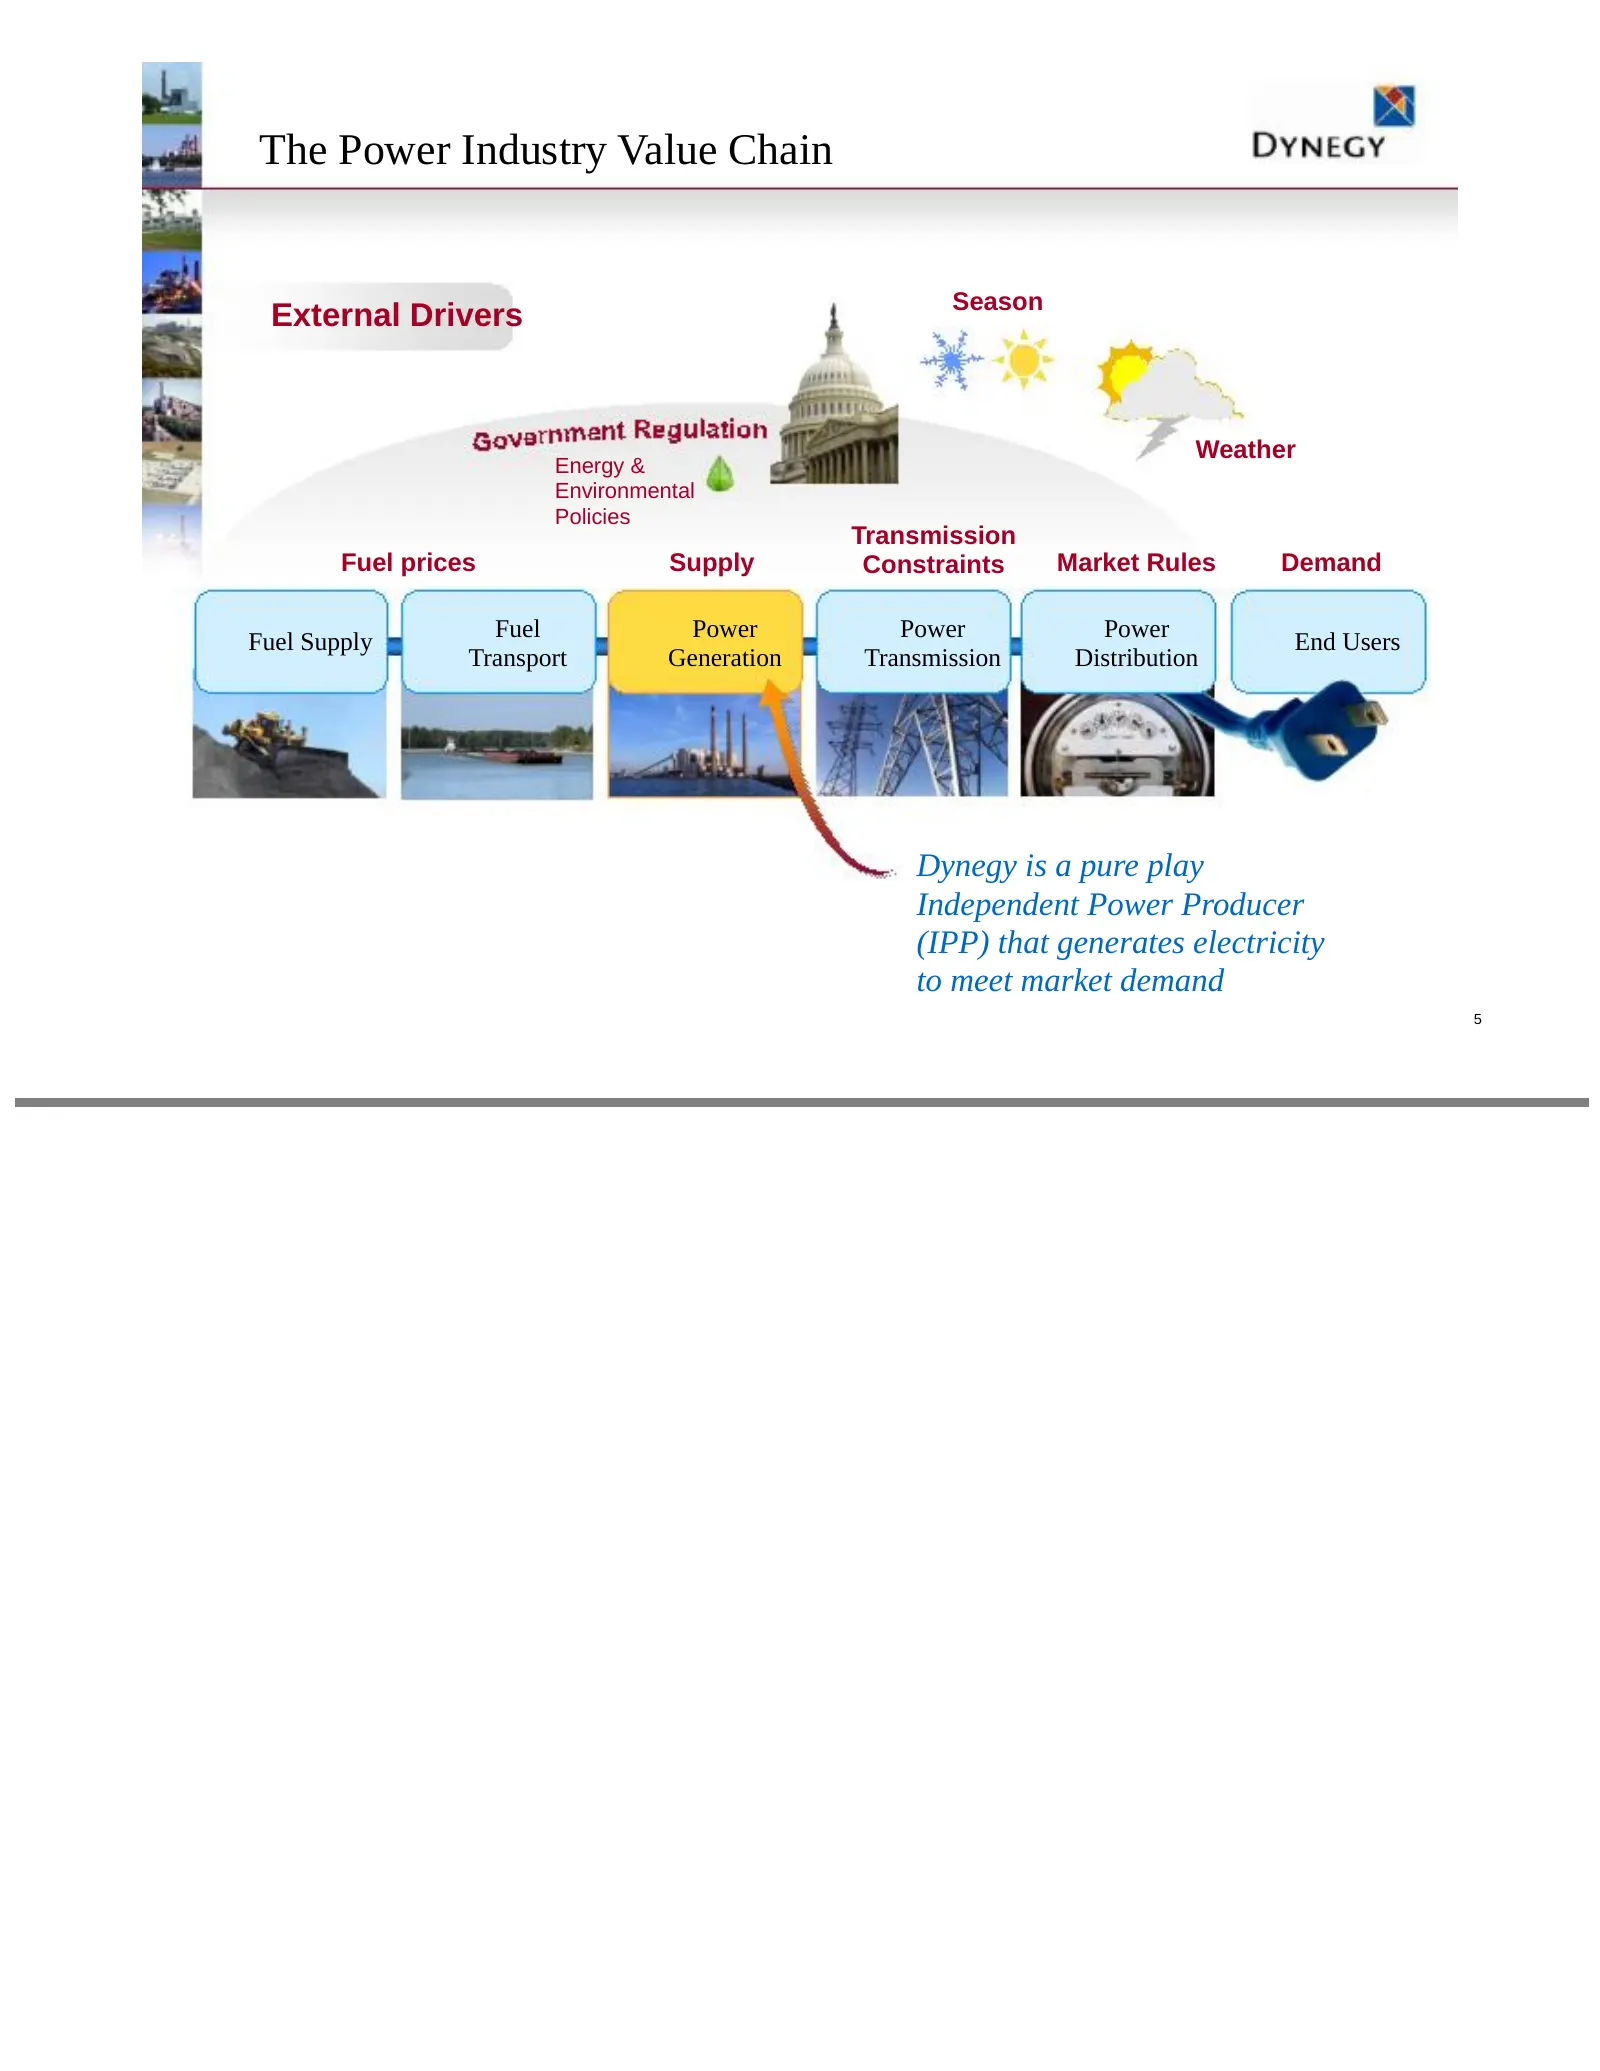
The Power Industry Value Chain Season External Drivers Weather Energy & Environmental Policies Transmission Fuel prices Supply Constraints Market Rules Demand Fuel Supply Fuel Power Power Power End Users Transport Generation Transmission Distribution Dynegy is a pure play Independent Power Producer
Slide 6: Supply Tightens, Demand Increases
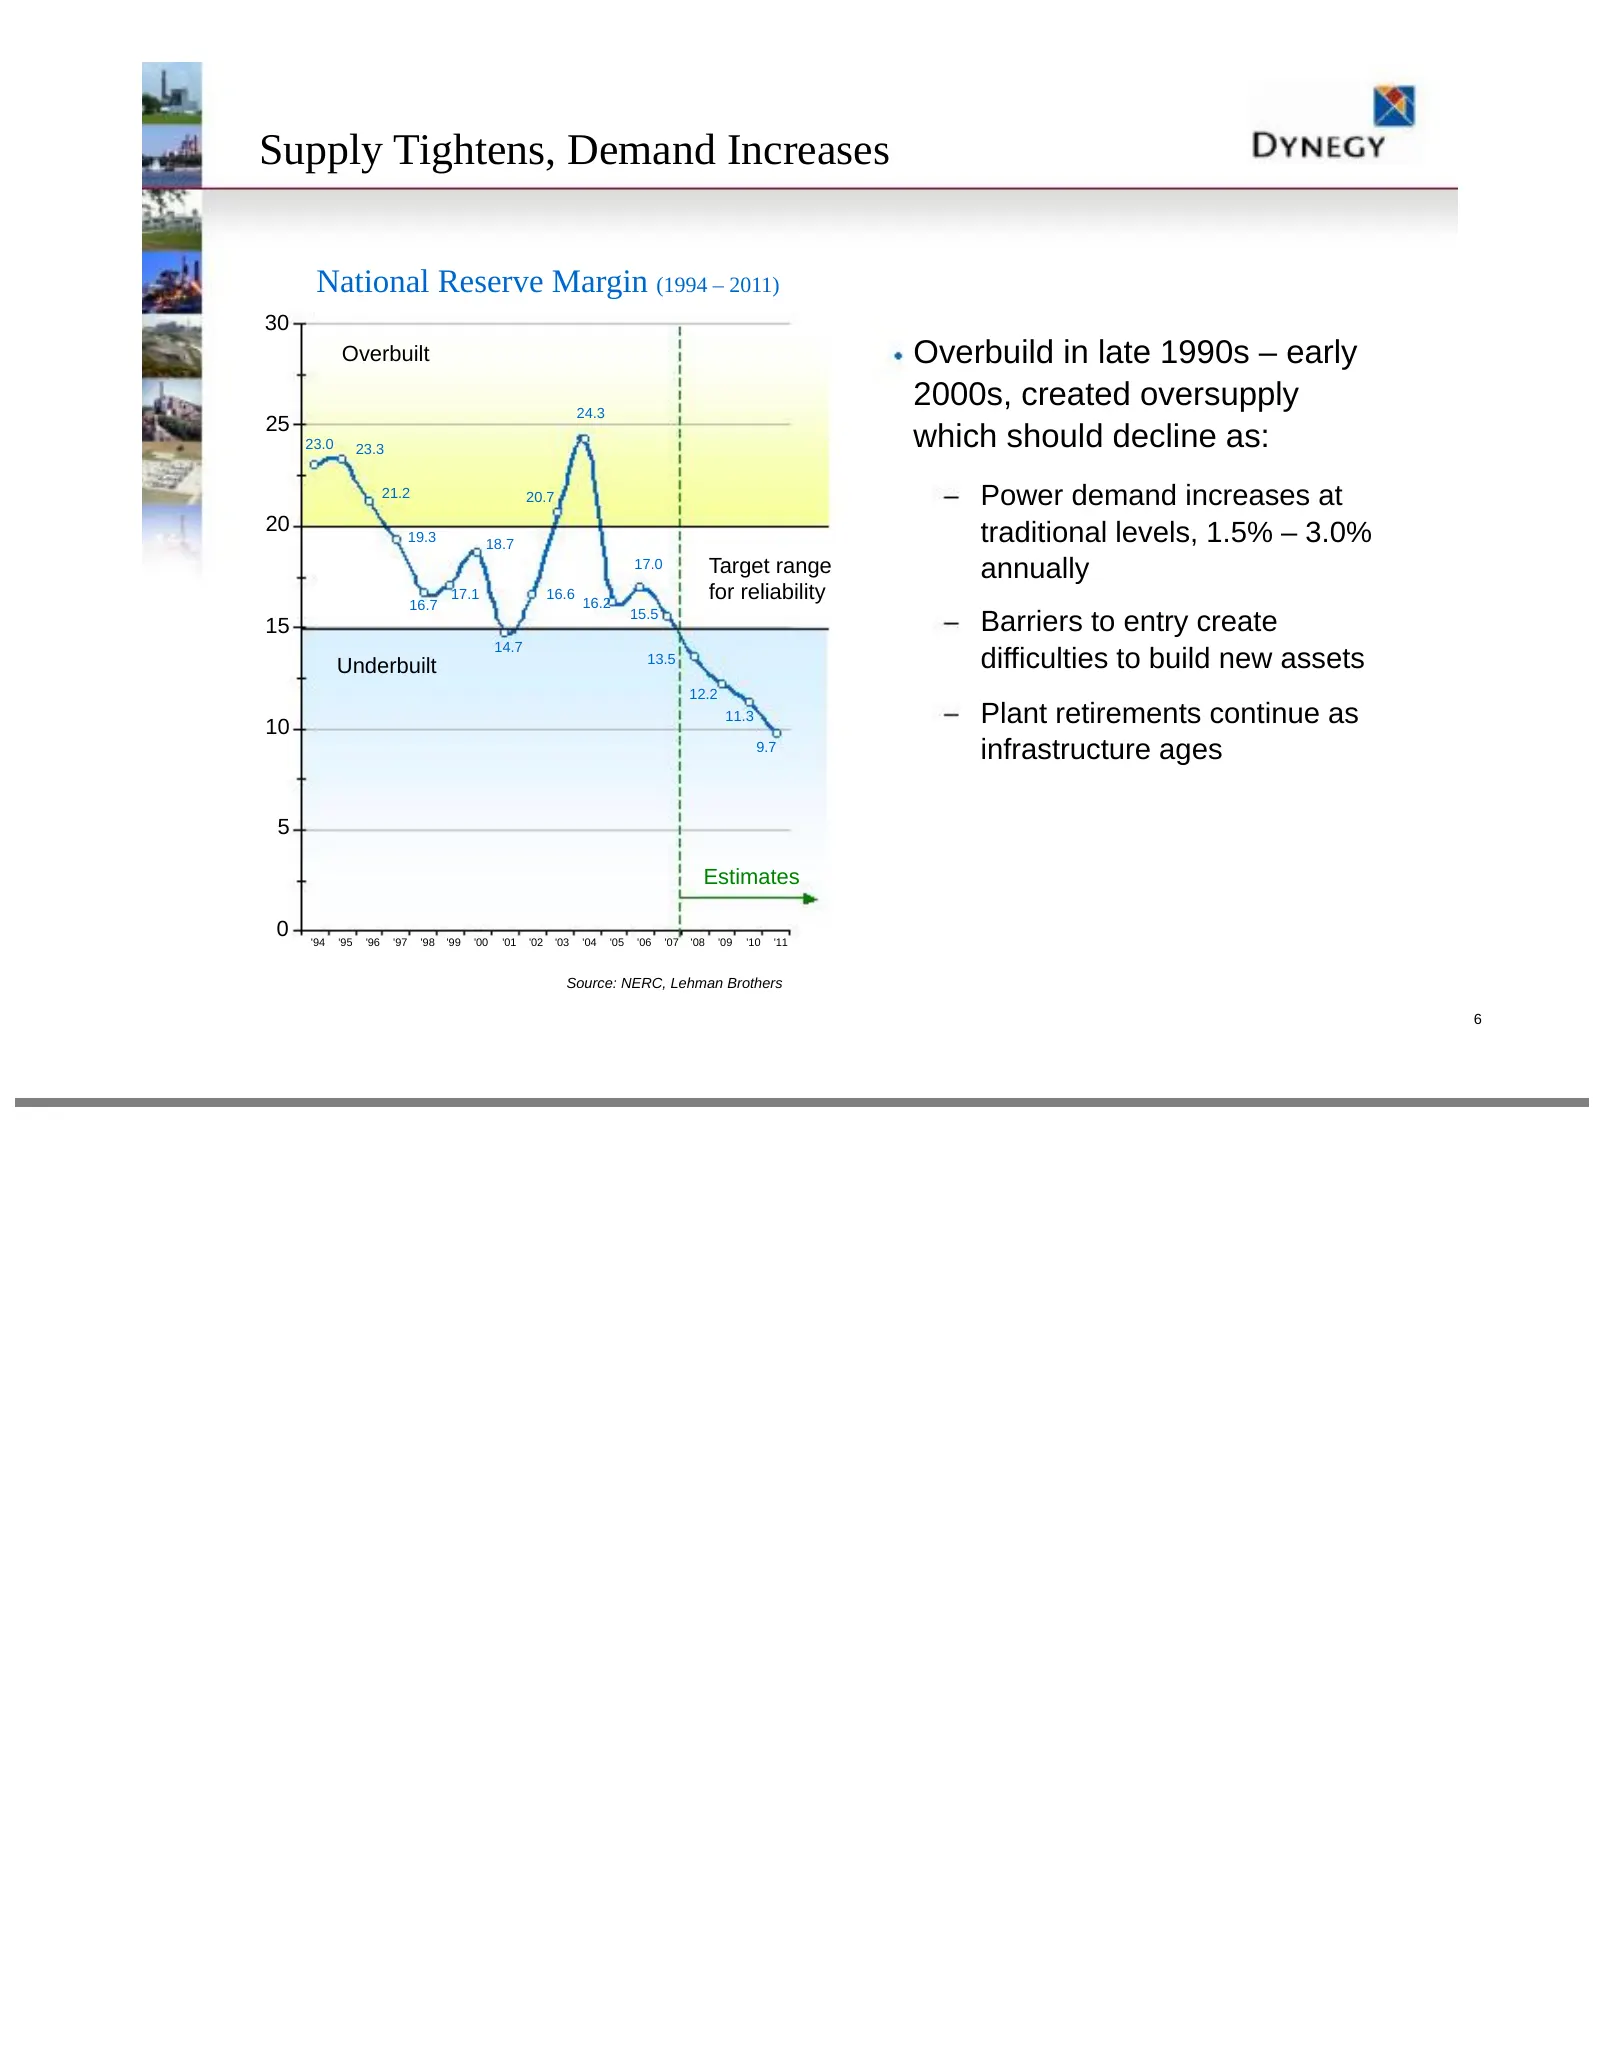
Supply Tightens, Demand Increases National Reserve Margin (1994 – 2011) 30 Overbuilt Overbuild in late 1990s – early 24.3 2000s, created oversupply 25 23.0 23.3 which should decline as: 21.2 20.7 Power demand increases at 20 19.3 traditional levels, 1.5% – 3.0% 18.7 17.0 Target range annually 16.7 1
Slide 7: The Power Sector Today
The Power Sector Today Significant challenges exist in balancing the needs for: Affordable electricity for end-users Reliable and diversified sources of electricity Environmental stewardship No single solution exists for this complex global problem Power industry will require significant capital inv
Slide 8: Market Signals & Trends
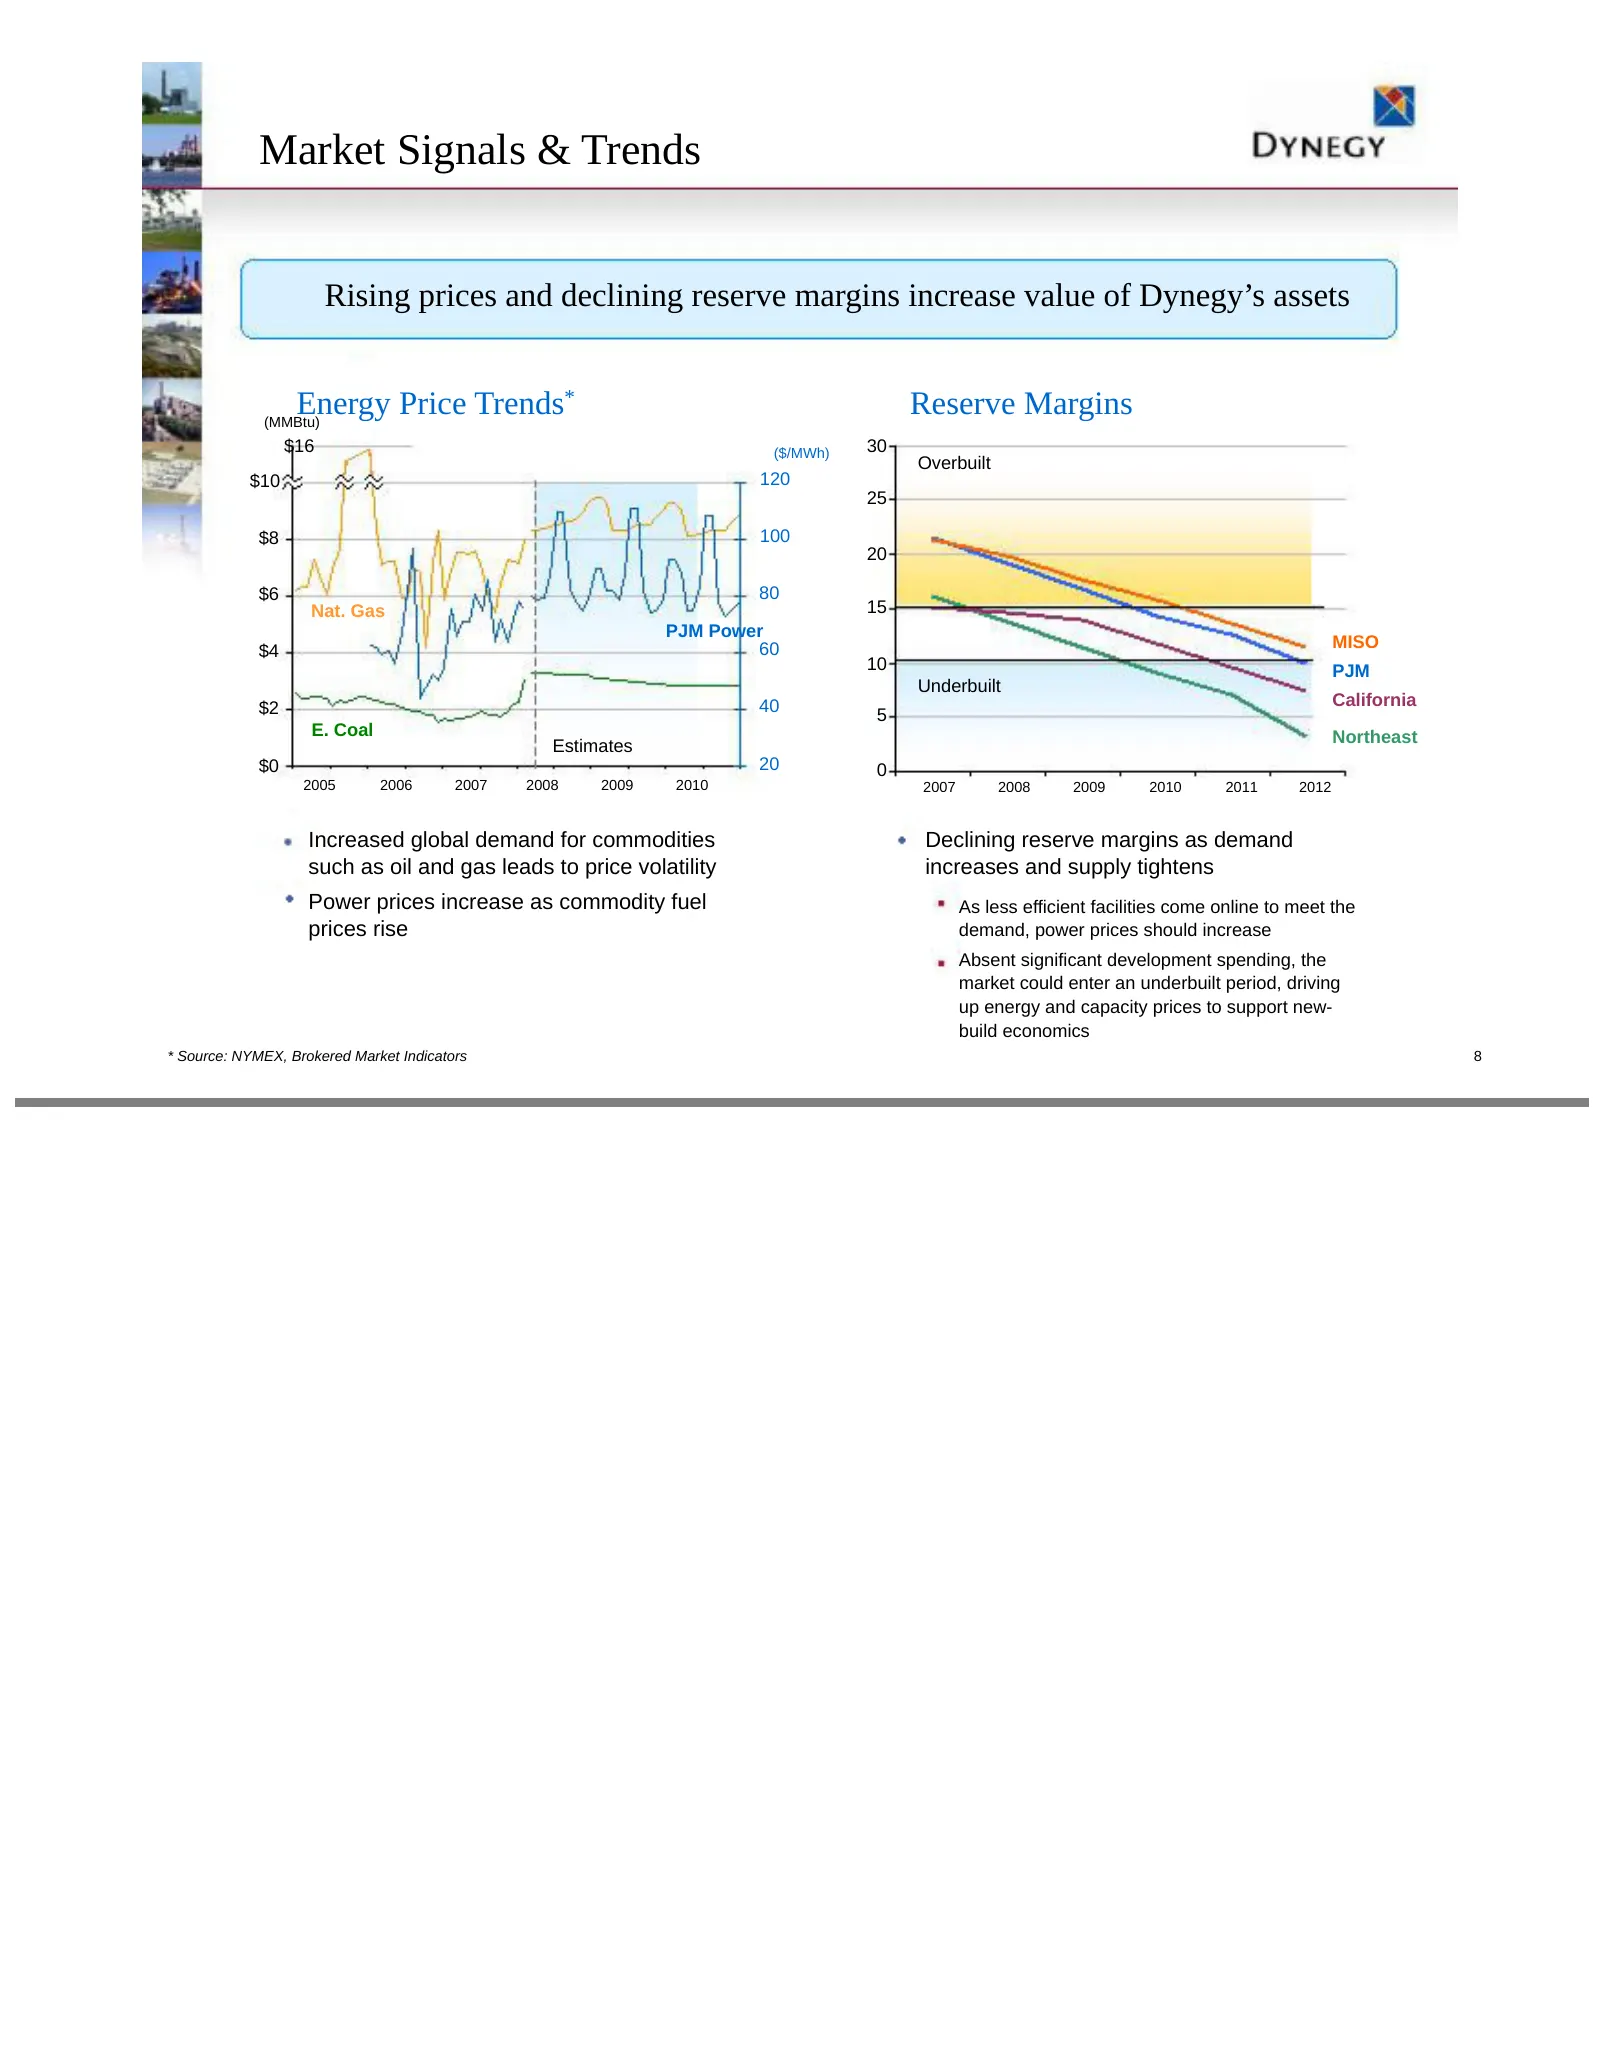
Market Signals & Trends Rising prices and declining reserve margins increase value of Dynegy’s assets Energy Price Trends* (MMBtu) Reserve Margins $16 ($/MWh) 30 Overbuilt $10 120 25 $8 100 20 $6 80 Nat. Gas 15 PJM Power 60 MISO $4 10 PJM Underbuilt $2 40 California 5 E. Coal Northeast Estimates $0
Slide 9: Replacement Costs
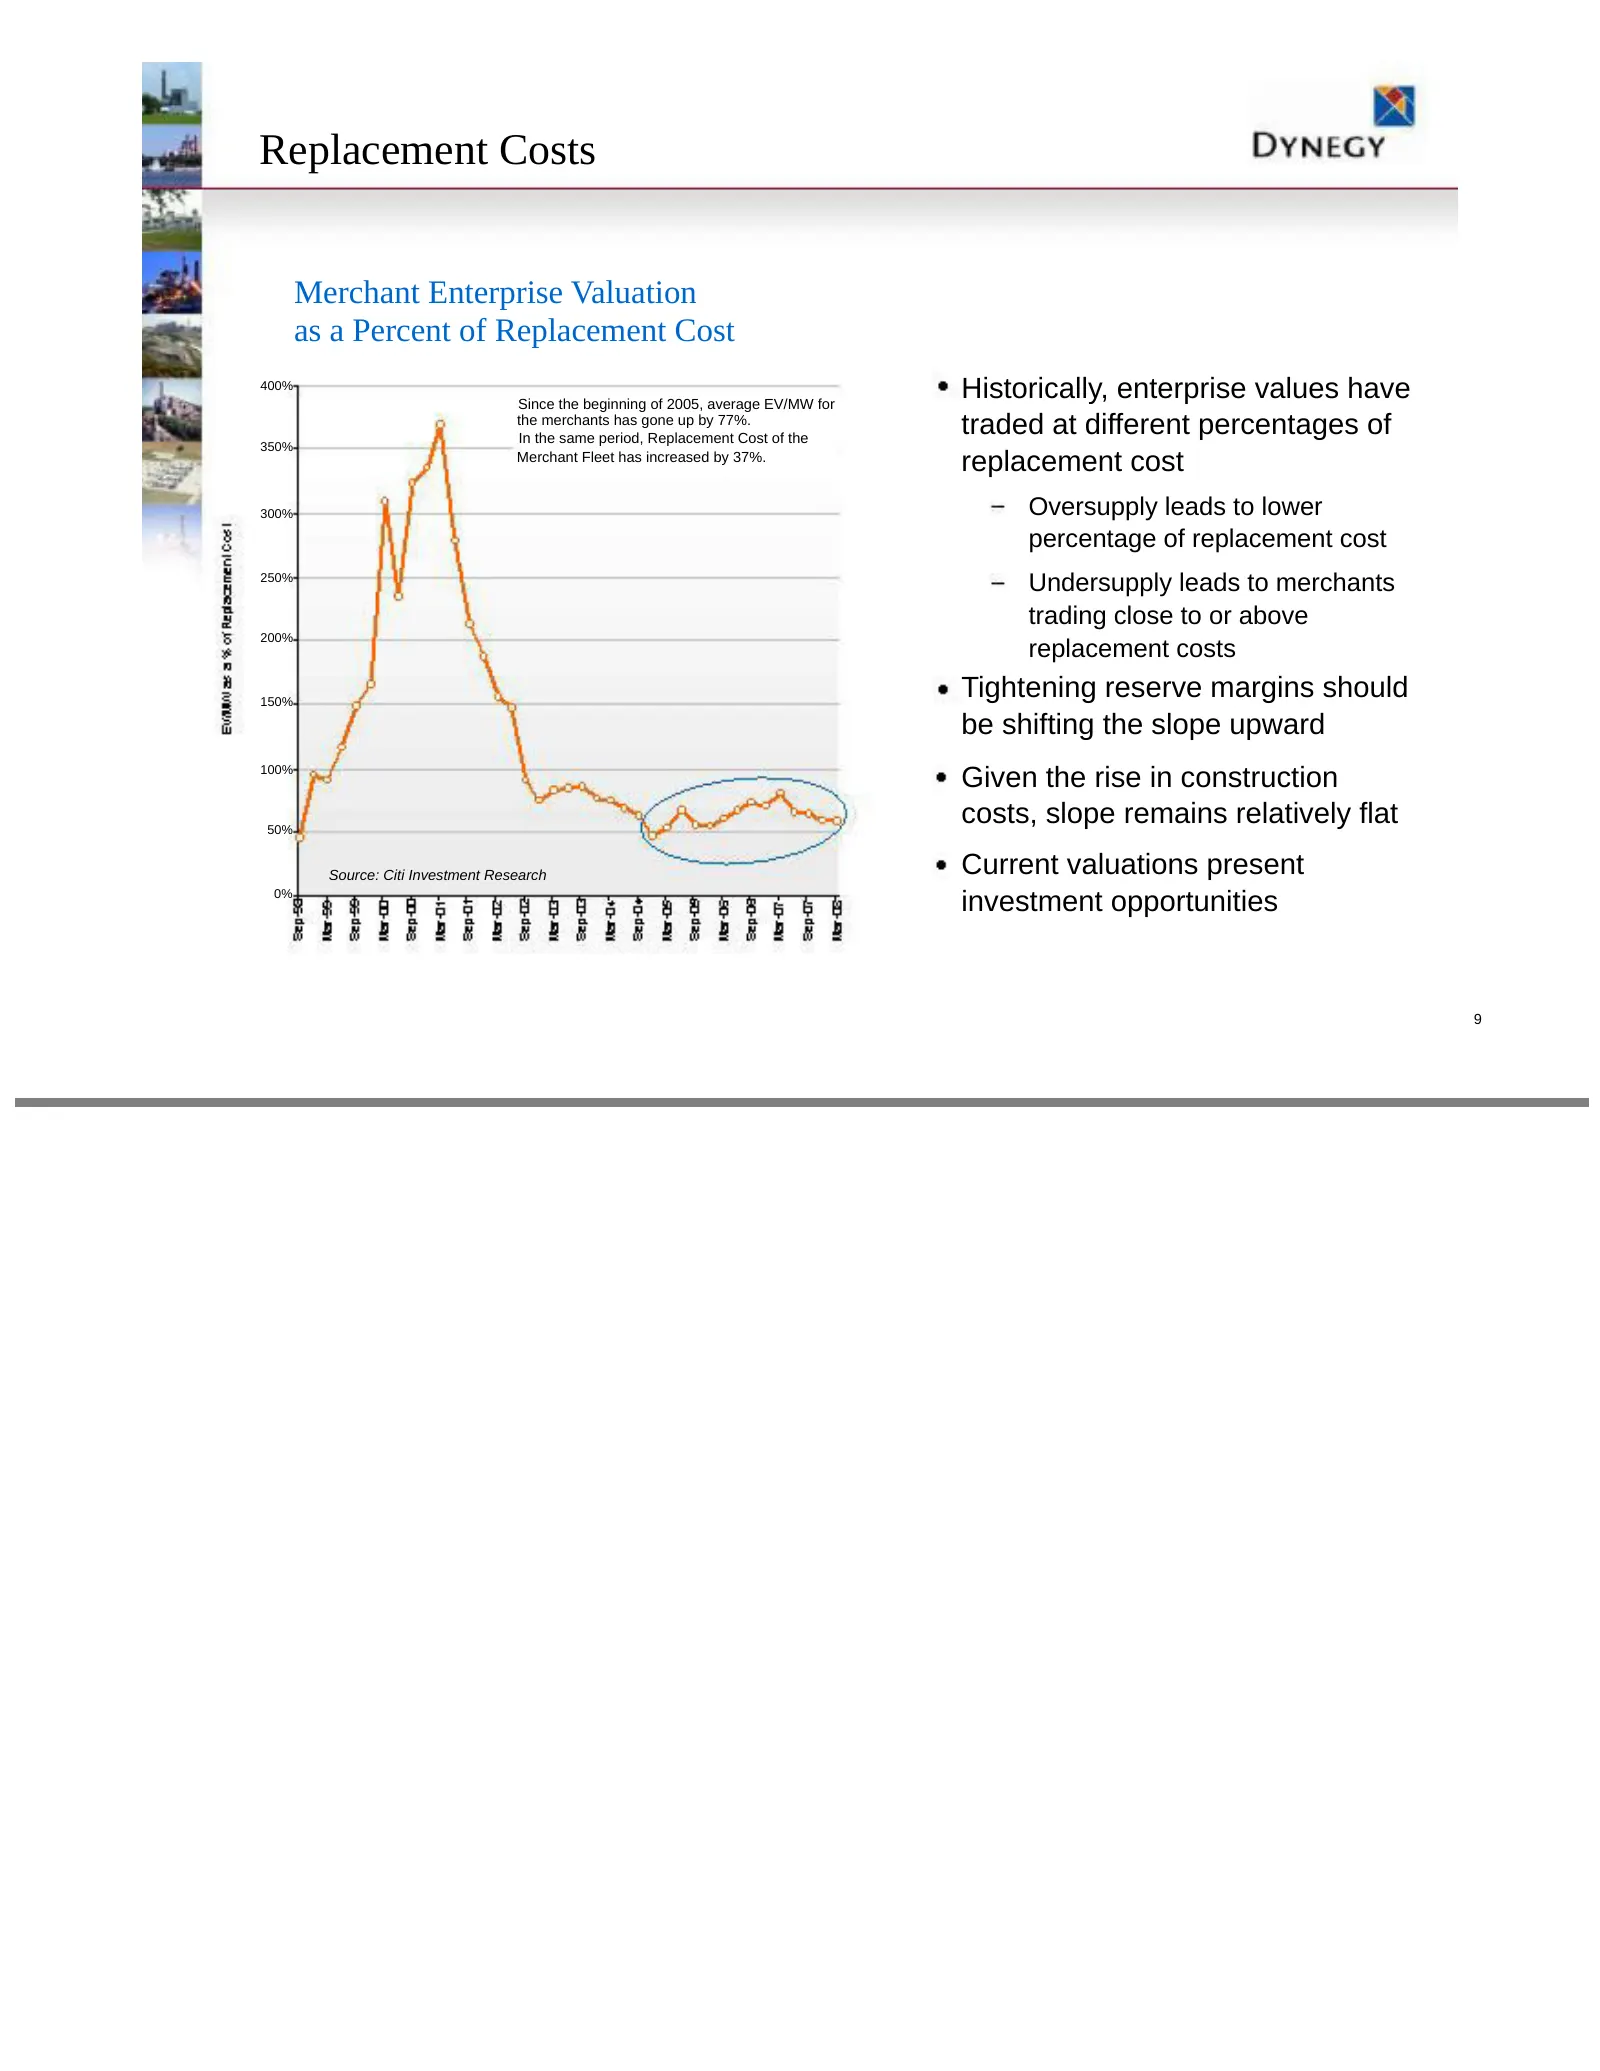
Replacement Costs Merchant Enterprise Valuation as a Percent of Replacement Cost 400% Since the beginning of 2005, average EV/MW for Historically, enterprise values have the merchants has gone up by 77%. In the same period, Replacement Cost of the traded at different percentages of 350% Merchant Fle
Slide 10: Dynegy Overview
Dynegy Overview DYNEGY
Slide 11: Strategically Positioned Portfolio
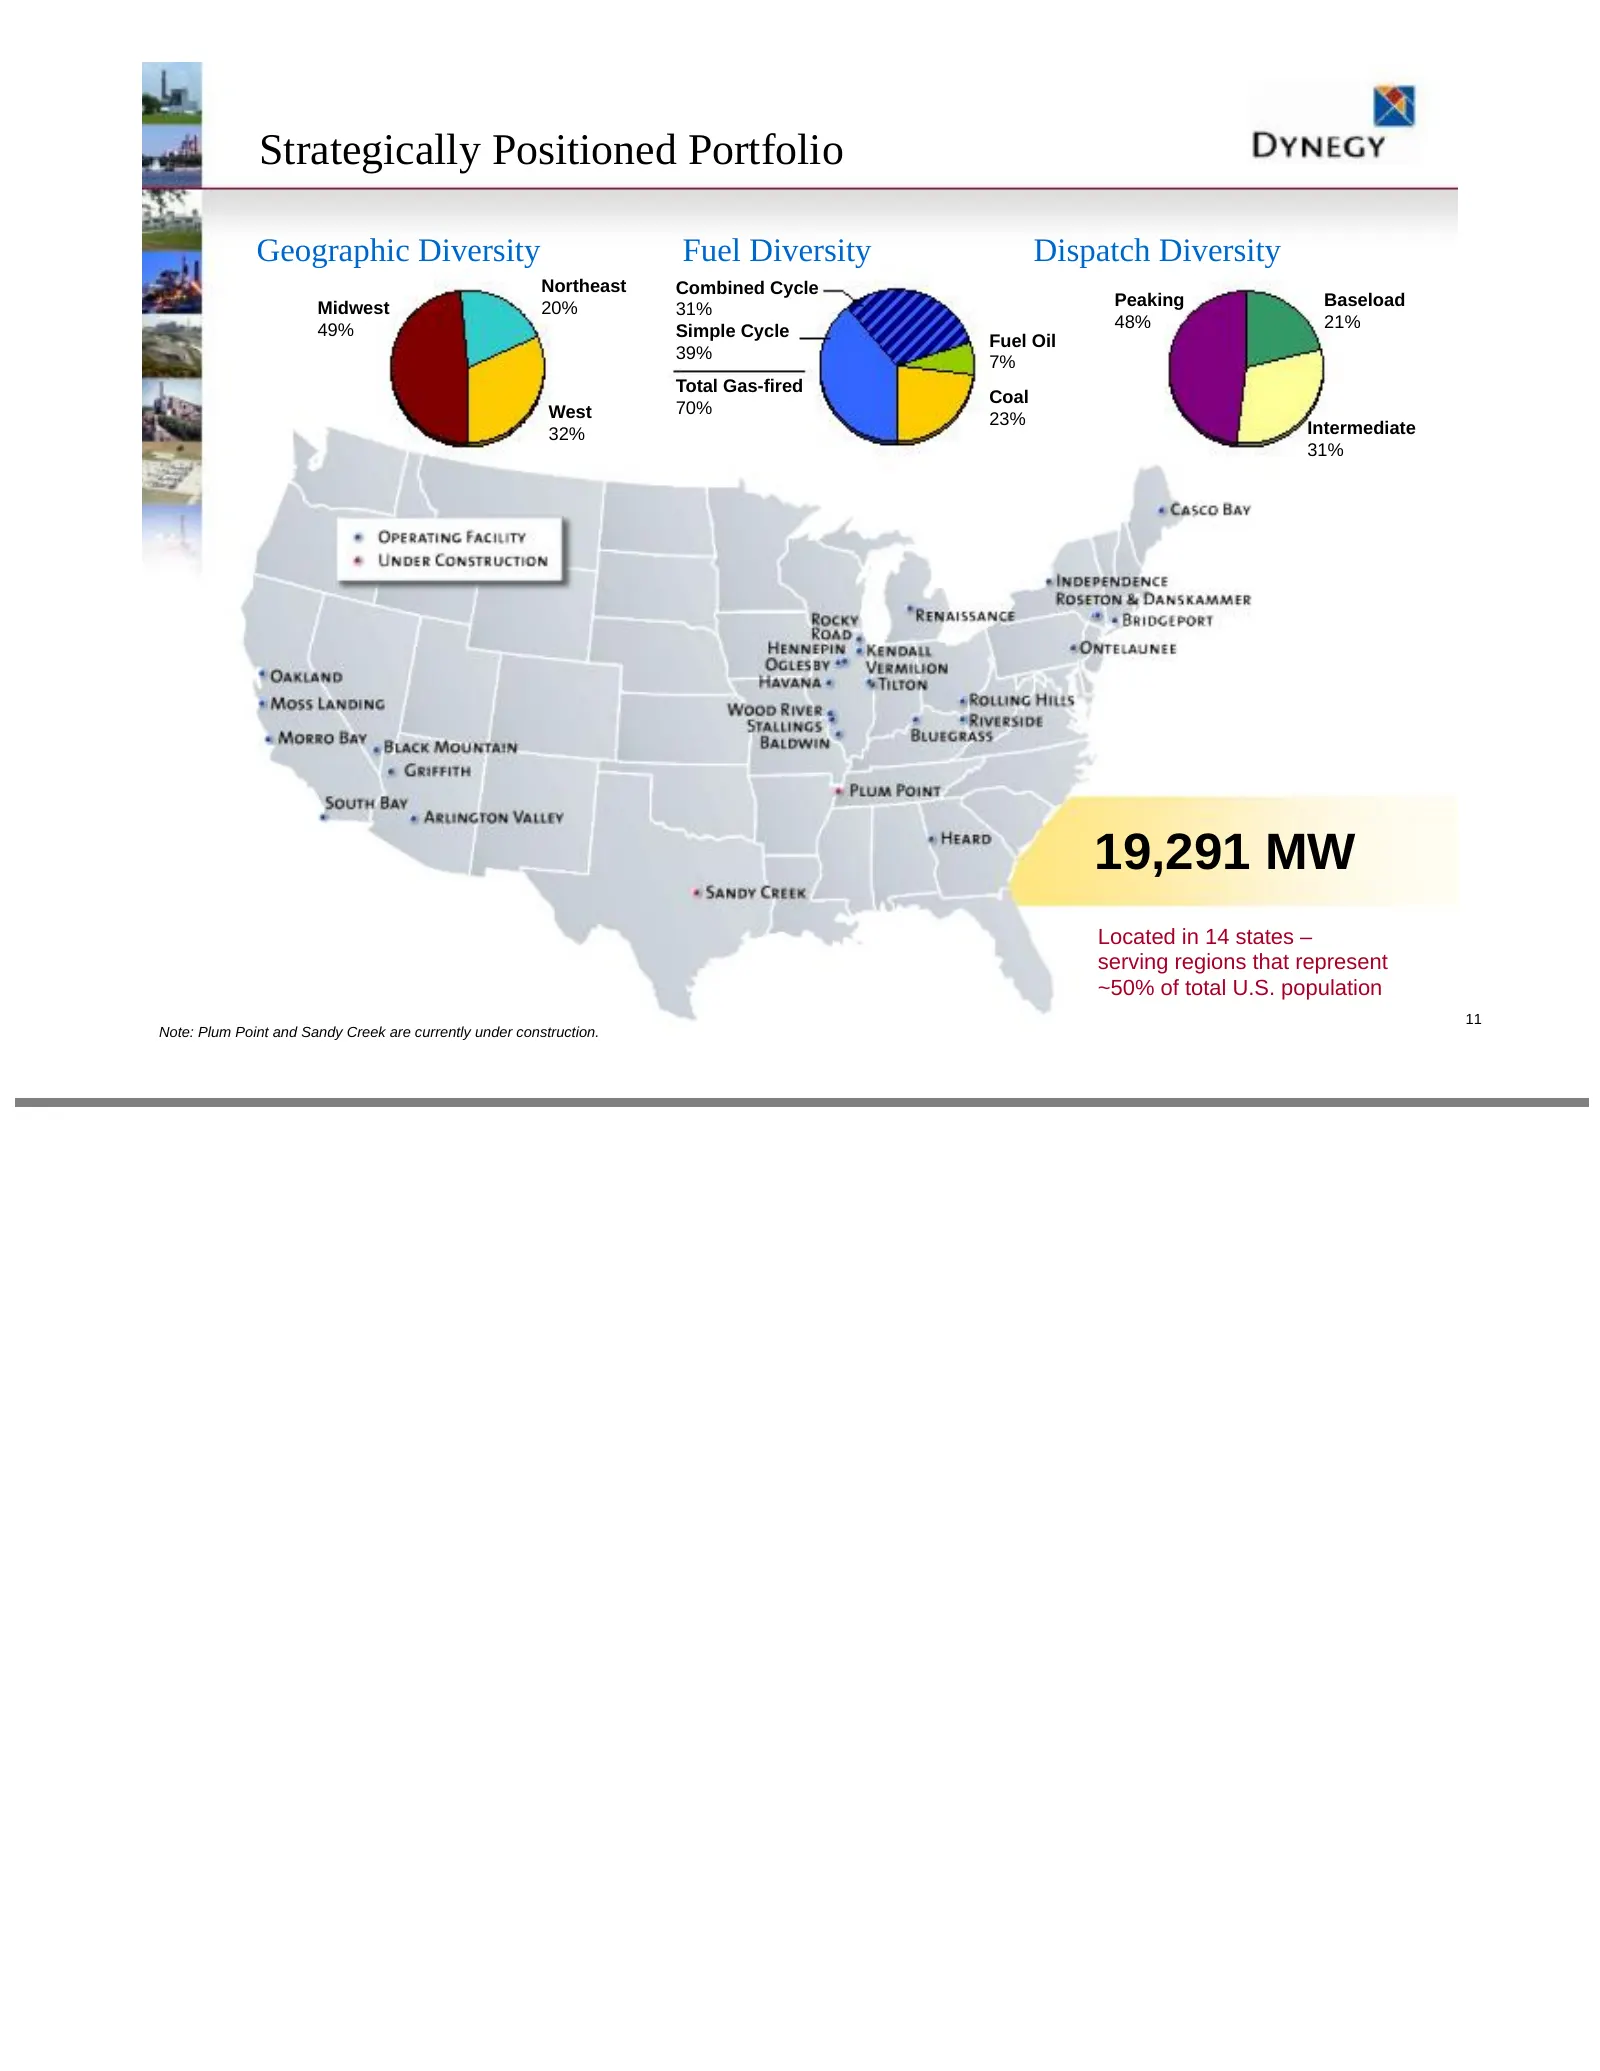
Strategically Positioned Portfolio Geographic Diversity Fuel Diversity Dispatch Diversity Northeast Combined Cycle Midwest 20% Peaking Baseload 31% 49% 48% 21% Simple Cycle Fuel Oil 39% 7% Total Gas-fired Coal West 70% 23% Intermediate 32% 31% 19,291 MW Located in 14 states – serving regions that re
Slide 12: Our Value Creation Strategy: Operate, Build, Transact
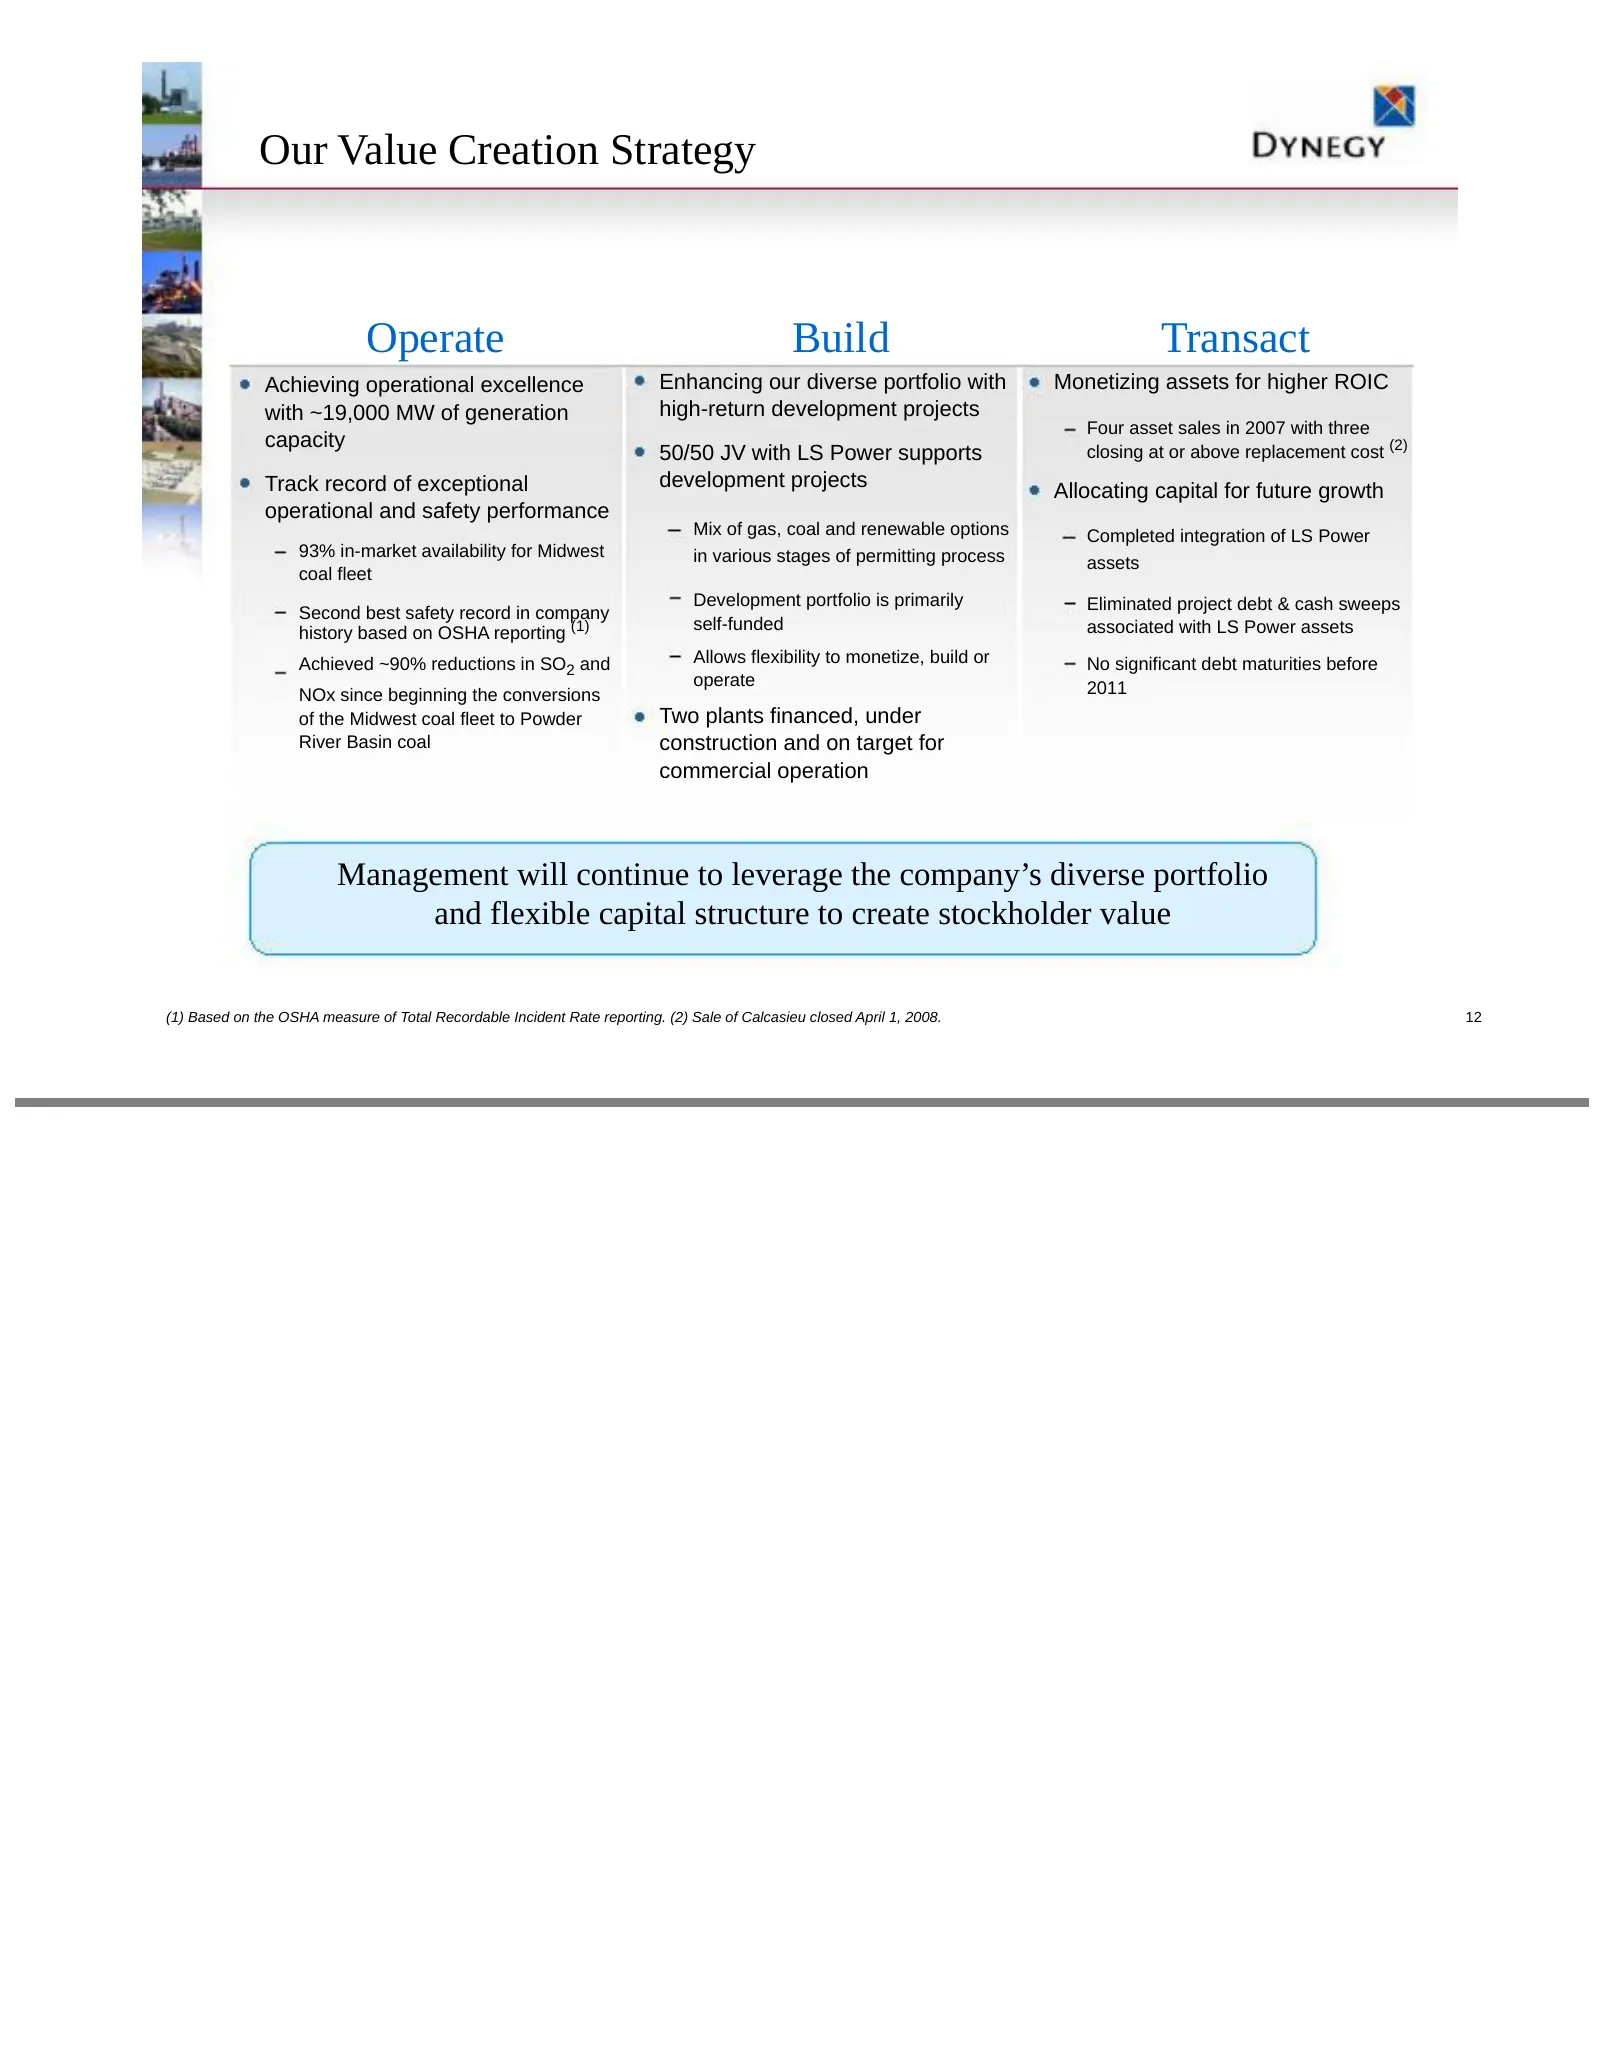
Our Value Creation Strategy Operate Build Transact Achieving operational excellence Enhancing our diverse portfolio with Monetizing assets for higher ROIC with ~19,000 MW of generation high-return development projects Four asset sales in 2007 with three capacity closing at or above replacement cost
Slide 13: Linking Commercial with Capital Strategies
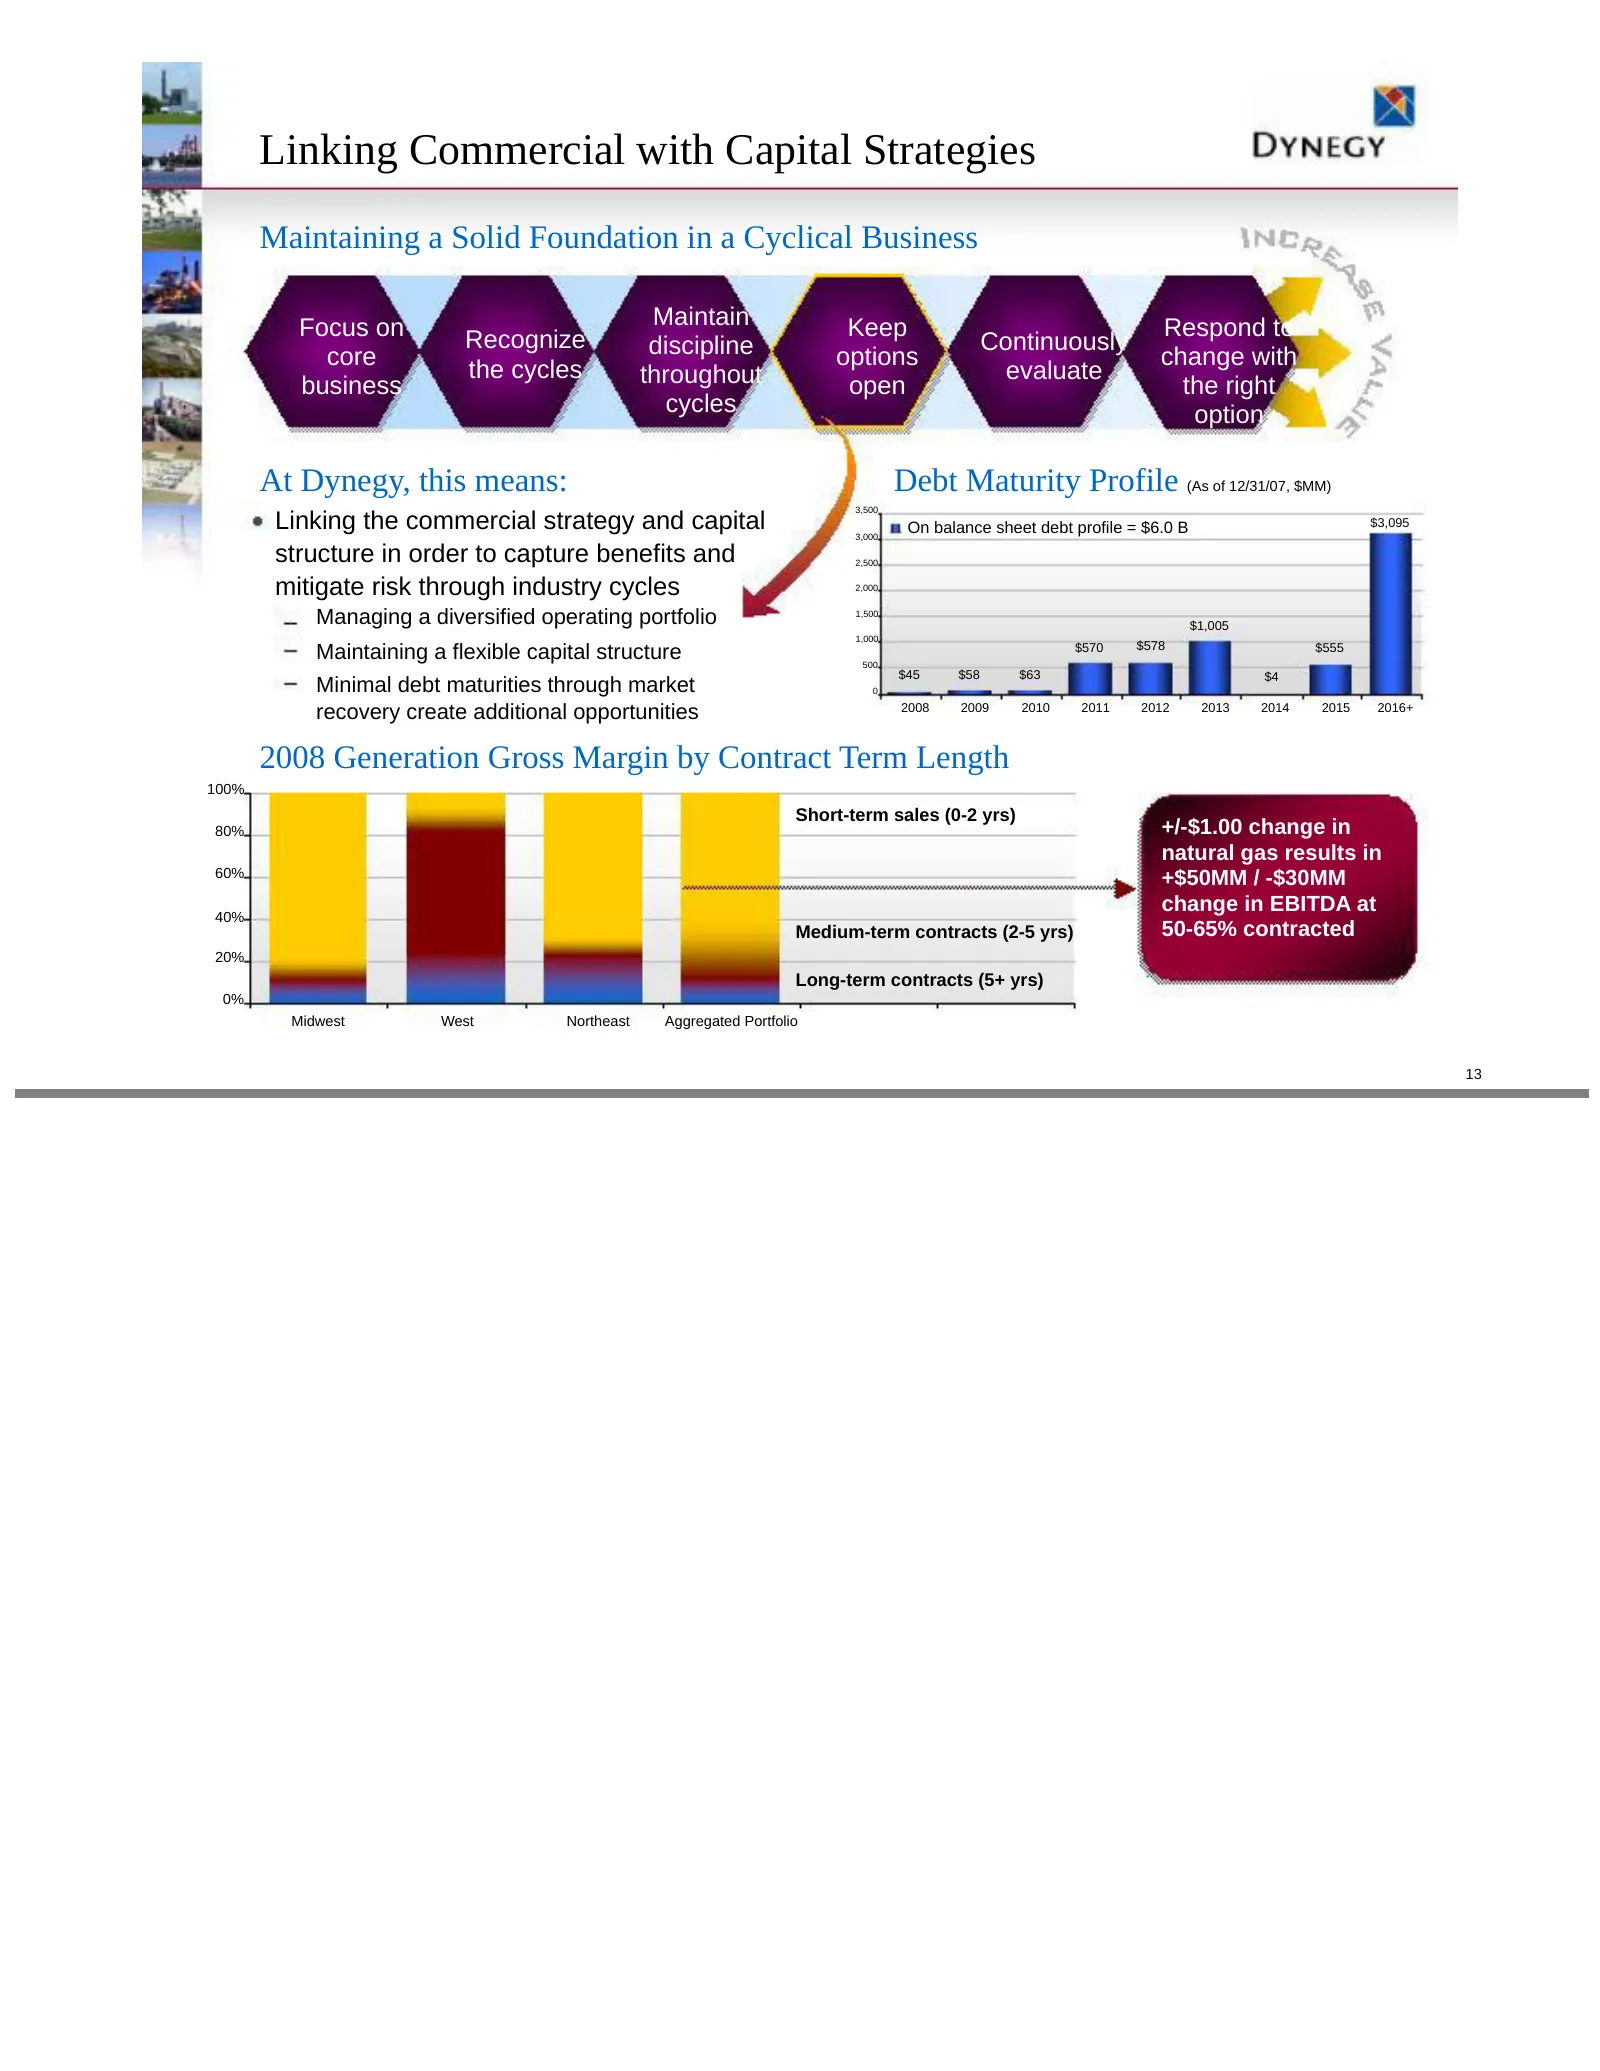
Linking Commercial with Capital Strategies Maintaining a Solid Foundation in a Cyclical Business Focus on Maintain Keep Respond to Recognize discipline Continuously core the cycles options change with throughout evaluate business open the right cycles option At Dynegy, this means: Debt Maturity Prof
Slide 14: Value Drivers
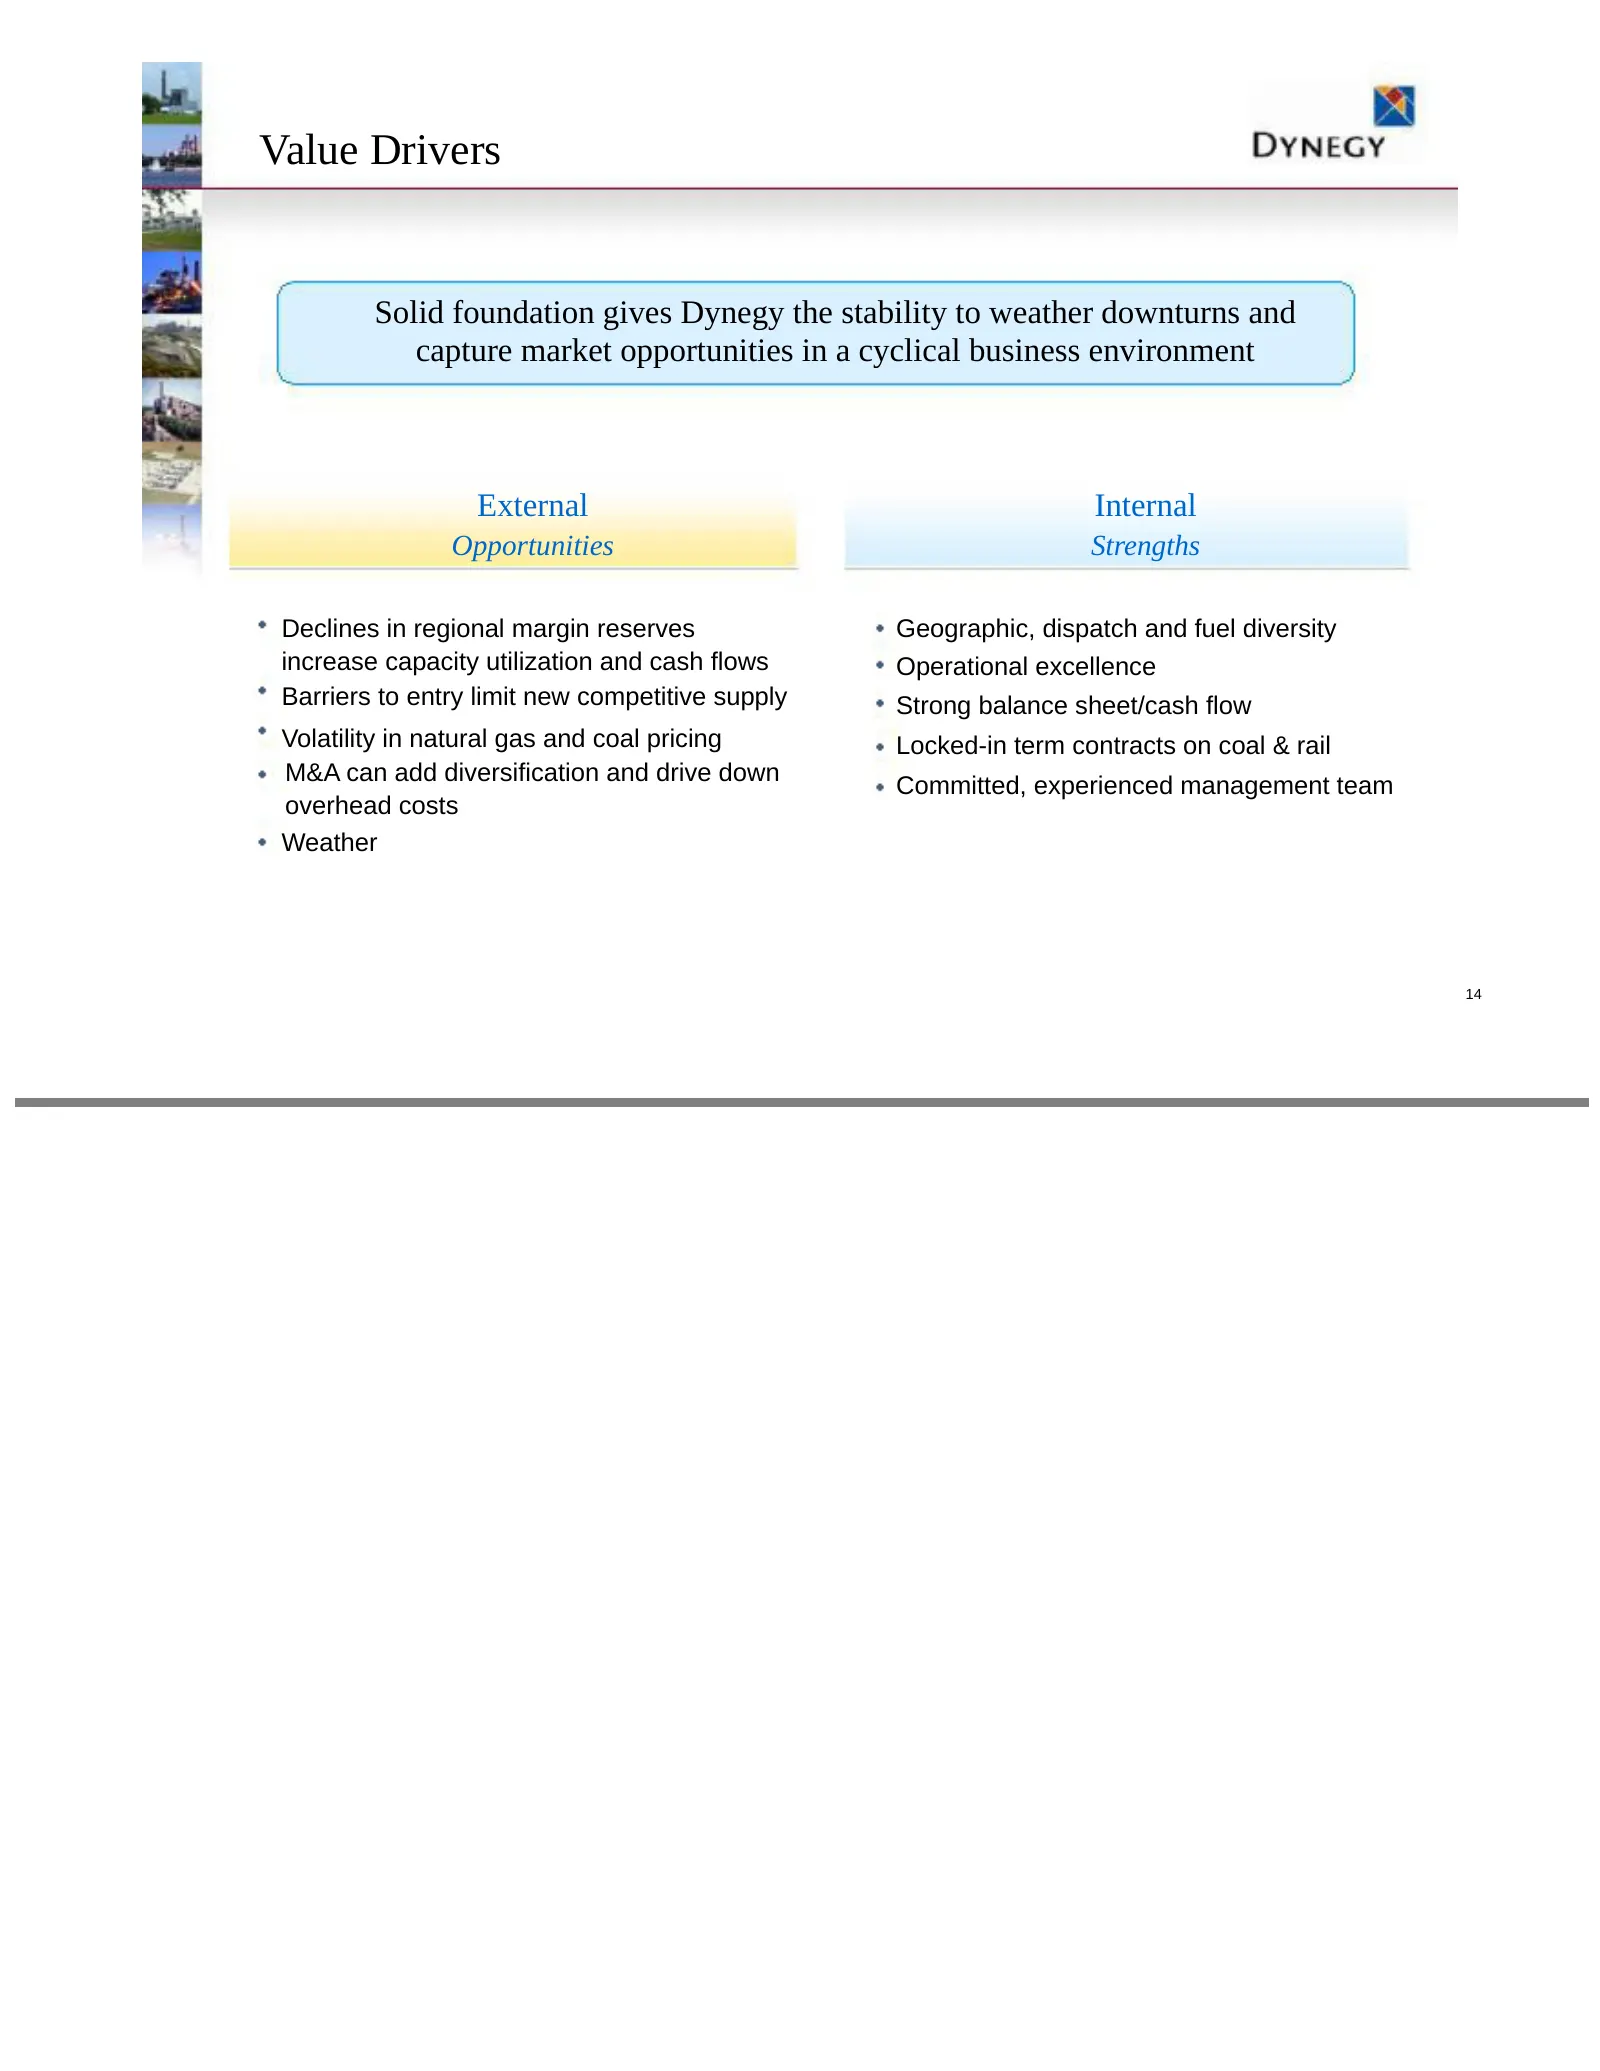
Value Drivers Solid foundation gives Dynegy the stability to weather downturns and capture market opportunities in a cyclical business environment External Internal Opportunities Strengths Declines in regional margin reserves Geographic, dispatch and fuel diversity increase capacity utilization and
Slide 15: Investment Proposition
Investment Proposition DYNEGY
Slide 16: Valuing Dynegy's Asset Portfolio
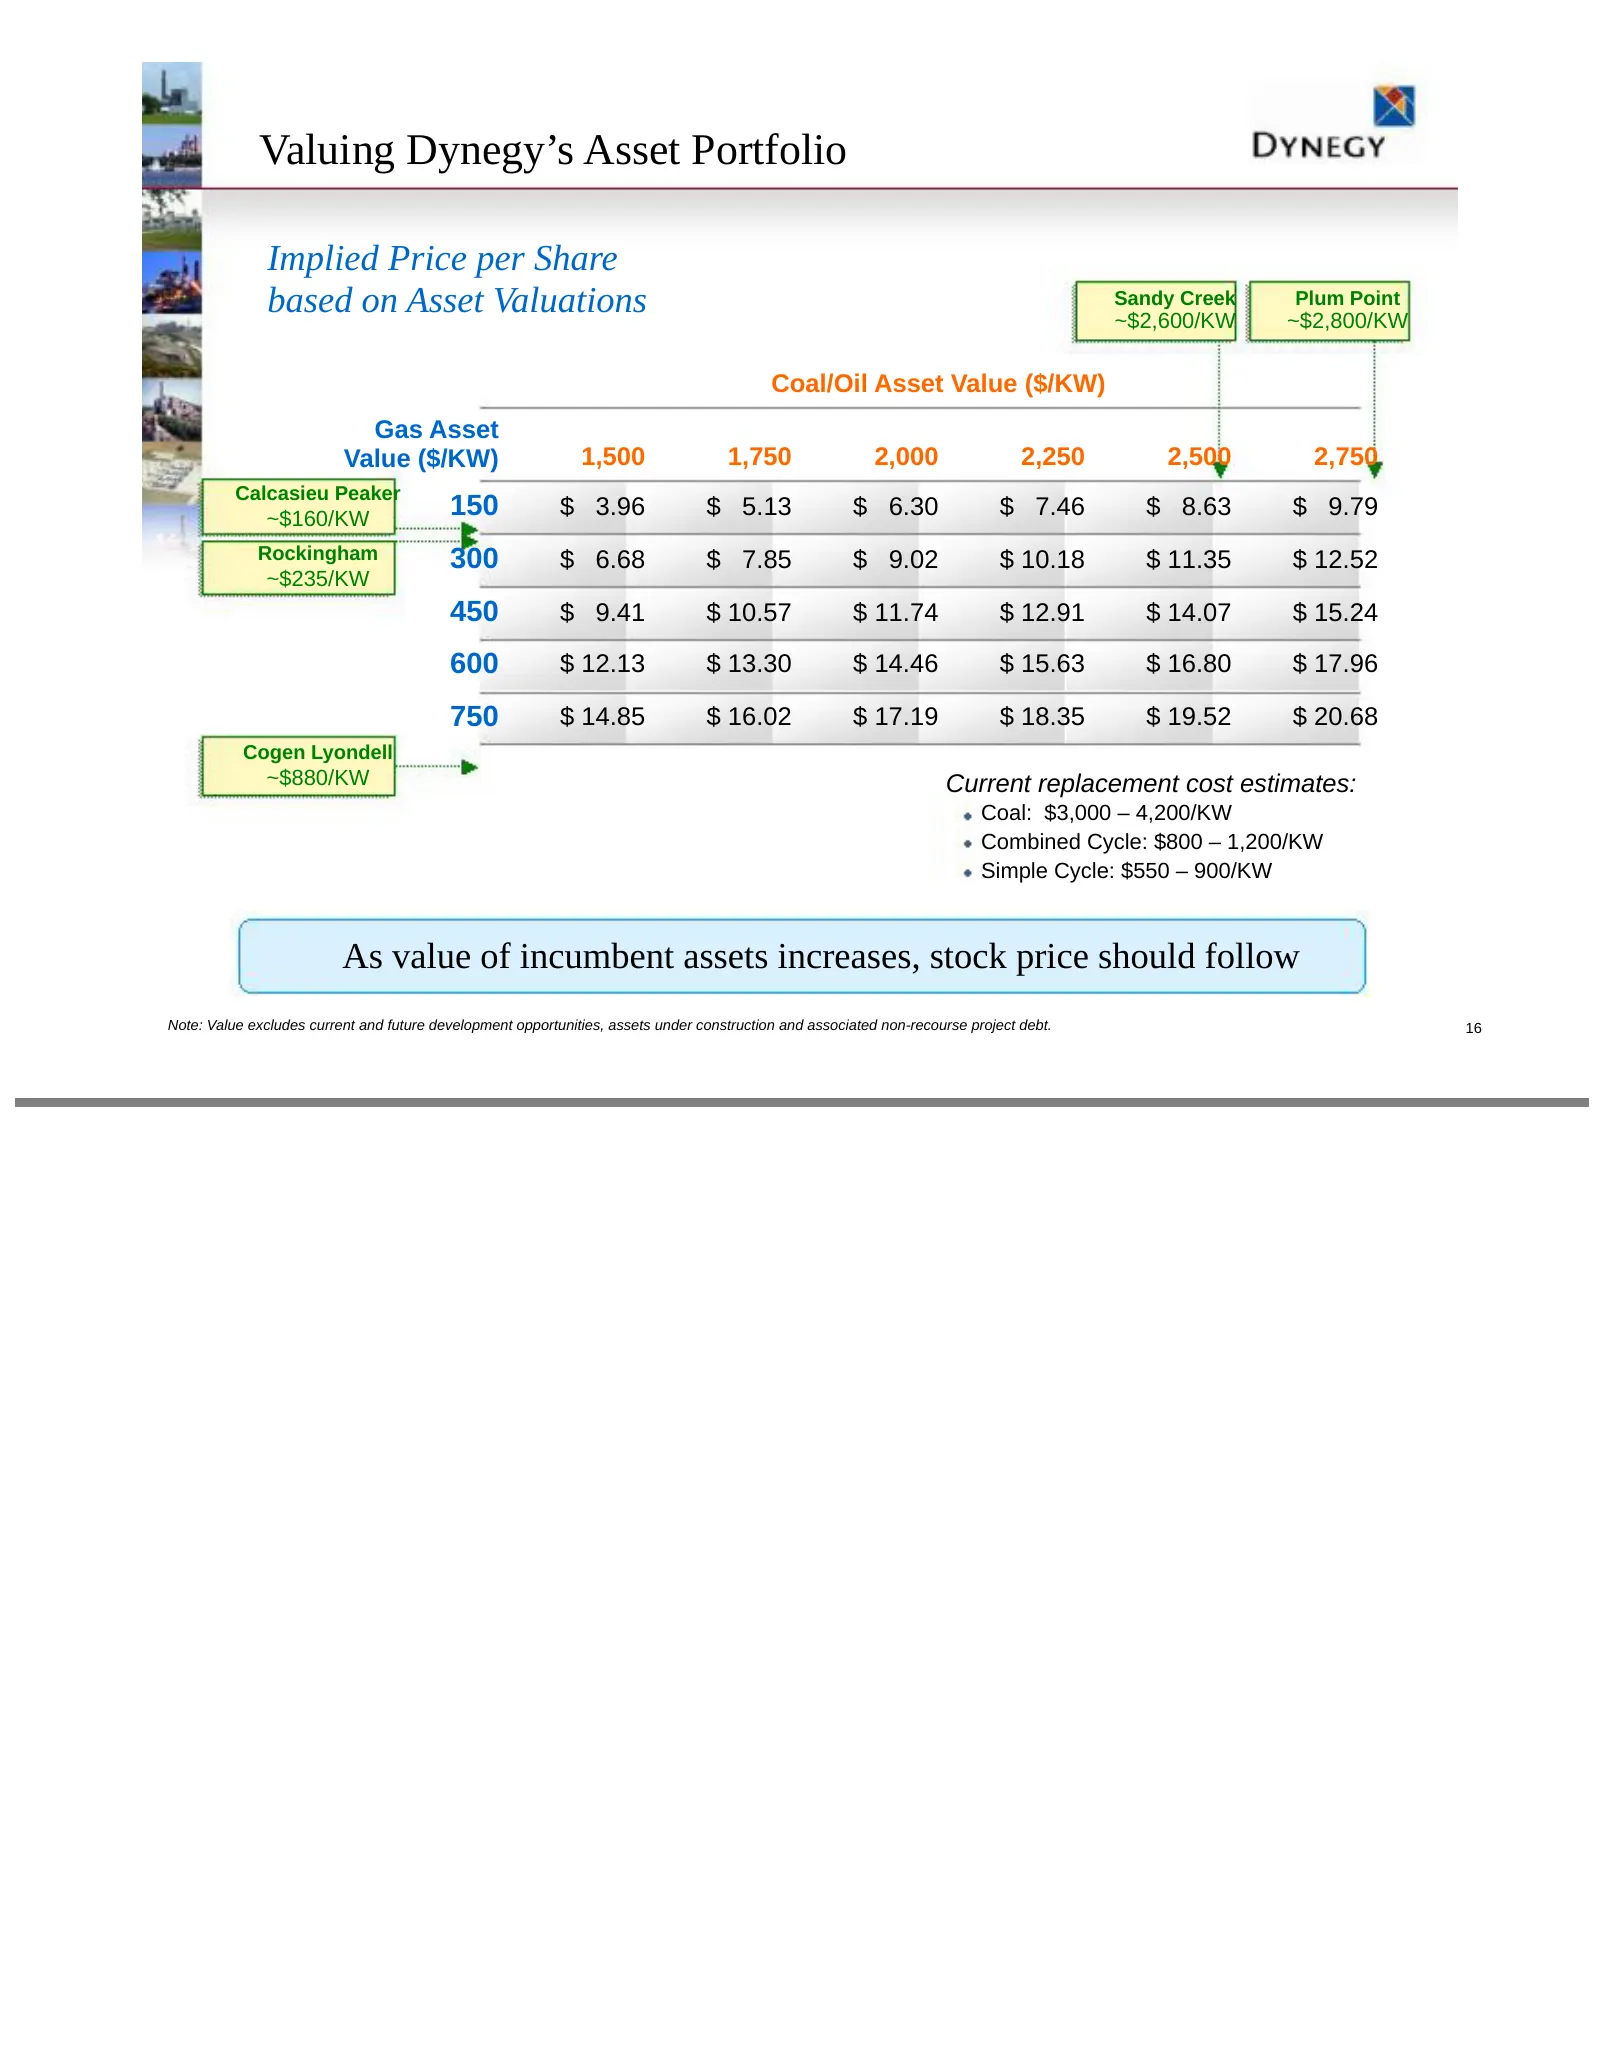
Valuing Dynegy’s Asset Portfolio Implied Price per Share based on Asset Valuations Sandy Creek ~$2,600/KW Plum Point ~$2,800/KW Coal/Oil Asset Value ($/KW) Gas Asset Value ($/KW) 1,500 1,750 2,000 2,250 2,500 2,750 Calcasieu Peaker ~$160/KW 150 $ 3.96 $ 5.13 $ 6.30 $ 7.46 $ 8.63 $ 9.79 Rockingham 30
Slide 17: Significant Opportunity for Value Creation
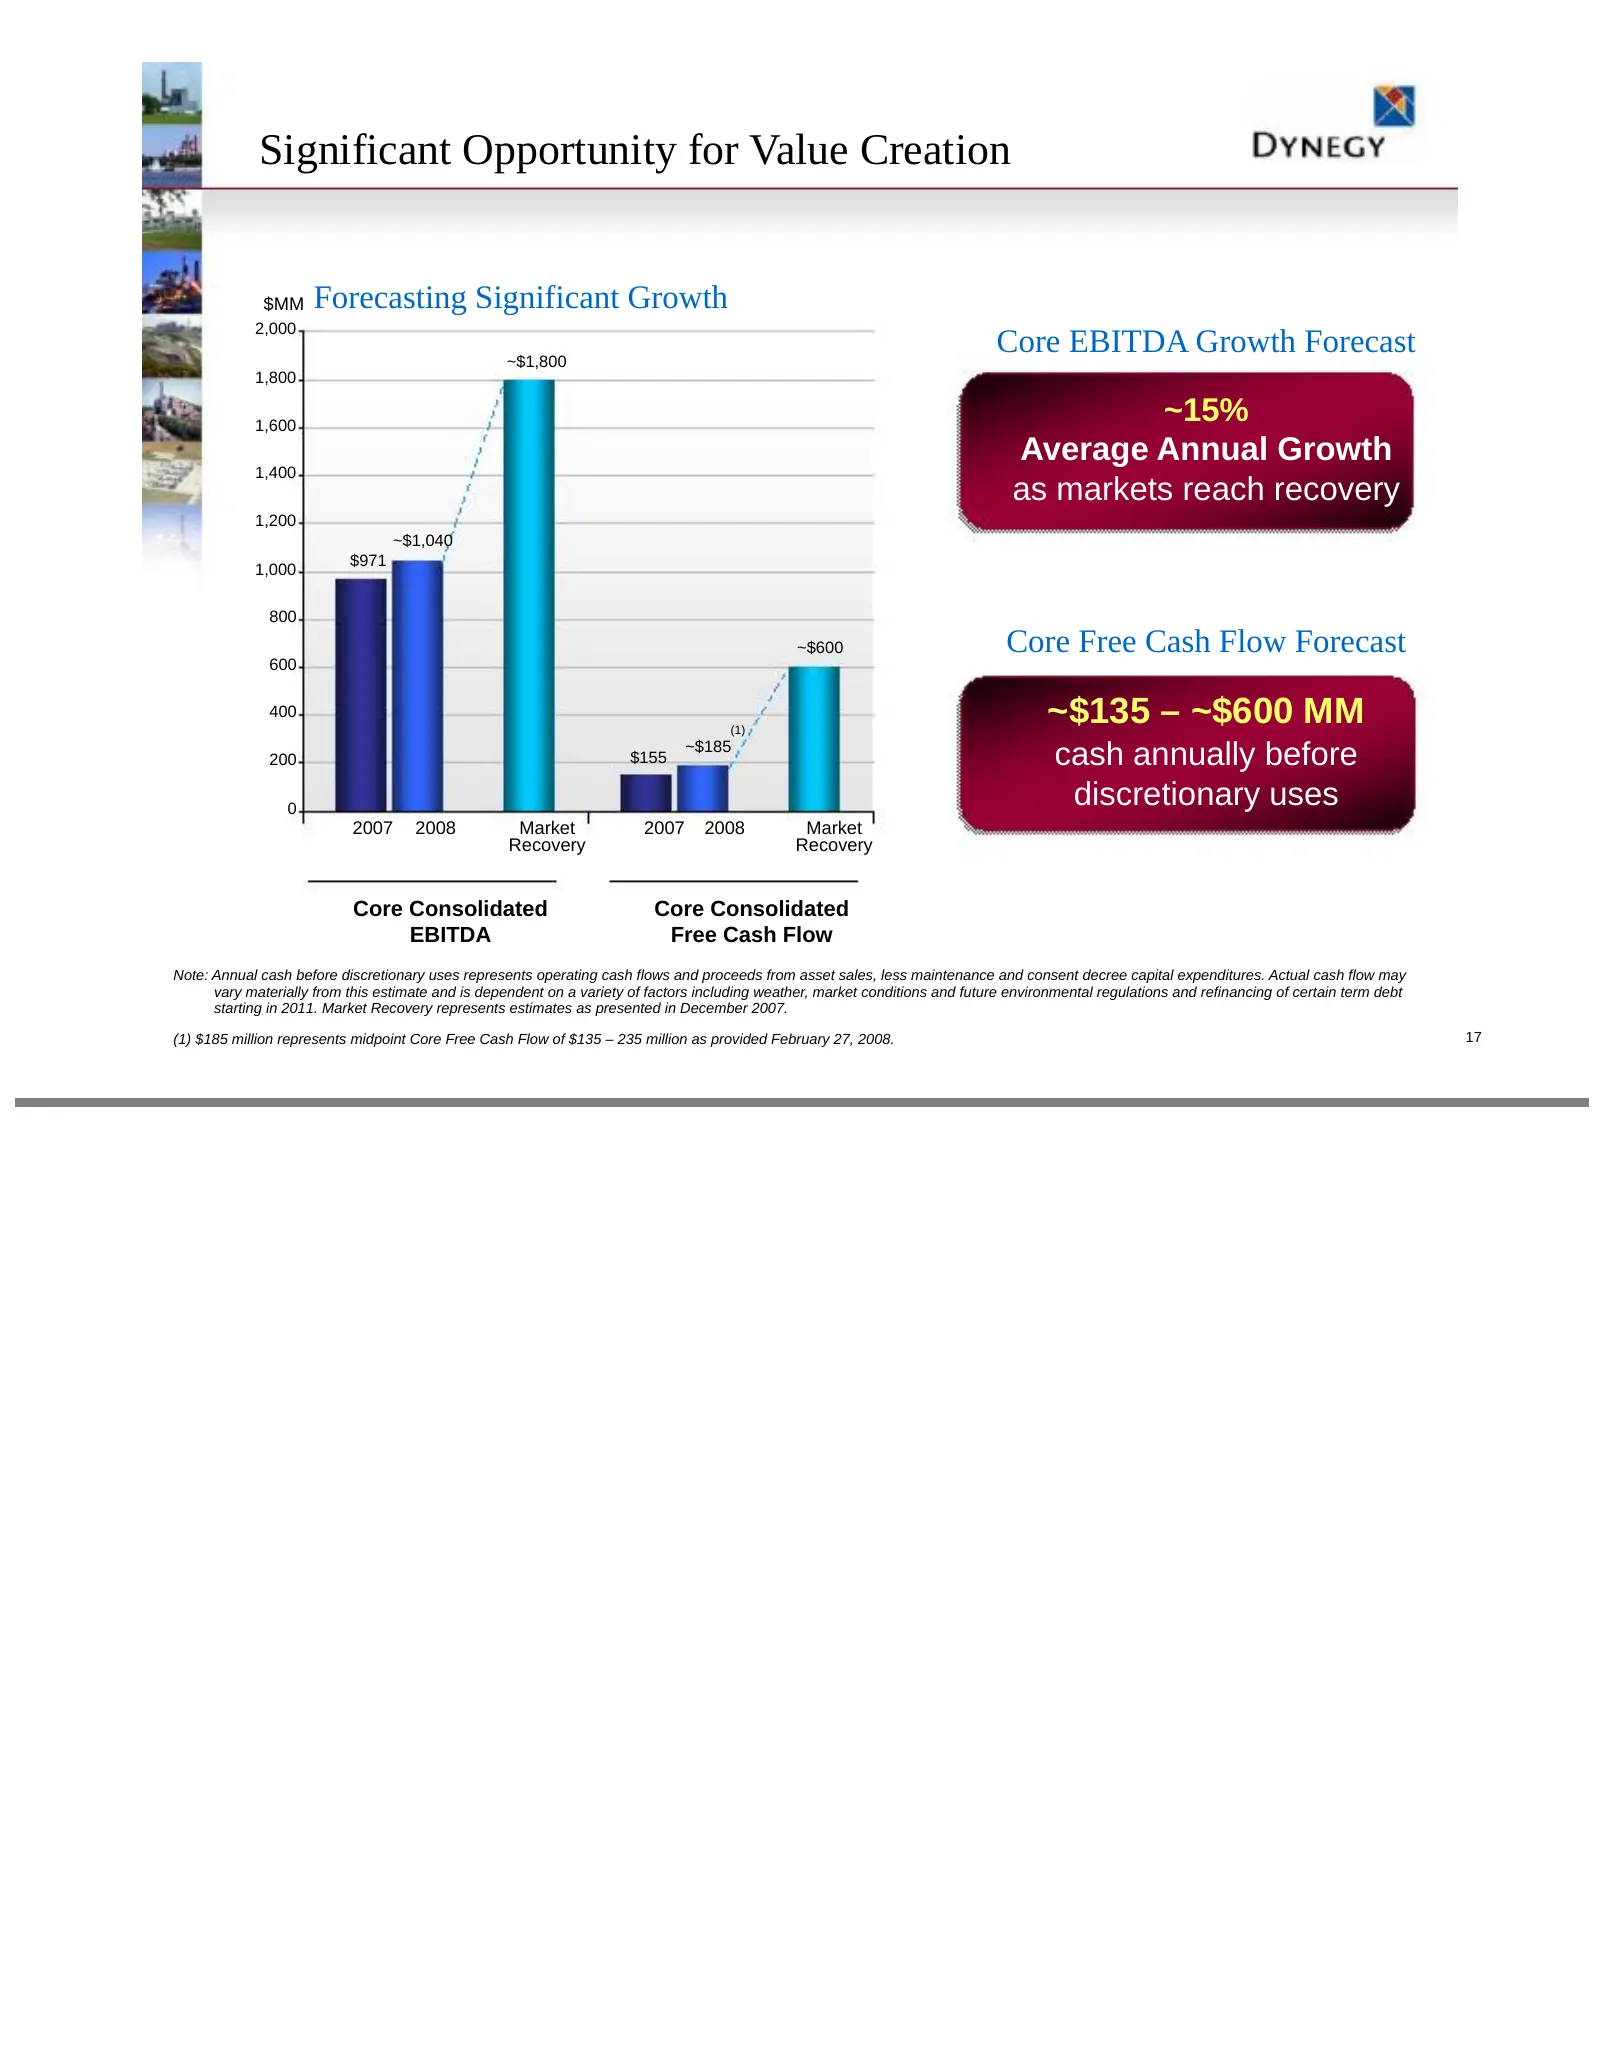
Significant Opportunity for Value Creation $MM Forecasting Significant Growth 2,000 ~$1,800 Core EBITDA Growth Forecast 1,800 1,600 ~15% Average Annual Growth 1,400 as markets reach recovery 1,200 ~$1,040 $971 1,000 800 ~$600 Core Free Cash Flow Forecast 600 400 (1) ~$135 – ~$600 MM 200 $155 ~$185 c
Slide 18: Value Proposition for Dynegy Investors
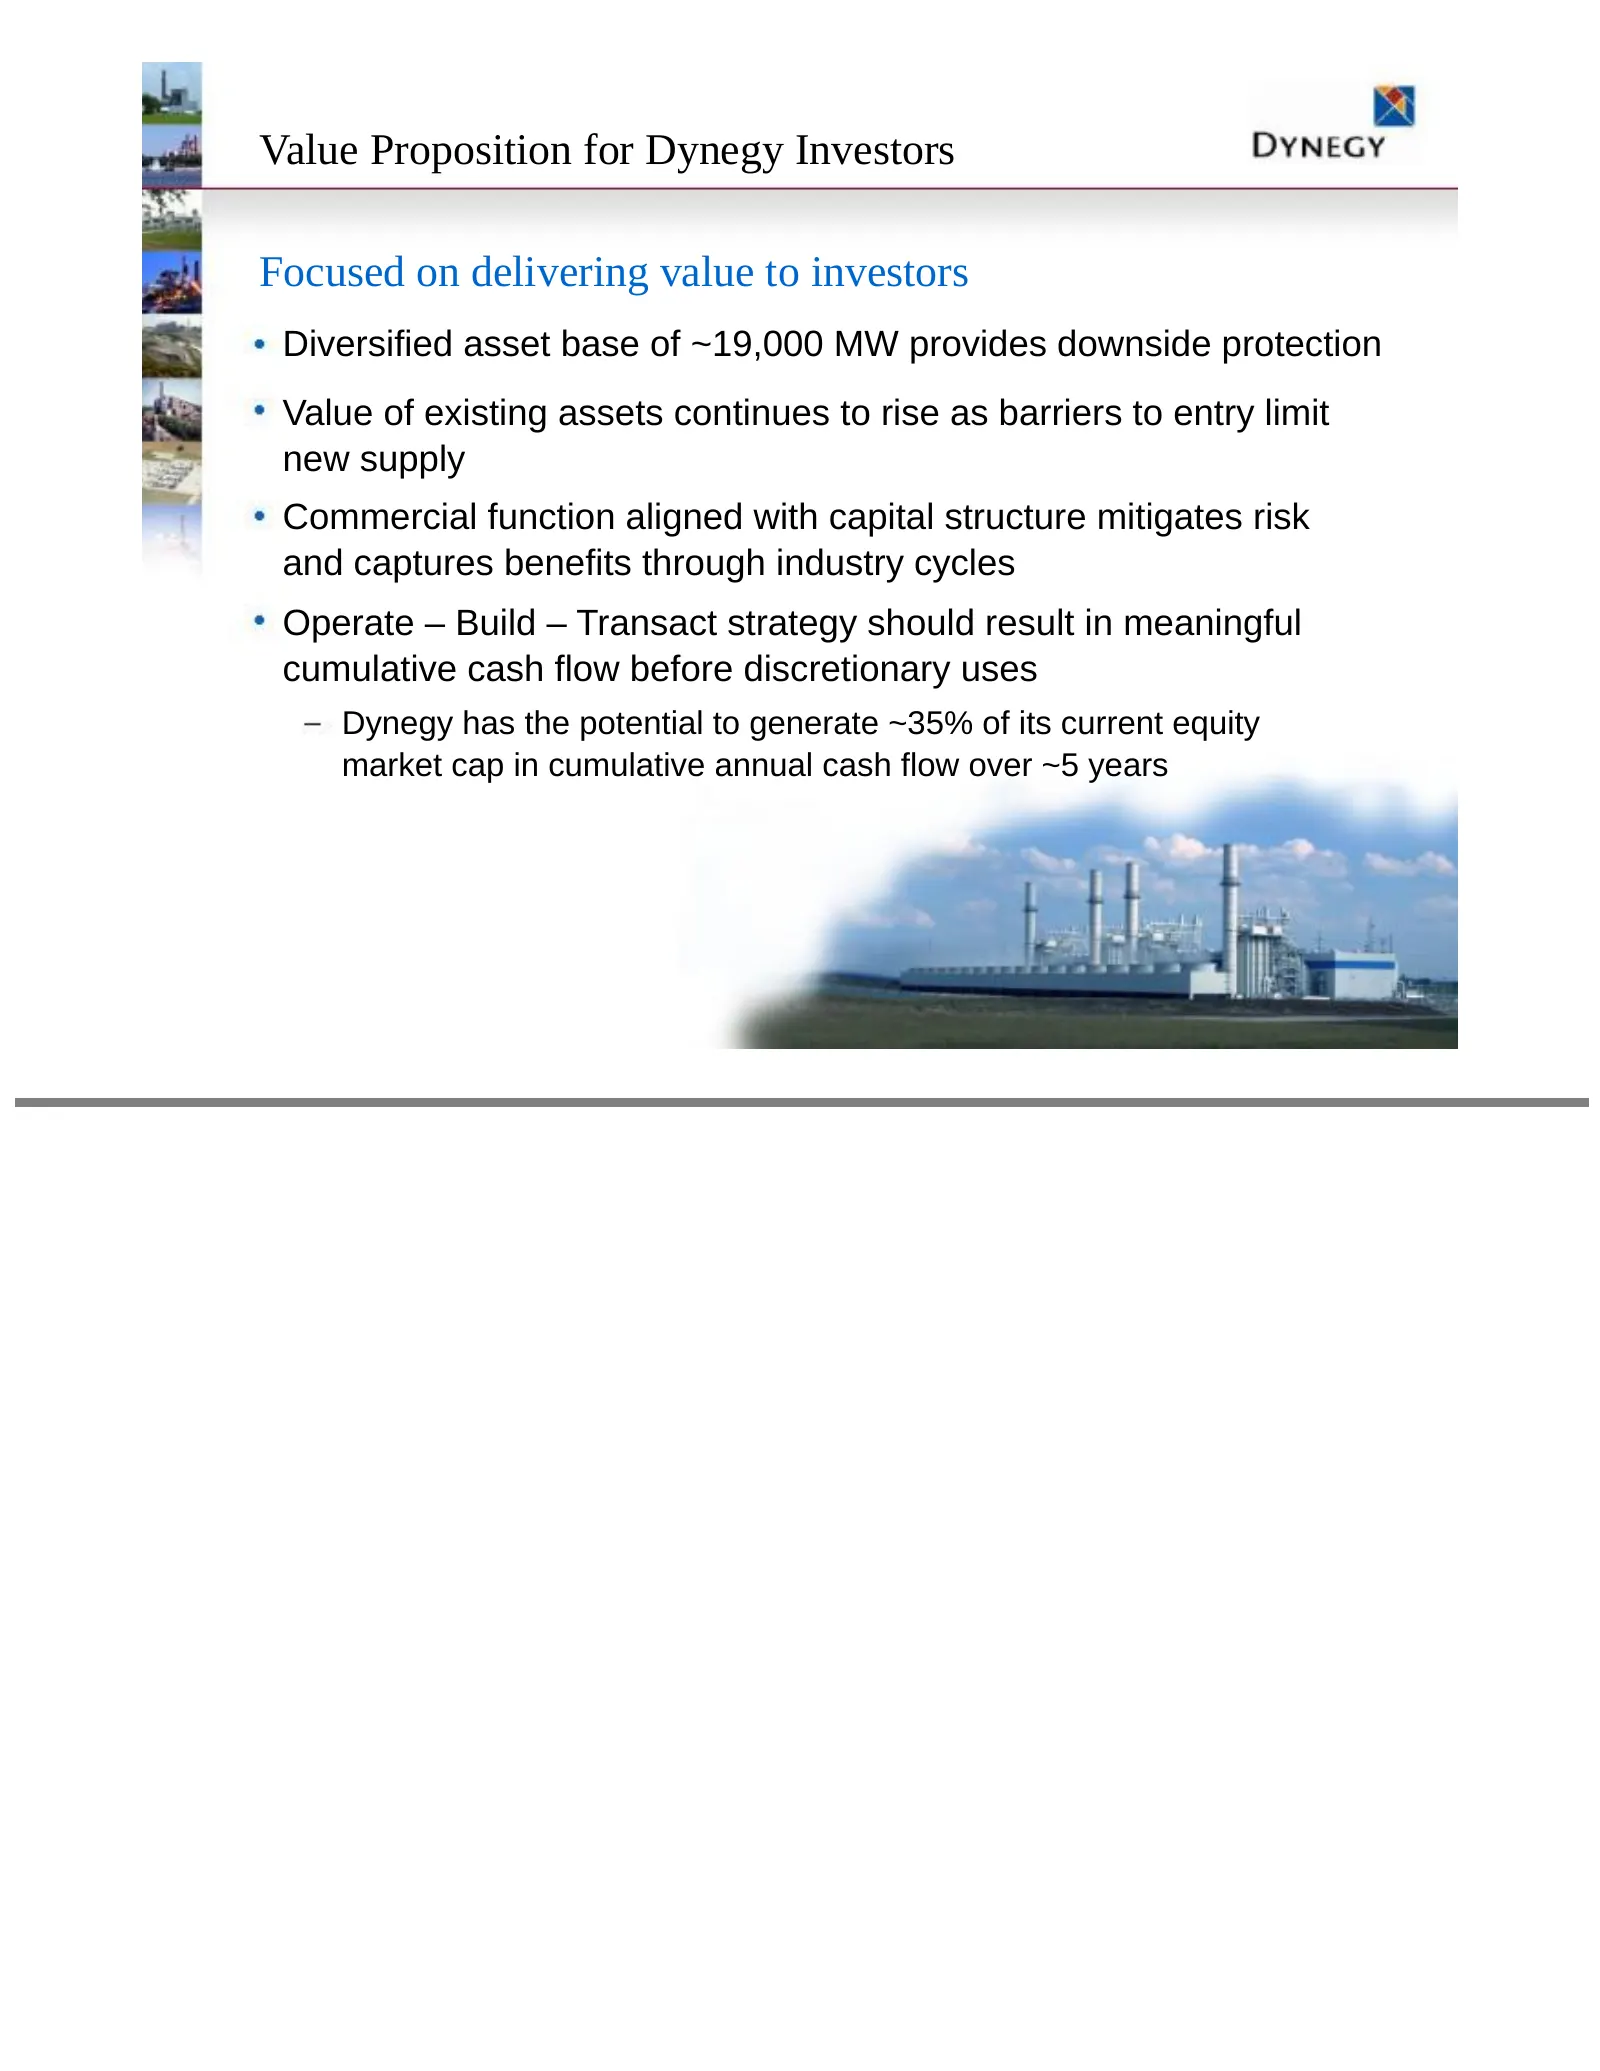
Value Proposition for Dynegy Investors Focused on delivering value to investors Diversified asset base of ~19,000 MW provides downside protection Value of existing assets continues to rise as barriers to entry limit new supply Commercial function aligned with capital structure mitigates risk and cap
Slide 19: Appendix
Appendix DYNEGY
Slide 20: From Clearing House to IPP
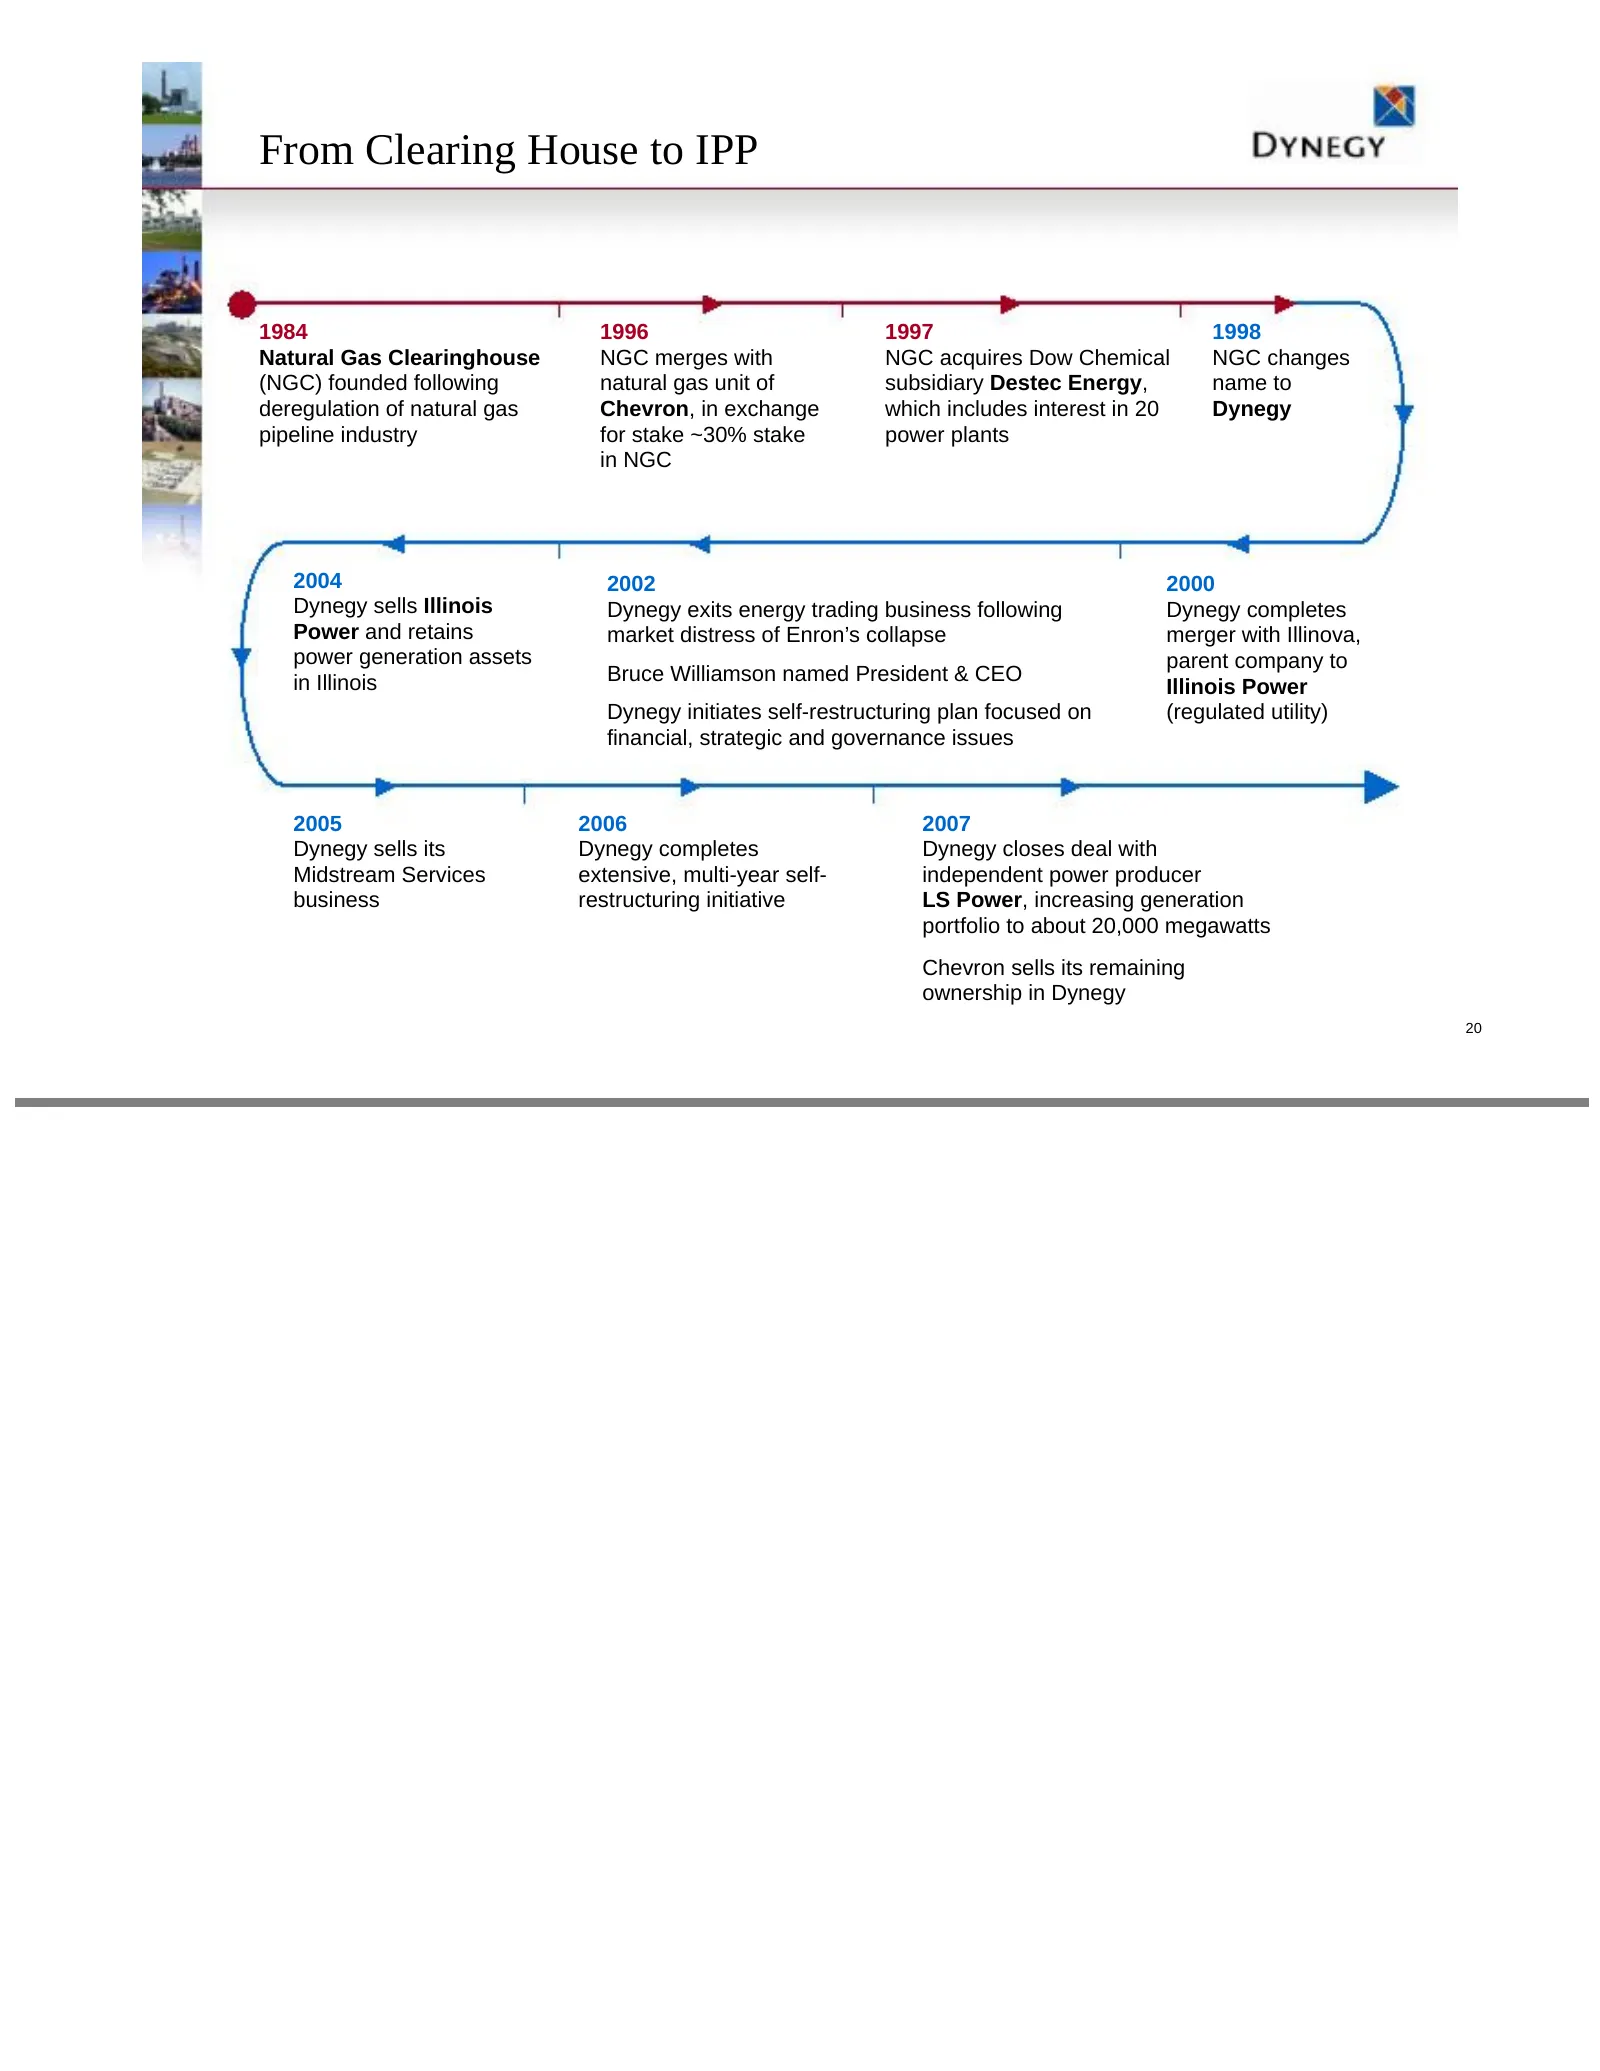
From Clearing House to IPP 1984 1996 1997 1998 Natural Gas Clearinghouse NGC merges with NGC acquires Dow Chemical NGC changes (NGC) founded following natural gas unit of subsidiary Destec Energy, name to deregulation of natural gas Chevron, in exchange which includes interest in 20 Dynegy pipeline
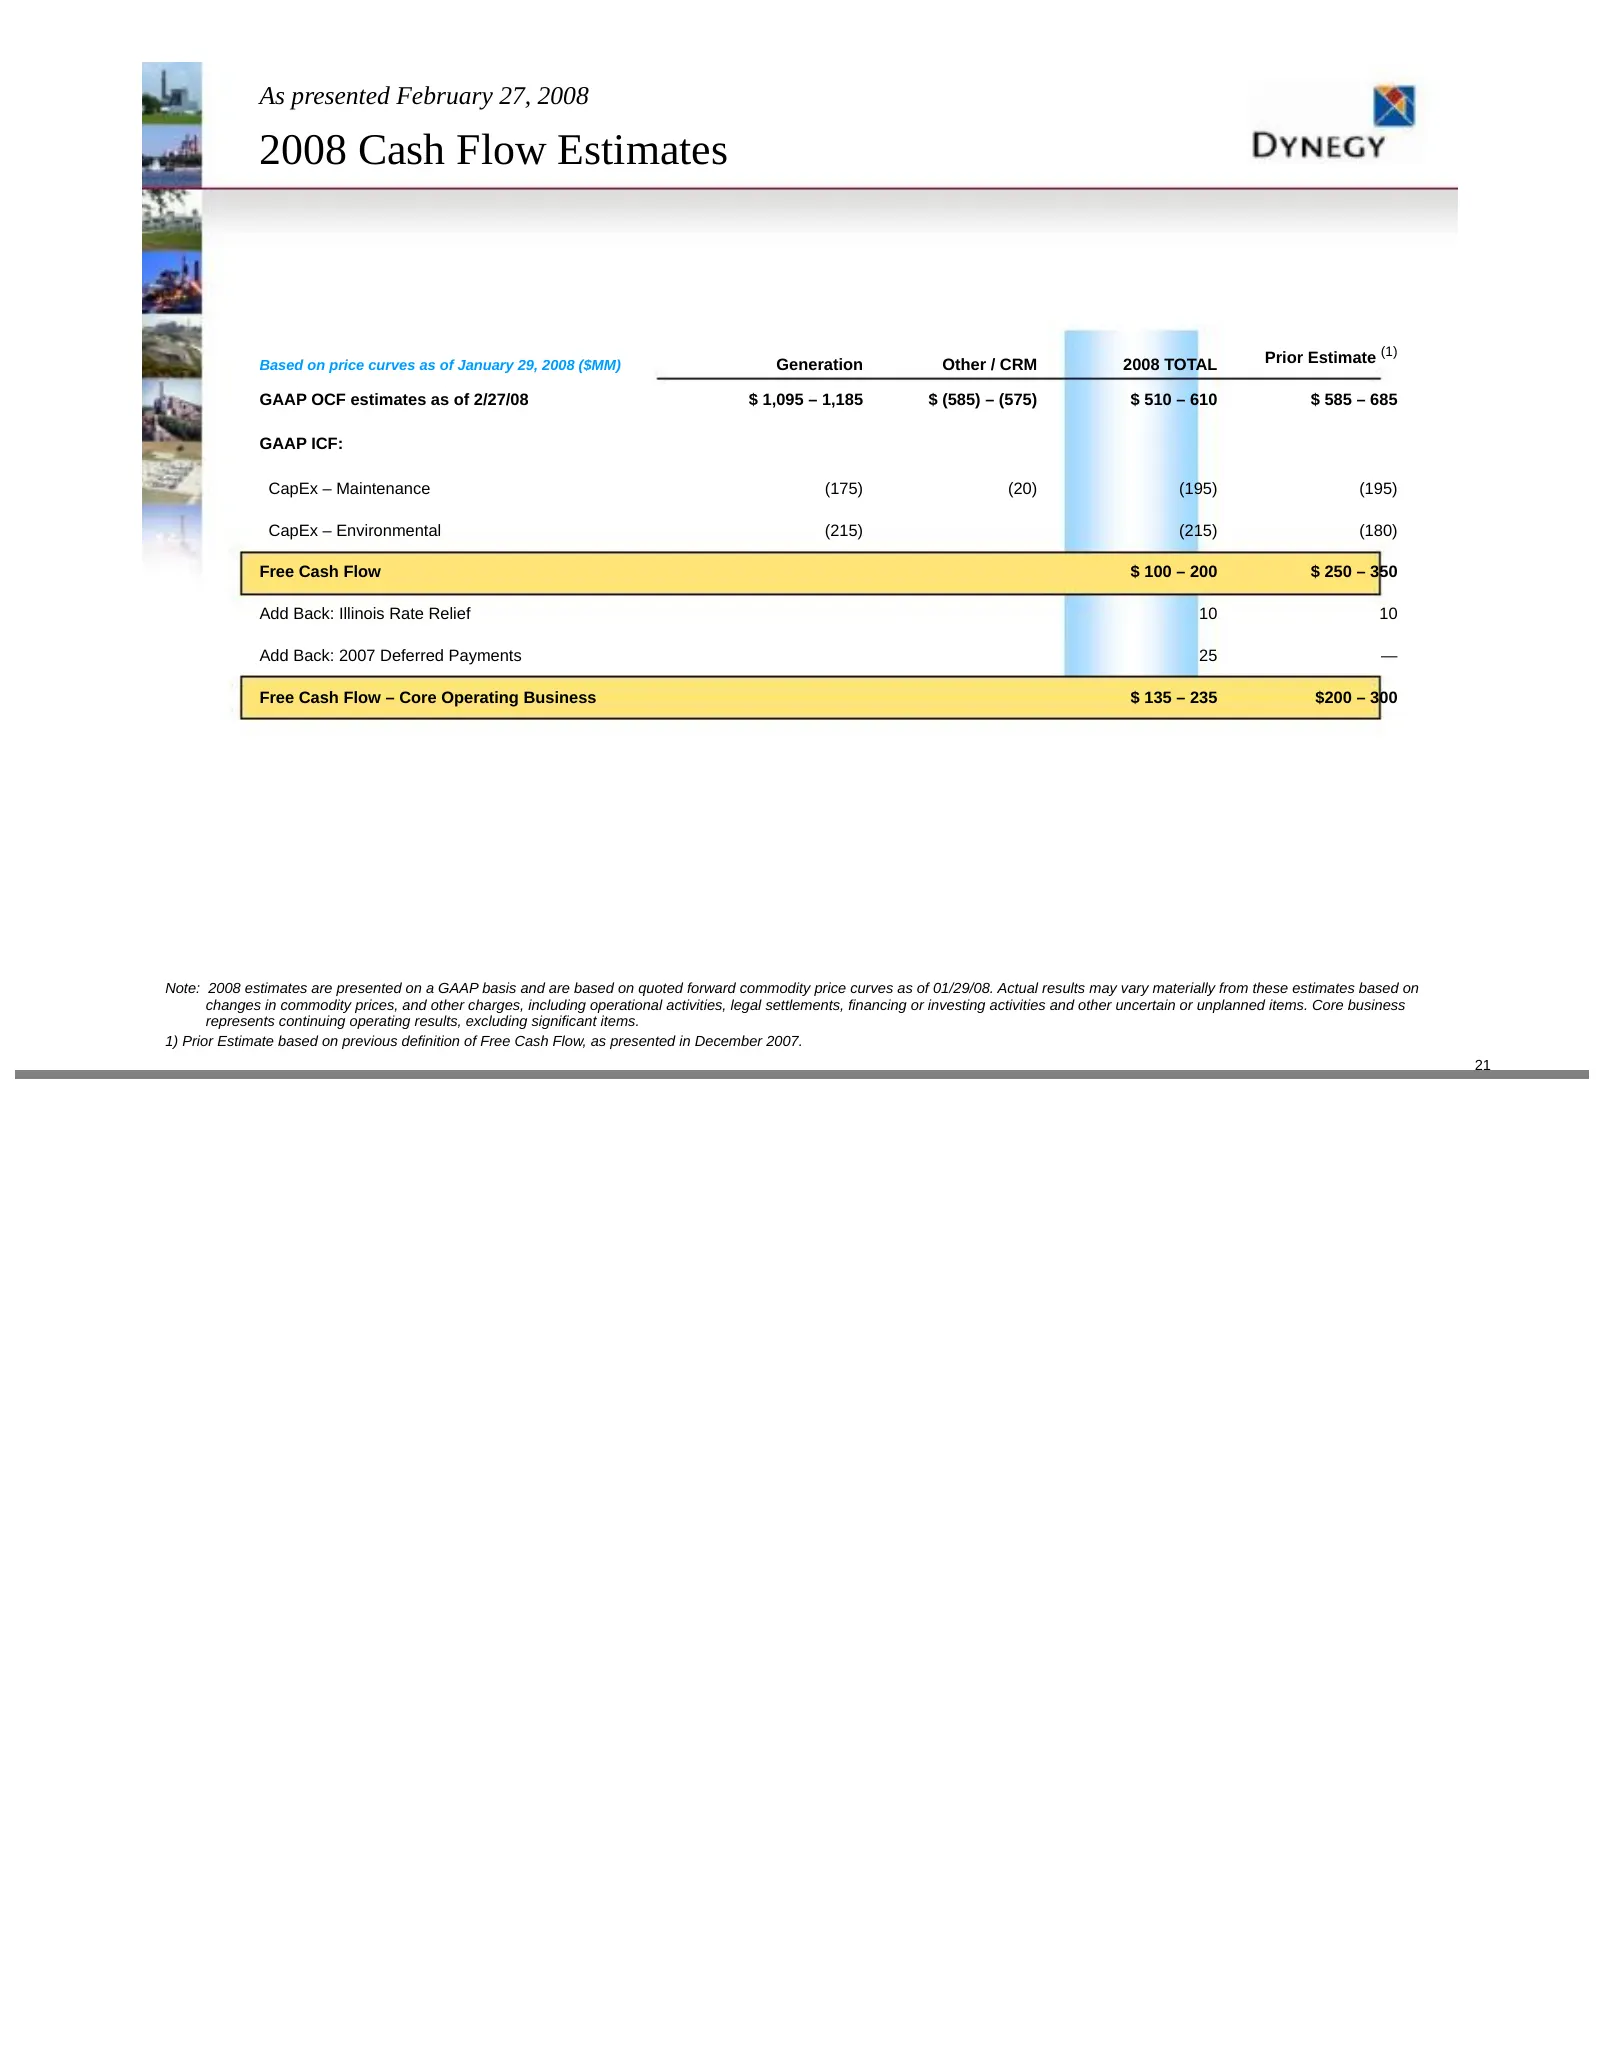
Slide 21: 2008 Cash Flow Estimates
As presented February 27, 2008 2008 Cash Flow Estimates Based on price curves as of January 29, 2008 ($MM) Generation Other / CRM 2008 TOTAL Prior Estimate (1) GAAP OCF estimates as of 2/27/08 $ 1,095 – 1,185 $ (585) – (575) $ 510 – 610 $ 585 – 685 GAAP ICF: CapEx – Maintenance (175) (20) (195) (195
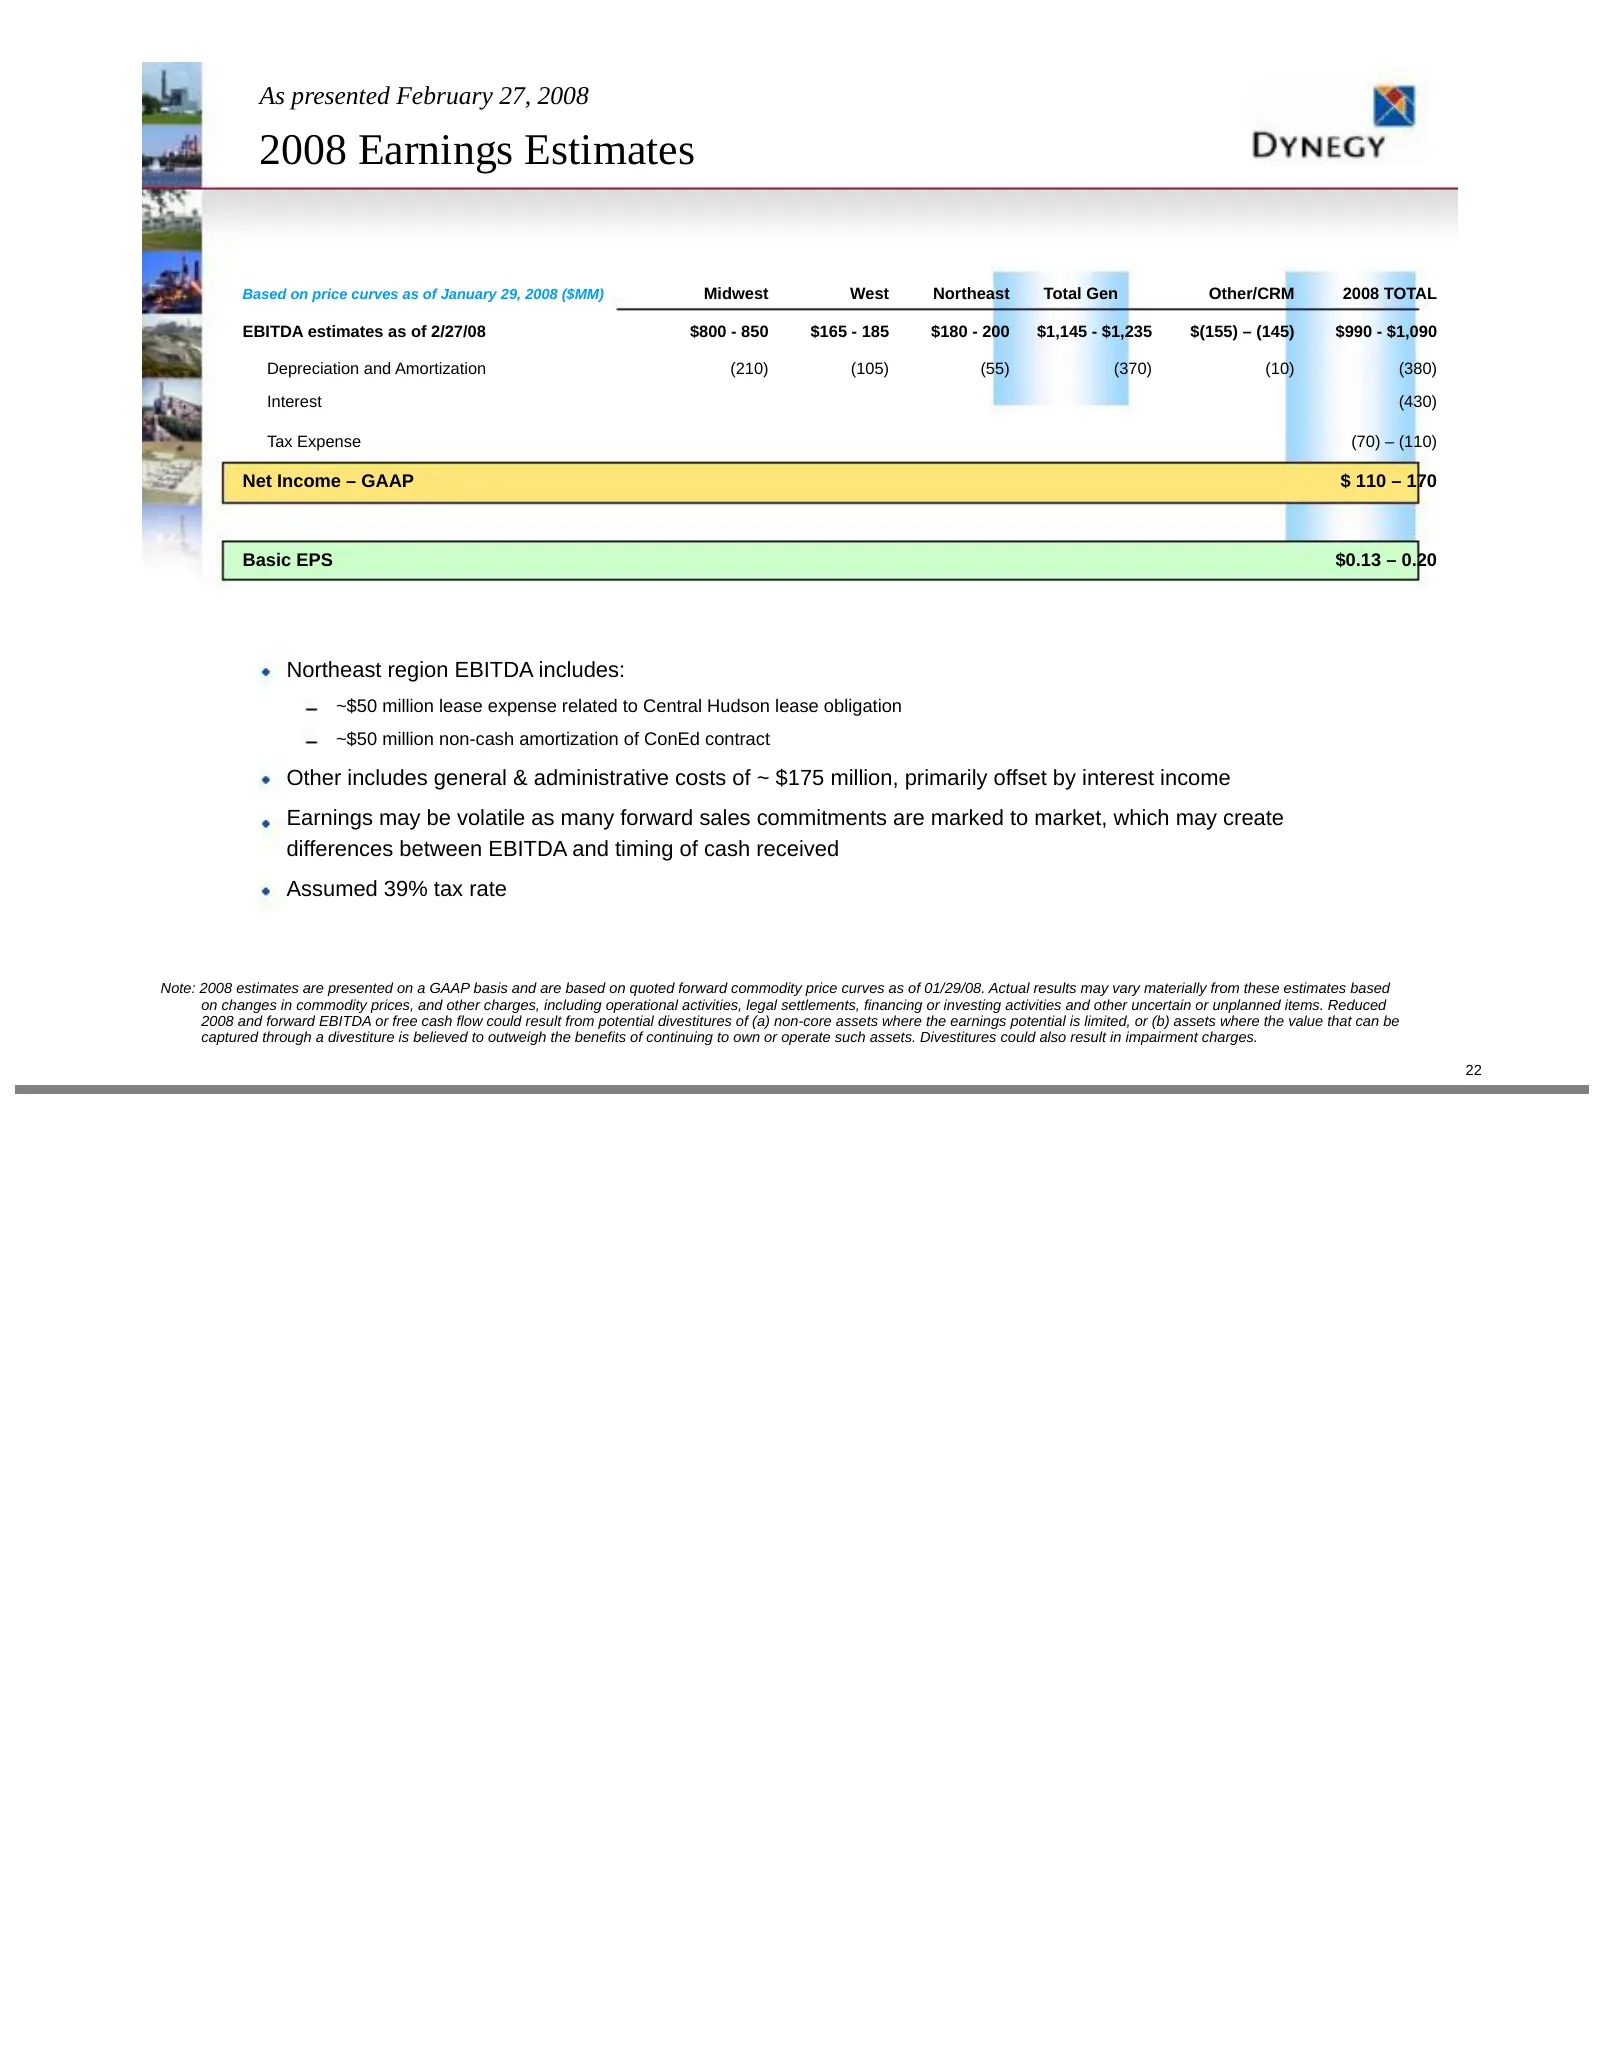
Slide 22: 2008 Earnings Estimates
As presented February 27, 2008 2008 Earnings Estimates Based on price curves as of January 29, 2008 ($MM) Midwest West Northeast Total Gen Other/CRM 2008 TOTAL EBITDA estimates as of 2/27/08 $800 - 850 $165 - 185 $180 - 200 $1,145 - $1,235 $(155) – (145) $990 - $1,090 Depreciation and Amortization (
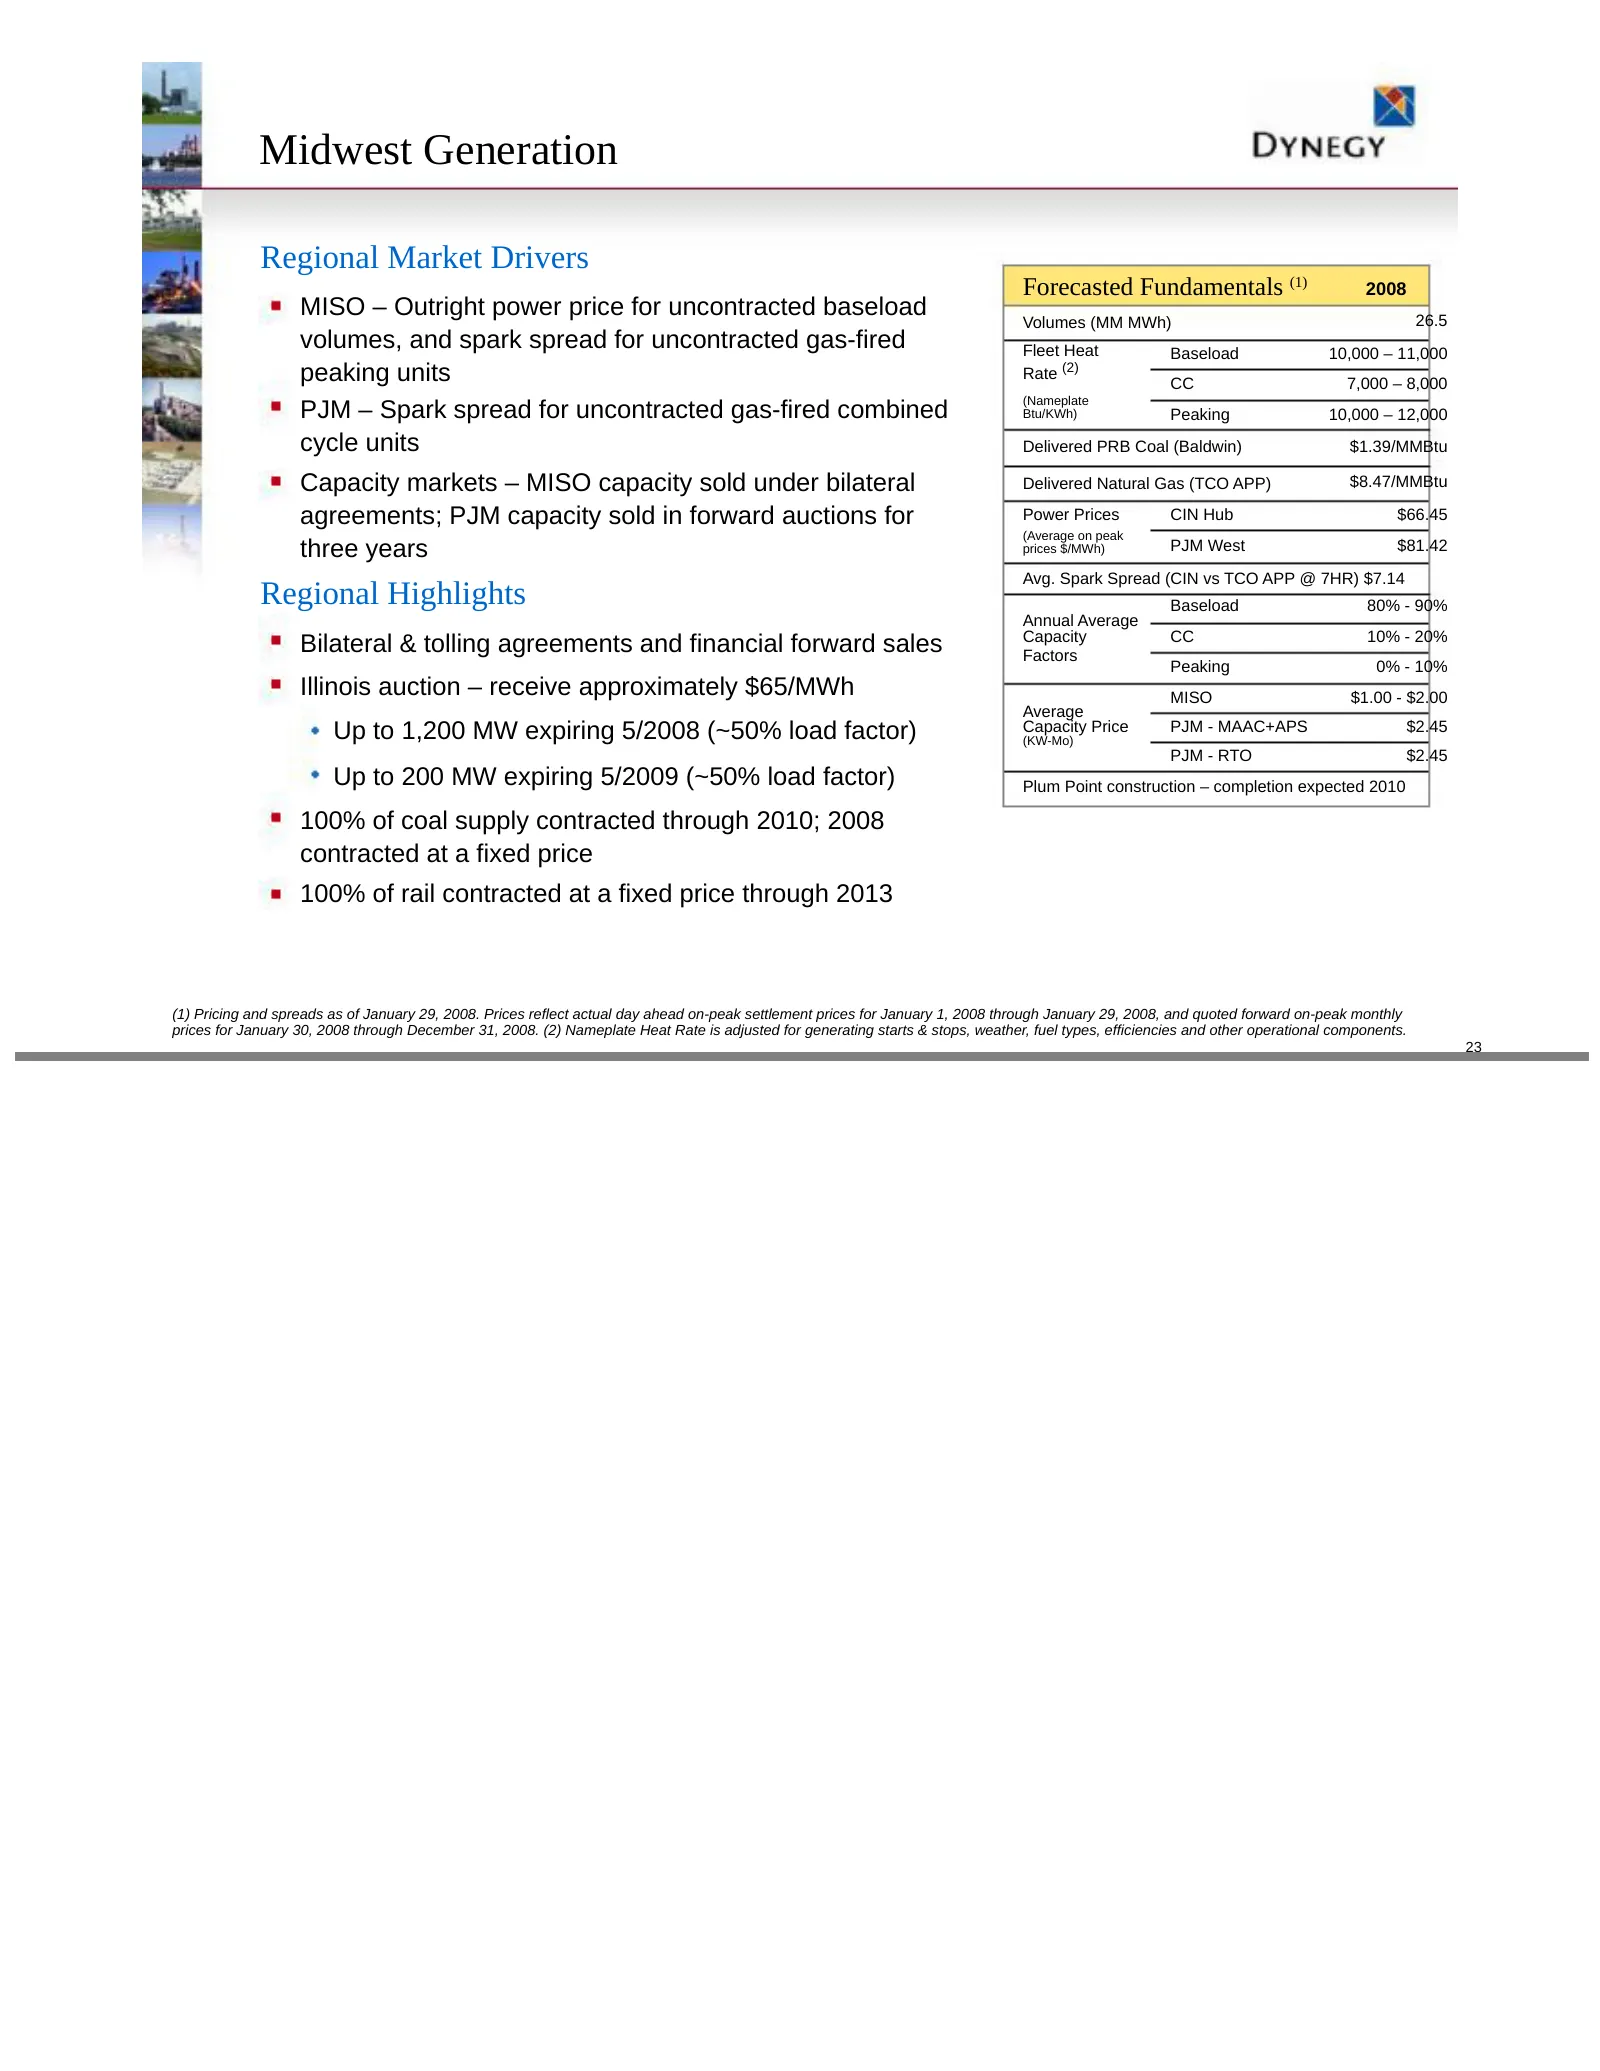
Slide 23: Midwest Generation
Midwest Generation Regional Market Drivers Forecasted Fundamentals (1) 2008 MISO – Outright power price for uncontracted baseload Volumes (MM MWh) 26.5 volumes, and spark spread for uncontracted gas-fired Fleet Heat Baseload 10,000 – 11,000 peaking units Rate (2) CC 7,000 – 8,000 (Nameplate PJM – Sp
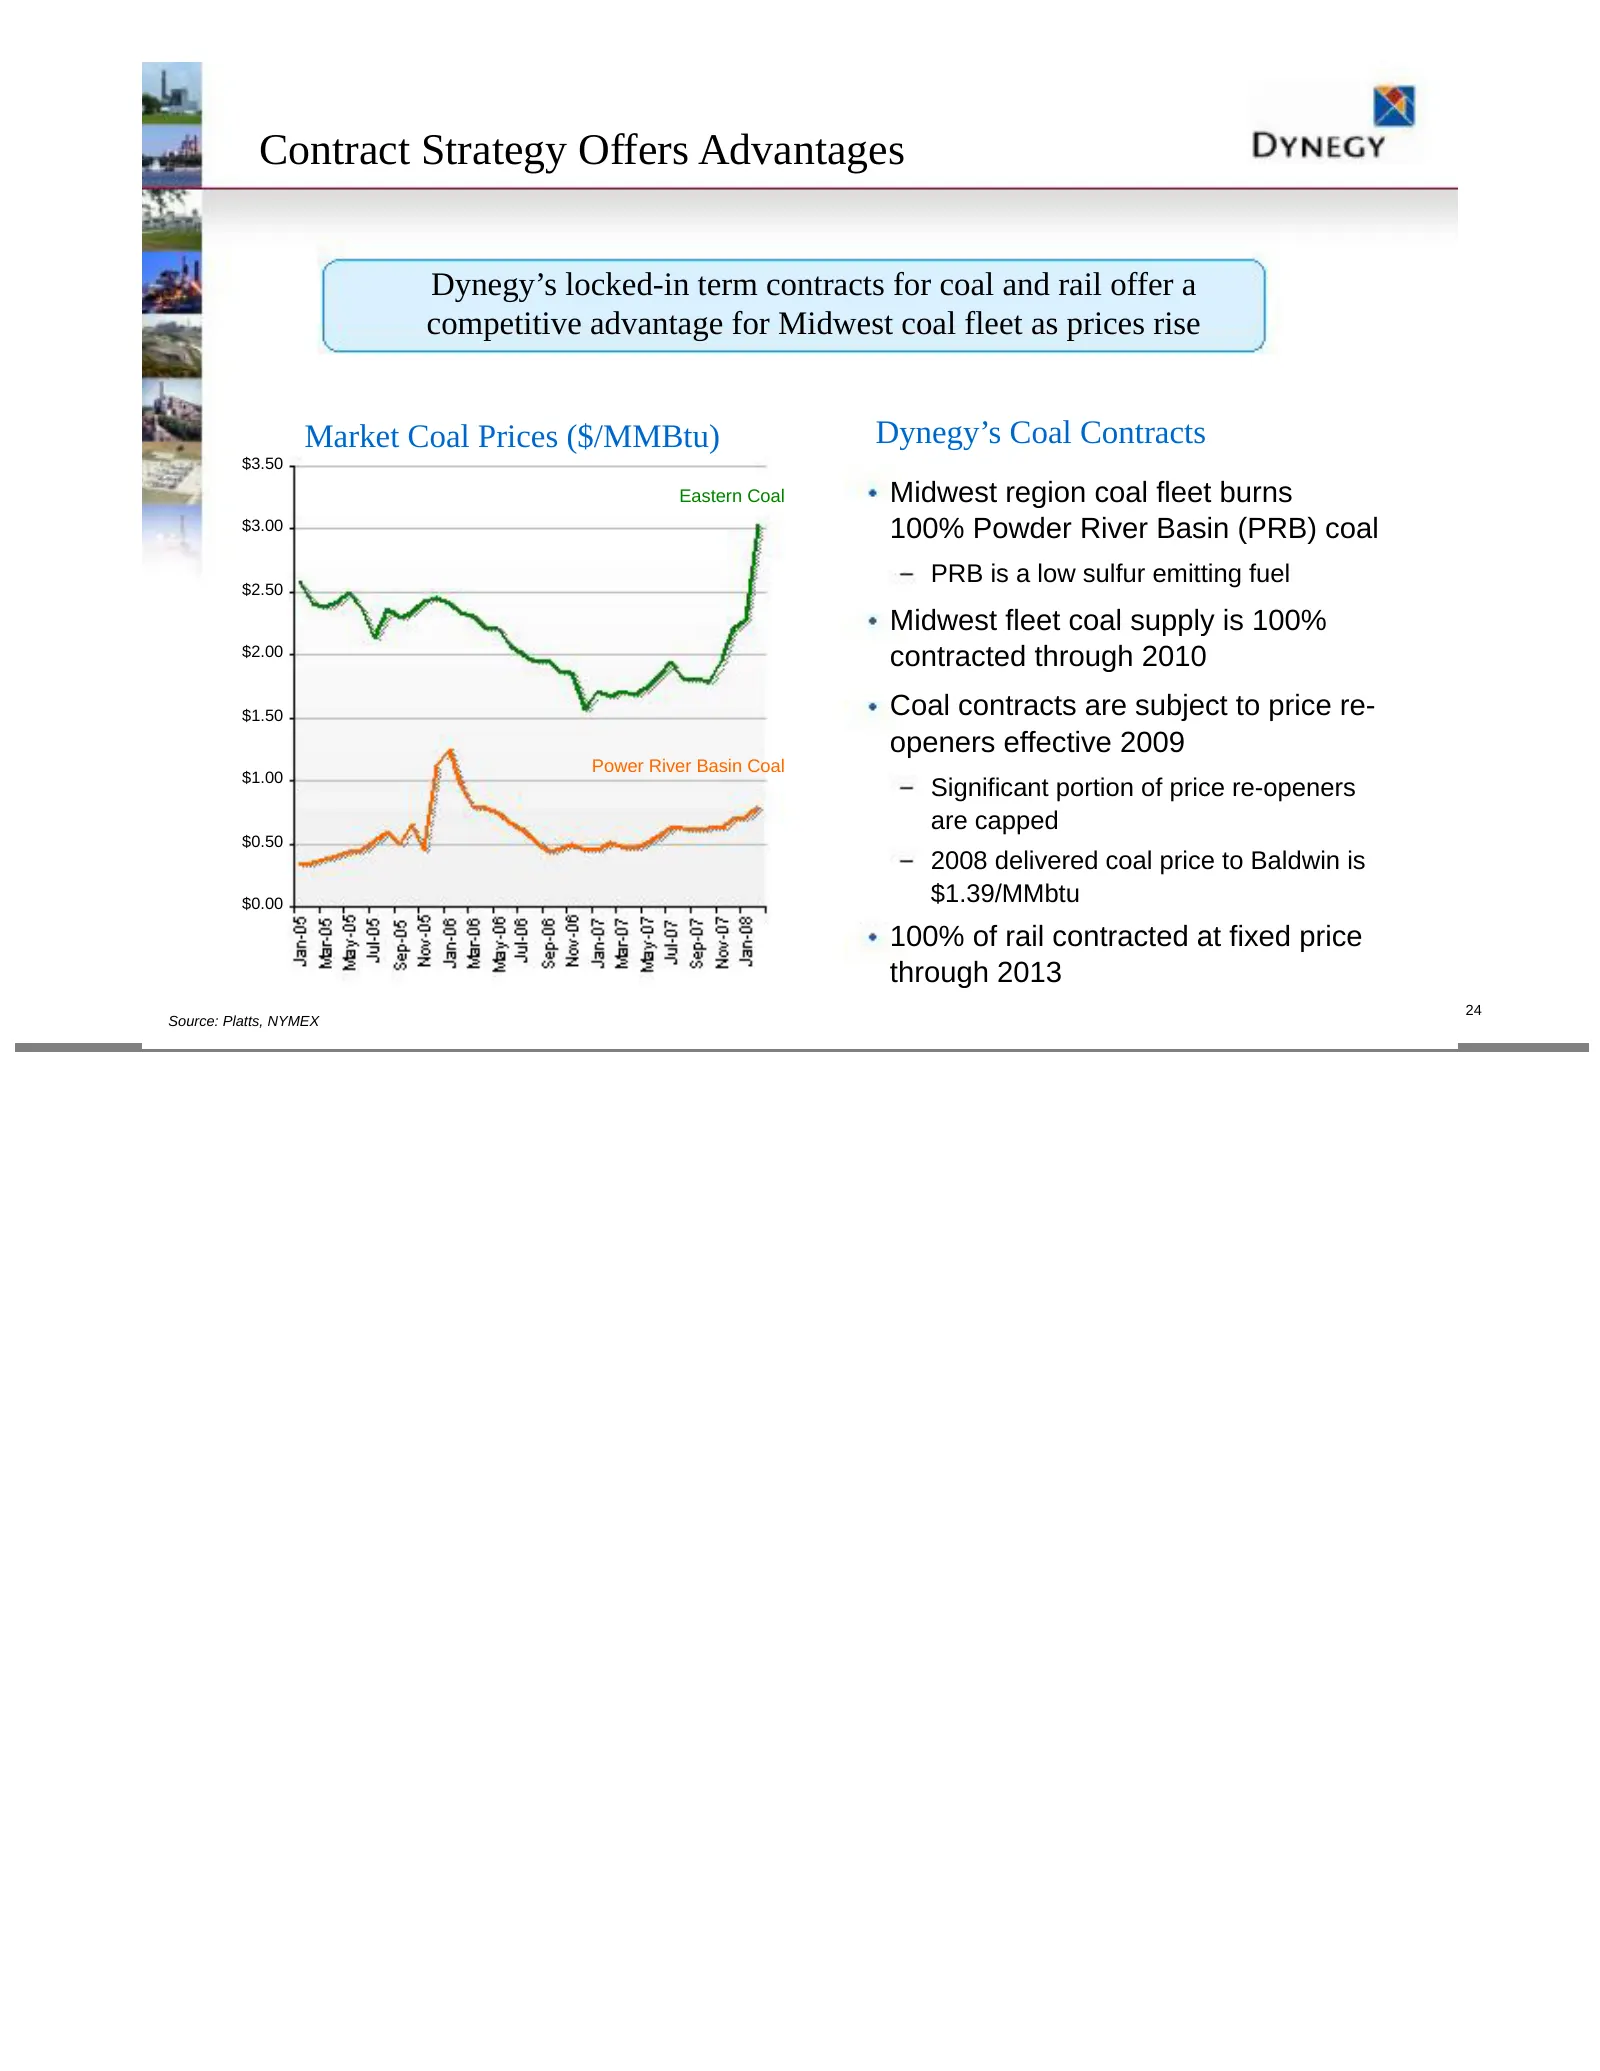
Slide 24: Contract Strategy Offers Advantages
Contract Strategy Offers Advantages Dynegy’s locked-in term contracts for coal and rail offer a competitive advantage for Midwest coal fleet as prices rise Market Coal Prices ($/MMBtu) Dynegy’s Coal Contracts $3.50 Eastern Coal Midwest region coal fleet burns $3.00 100% Powder River Basin (PRB) coal
Slide 25: West Generation
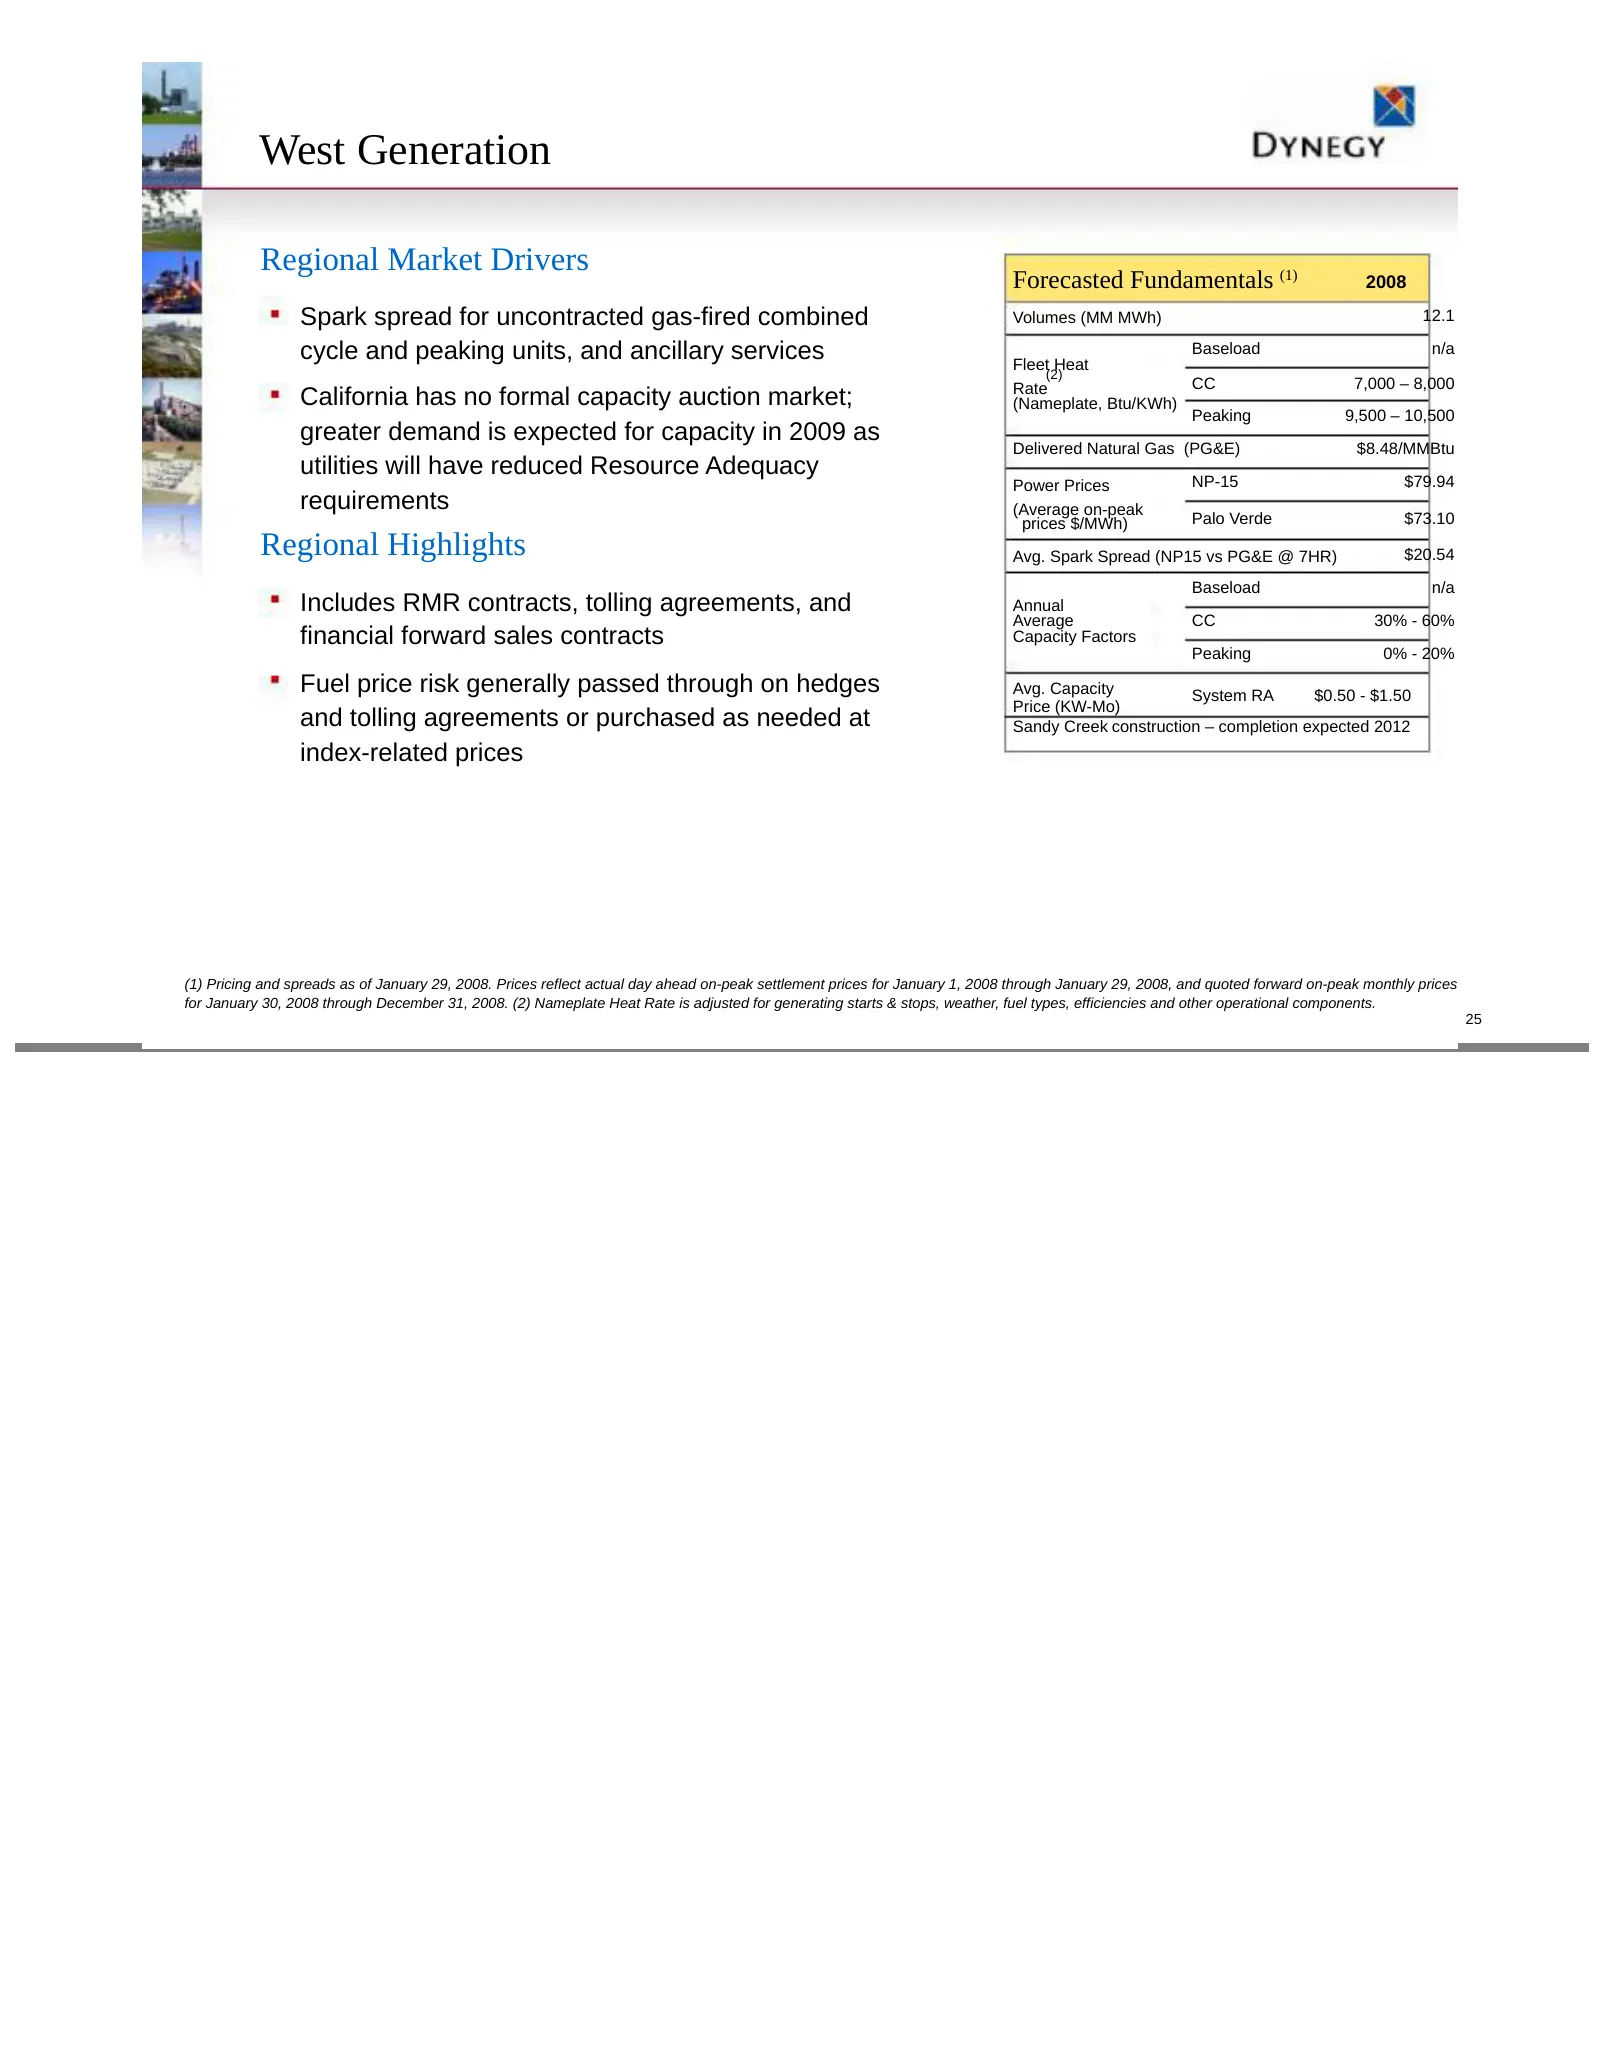
West Generation Regional Market Drivers Forecasted Fundamentals (1) 2008 Spark spread for uncontracted gas-fired combined Volumes (MM MWh) 12.1 cycle and peaking units, and ancillary services Fleet Heat Baseload n/a (2) Rate CC 7,000 – 8,000 California has no formal capacity auction market; (Namepla
Slide 26: Northeast Generation
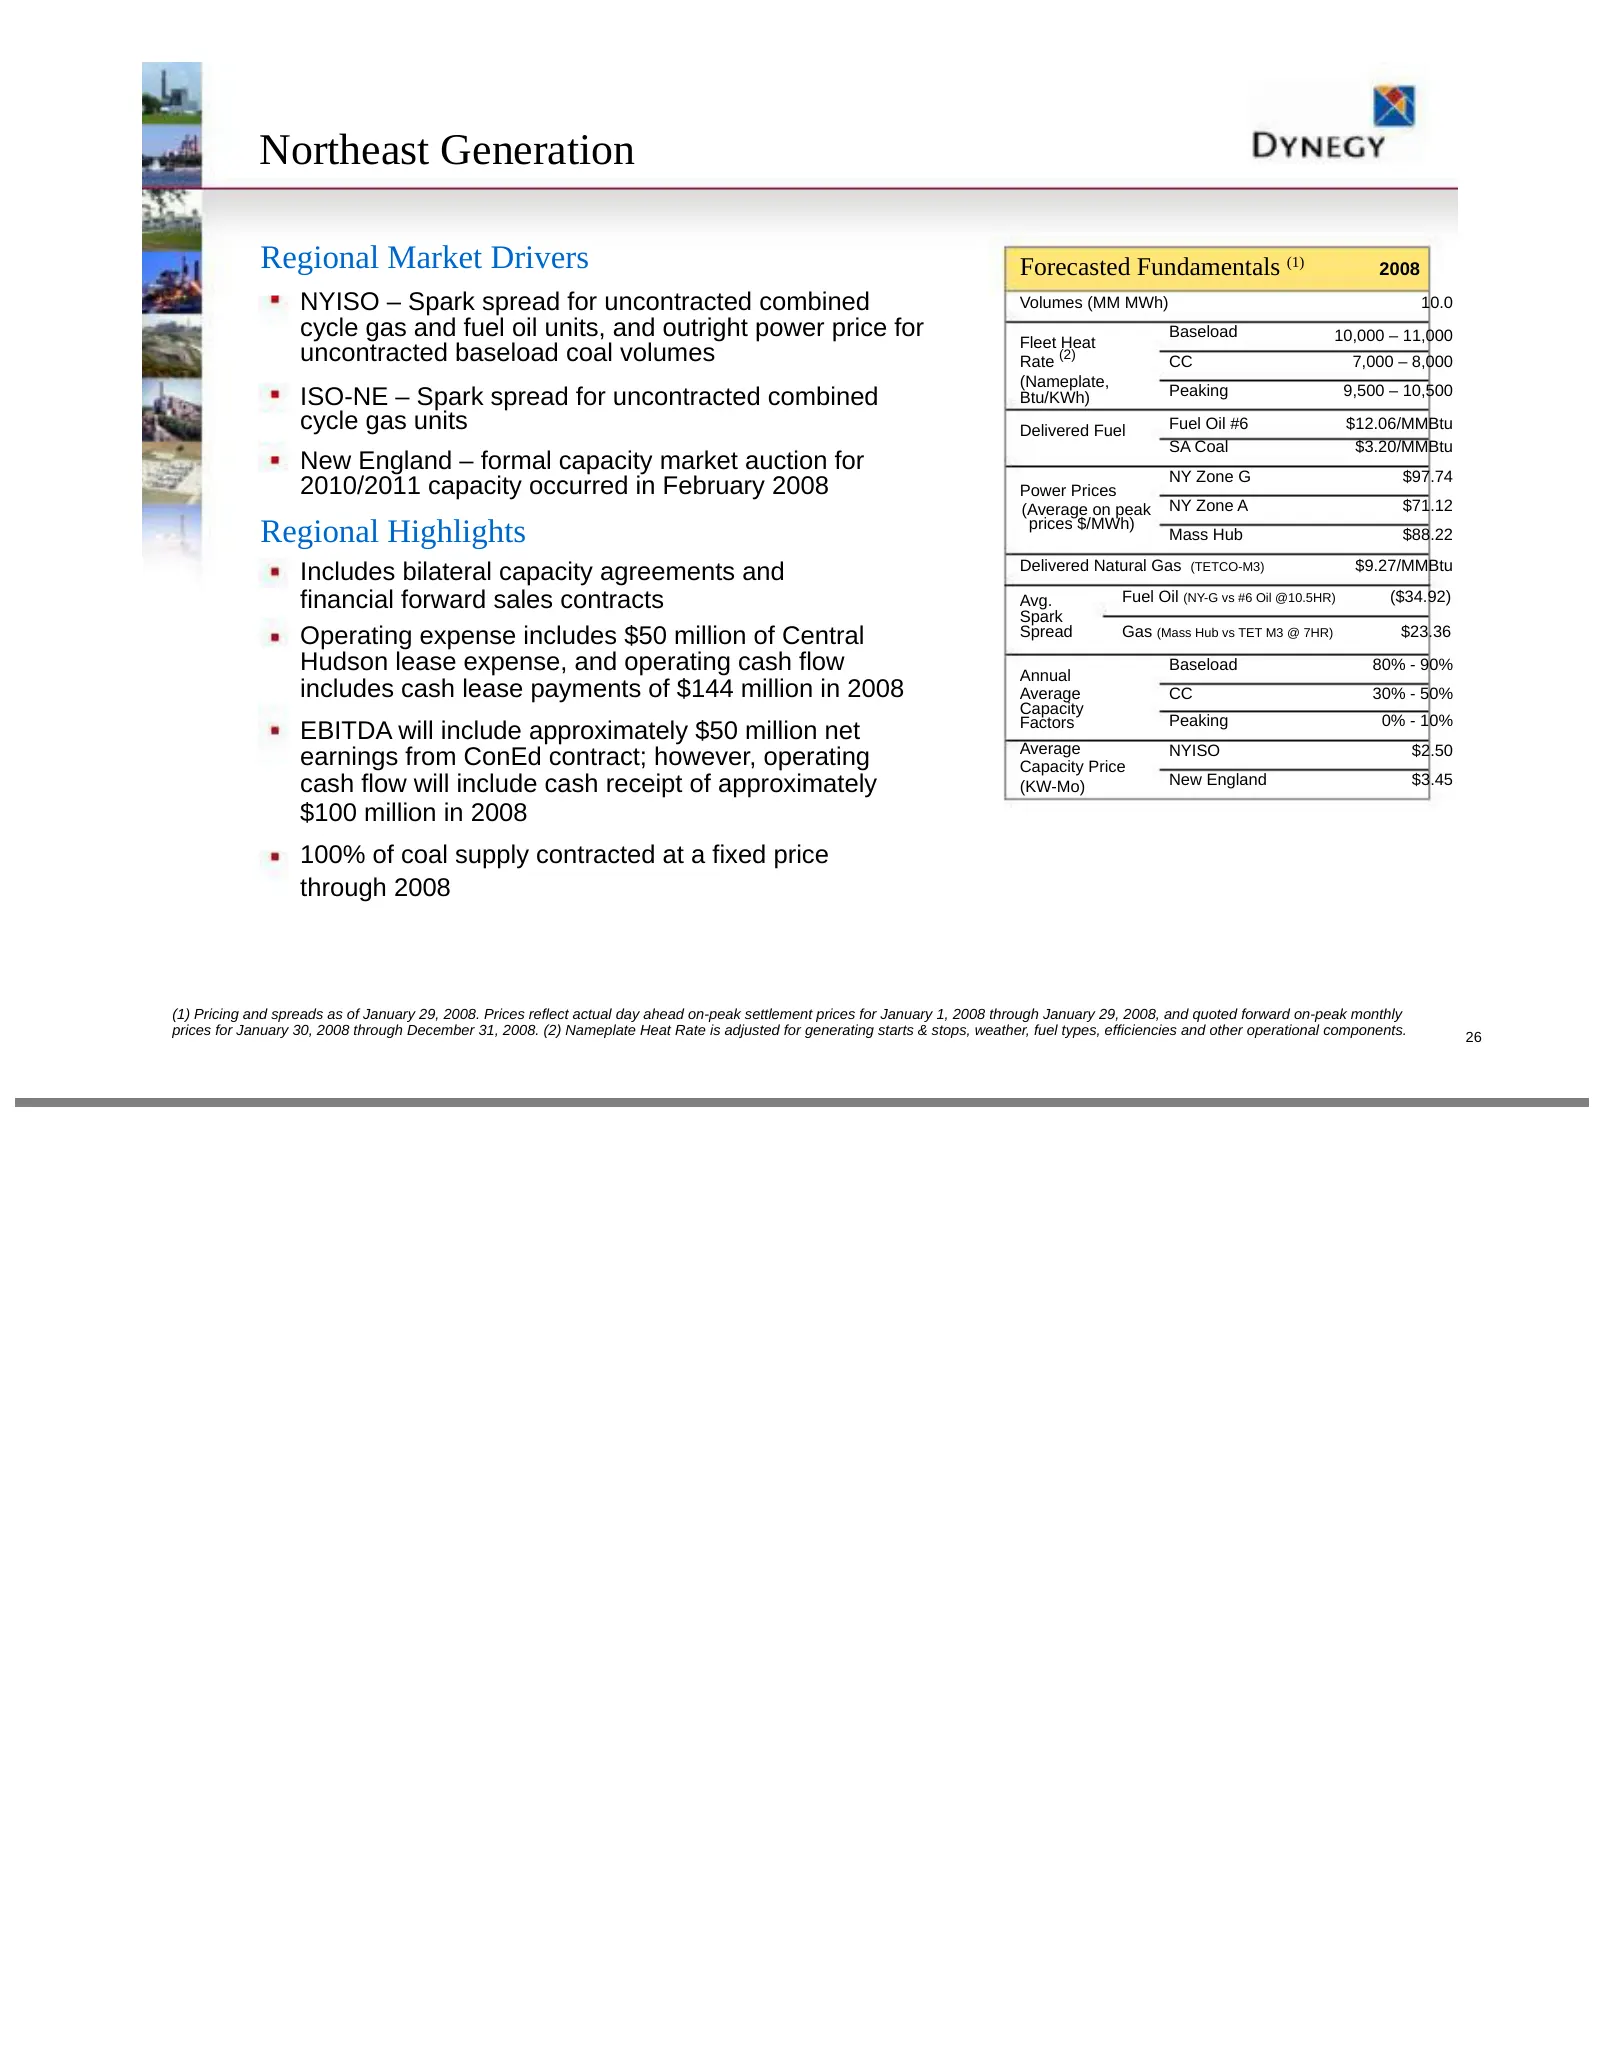
Northeast Generation Regional Market Drivers Forecasted Fundamentals (1) 2008 NYISO – Spark spread for uncontracted combined Volumes (MM MWh) 10.0 cycle gas and fuel oil units, and outright power price for Fleet Heat Baseload 10,000 – 11,000 uncontracted baseload coal volumes Rate (2) CC 7,000 – 8,0
Slide 27: Anticipated Capital Expenditures (2008 – 2012)
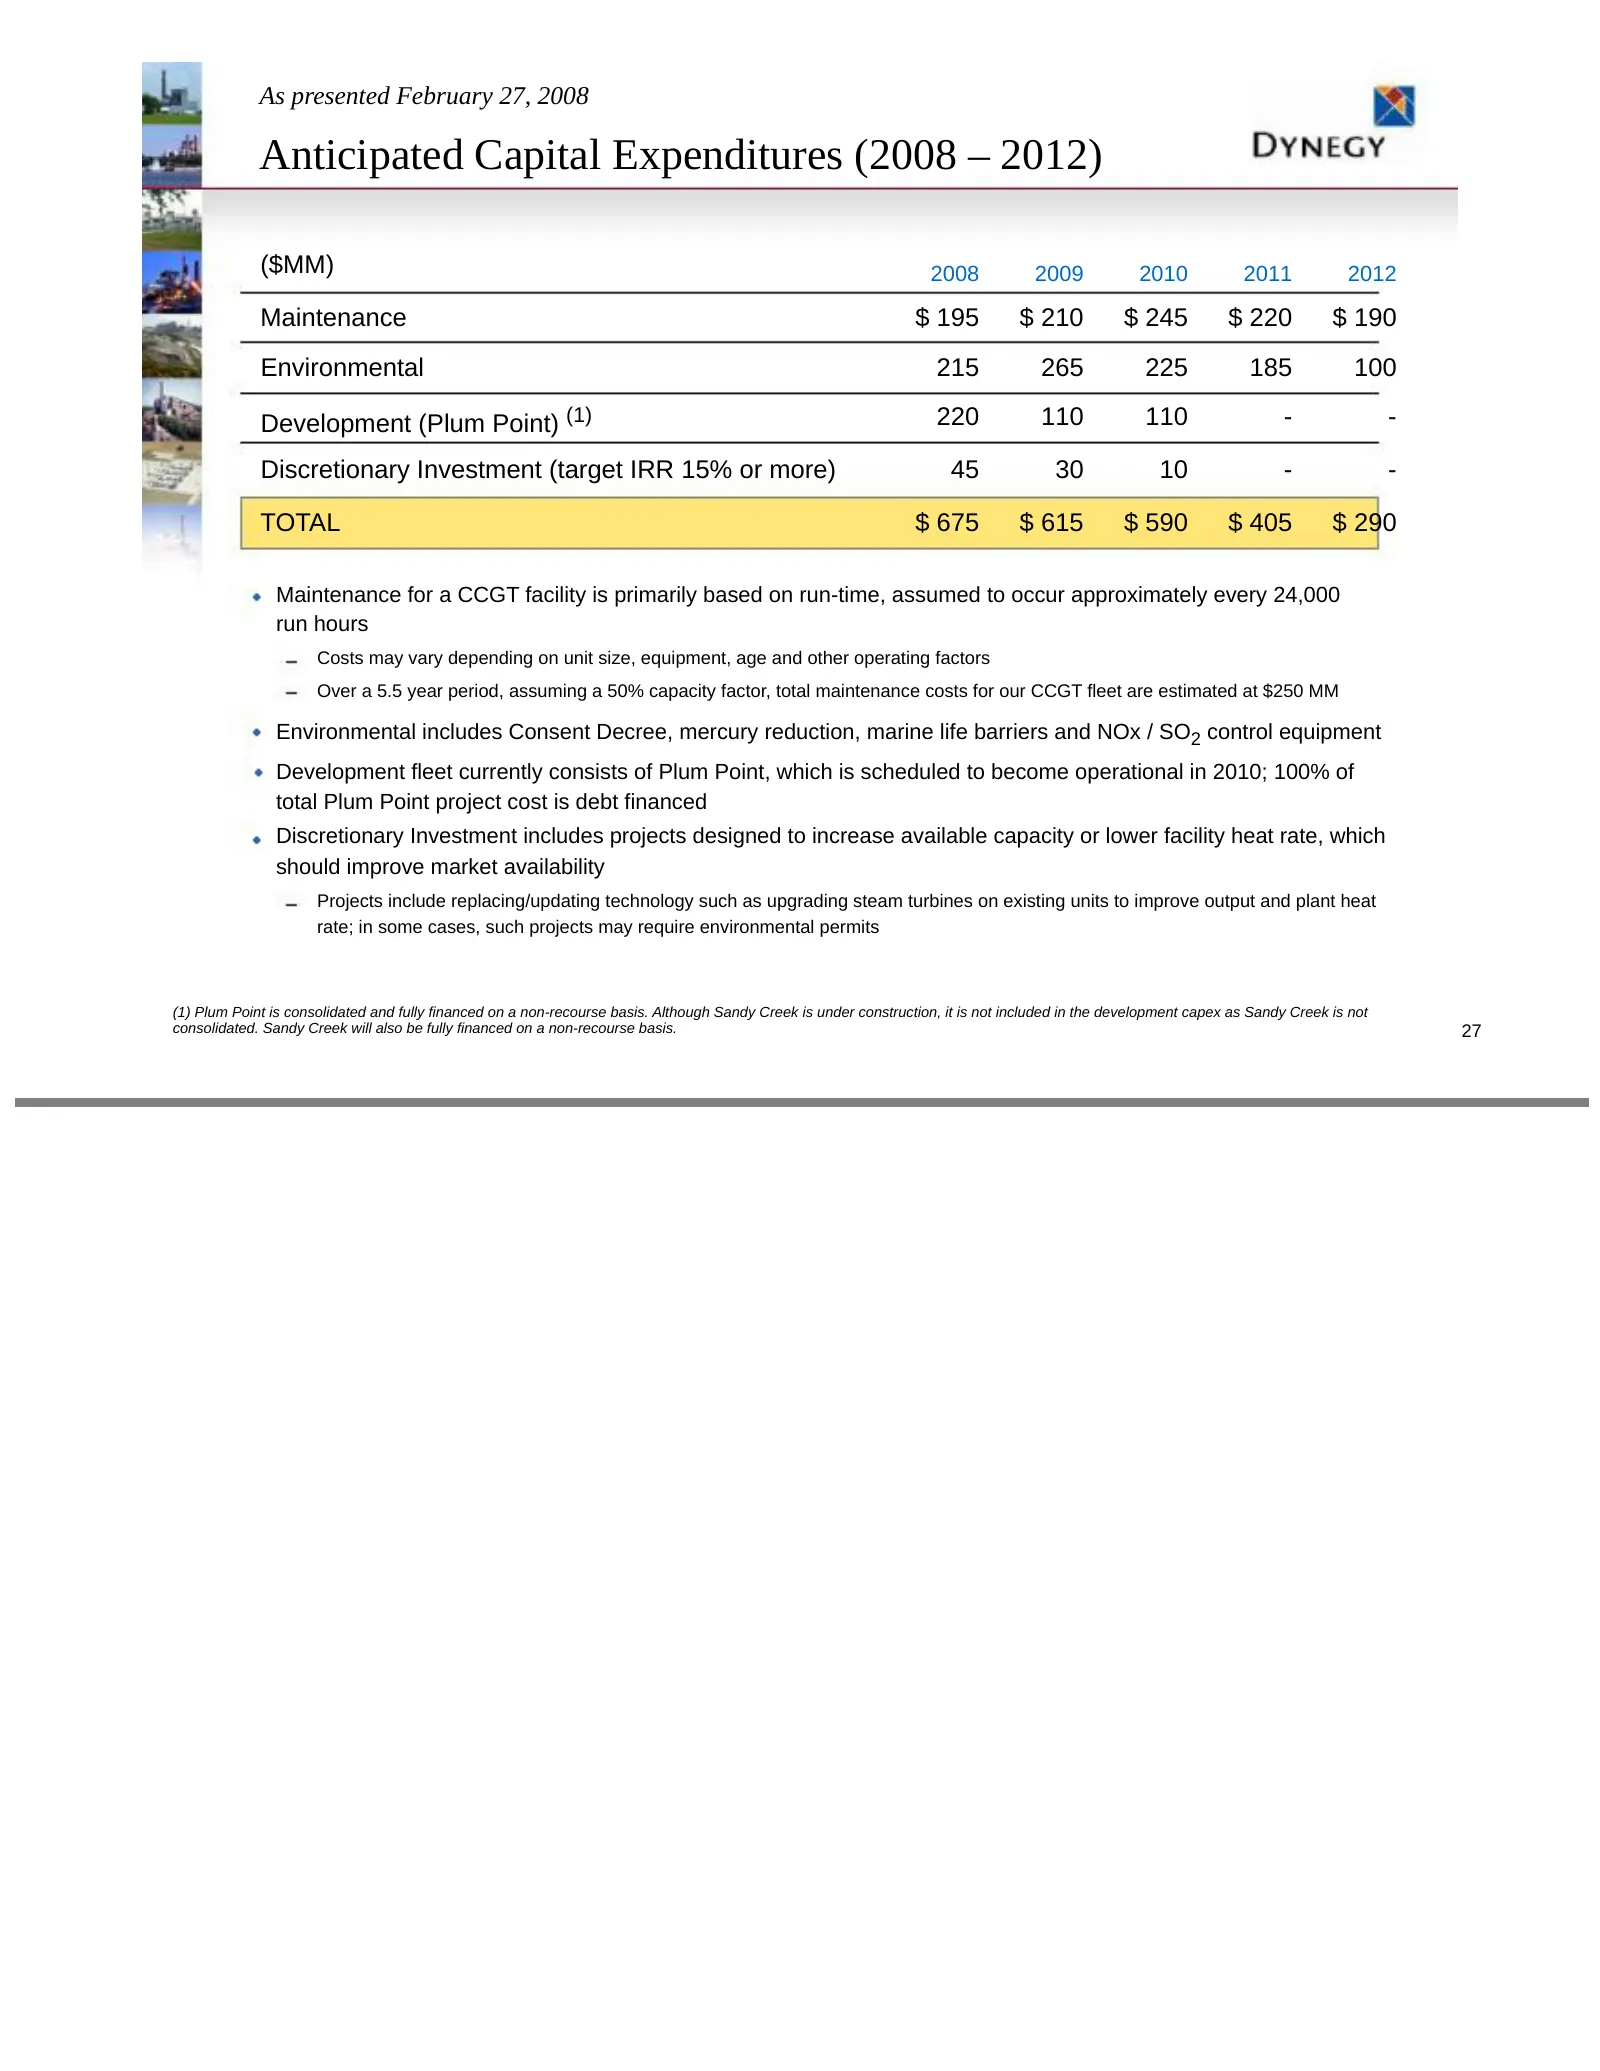
As presented February 27, 2008 Anticipated Capital Expenditures (2008 – 2012) ($MM) 2008 2009 2010 2011 2012 Maintenance $ 195 $ 210 $ 245 $ 220 $ 190 Environmental 215 265 225 185 100 Development (Plum Point) (1) 220 110 110 - - Discretionary Investment (target IRR 15% or more) 45 30 10 - - TOTAL $
Slide 28: Significant Environmental Progress
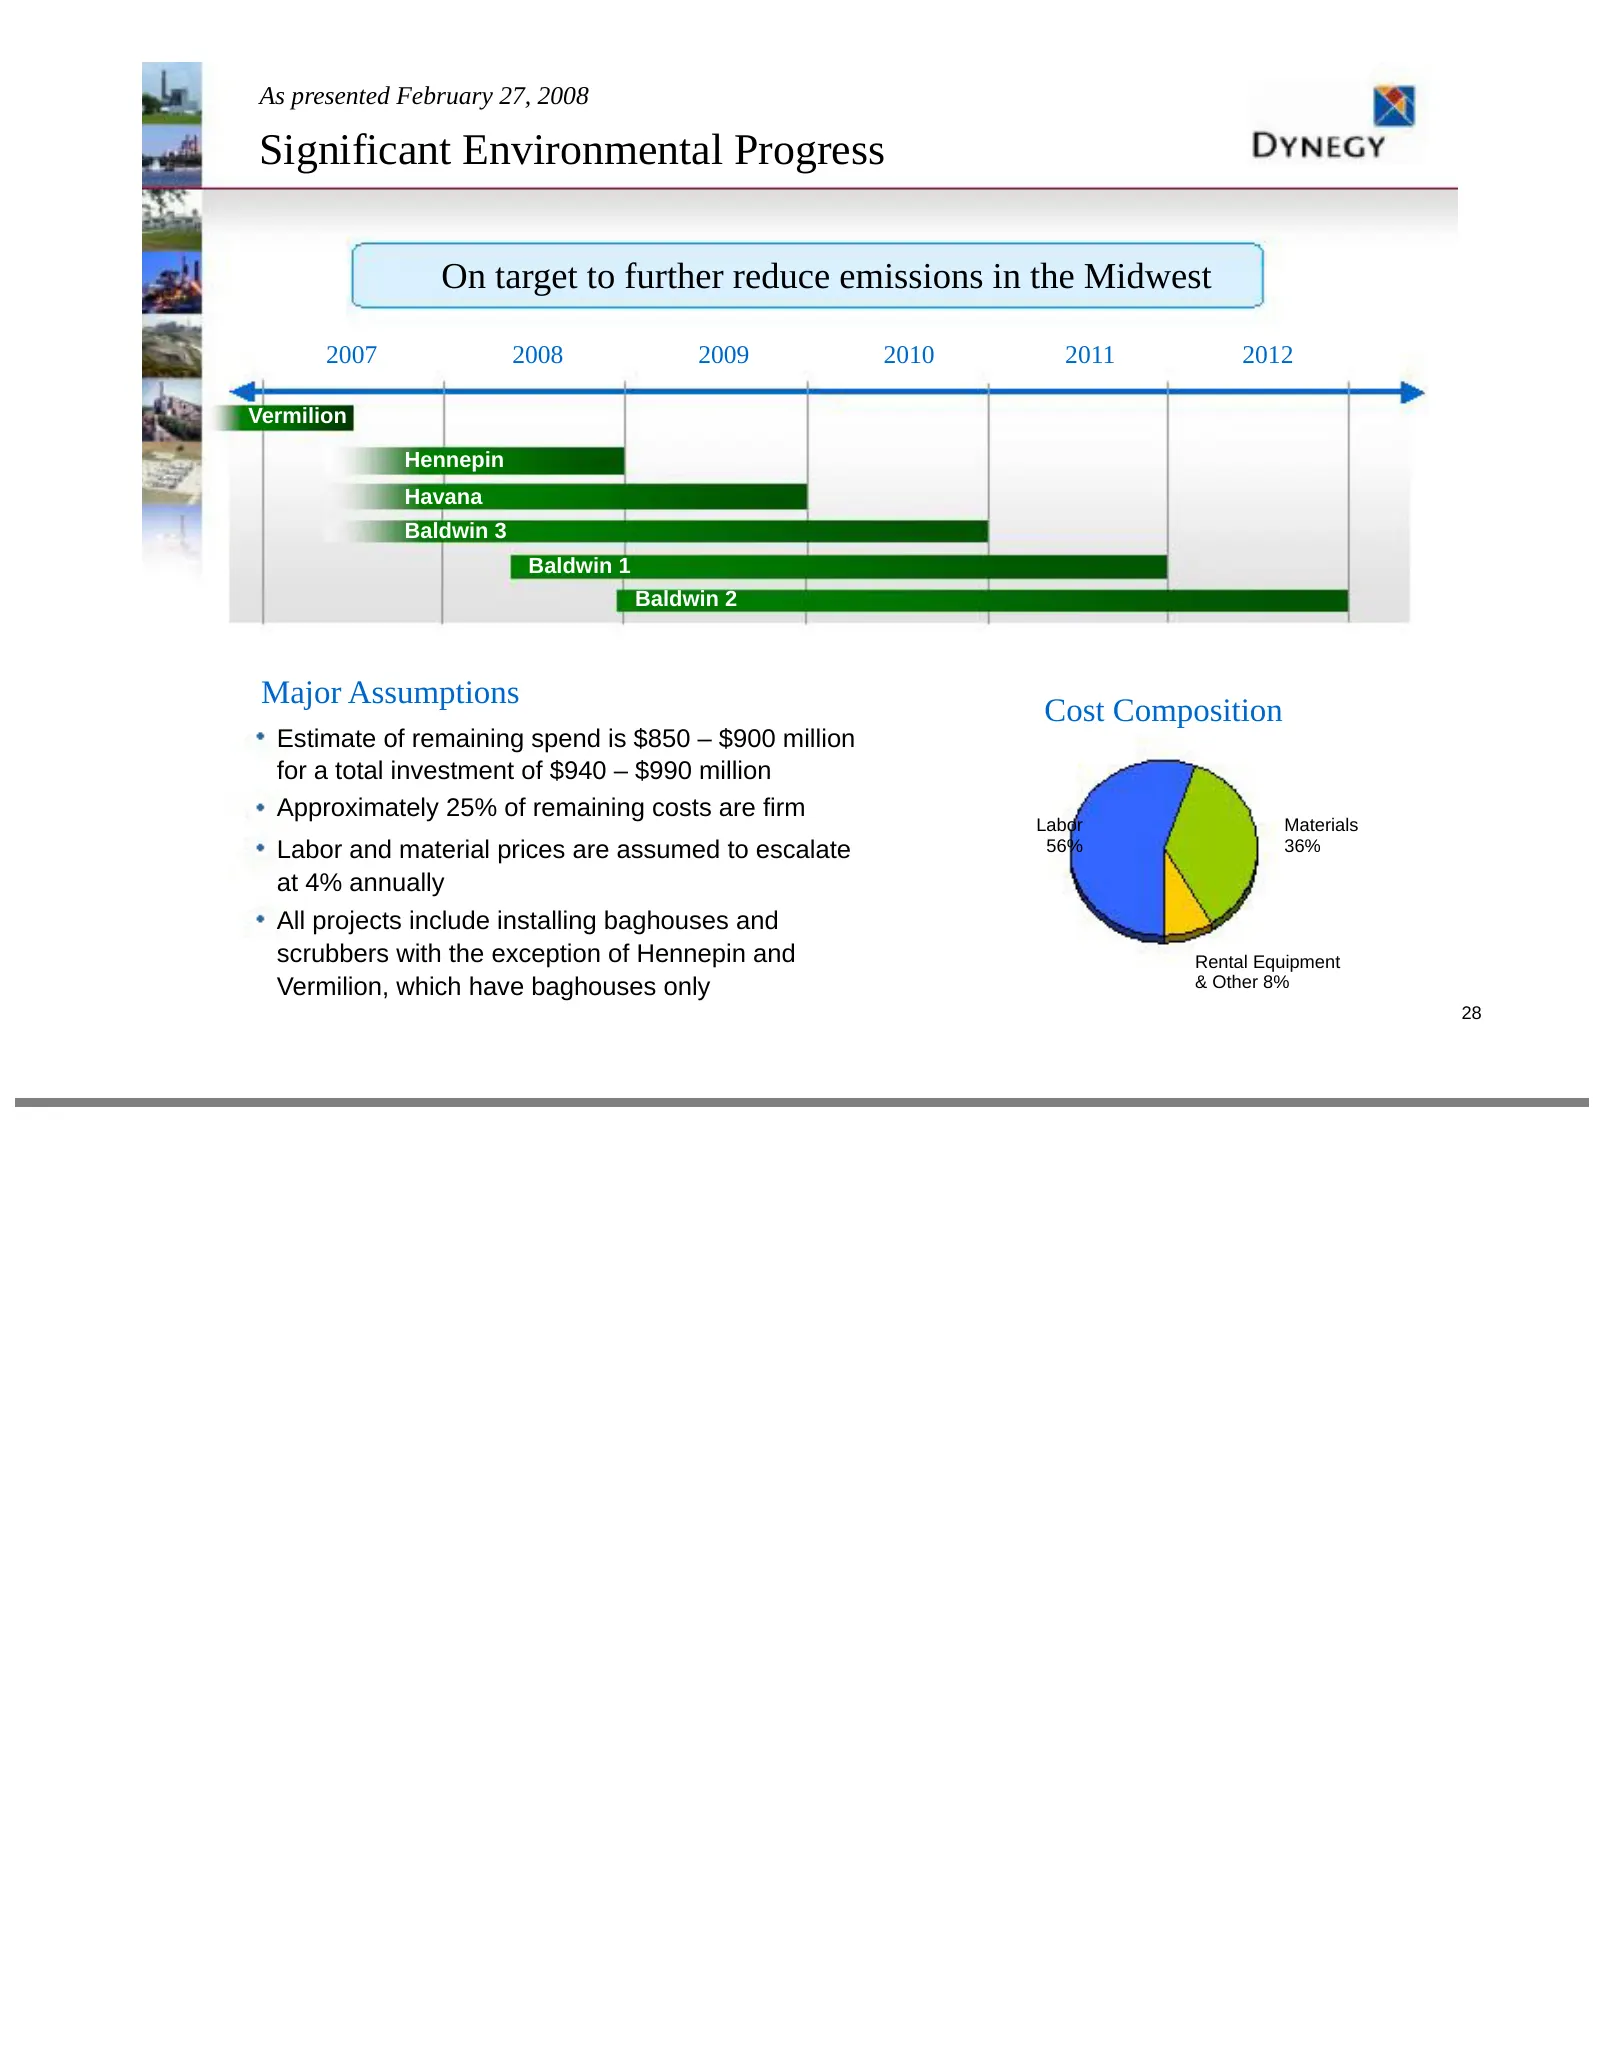
As presented February 27, 2008 Significant Environmental Progress On target to further reduce emissions in the Midwest 2007 2008 2009 2010 2011 2012 Vermilion Hennepin Havana Baldwin 3 Baldwin 1 Baldwin 2 Major Assumptions Cost Composition Estimate of remaining spend is $850 – $900 million for a tot
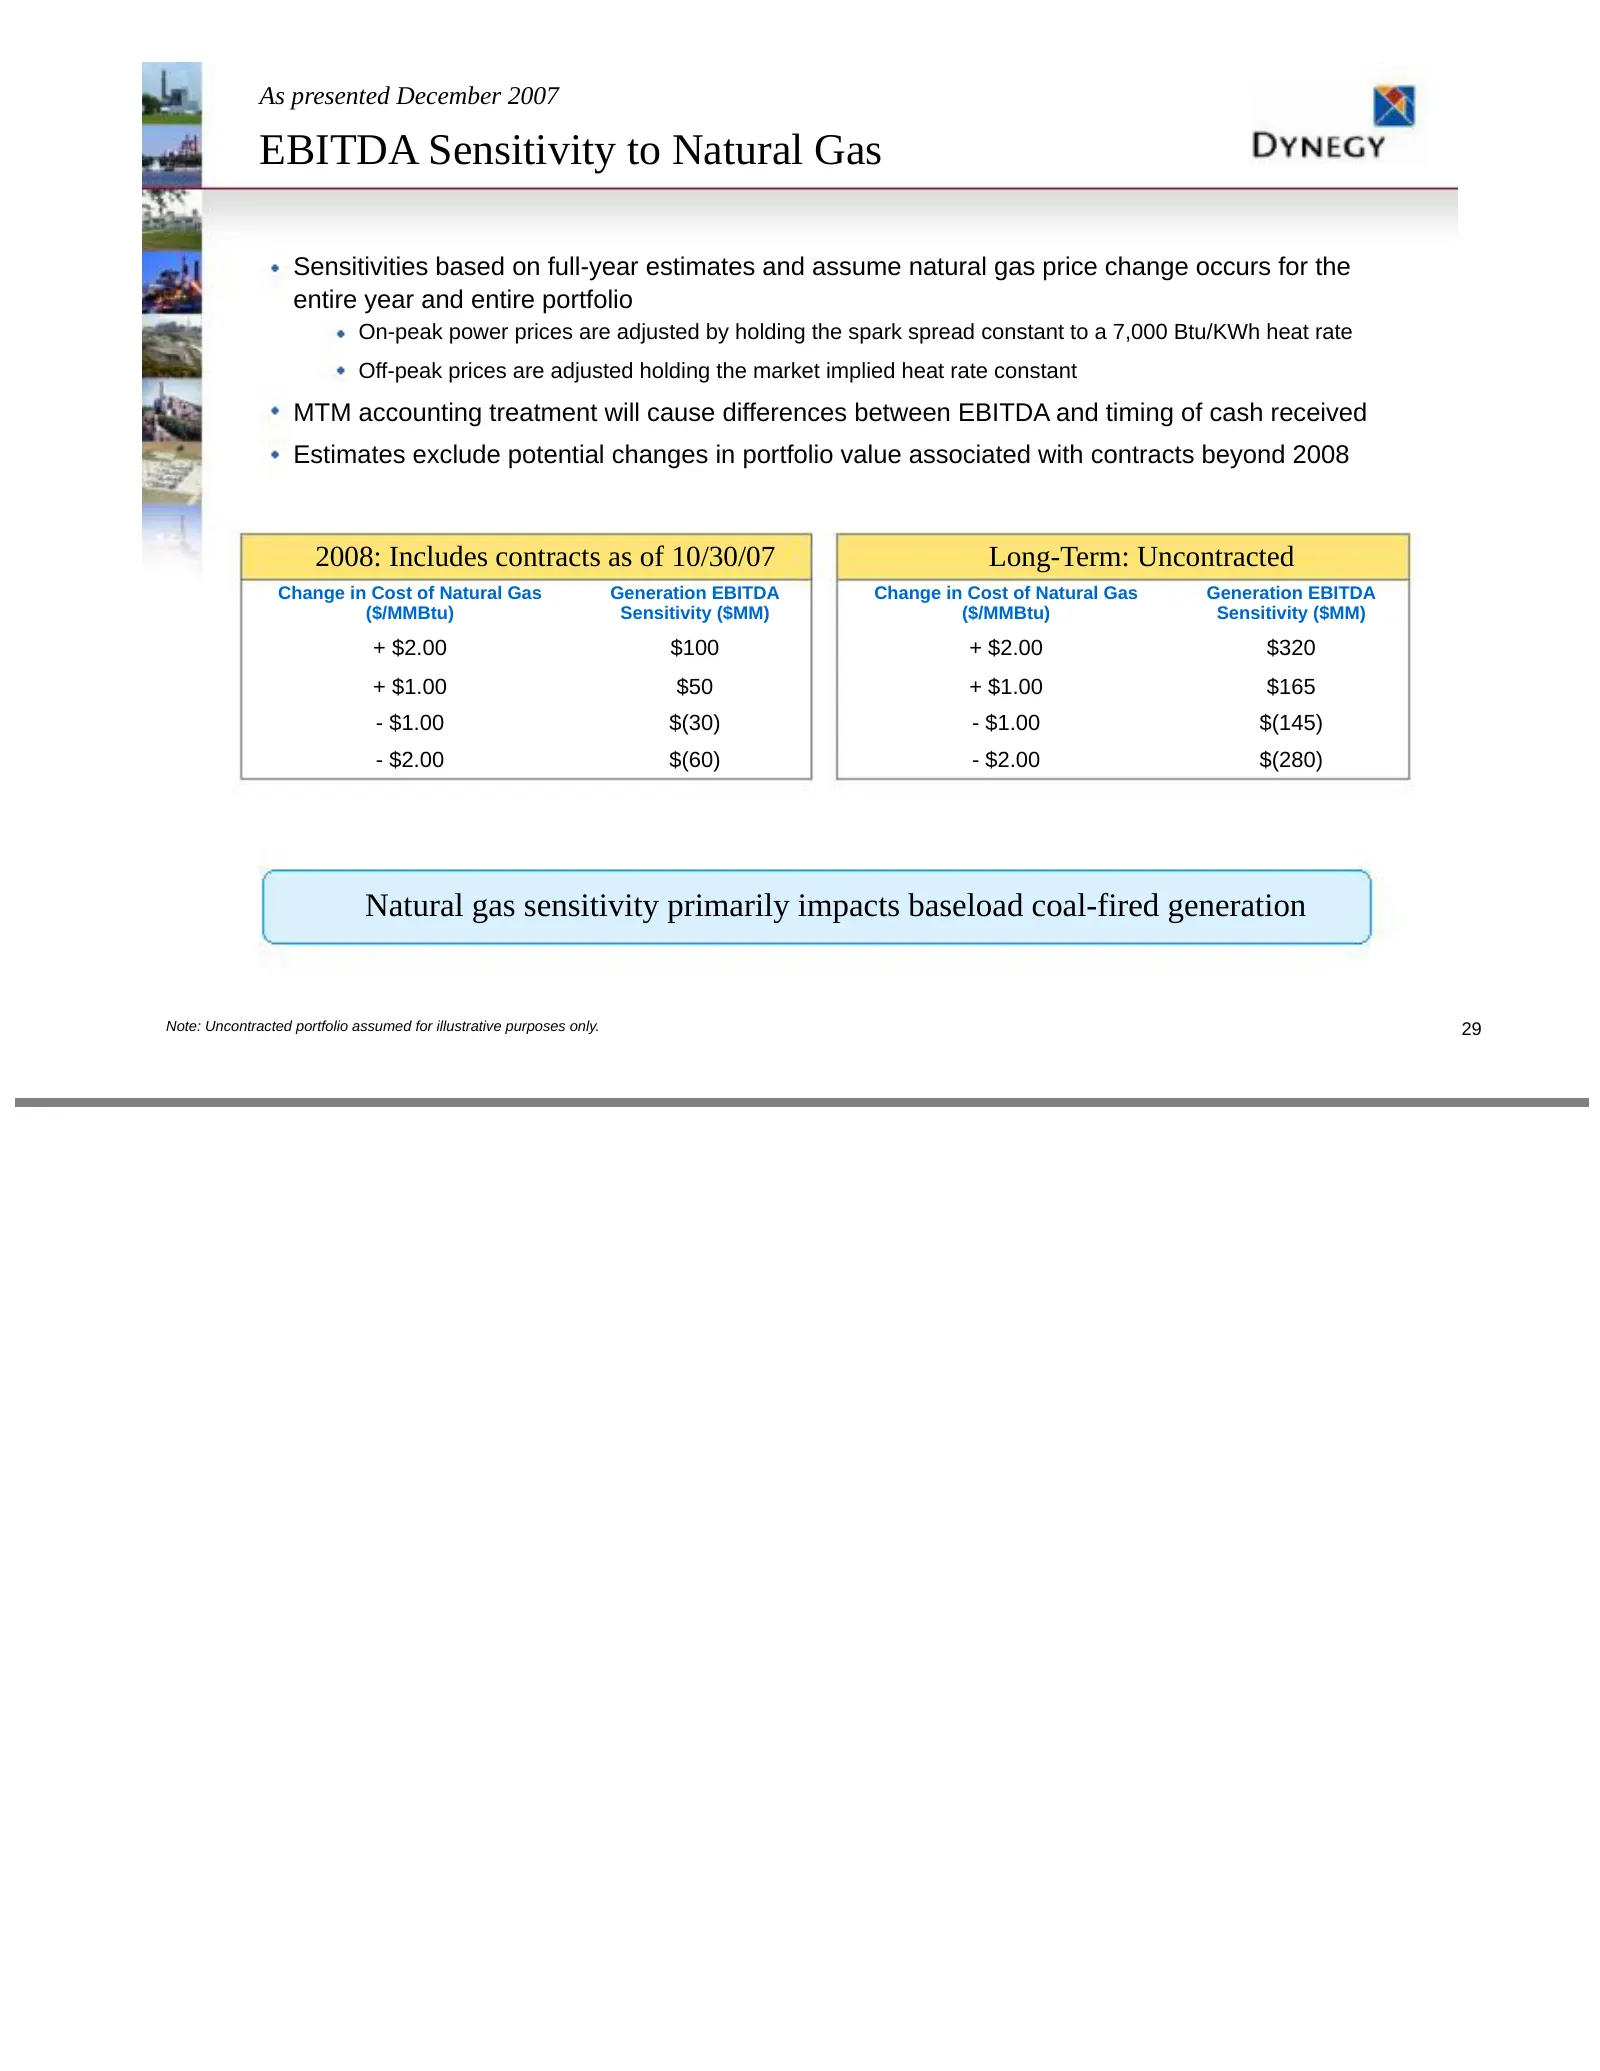
Slide 29: EBITDA Sensitivity to Natural Gas
As presented December 2007 EBITDA Sensitivity to Natural Gas Sensitivities based on full-year estimates and assume natural gas price change occurs for the entire year and entire portfolio On-peak power prices are adjusted by holding the spark spread constant to a 7,000 Btu/KWh heat rate Off-peak pri
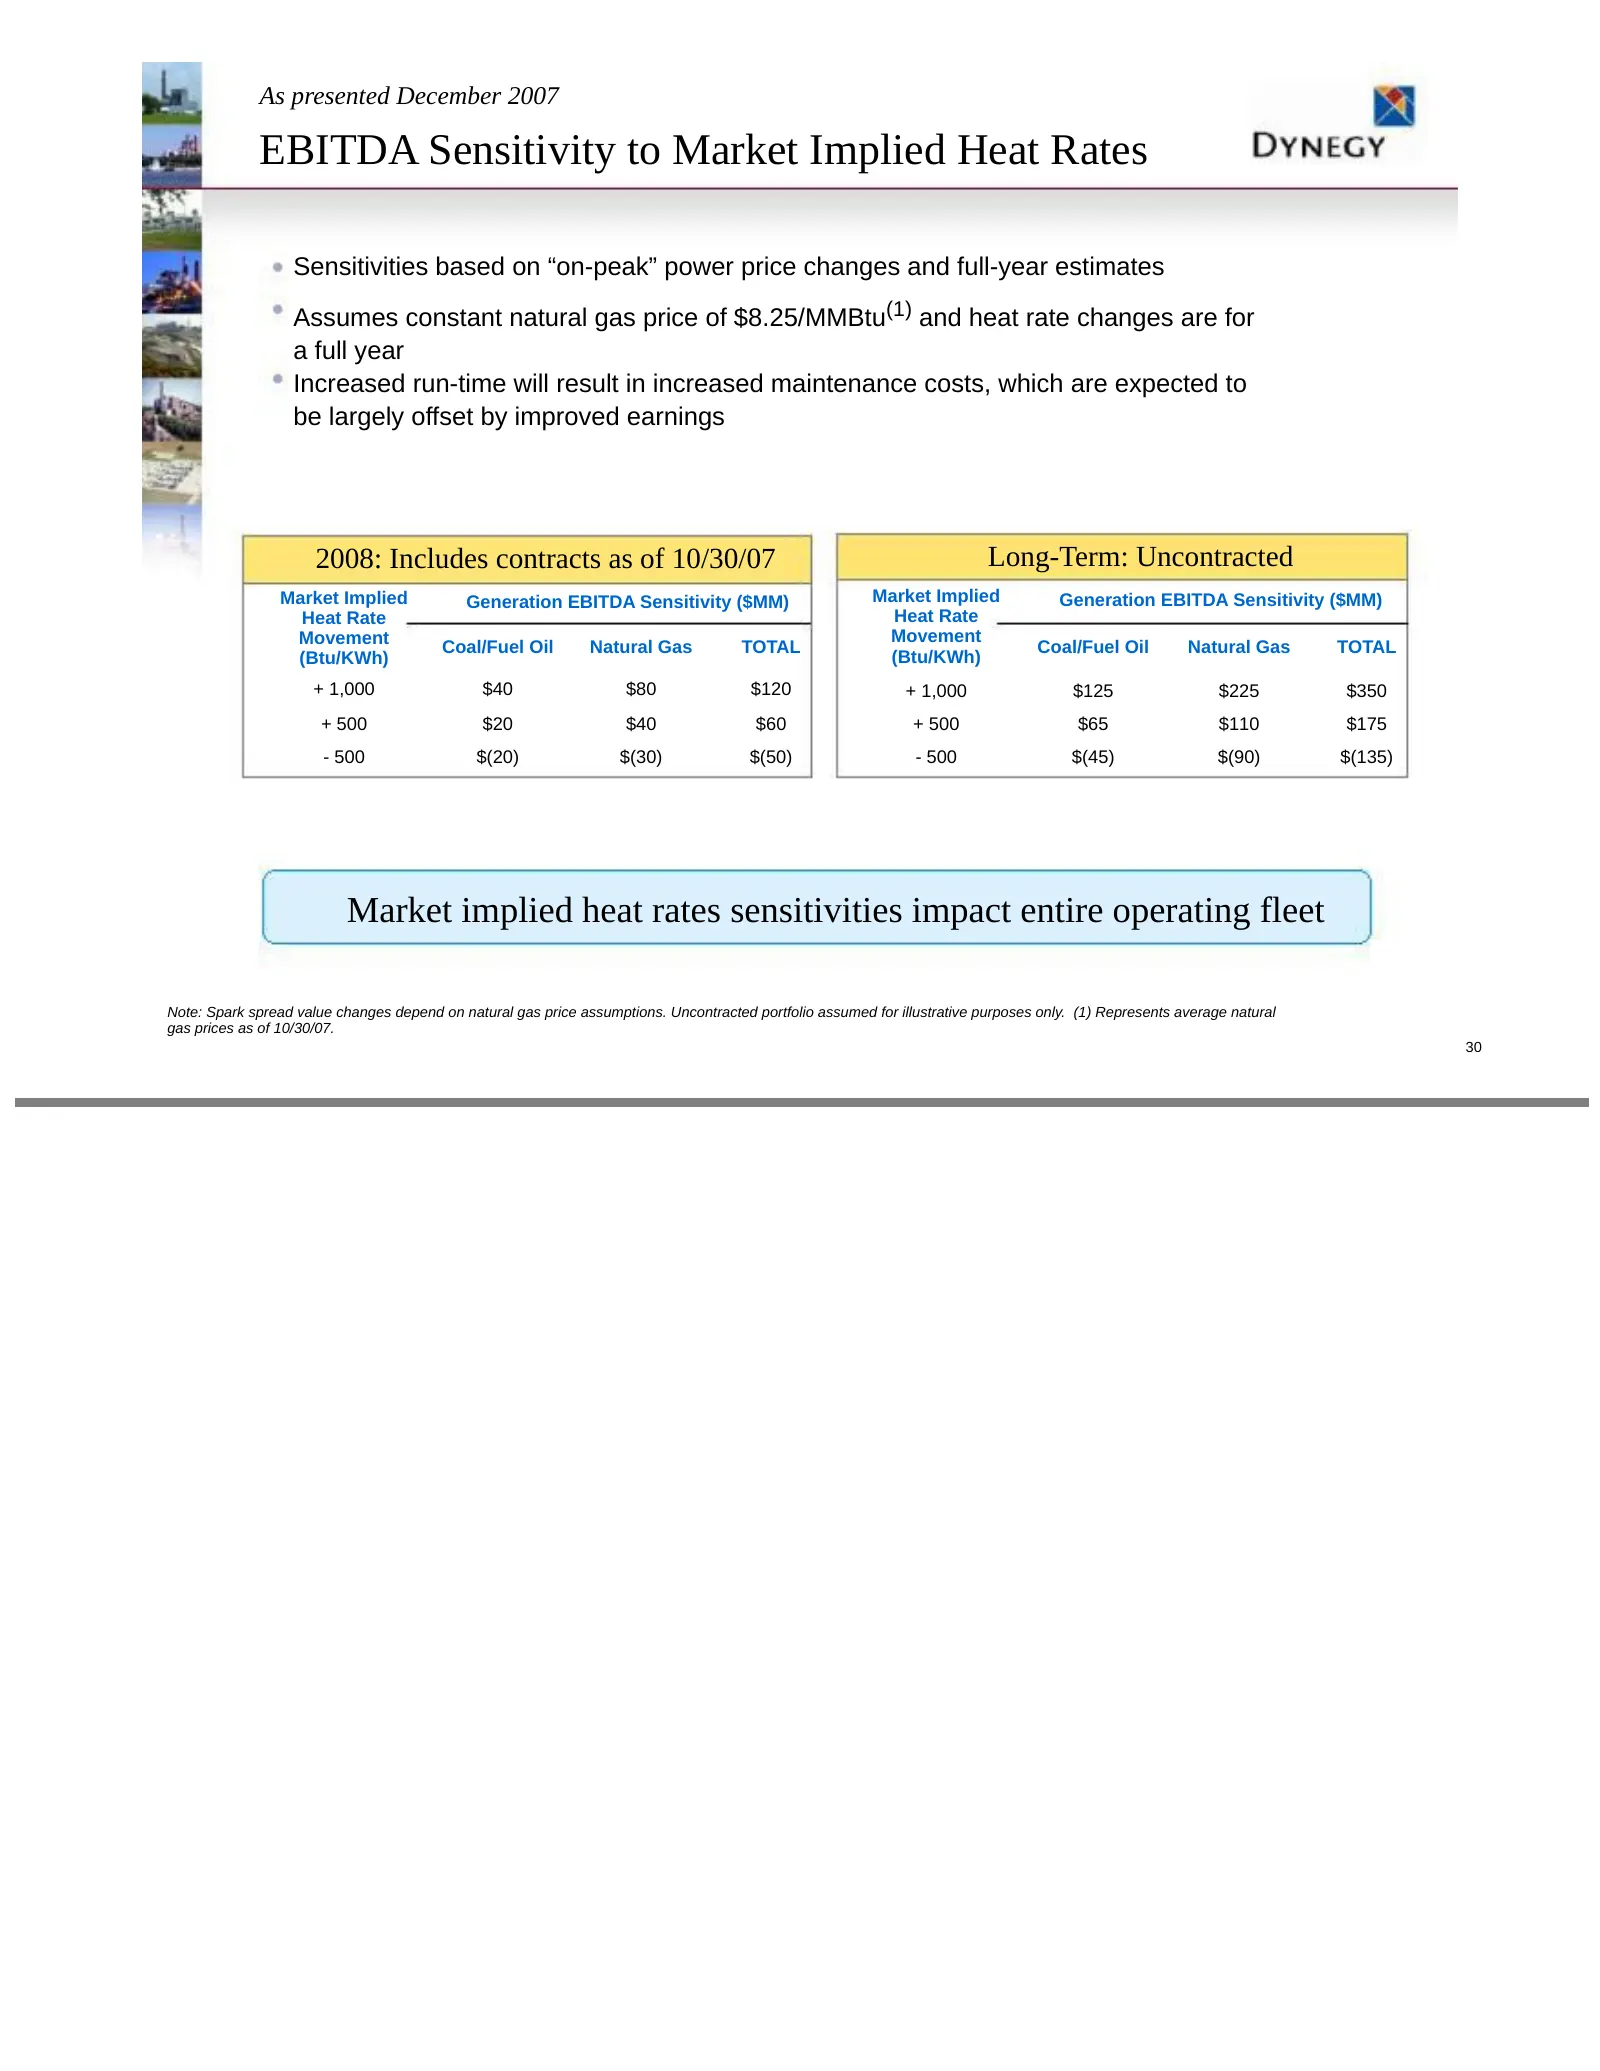
Slide 30: EBITDA Sensitivity to Market Implied Heat Rates
As presented December 2007 EBITDA Sensitivity to Market Implied Heat Rates Sensitivities based on “on-peak” power price changes and full-year estimates Assumes constant natural gas price of $8.25/MMBtu(1) and heat rate changes are for a full year Increased run-time will result in increased maintenan
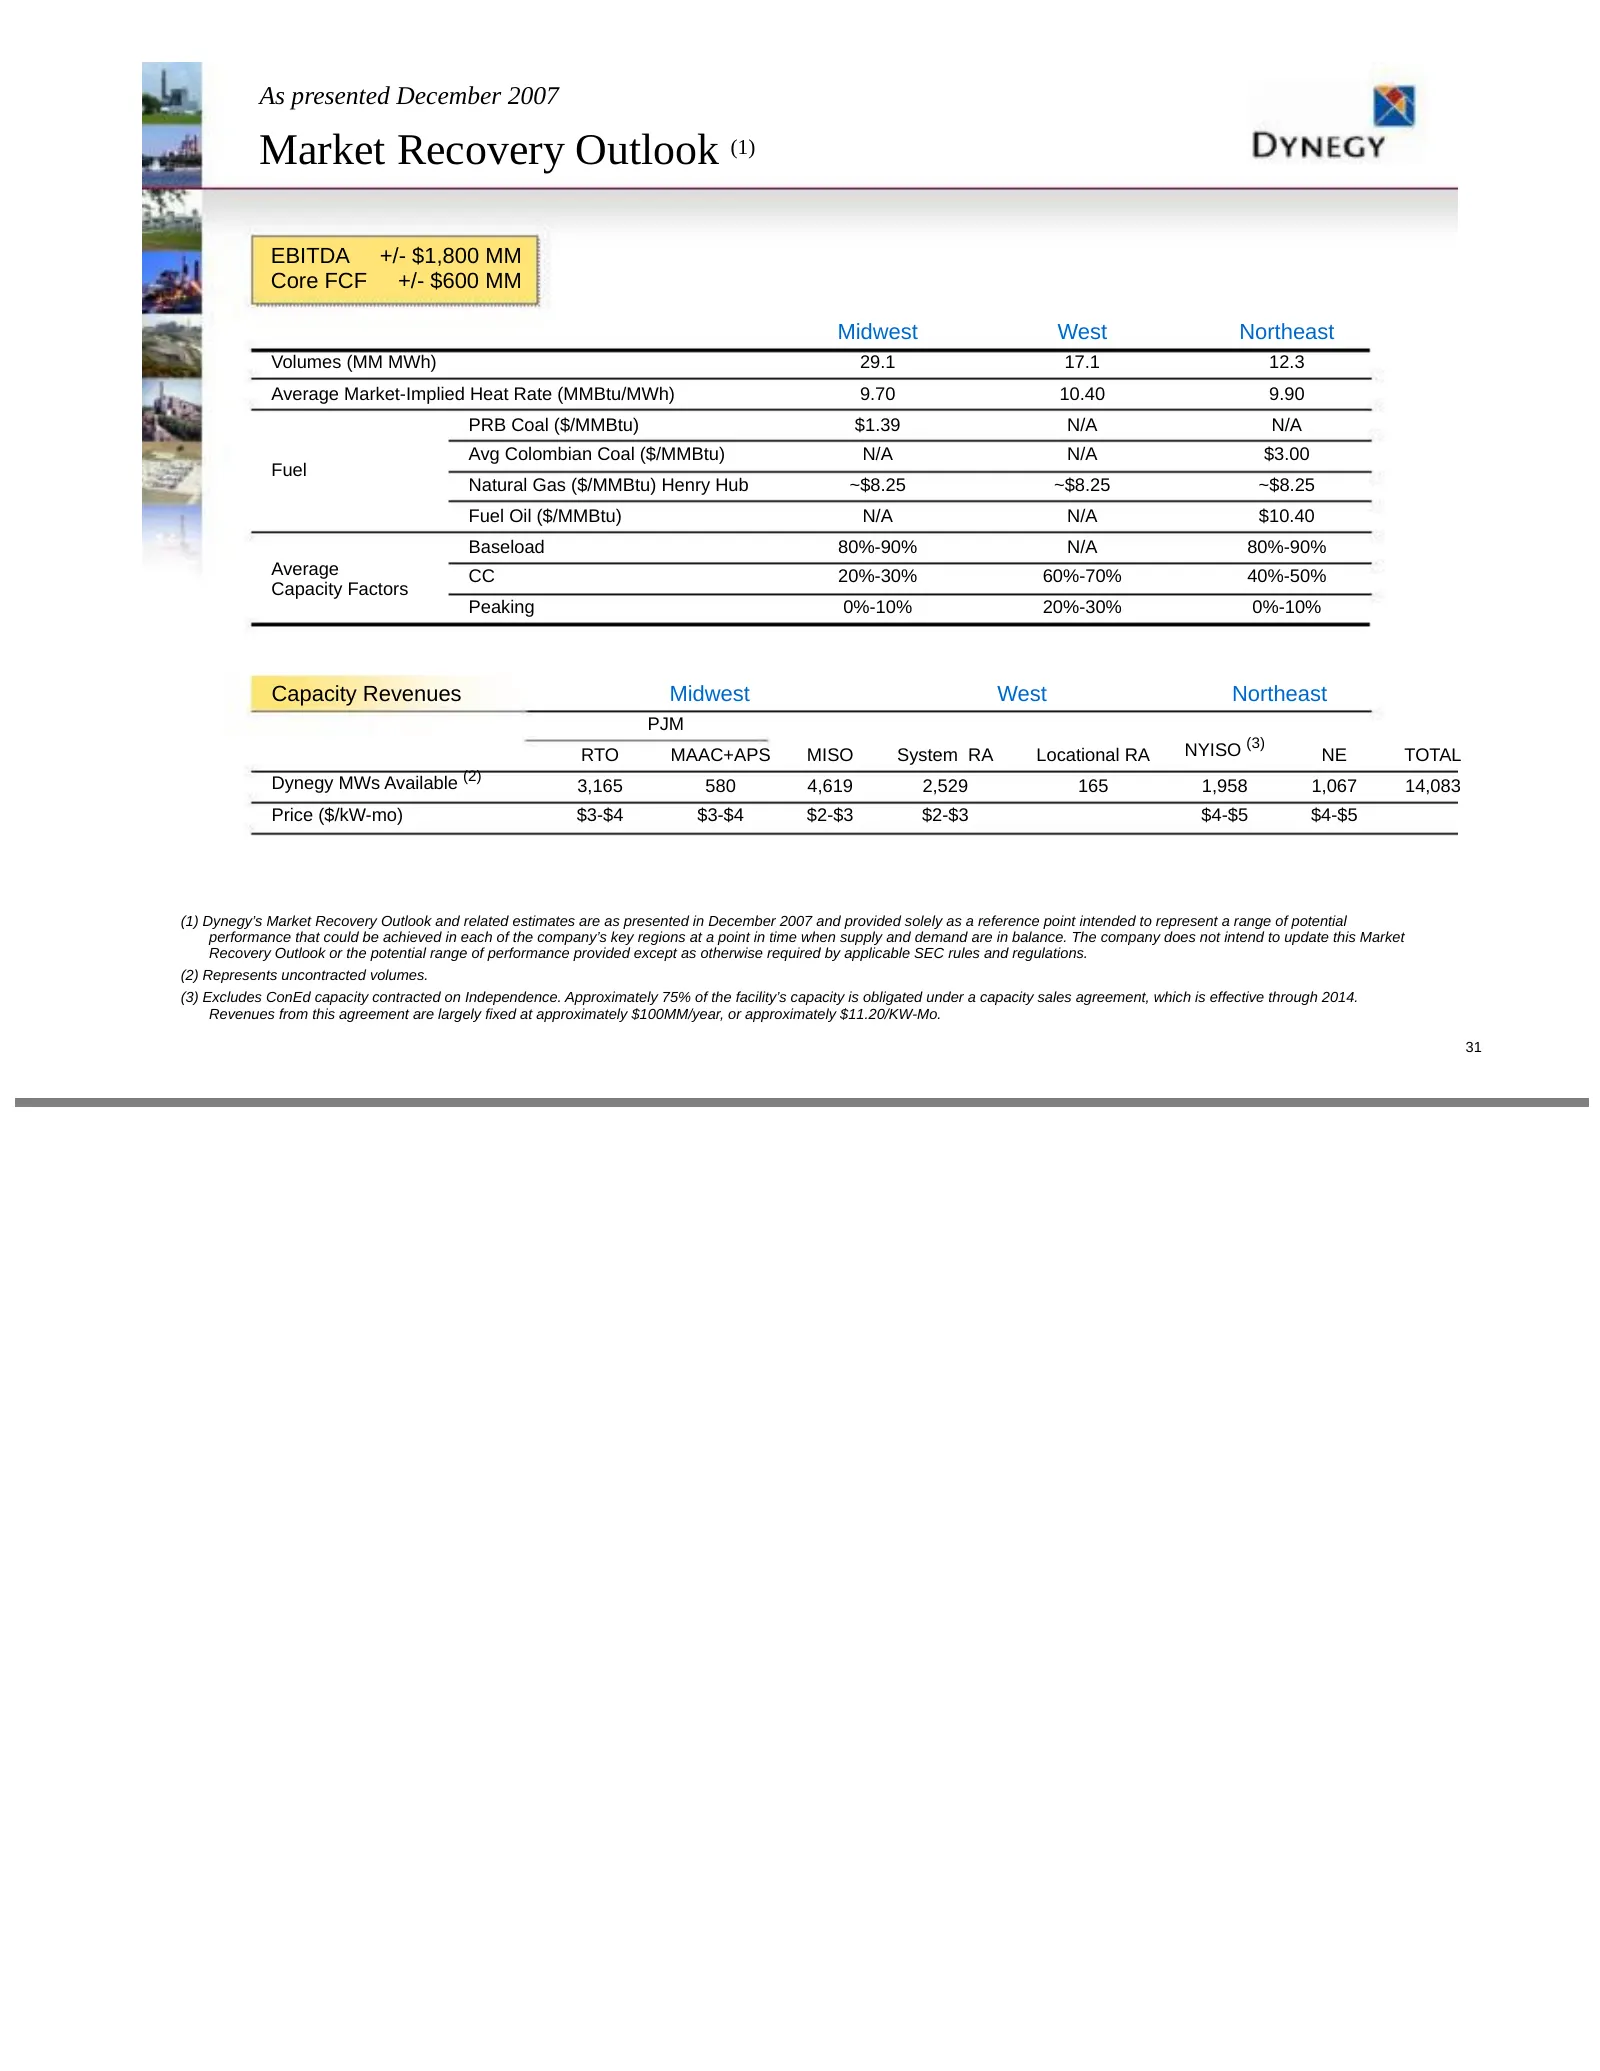
Slide 31: Market Recovery Outlook
As presented December 2007 Market Recovery Outlook (1) EBITDA +/- $1,800 MM Core FCF +/- $600 MM Midwest West Northeast Volumes (MM MWh) 29.1 17.1 12.3 Average Market-Implied Heat Rate (MMBtu/MWh) 9.70 10.40 9.90 PRB Coal ($/MMBtu) $1.39 N/A N/A Avg Colombian Coal ($/MMBtu) N/A N/A $3.00 Fuel Natura
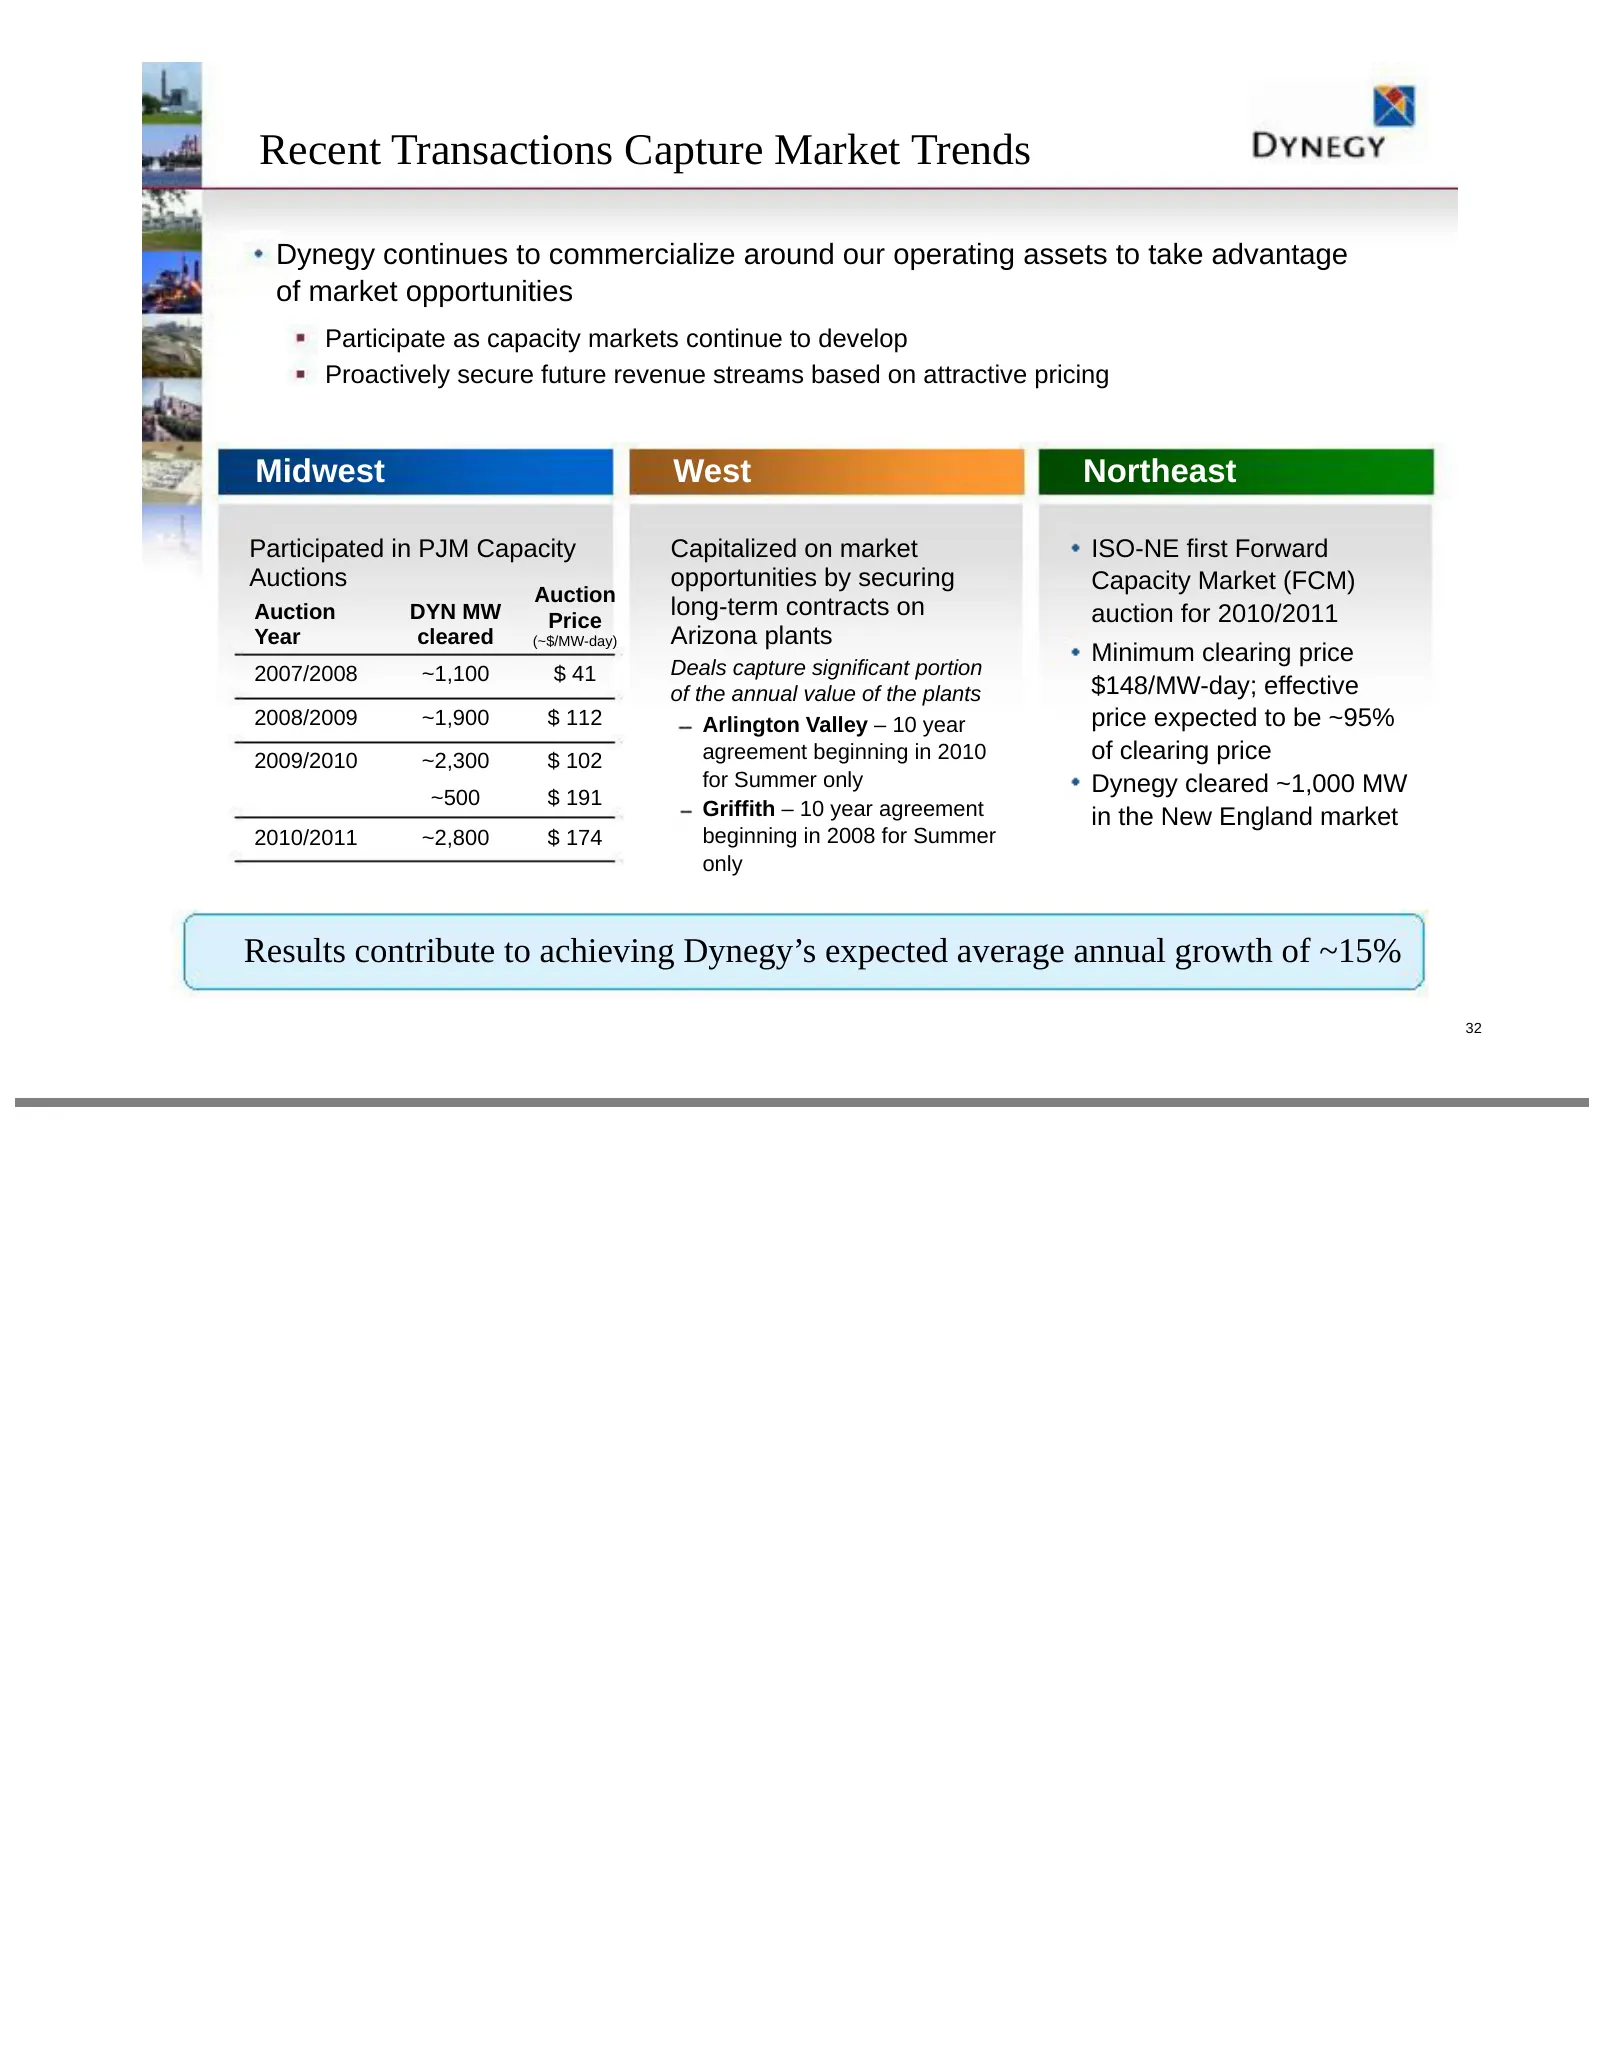
Slide 32: Recent Transactions Capture Market Trends
Recent Transactions Capture Market Trends Dynegy continues to commercialize around our operating assets to take advantage of market opportunities Participate as capacity markets continue to develop Proactively secure future revenue streams based on attractive pricing Midwest West Northeast Participa
Slide 33: Development Detail
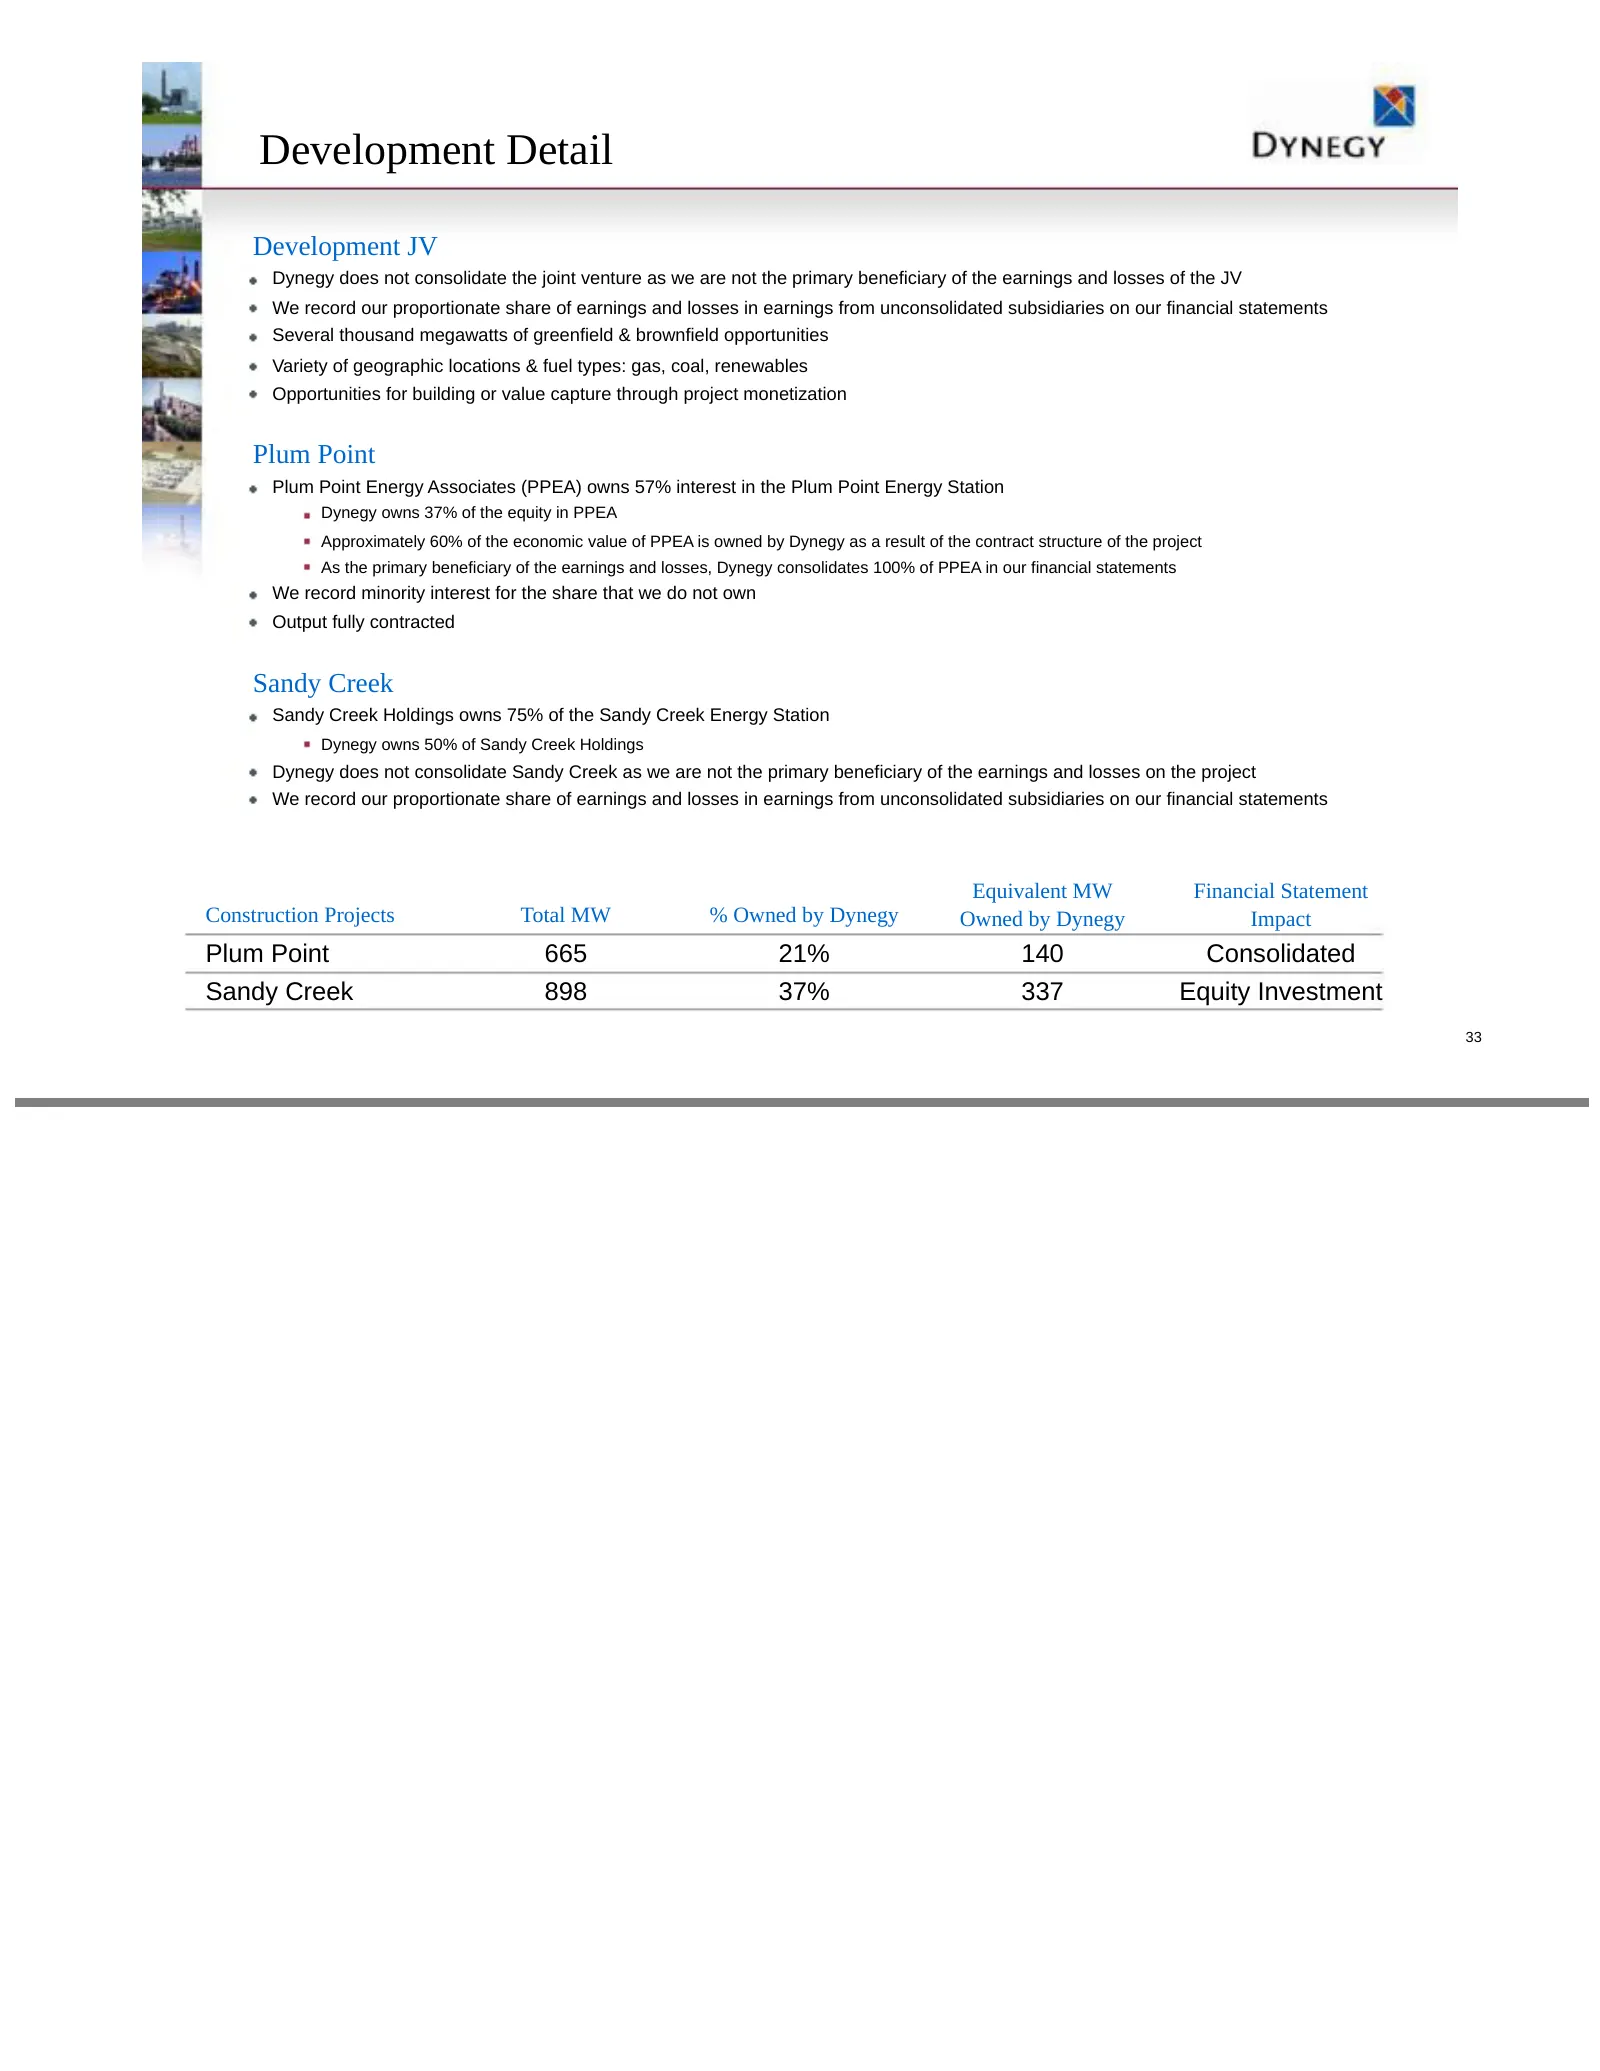
Development Detail Development JV Dynegy does not consolidate the joint venture as we are not the primary beneficiary of the earnings and losses of the JV We record our proportionate share of earnings and losses in earnings from unconsolidated subsidiaries on our financial statements Several thousan
Slide 34: Development Opportunities
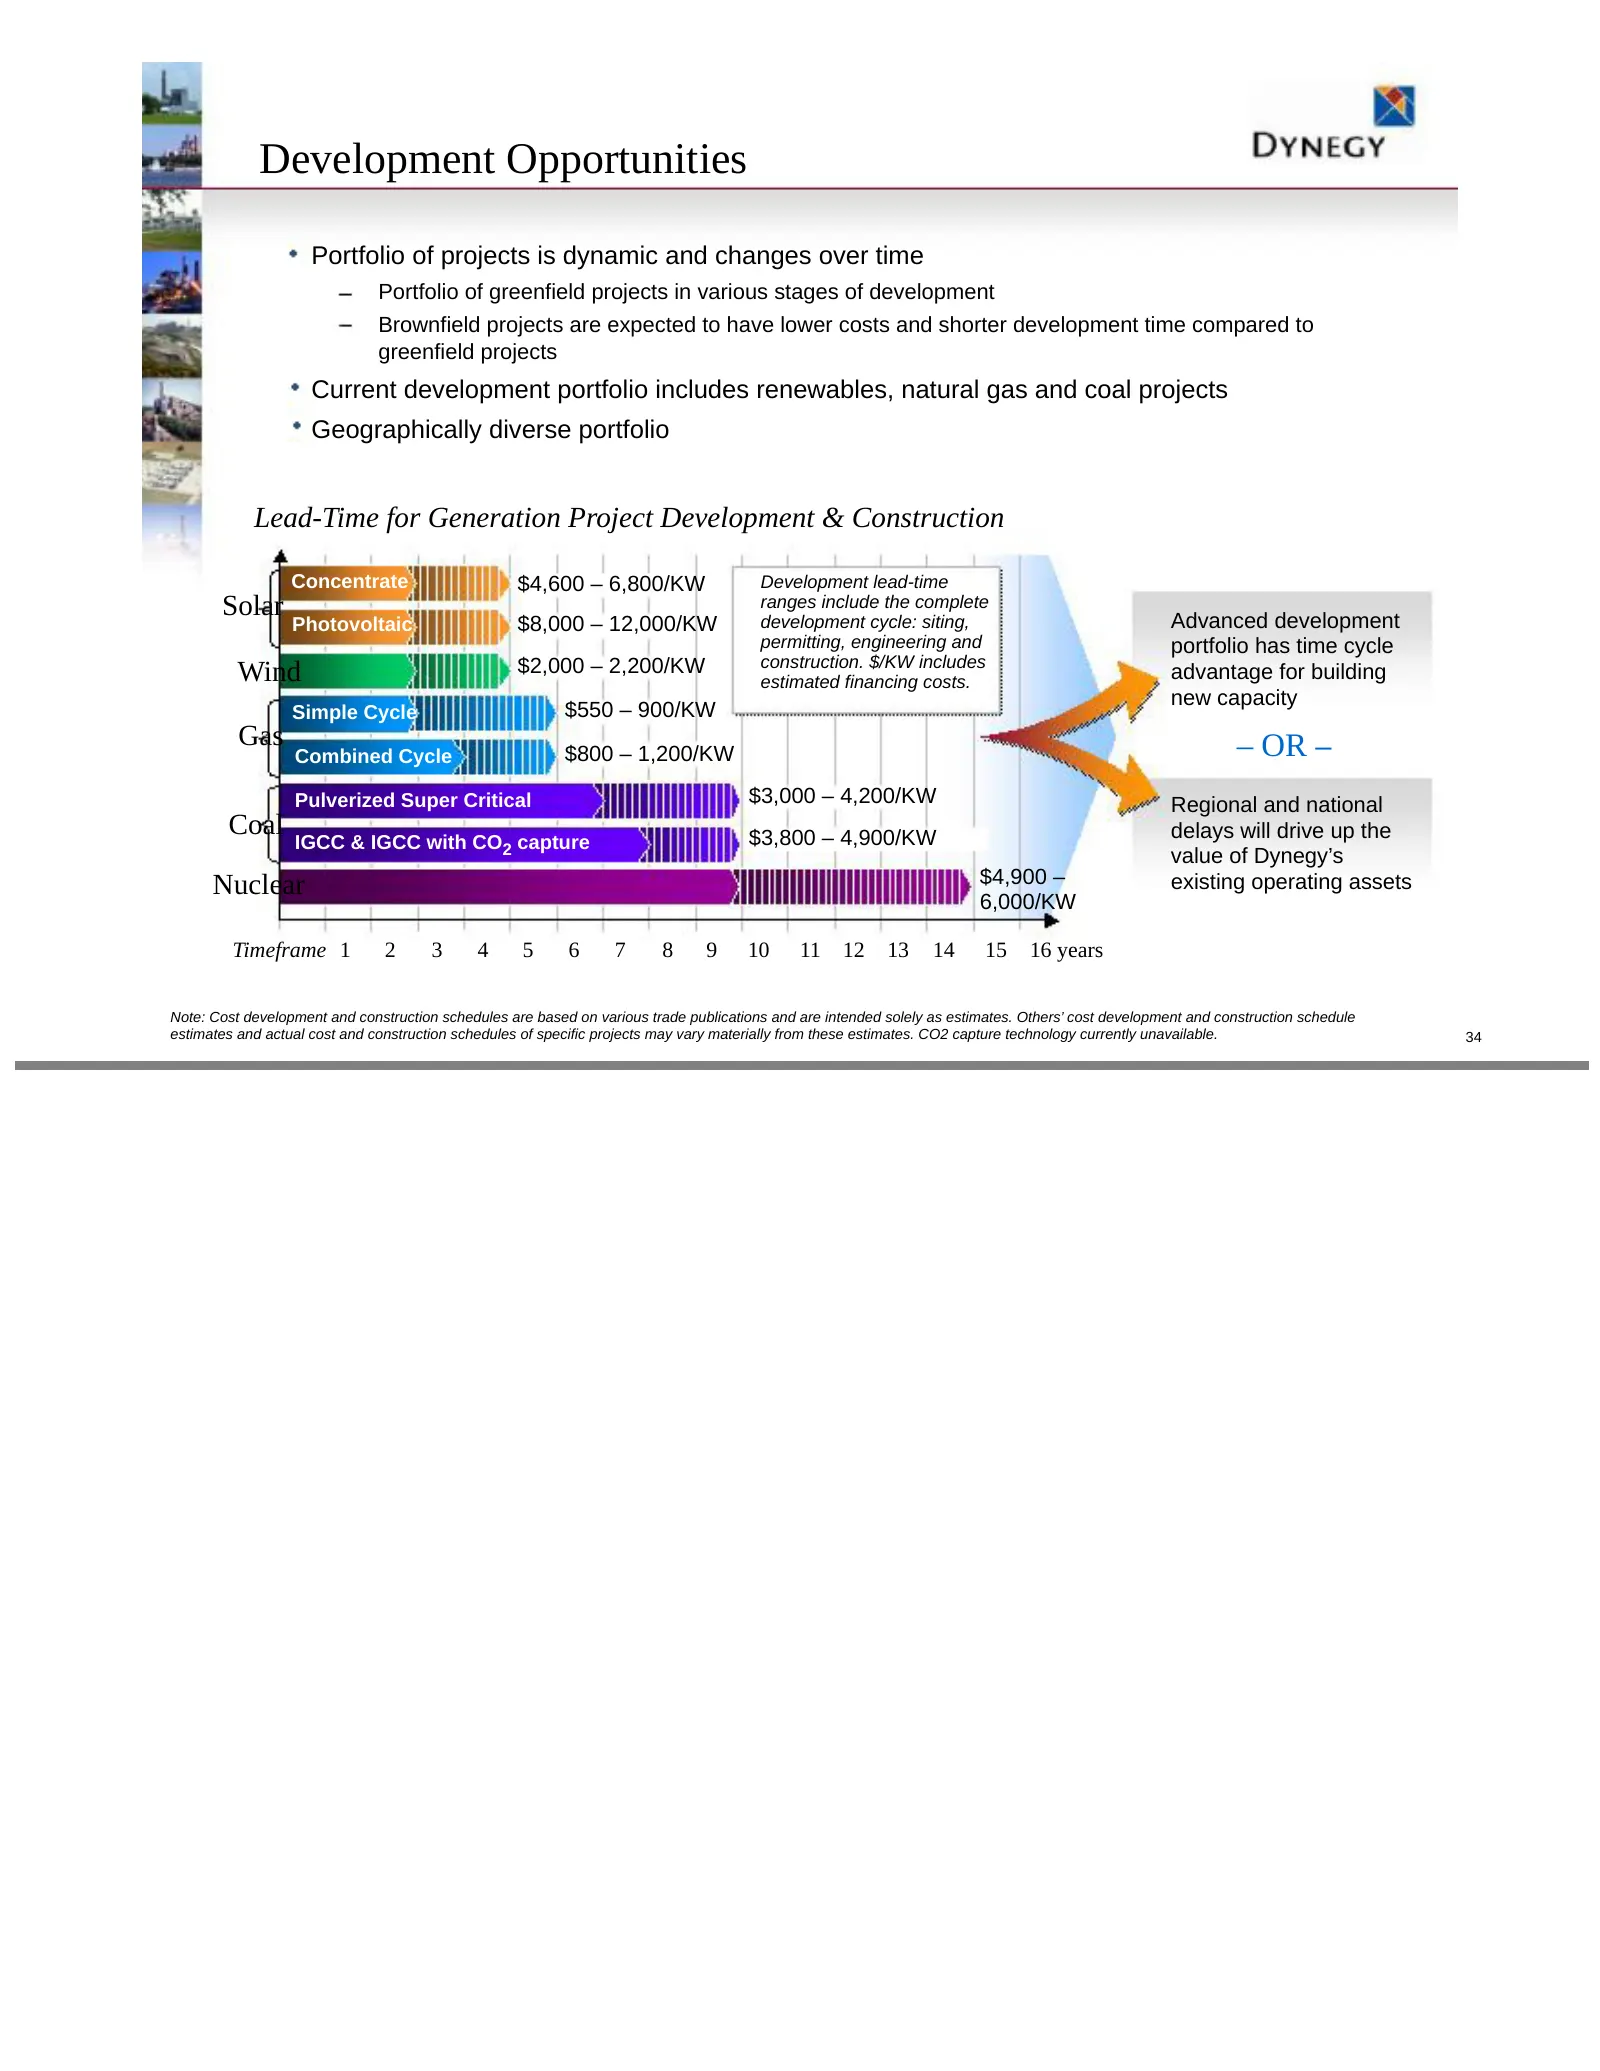
Development Opportunities Portfolio of projects is dynamic and changes over time Portfolio of greenfield projects in various stages of development Brownfield projects are expected to have lower costs and shorter development time compared to greenfield projects Current development portfolio includes
Slide 35: Debt Maturity Profile ($ MM)
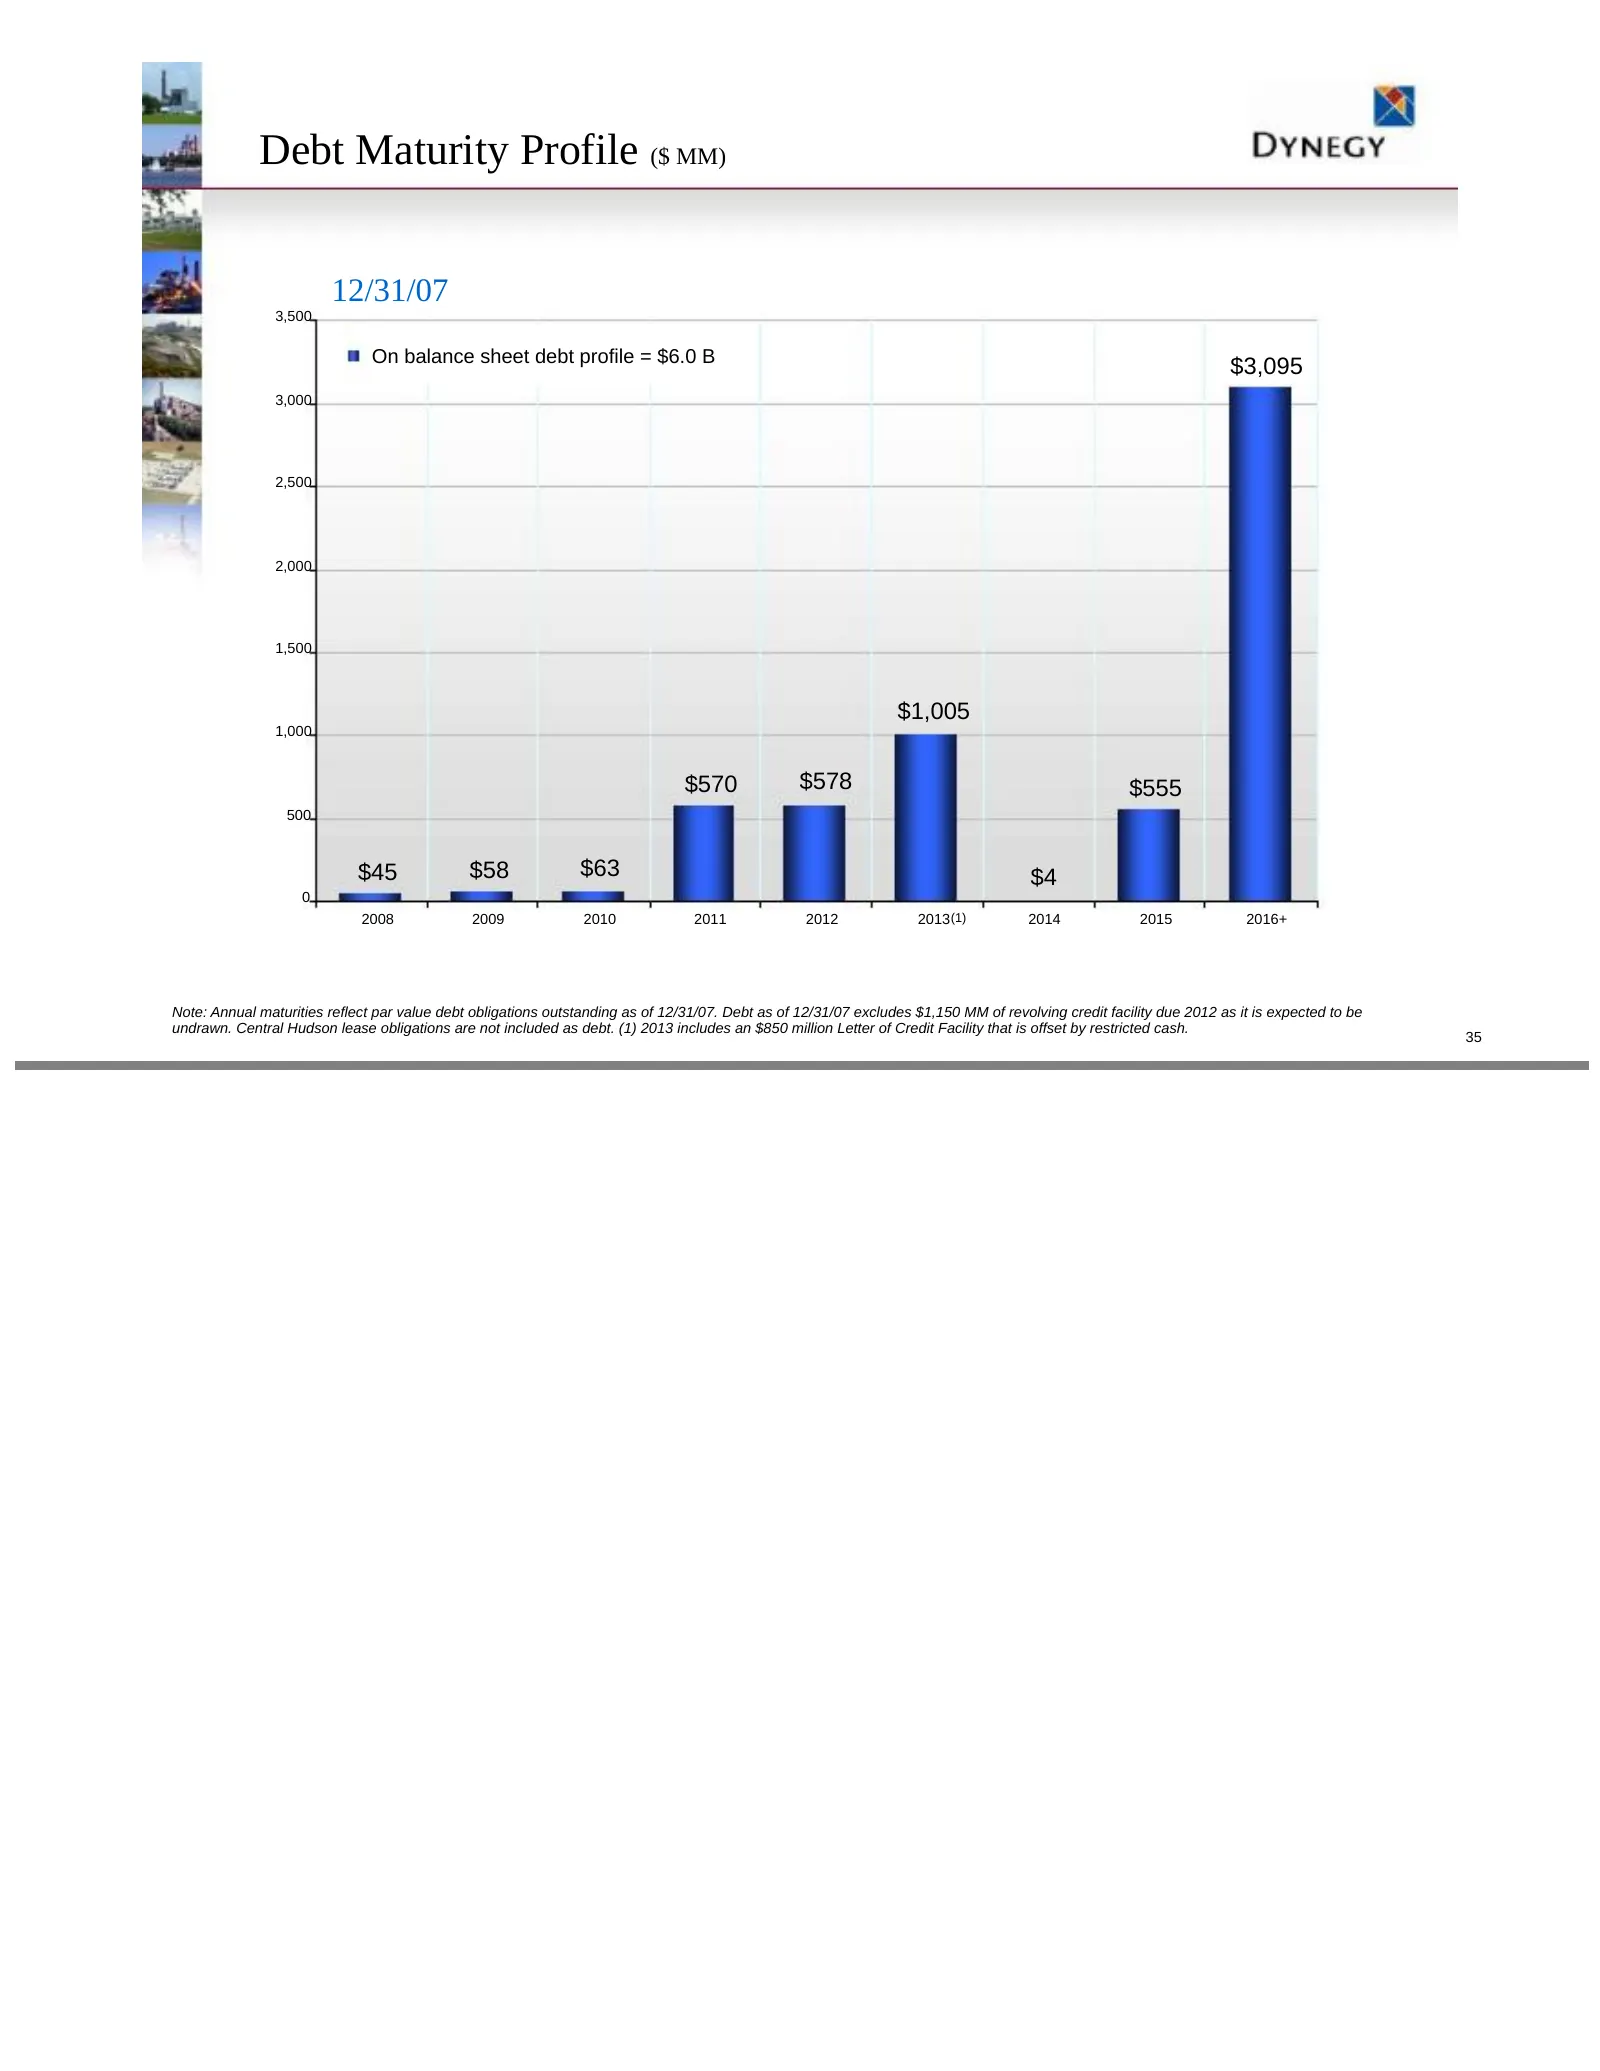
Debt Maturity Profile ($ MM) 12/31/07 3,500 On balance sheet debt profile = $6.0 B $3,095 3,000 2,500 2,000 1,500 $1,005 1,000 $570 $578 $555 500 $45 $58 $63 $4 0 2008 2009 2010 2011 2012 2013 (1) 2014 2015 2016+ Note: Annual maturities reflect par value debt obligations outstanding as of 12/31/07.
Slide 36: Debt & Other Obligations Capital Structure – 12/31/07
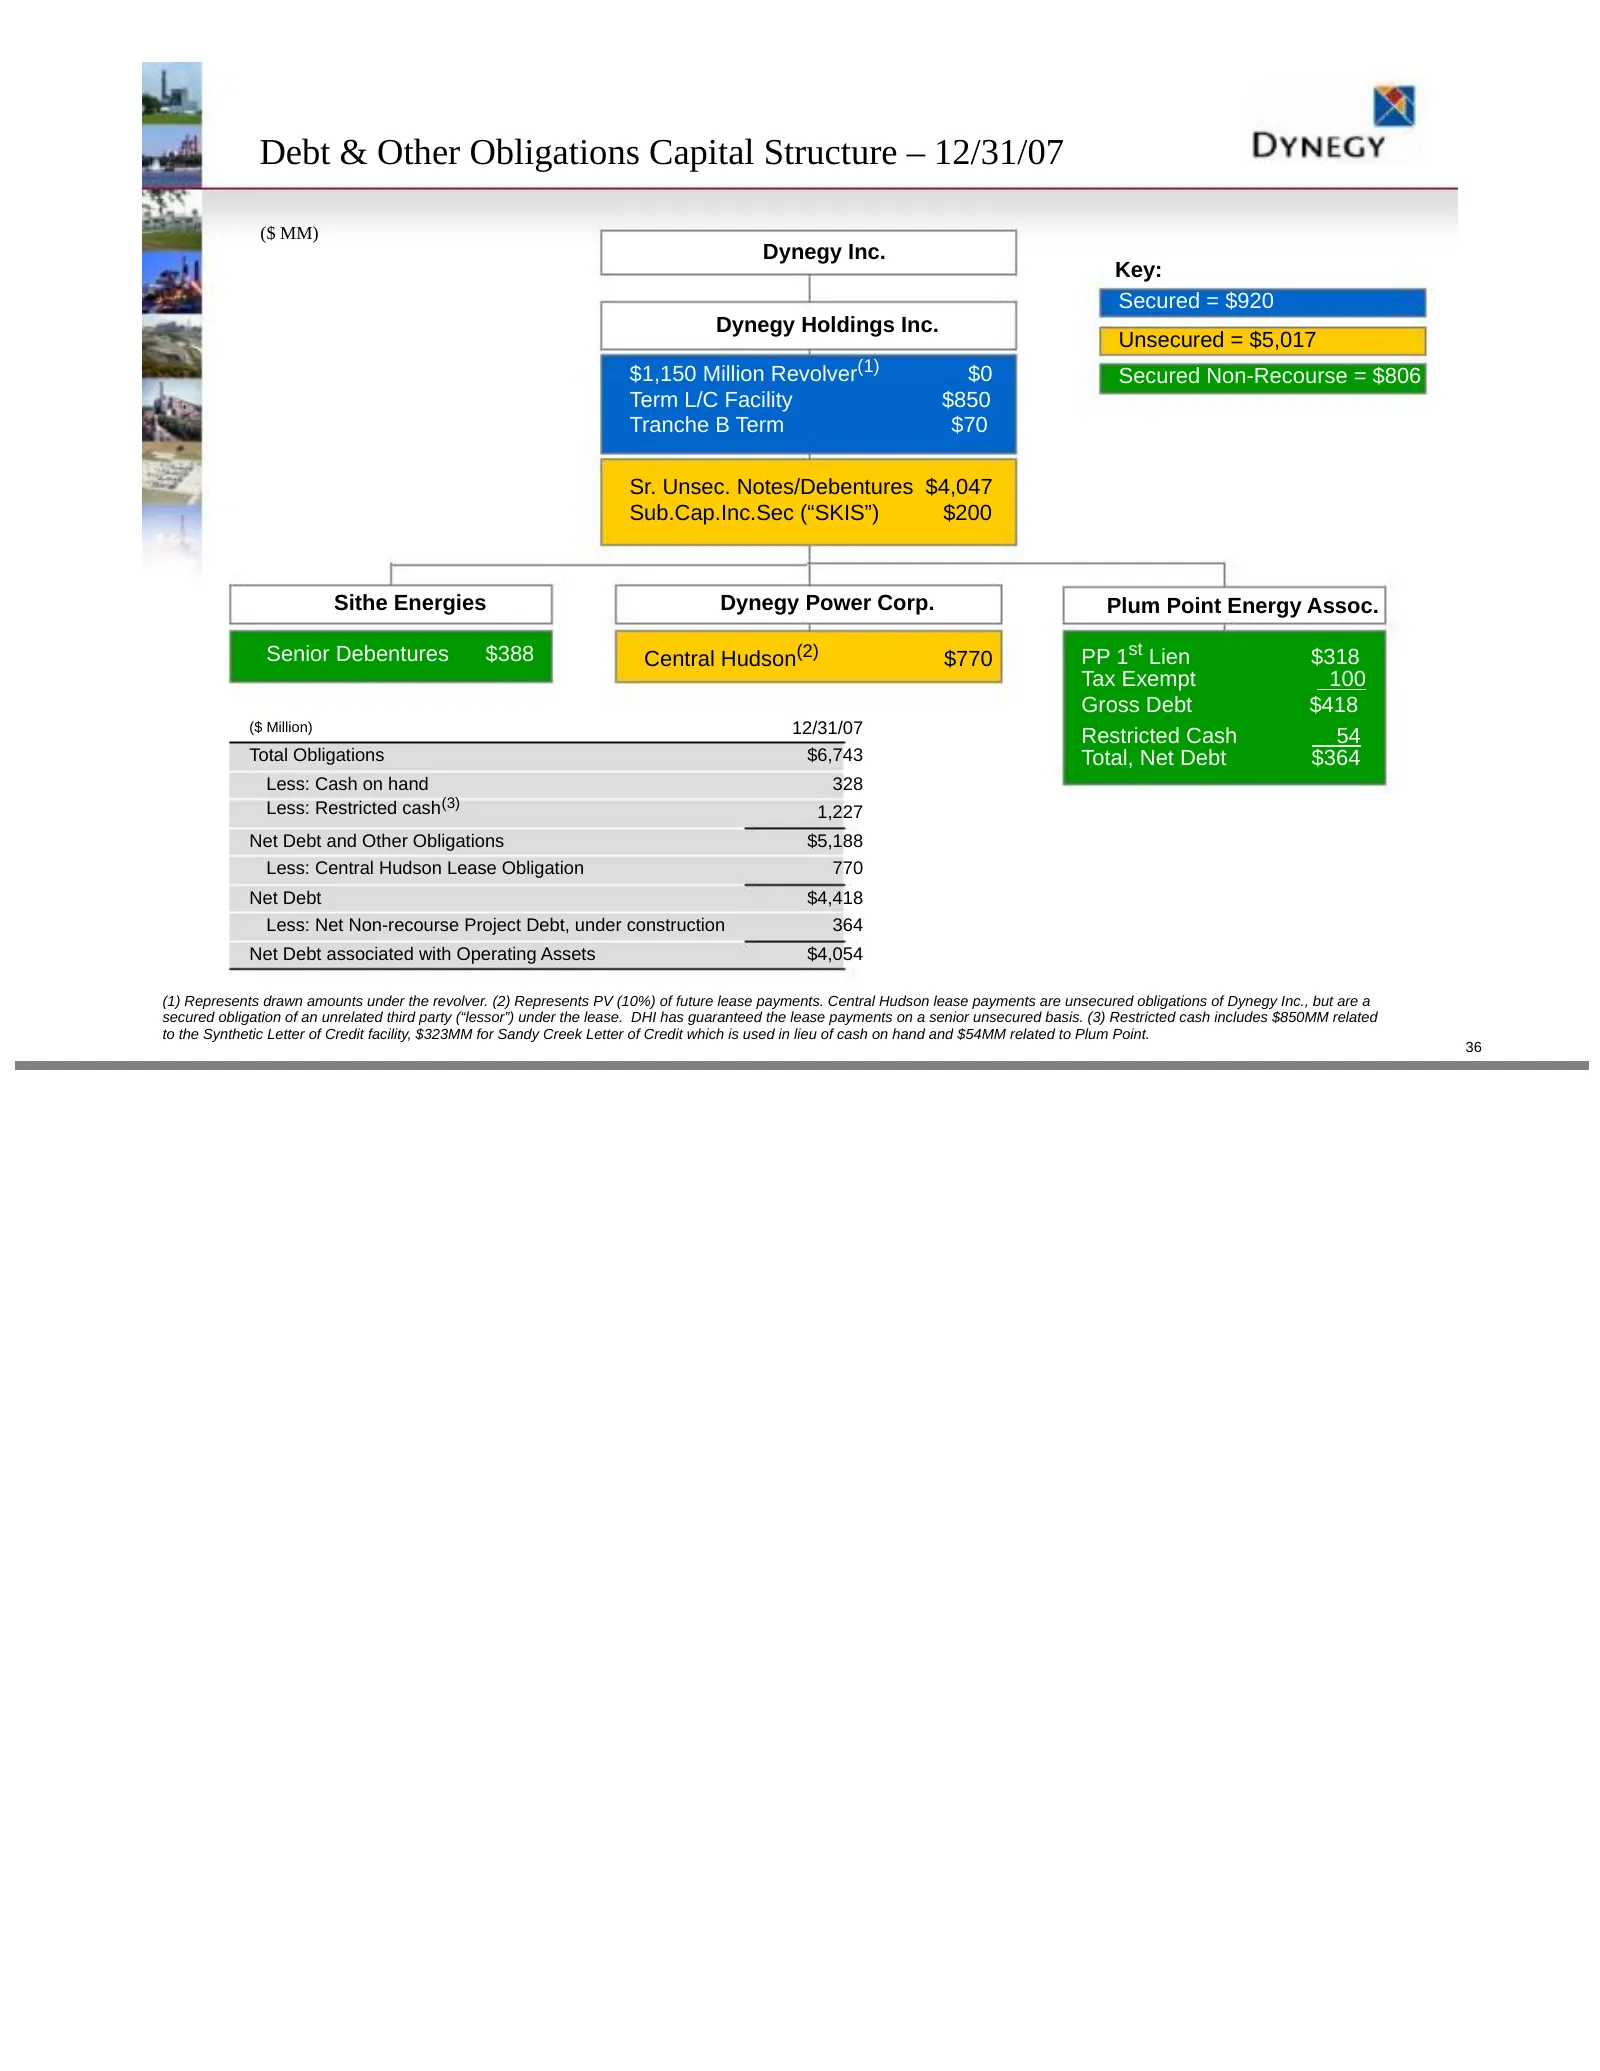
Debt & Other Obligations Capital Structure – 12/31/07 ($ MM) Dynegy Inc.. Key: Secured = $920 Dynegy Holdings Inc. Unsecured = $5,017 $1,150 Million Revolver(1) $0 Secured Non-Recourse = $806 Term L/C Facility $850 Tranche B Term $70 Sr. Unsec. Notes/Debentures $4,047 Sub.Cap.Inc.Sec (“SKIS”) $200 S
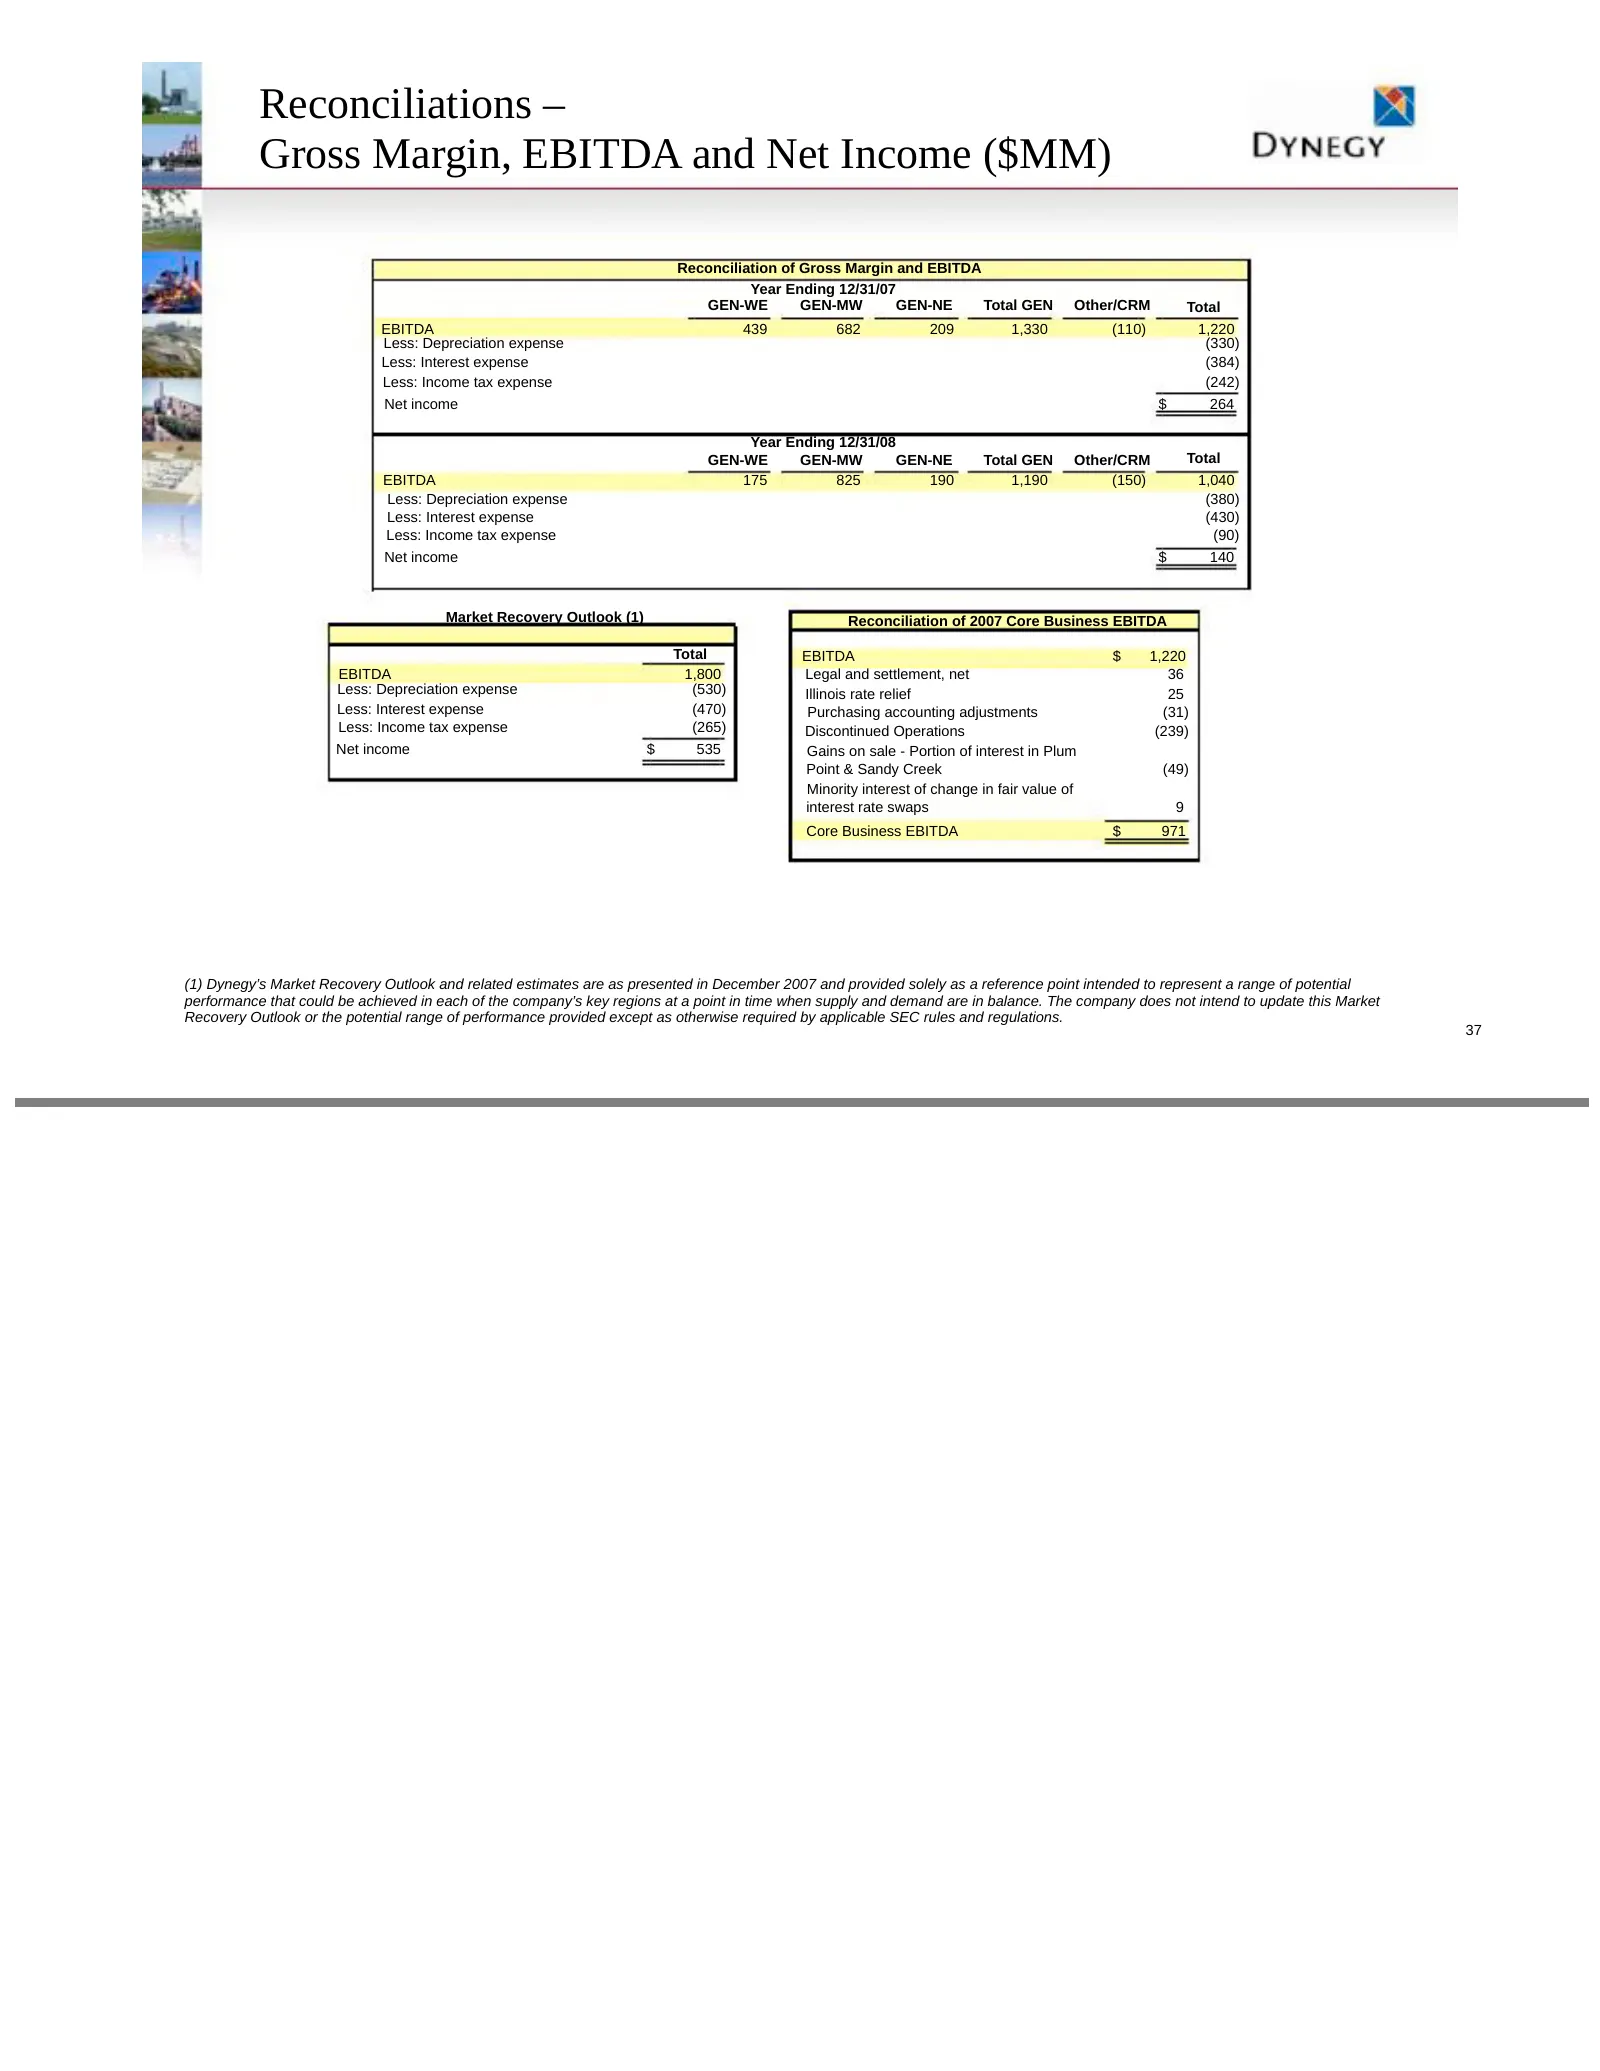
Slide 37: Reconciliations – Gross Margin, EBITDA and Net Income
Reconciliations – Gross Margin, EBITDA and Net Income ($MM) Reconciliation of Gross Margin and EBITDA Year Ending 12/31/07 GEN-WE GEN-MW GEN-NE Total GEN Other/CRM Total EBITDA 439 682 209 1,330 (110) 1,220 Less: Depreciation expense (330) Less: Interest expense (384) Less: Income tax expense (242)
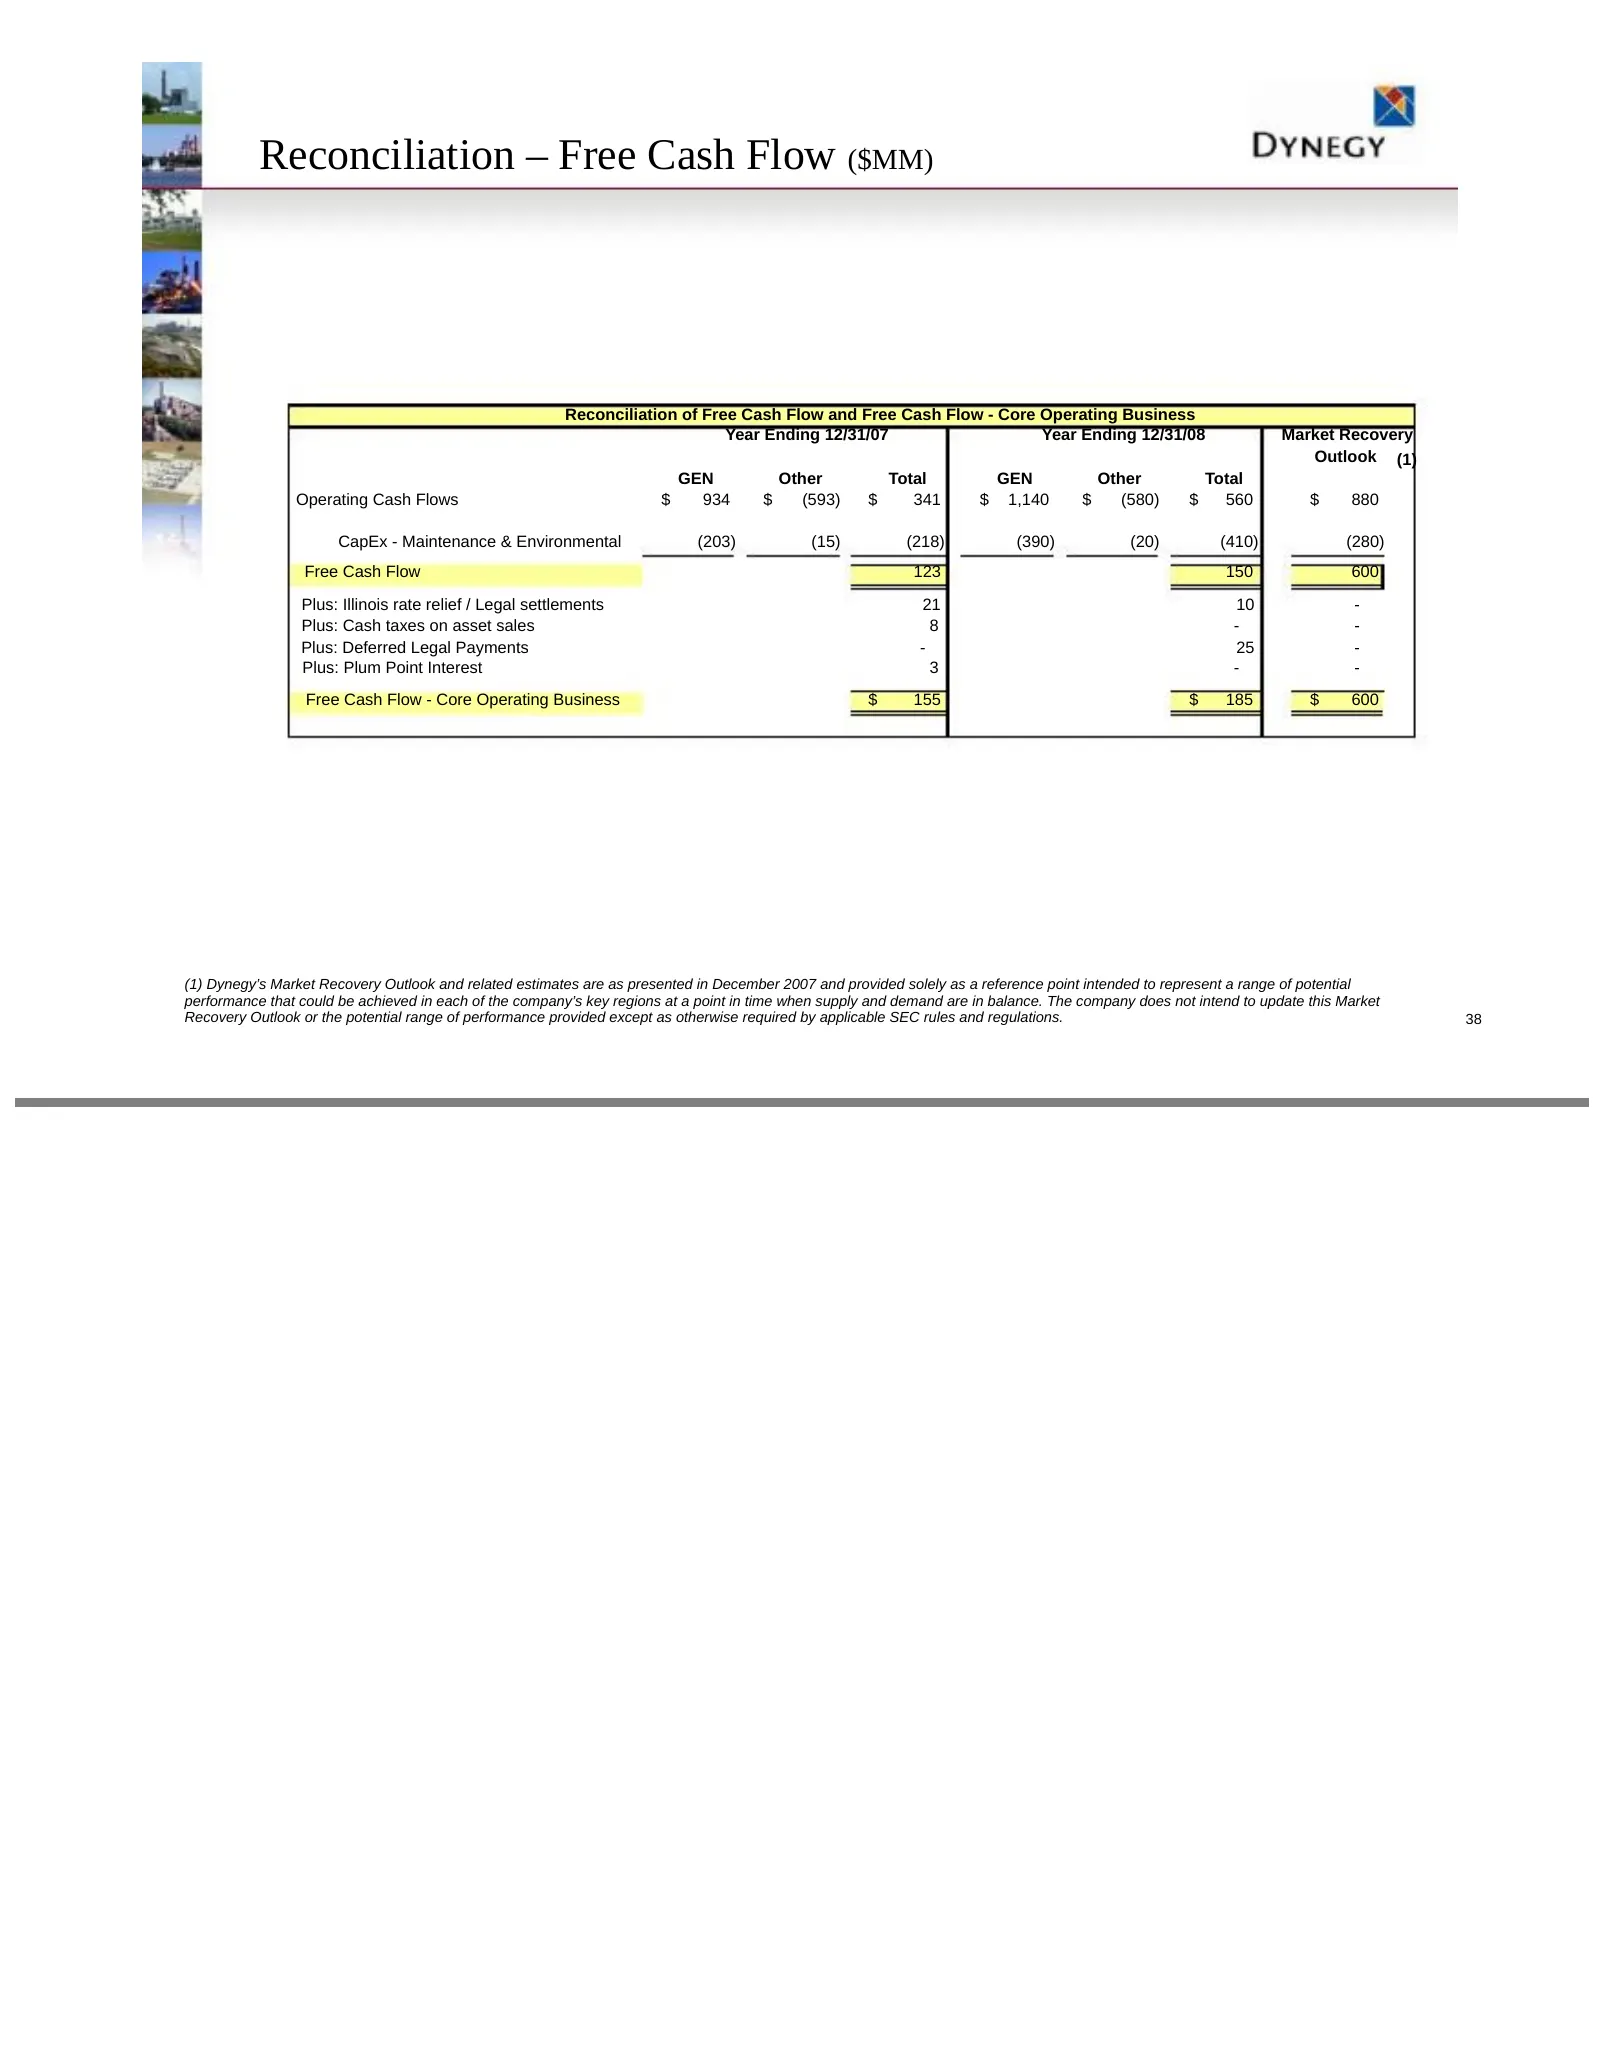
Slide 38: Reconciliation – Free Cash Flow ($MM)
Reconciliation – Free Cash Flow ($MM) Reconciliation of Free Cash Flow and Free Cash Flow - Core Operating Business Year Ending 12/31/07 Year Ending 12/31/08 Market Recovery Outlook (1) GEN Other Total GEN Other Total Operating Cash Flows $ 934 $ (593) $ 341 $ 1,140 $ (580) $ 560 $ 880 CapEx - Maint
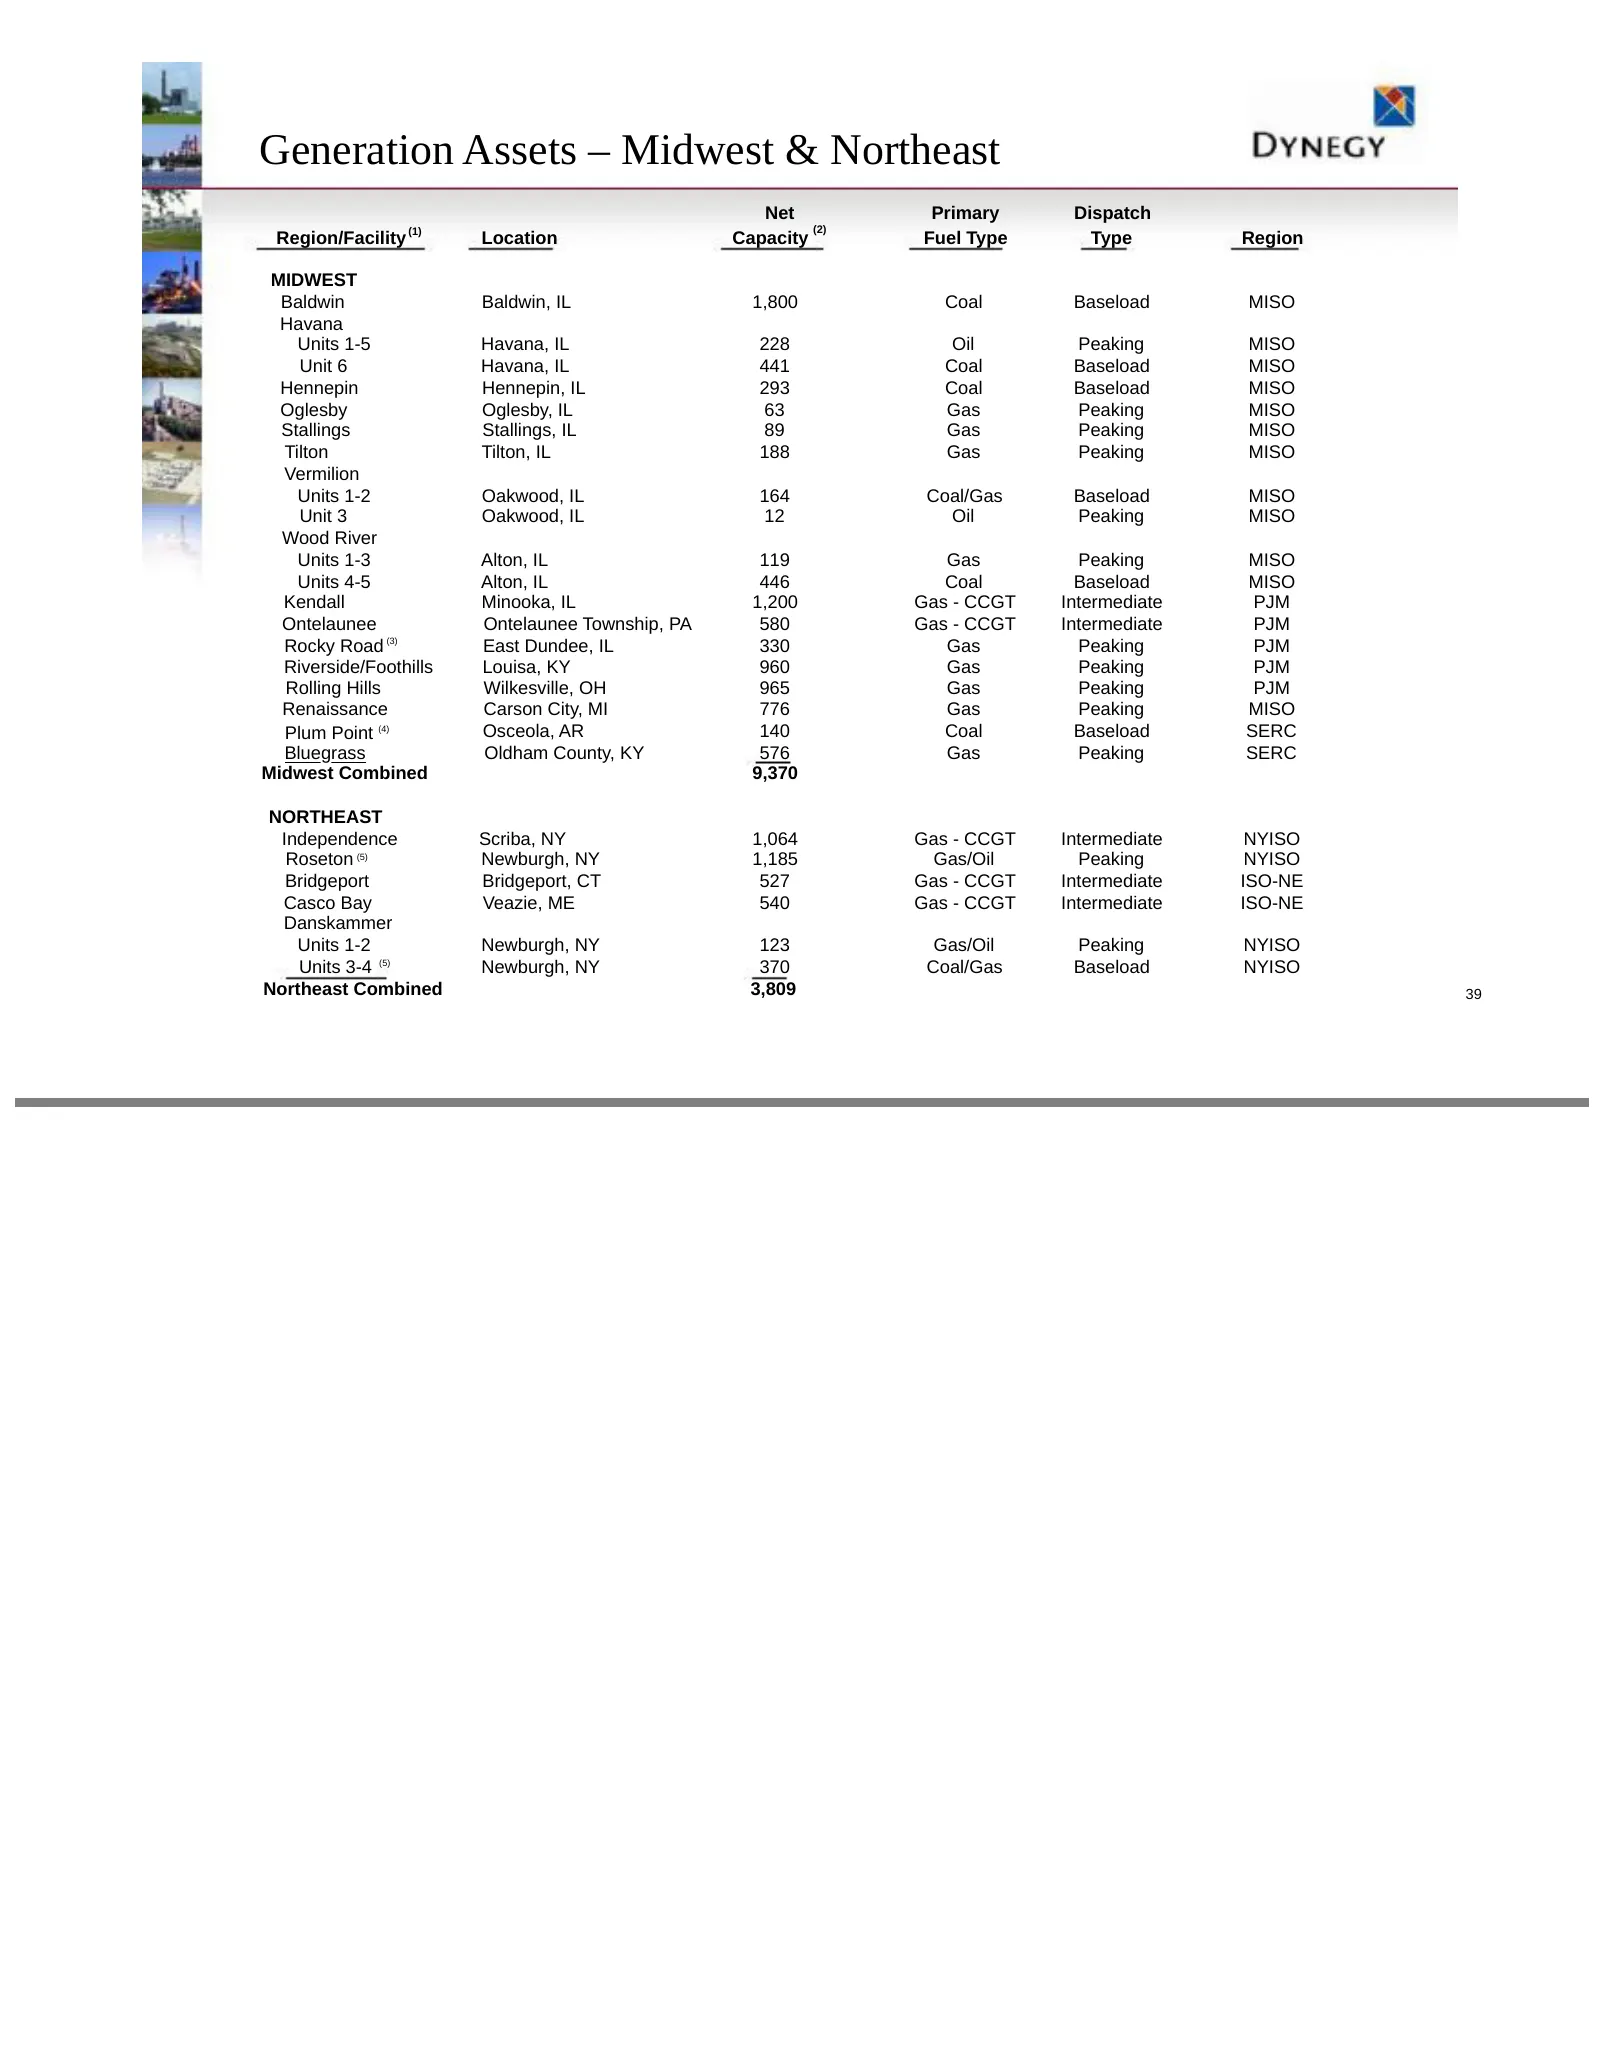
Slide 39: Generation Assets – Midwest & Northeast
Generation Assets – Midwest & Northeast Net Primary Dispatch (1) (2) Region/Facility Location Capacity Fuel Type Type Region MIDWEST Baldwin Baldwin, IL 1,800 Coal Baseload MISO Havana Units 1-5 Havana, IL 228 Oil Peaking MISO Unit 6 Havana, IL 441 Coal Baseload MISO Hennepin Hennepin, IL 293 Coal B
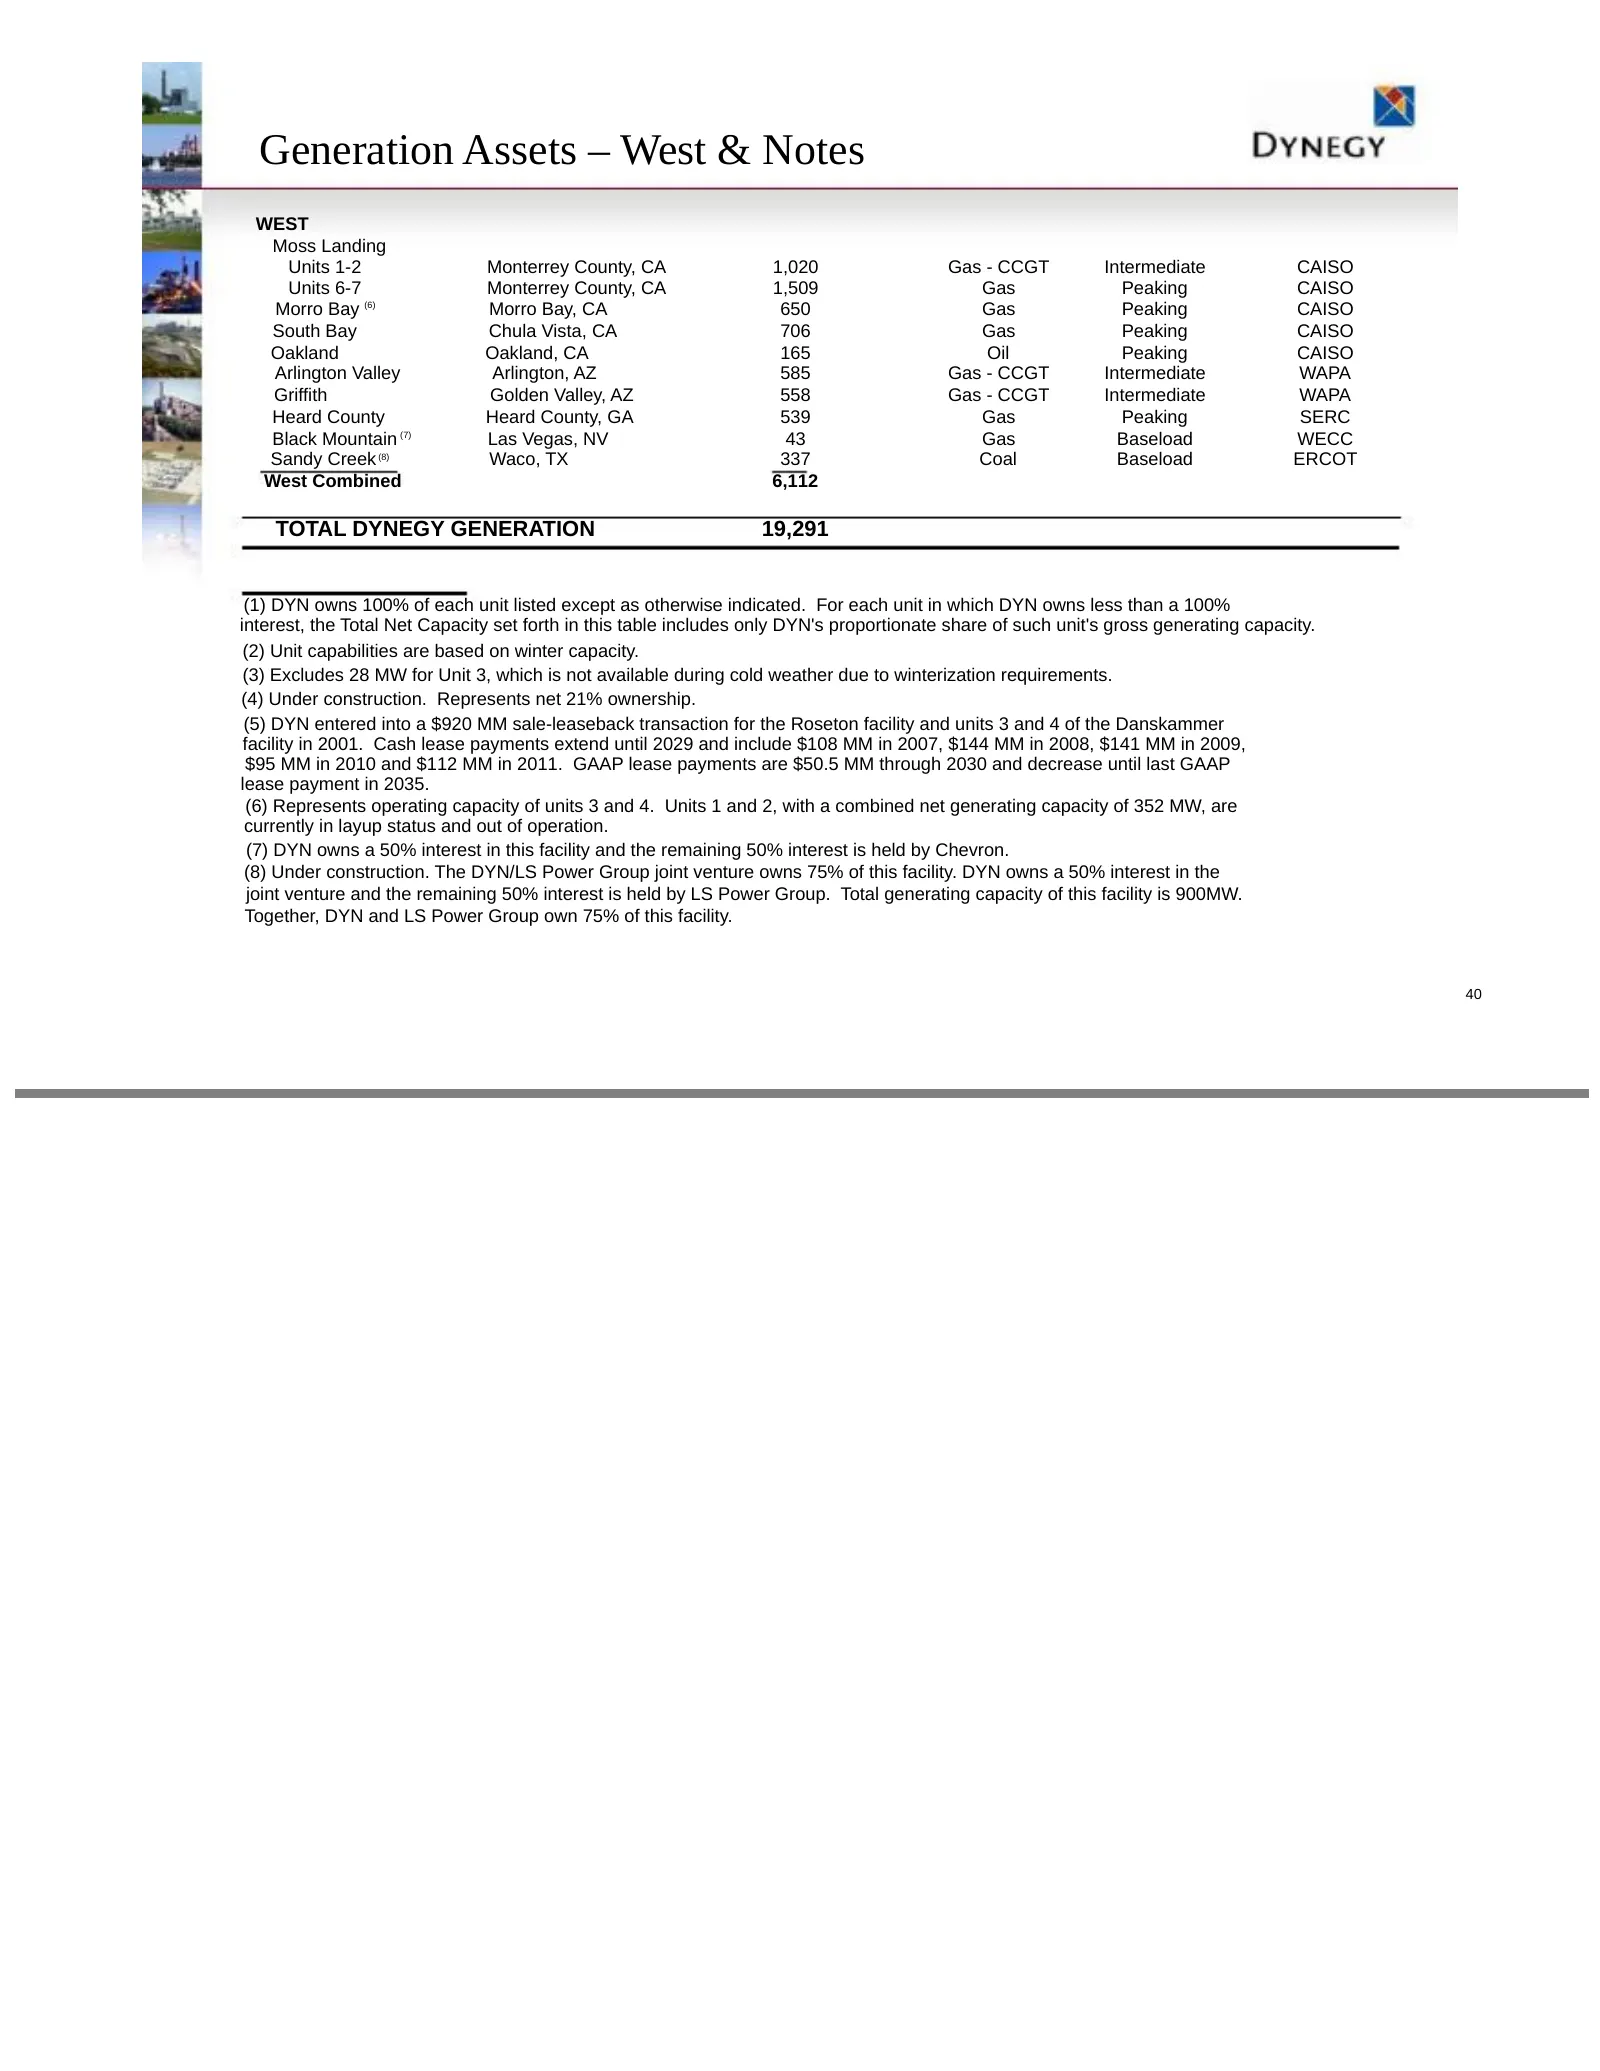
Slide 40: Generation Assets – West & Notes
Generation Assets – West & Notes WEST Moss Landing Units 1-2 Monterrey County, CA 1,020 Gas - CCGT Intermediate CAISO Units 6-7 Monterrey County, CA 1,509 Gas Peaking CAISO Morro Bay (6) Morro Bay, CA 650 Gas Peaking CAISO South Bay Chula Vista, CA 706 Gas Peaking CAISO Oakland Oakland, CA 165 Oil P
Source: SEC EDGAR · 8-K filed Apr 22, 2008
More decks from Dynegy Inc
 FY2017 Earnings Presentation30 slides · Feb 26, 2018
 Debt Investor Presentation (December 2017)10 slides · Dec 11, 2017
 Merger or Acquisition (October 2017)28 slides · Oct 31, 2017
 Debt Investor Presentation (October 2016)44 slides · Oct 3, 2016
 IPO Roadshow (June 2016)17 slides · Jun 15, 2016
 Investor Day (April 2014)94 slides · Apr 11, 2014