Centrue Financial — Q2 2016 Earnings Presentation
21 slides from Centrue Financial's earnings presentation, Jul 28, 2016
Slide 1: Centrue Financial Corporation Earnings Presentation June 30, 2016
Centrue Financial Corporation Earnings Presentation June 30, 2016 NASDAQ: CFCB 1
Slide 2: Forward-looking statements
This presentation contains forward-looking statements within the meaning of the Private Securities Litigation Reform Act of 1995. Forward-looking statements include statements concerning plans, objectives, goals, strategies, expectations, intentions, projections, developments, future events, perform
Slide 3: Corporate Profile – June 30, 2016
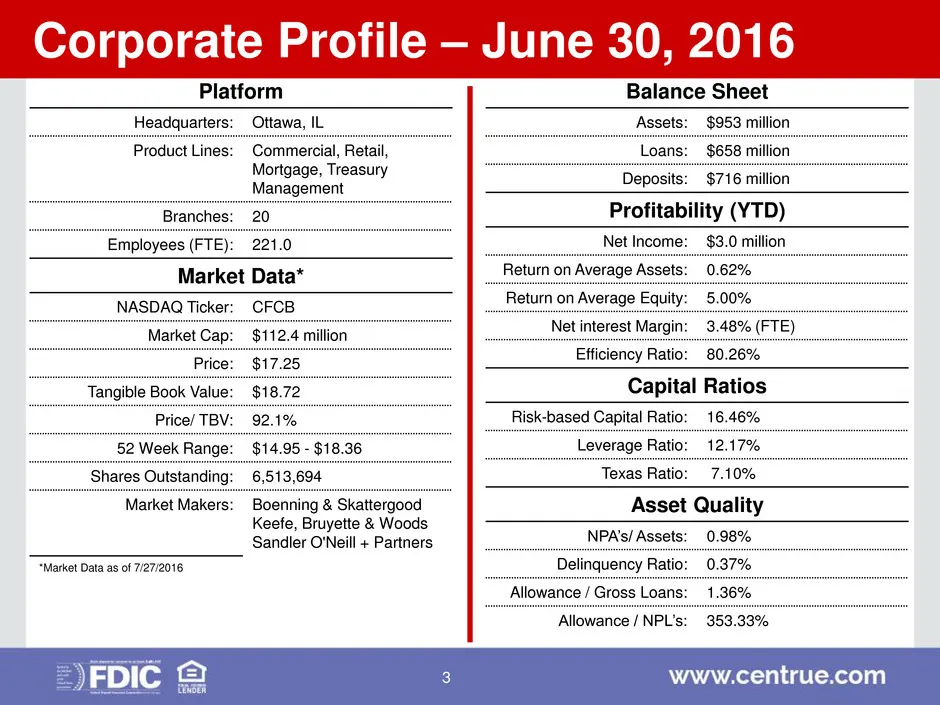
Corporate Profile – June 30, 2016 Platform Headquarters: Ottawa, IL Product Lines: Commercial, Retail, Mortgage, Treasury Management Branches: 20 Employees (FTE): 221.0 Market Data* NASDAQ Ticker: CFCB Market Cap: $112.4 million Price: $17.25 Tangible Book Value: $18.72 Price/ TBV: 92.1% 52 Week Ran
Slide 4: Franchise Value
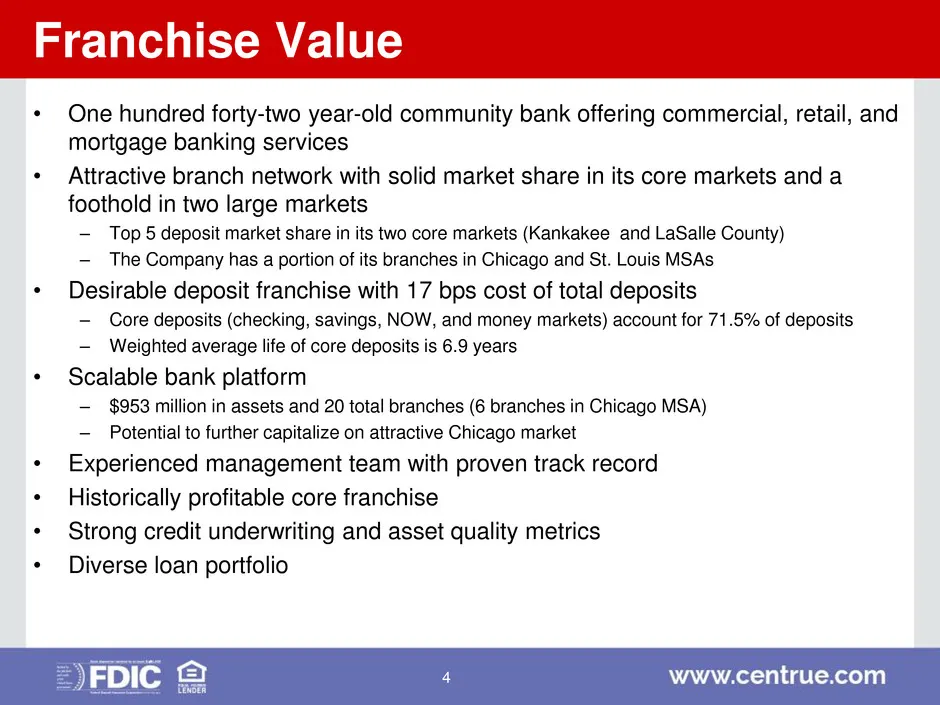
Franchise Value • One hundred forty-two year-old community bank offering commercial, retail, and mortgage banking services • Attractive branch network with solid market share in its core markets and a foothold in two large markets – Top 5 deposit market share in its two core markets (Kankakee and La
Slide 5: Second Quarter Highlights
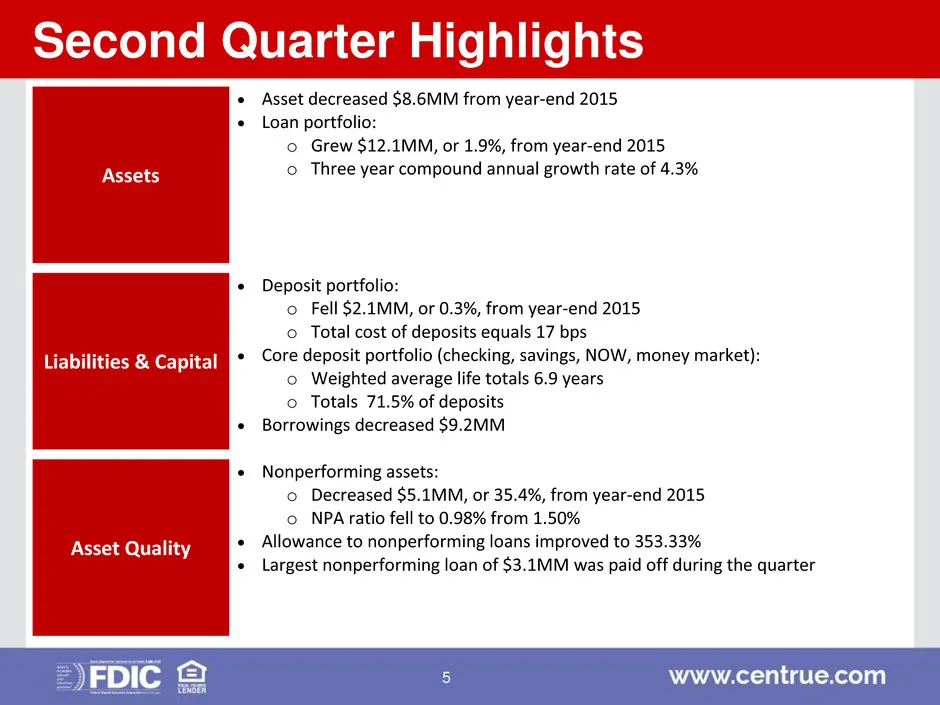
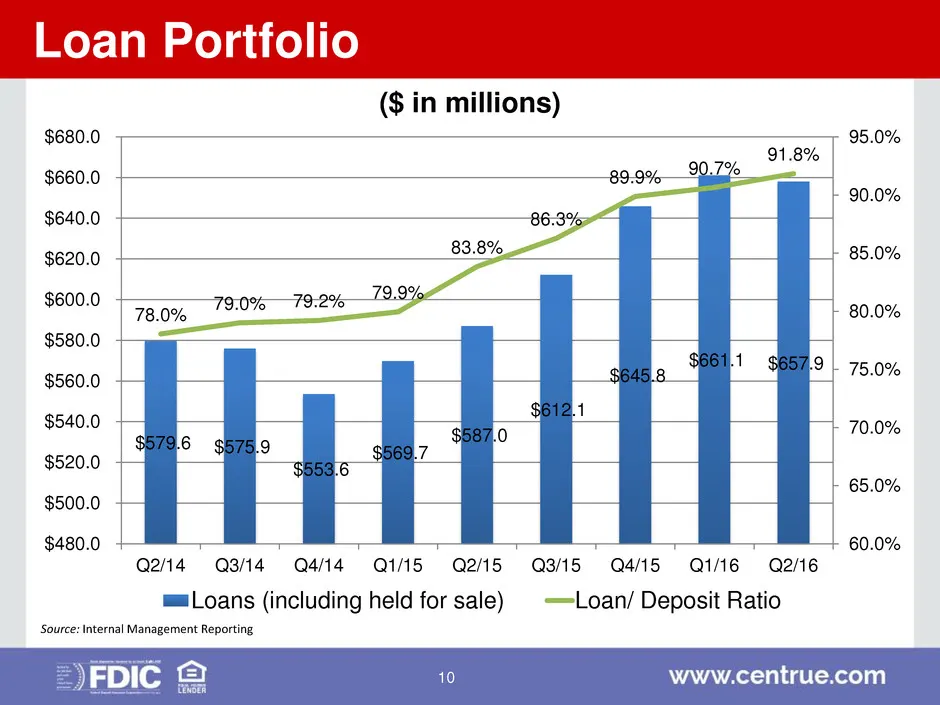
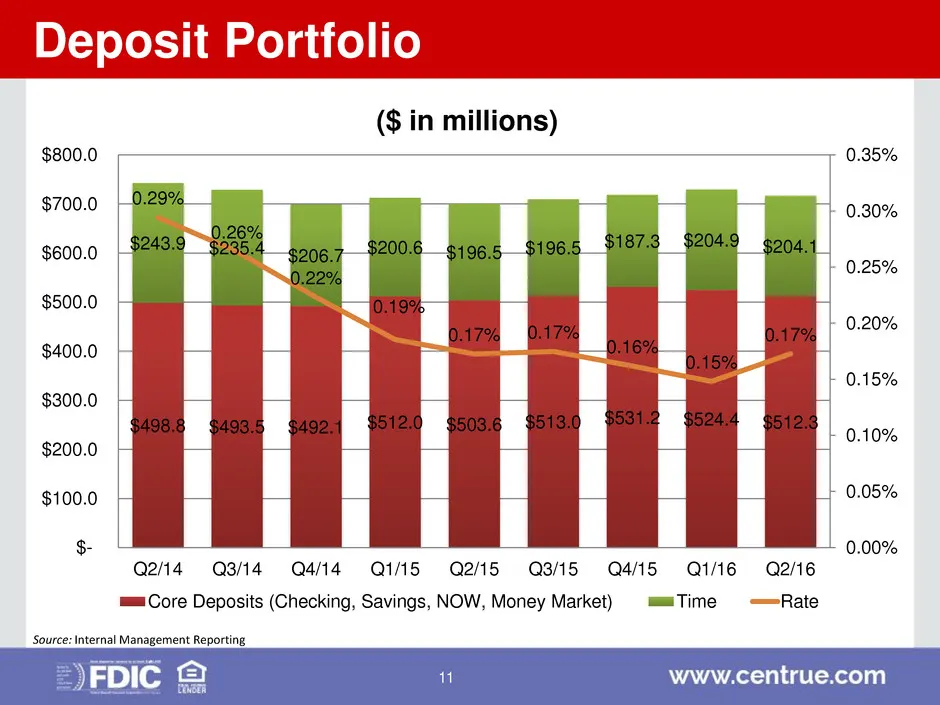
Second Quarter Highlights Assets Asset decreased $8.6MM from year-end 2015 Loan portfolio: o Grew $12.1MM, or 1.9%, from year-end 2015 o Three year compound annual growth rate of 4.3% Liabilities & Capital Deposit portfolio: o Fell $2.1MM, or 0.3%, from year-end 2015 o Total cost of deposits e
Slide 6: Second Quarter Highlights
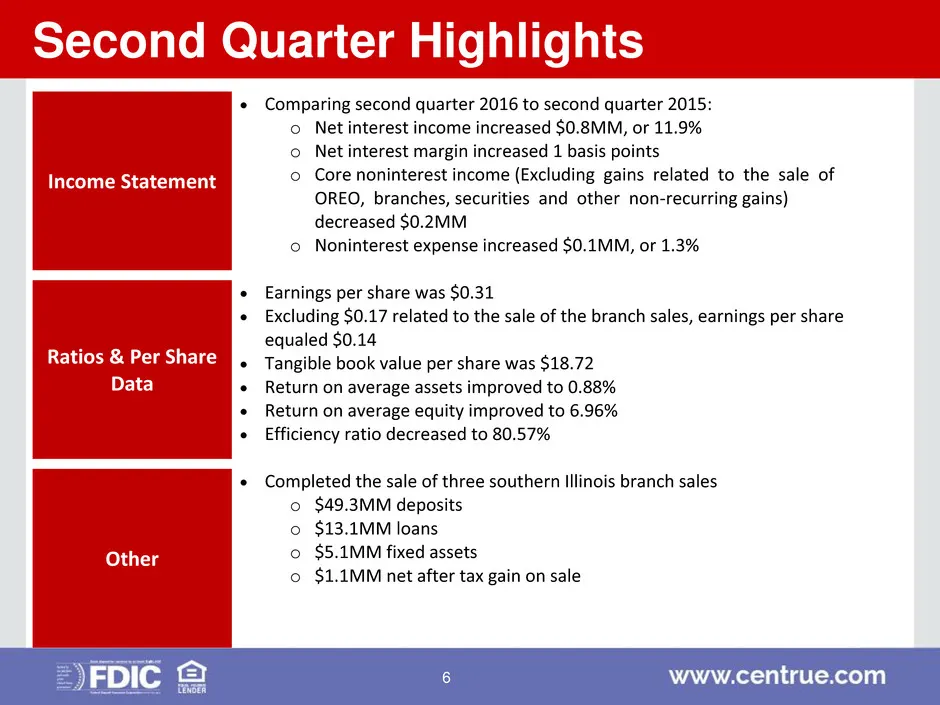
Second Quarter Highlights Income Statement Comparing second quarter 2016 to second quarter 2015: o Net interest income increased $0.8MM, or 11.9% o Net interest margin increased 1 basis points o Core noninterest income (Excluding gains related to the sale of OREO, branches, securities and other no
Slide 7: 2014-2016 Quarterly Financial Summary (Unaudited)
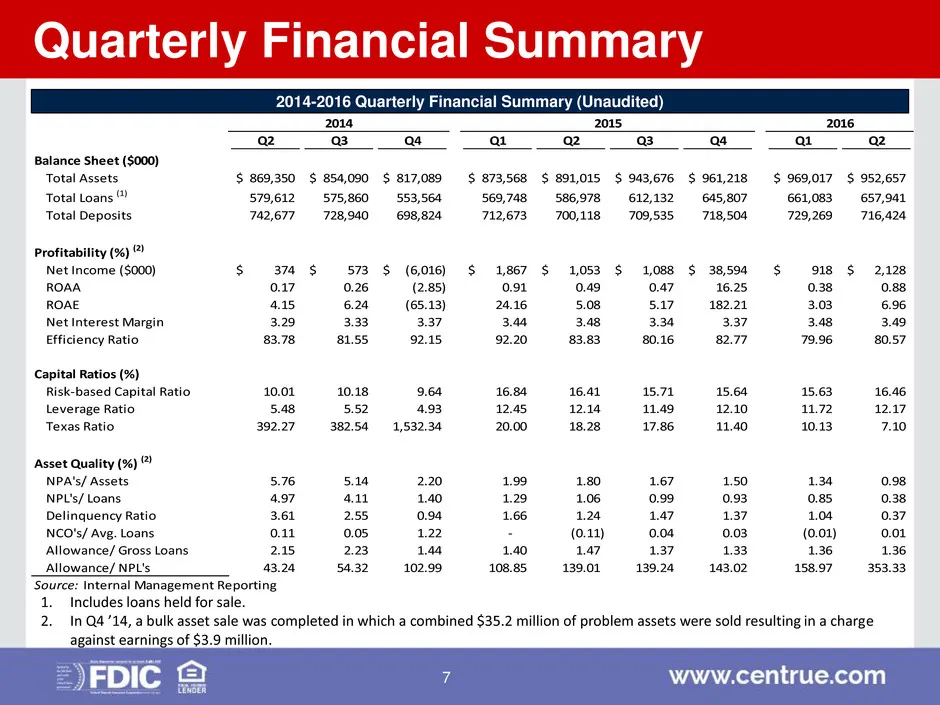
2014-2016 Quarterly Financial Summary (Unaudited) Quarterly Financial Summary Q2 Q3 Q4 Q1 Q2 Q3 Q4 Q1 Q2 Balance Sheet ($000) Total Assets 869,350$ 854,090$ 817,089$ 873,568$ 891,015$ 943,676$ 961,218$ 969,017$ 952,657$ Total Loans (1) 579,612 575,860 553,564 569,748 586,978 612,132 645,807 661,083
Slide 8: 2016 Versus 2015 Results (Unaudited)
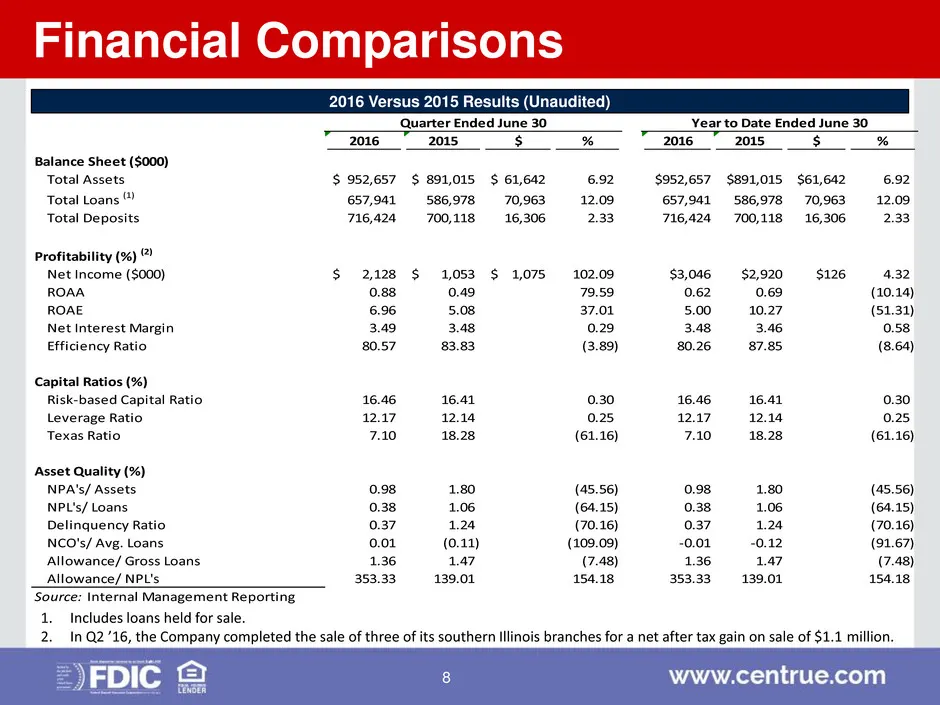
2016 Versus 2015 Results (Unaudited) Financial Comparisons 2016 2015 $ % 2016 2015 $ % Balance Sheet ($000) Total Assets 952,657$ 891,015$ 61,642$ 6.92 $952,657 $891,015 $61,642 6.92 Total Loans (1) 657,941 586,978 70,963 12.09 657,941 586,978 70,963 12.09 Total Deposits 716,424 700,118 16,306 2.33
Slide 9: Loan and Deposit Portfolios
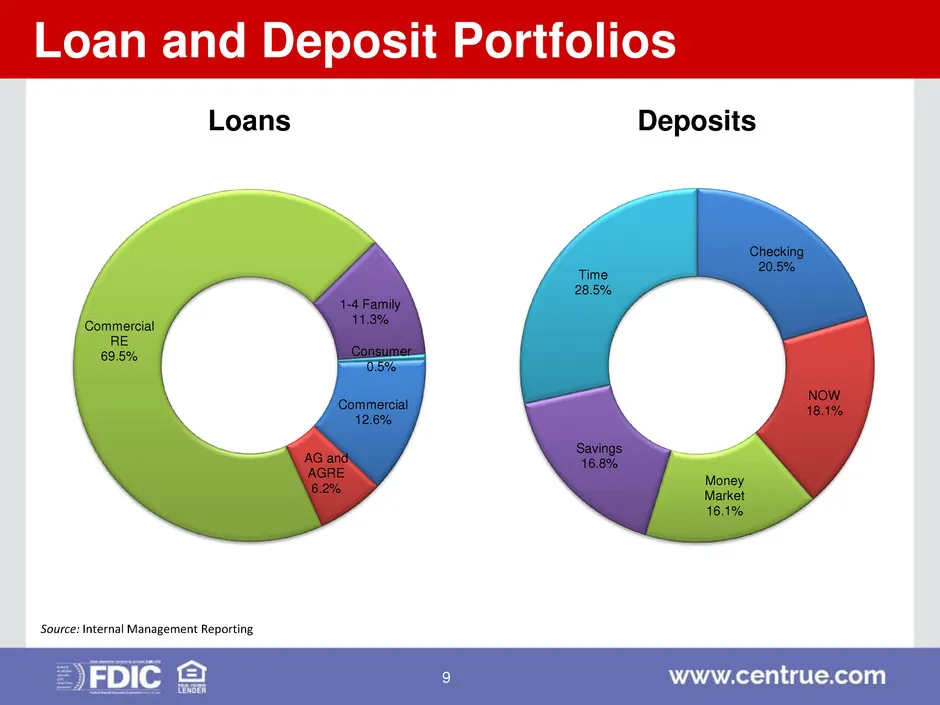
Commercial 12.6% AG and AGRE 6.2% Commercial RE 69.5% 1-4 Family 11.3% Consumer 0.5% Loans Loan and Deposit Portfolios Source: Internal Management Reporting Checking 20.5% NOW 18.1% Money Market 16.1% Savings 16.8% Time 28.5% Deposits 9
Slide 10: Loan Portfolio
Loan Portfolio Source: Internal Management Reporting $579.6 $575.9 $553.6 $569.7 $587.0 $612.1 $645.8 $661.1 $657.9 78.0% 79.0% 79.2% 79.9% 83.8% 86.3% 89.9% 90.7% 91.8% 60.0% 65.0% 70.0% 75.0% 80.0% 85.0% 90.0% 95.0% $480.0 $500.0 $520.0 $540.0 $560.0 $580.0 $600.0 $620.0 $640.0 $660.0 $680.0 Q2/14
Slide 11: Deposit Portfolio
Deposit Portfolio $498.8 $493.5 $492.1 $512.0 $503.6 $513.0 $531.2 $524.4 $512.3 $243.9 $235.4 $206.7 $200.6 $196.5 $196.5 $187.3 $204.9 $204.1 0.29% 0.26% 0.22% 0.19% 0.17% 0.17% 0.16% 0.15% 0.17% 0.00% 0.05% 0.10% 0.15% 0.20% 0.25% 0.30% 0.35% $- $100.0 $200.0 $300.0 $400.0 $500.0 $600.0 $700.0 $8
Slide 12: Asset Quality
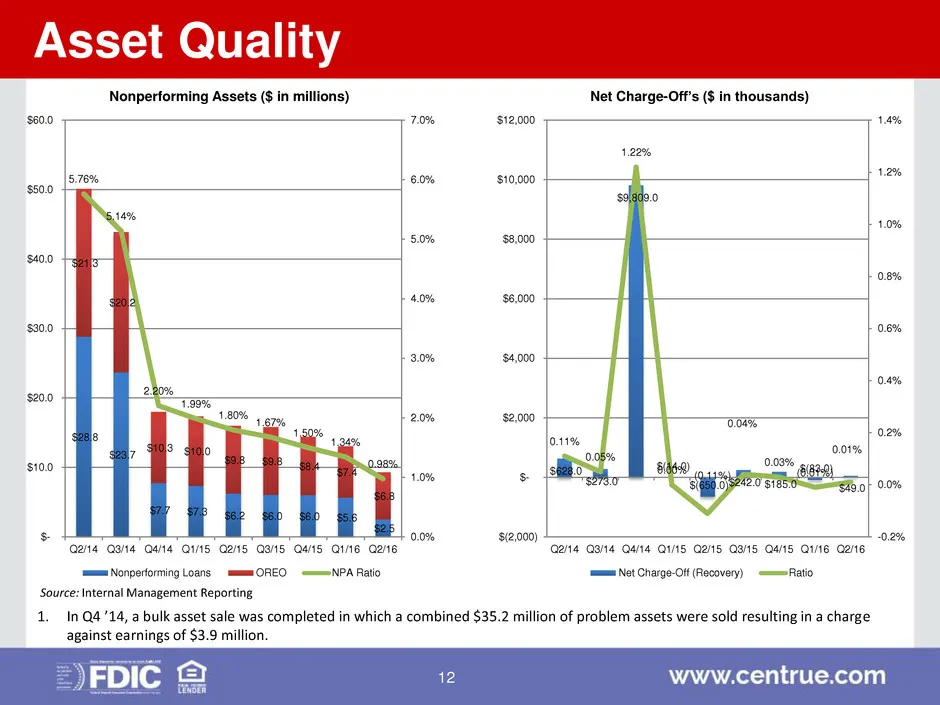
Asset Quality Source: Internal Management Reporting $28.8 $23.7 $7.7 $7.3 $6.2 $6.0 $6.0 $5.6 $2.5 $21.3 $20.2 $10.3 $10.0 $9.8 $9.8 $8.4 $7.4 $6.8 5.76% 5.14% 2.20% 1.99% 1.80% 1.67% 1.50% 1.34% 0.98% 0.0% 1.0% 2.0% 3.0% 4.0% 5.0% 6.0% 7.0% $- $10.0 $20.0 $30.0 $40.0 $50.0 $60.0 Q2/14 Q3/14 Q4/14 Q
Slide 13: Capital
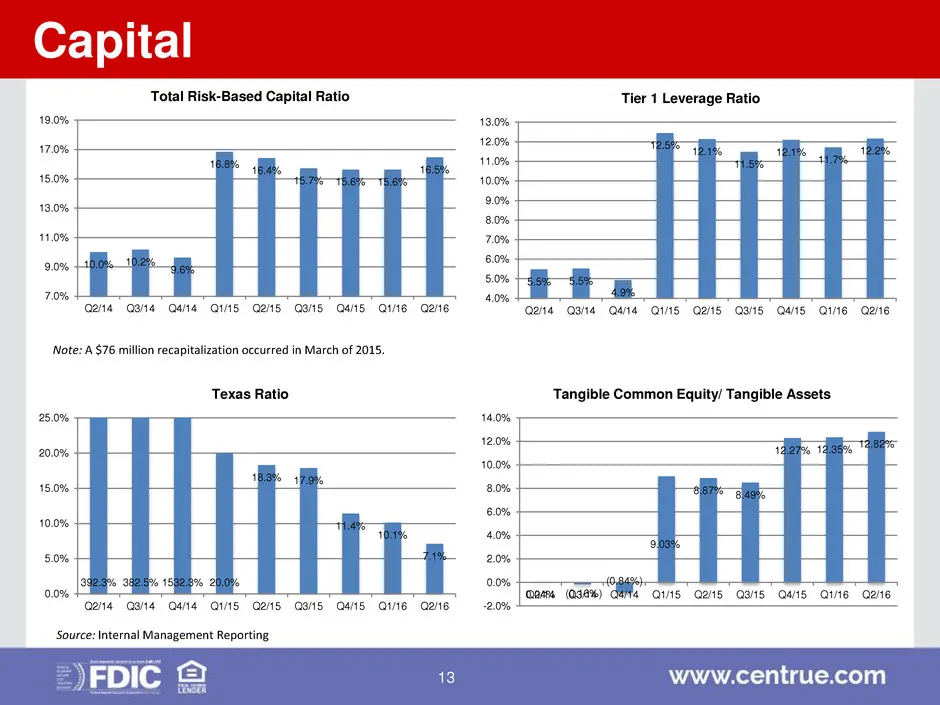
Capital 10.0% 10.2% 9.6% 16.8% 16.4% 15.7% 15.6% 15.6% 16.5% 7.0% 9.0% 11.0% 13.0% 15.0% 17.0% 19.0% Q2/14 Q3/14 Q4/14 Q1/15 Q2/15 Q3/15 Q4/15 Q1/16 Q2/16 Total Risk-Based Capital Ratio 5.5% 5.5% 4.9% 12.5% 12.1% 11.5% 12.1% 11.7% 12.2% 4.0% 5.0% 6.0% 7.0% 8.0% 9.0% 10.0% 11.0% 12.0% 13.0% Q2/14 Q3/
Slide 14: Profitability
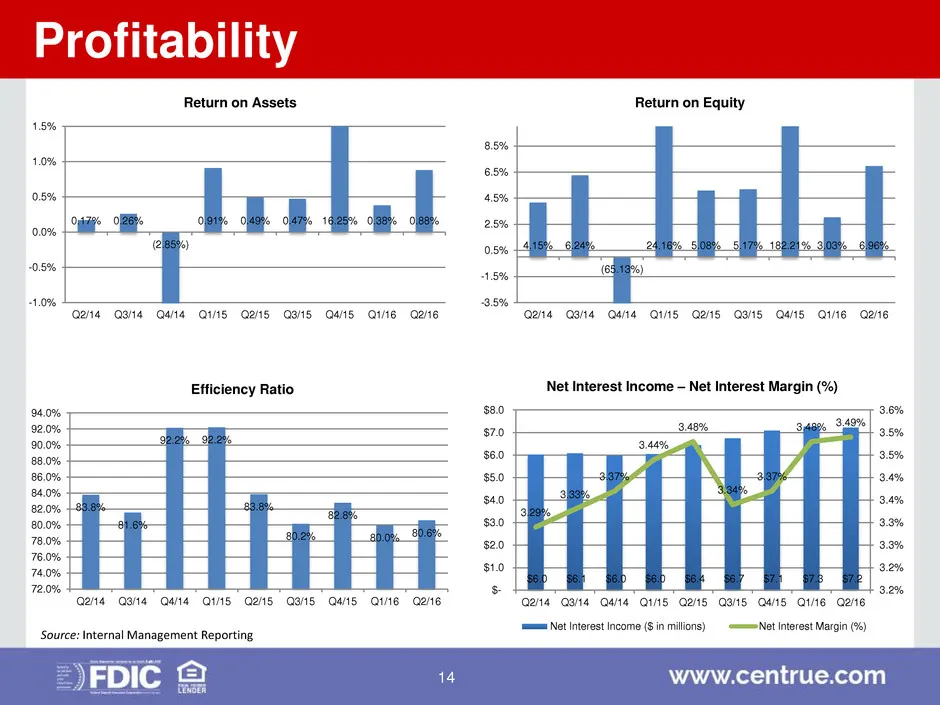
Profitability 0.17% 0.26% (2.85%) 0.91% 0.49% 0.47% 16.25% 0.38% 0.88% -1.0% -0.5% 0.0% 0.5% 1.0% 1.5% Q2/14 Q3/14 Q4/14 Q1/15 Q2/15 Q3/15 Q4/15 Q1/16 Q2/16 Return on Assets 83.8% 81.6% 92.2% 92.2% 83.8% 80.2% 82.8% 80.0% 80.6% 72.0% 74.0% 76.0% 78.0% 80.0% 82.0% 84.0% 86.0% 88.0% 90.0% 92.0% 94.0%
Slide 15: Noninterest Income
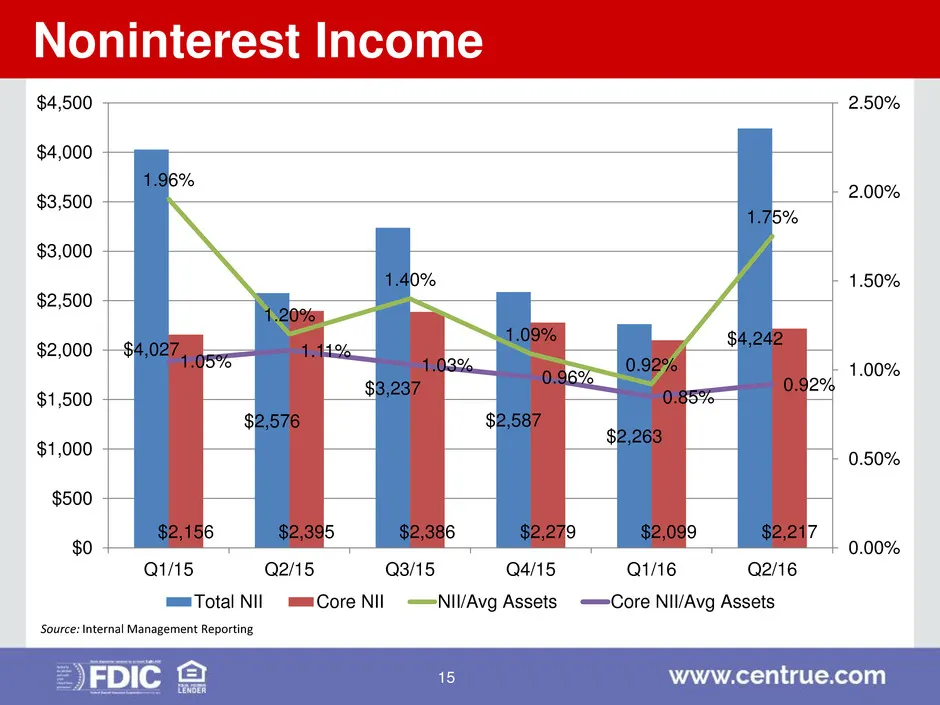
Noninterest Income Source: Internal Management Reporting $4,027 $2,576 $3,237 $2,587 $2,263 $4,242 $2,156 $2,395 $2,386 $2,279 $2,099 $2,217 1.96% 1.20% 1.40% 1.09% 0.92% 1.75% 1.05% 1.11% 1.03% 0.96% 0.85% 0.92% 0.00% 0.50% 1.00% 1.50% 2.00% 2.50% $0 $500 $1,000 $1,500 $2,000 $2,500 $3,000 $3,500 $
Slide 16: Noninterest Expense
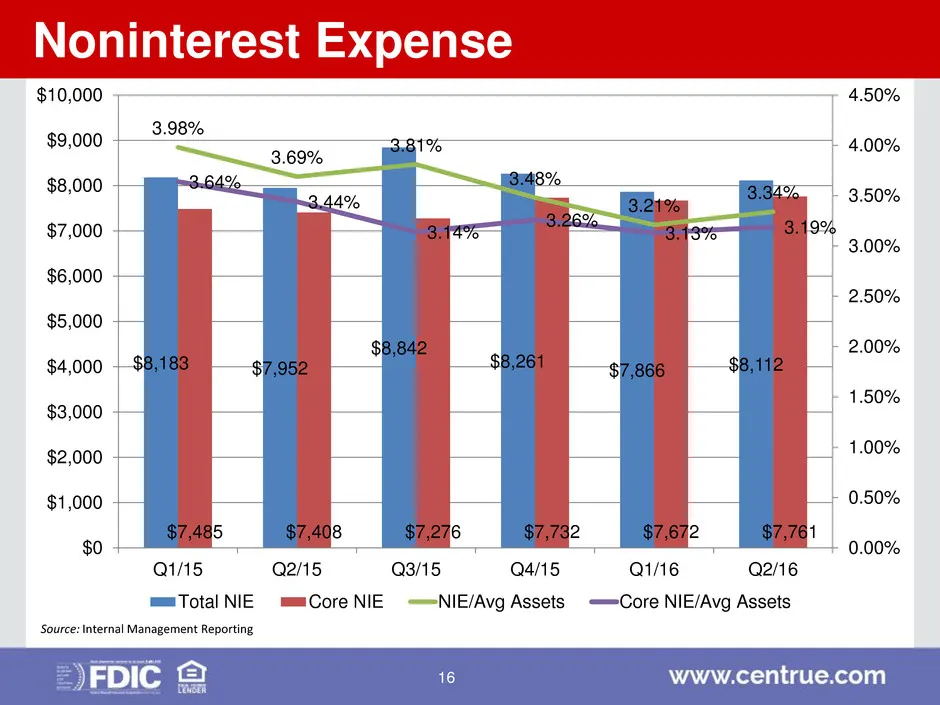
Noninterest Expense Source: Internal Management Reporting $8,183 $7,952 $8,842 $8,261 $7,866 $8,112 $7,485 $7,408 $7,276 $7,732 $7,672 $7,761 3.98% 3.69% 3.81% 3.48% 3.21% 3.34% 3.64% 3.44% 3.14% 3.26% 3.13% 3.19% 0.00% 0.50% 1.00% 1.50% 2.00% 2.50% 3.00% 3.50% 4.00% 4.50% $0 $1,000 $2,000 $3,000 $4
Slide 17: Stock Price
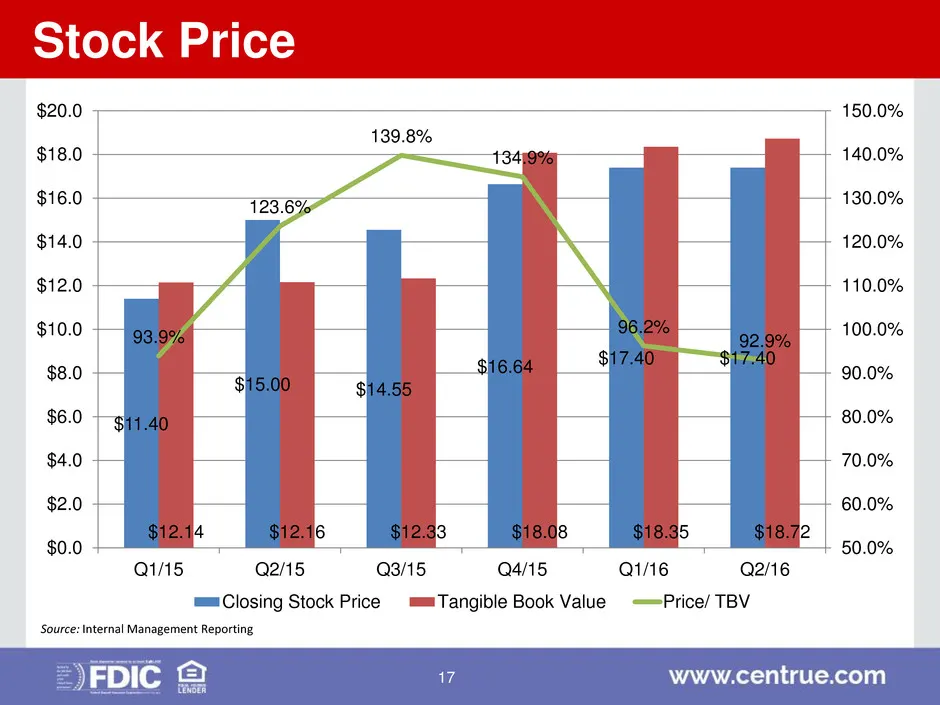
Stock Price $11.40 $15.00 $14.55 $16.64 $17.40 $17.40 $12.14 $12.16 $12.33 $18.08 $18.35 $18.72 93.9% 123.6% 139.8% 134.9% 96.2% 92.9% 50.0% 60.0% 70.0% 80.0% 90.0% 100.0% 110.0% 120.0% 130.0% 140.0% 150.0% $0.0 $2.0 $4.0 $6.0 $8.0 $10.0 $12.0 $14.0 $16.0 $18.0 $20.0 Q1/15 Q2/15 Q3/15 Q4/15 Q1/16 Q2
Slide 18: Review of Branch Footprint
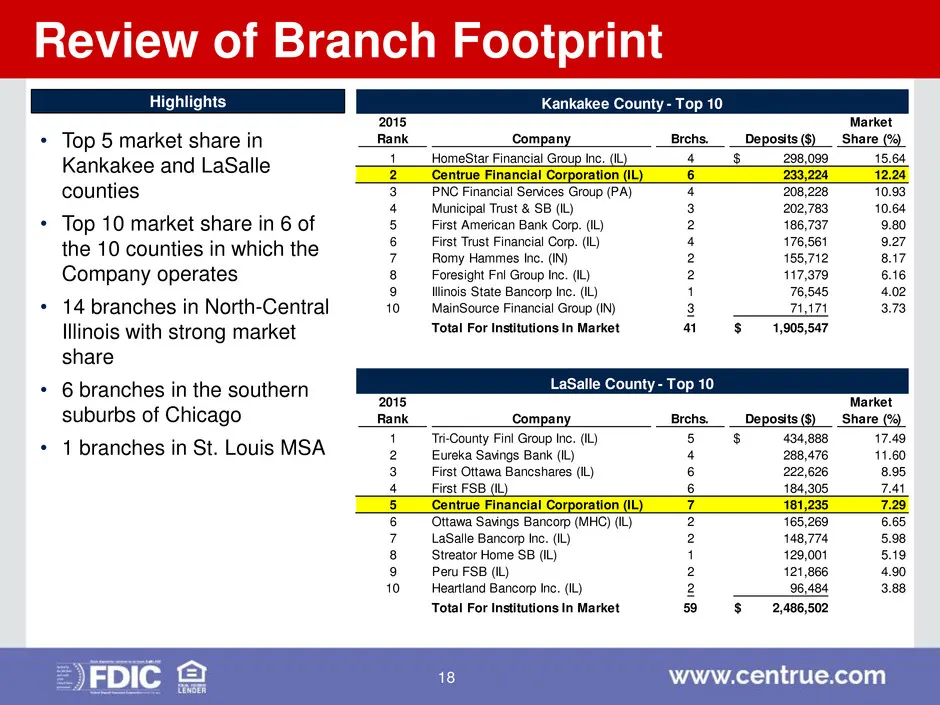
Review of Branch Footprint • Top 5 market share in Kankakee and LaSalle counties • Top 10 market share in 6 of the 10 counties in which the Company operates • 14 branches in North-Central Illinois with strong market share • 6 branches in the southern suburbs of Chicago • 1 branches in St. Louis MSA
Slide 19: Branch Franchise
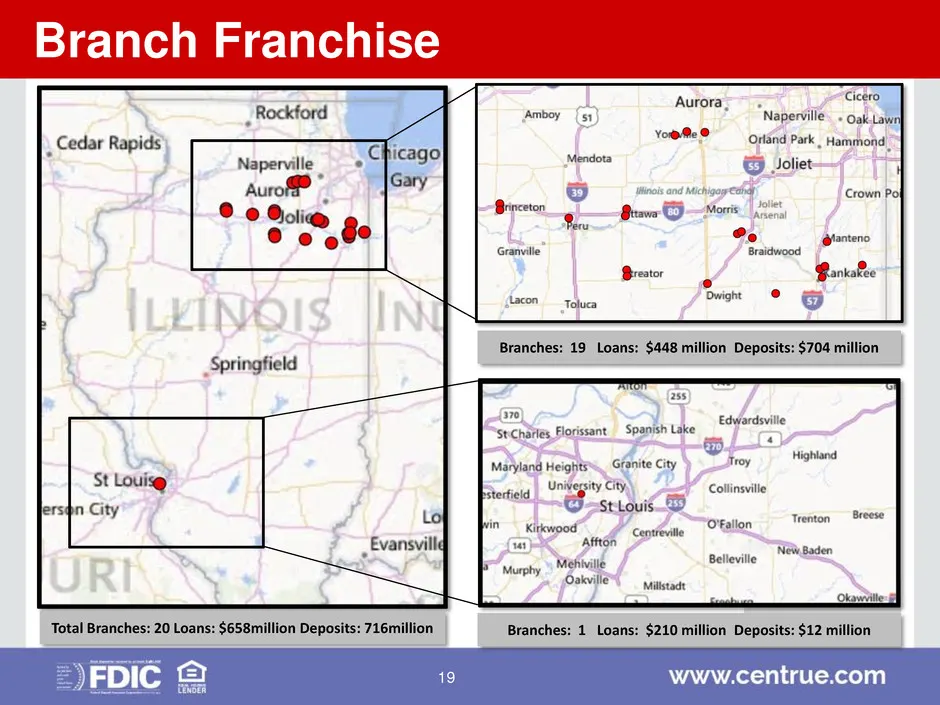
Branches: 19 Loans: $448 million Deposits: $704 million Branches: 1 Loans: $210 million Deposits: $12 million Total Branches: 20 Loans: $658million Deposits: 716million Branch Franchise 19
Slide 20: Scorecard – Previous Two Years
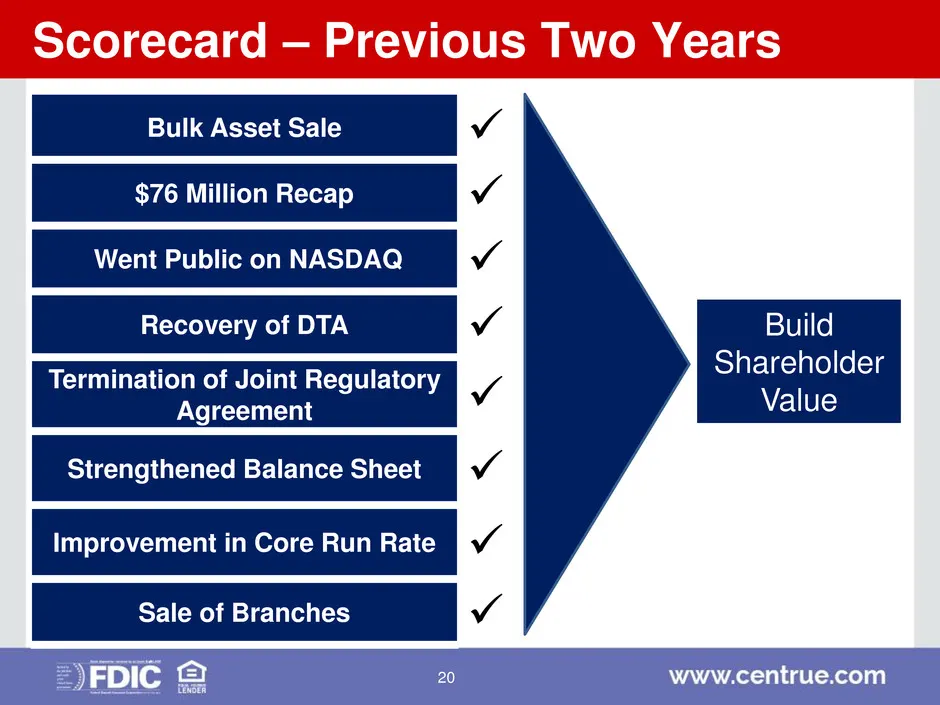
Scorecard – Previous Two Years Bulk Asset Sale $76 Million Recap Went Public on NASDAQ Recovery of DTA Termination of Joint Regulatory Agreement Strengthened Balance Sheet Improvement in Core Run Rate Sale of Branches Build Shareholder Value 20
Slide 21: Strategic Priorities
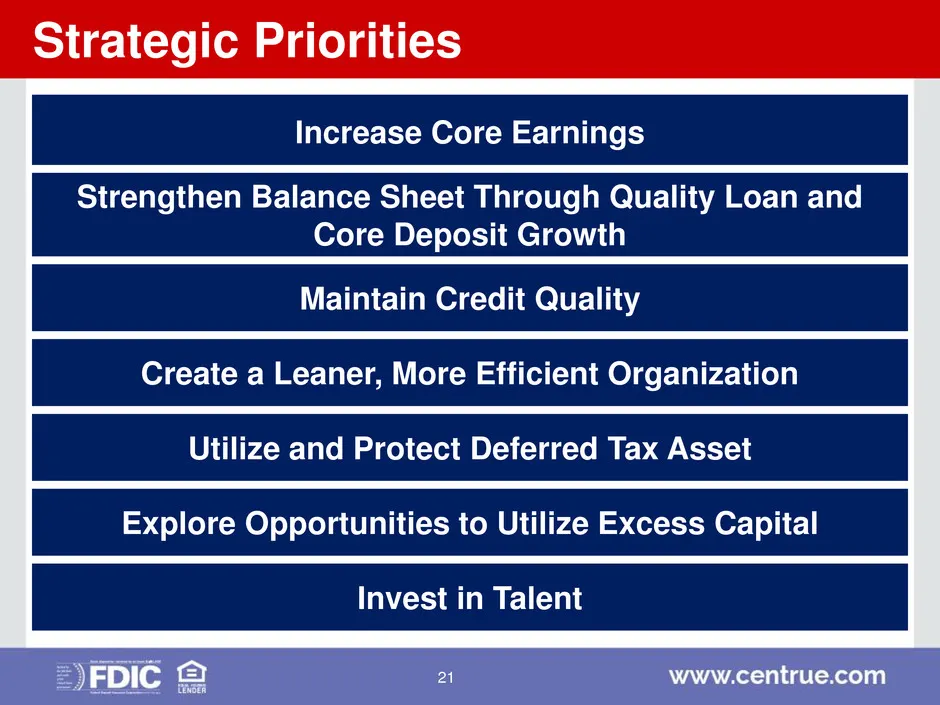
Strategic Priorities Increase Core Earnings Strengthen Balance Sheet Through Quality Loan and Core Deposit Growth Maintain Credit Quality Create a Leaner, More Efficient Organization Utilize and Protect Deferred Tax Asset Explore Opportunities to Utilize Excess Capital Invest in Talent 21
Source: SEC EDGAR · 8-K filed Jul 28, 2016