Allegiance Bancshares — Q3 2017 Earnings Presentation
15 slides from Allegiance Bancshares's earnings presentation, Oct 24, 2017
Slide 1: Third Quarter 2017 Earnings Presentation
Third Quarter 2017 Earnings Presentation
Slide 2: Safe Harbor Statement
2 Safe Harbor Statement “Safe Harbor” Statement under the Private Securities Litigation Reform Act of 1995: This presentation may contain forward-looking statements within the meaning of the securities laws that are based on various facts and derived utilizing important assumptions, present expectat
Slide 3: Allegiance Overview
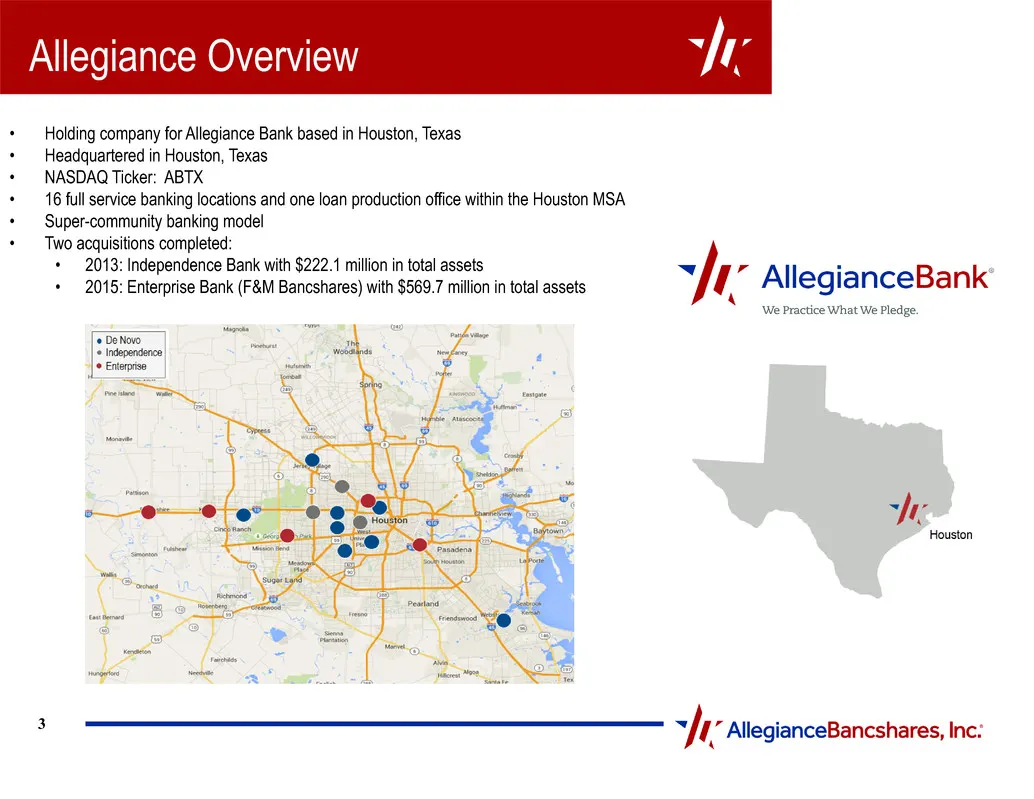
3 Allegiance Overview • Holding company for Allegiance Bank based in Houston, Texas • Headquartered in Houston, Texas • NASDAQ Ticker: ABTX • 16 full service banking locations and one loan production office within the Houston MSA • Super-community banking model • Two acquisitions completed: • 2013:
Slide 4: Our Super-community Banking Strategy
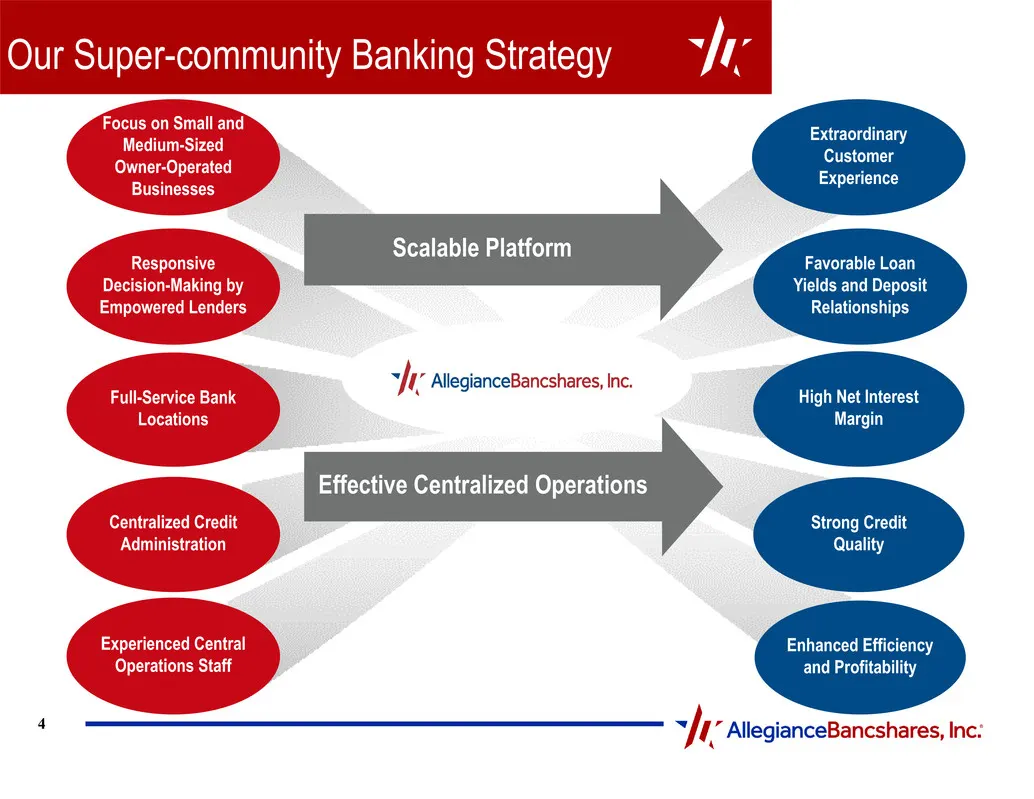
4 Our Super-community Banking Strategy Focus on Small and Medium-Sized Owner-Operated Businesses Responsive Decision-Making by Empowered Lenders Full-Service Bank Locations Centralized Credit Administration Experienced Central Operations Staff Scalable Platform Effective Centralized Operations Extra
Slide 5: Highlights - 2017
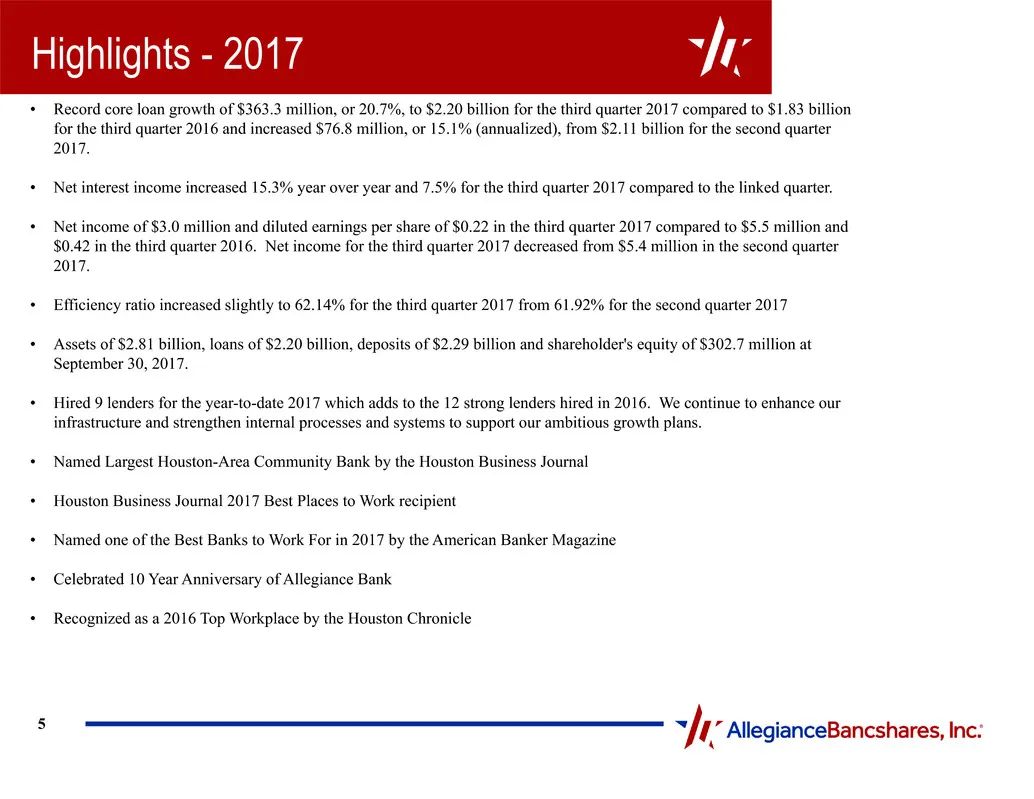
5 Highlights - 2017 • Record core loan growth of $363.3 million, or 20.7%, to $2.20 billion for the third quarter 2017 compared to $1.83 billion for the third quarter 2016 and increased $76.8 million, or 15.1% (annualized), from $2.11 billion for the second quarter 2017. • Net interest income increa
Slide 6: Net Income Growth
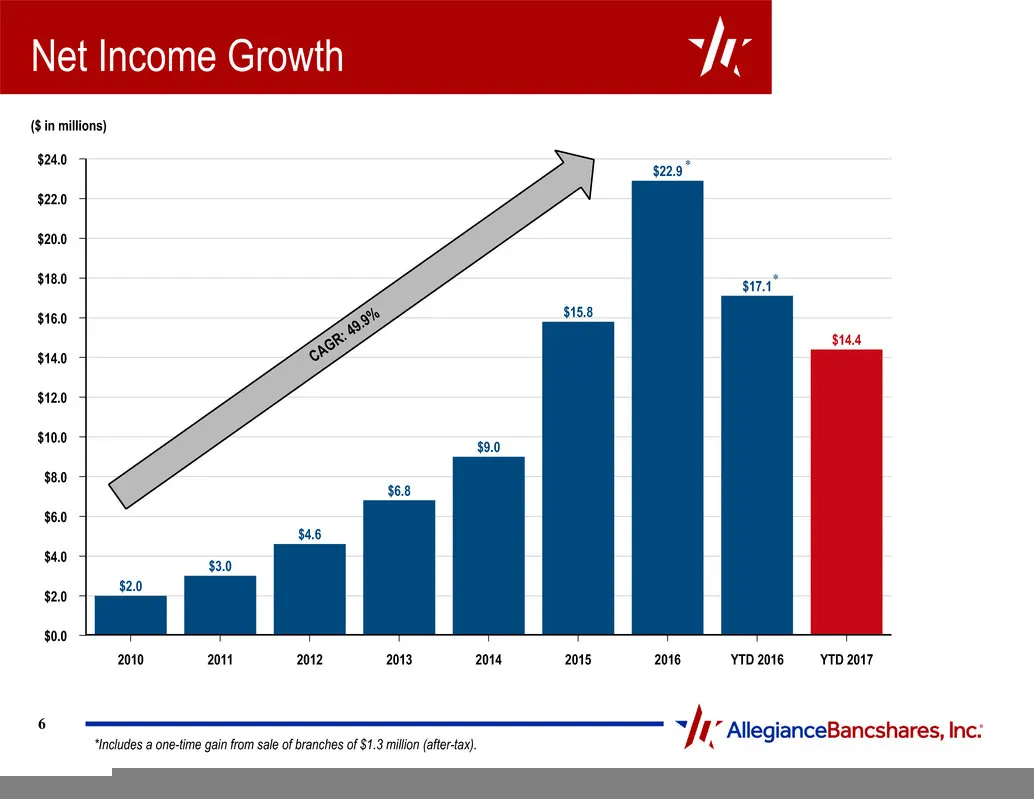
6 Net Income Growth $24.0 $22.0 $20.0 $18.0 $16.0 $14.0 $12.0 $10.0 $8.0 $6.0 $4.0 $2.0 $0.0 2010 2011 2012 2013 2014 2015 2016 YTD 2016 YTD 2017 $2.0 $3.0 $4.6 $6.8 $9.0 $15.8 $22.9 $17.1 $14.4 ($ in millions) CAGR: 49.9 % *Includes a one-time gain from sale of branches of $1.3 million (after-tax).
Slide 7: Diluted EPS Growth
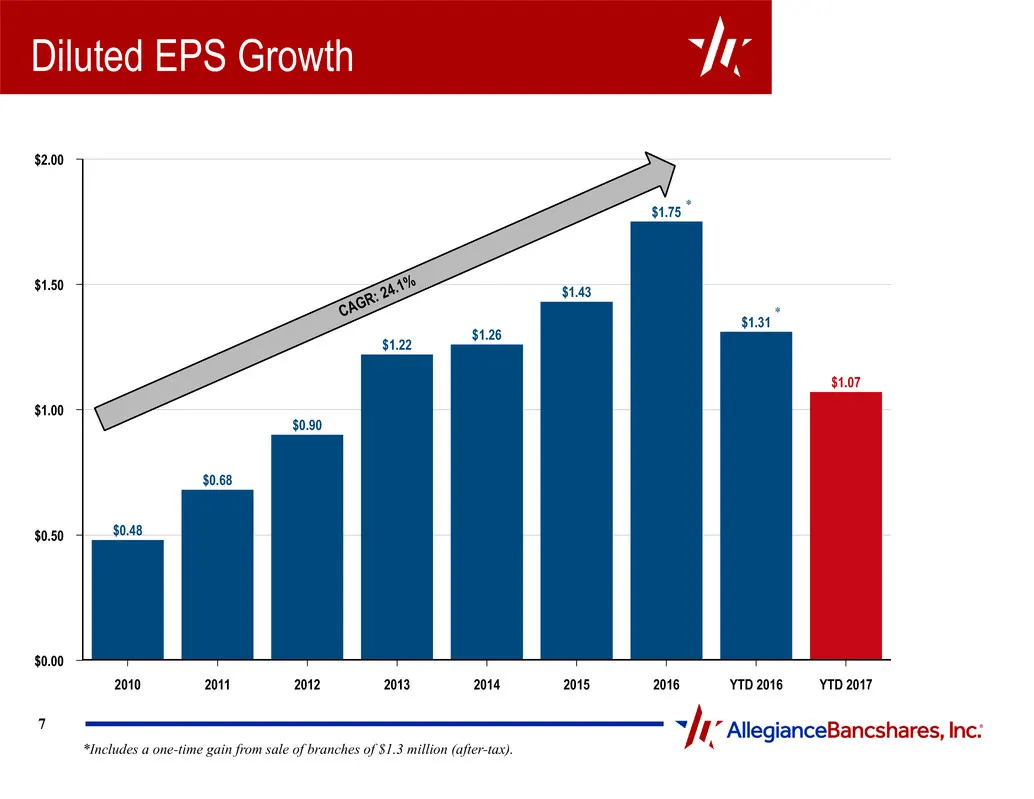
7 Diluted EPS Growth $2.00 $1.50 $1.00 $0.50 $0.00 2010 2011 2012 2013 2014 2015 2016 YTD 2016 YTD 2017 $0.48 $0.68 $0.90 $1.22 $1.26 $1.43 $1.75 $1.31 $1.07 *Includes a one-time gain from sale of branches of $1.3 million (after-tax). CAGR: 24.1 % * * *
Slide 8: Net Interest Income and Margin
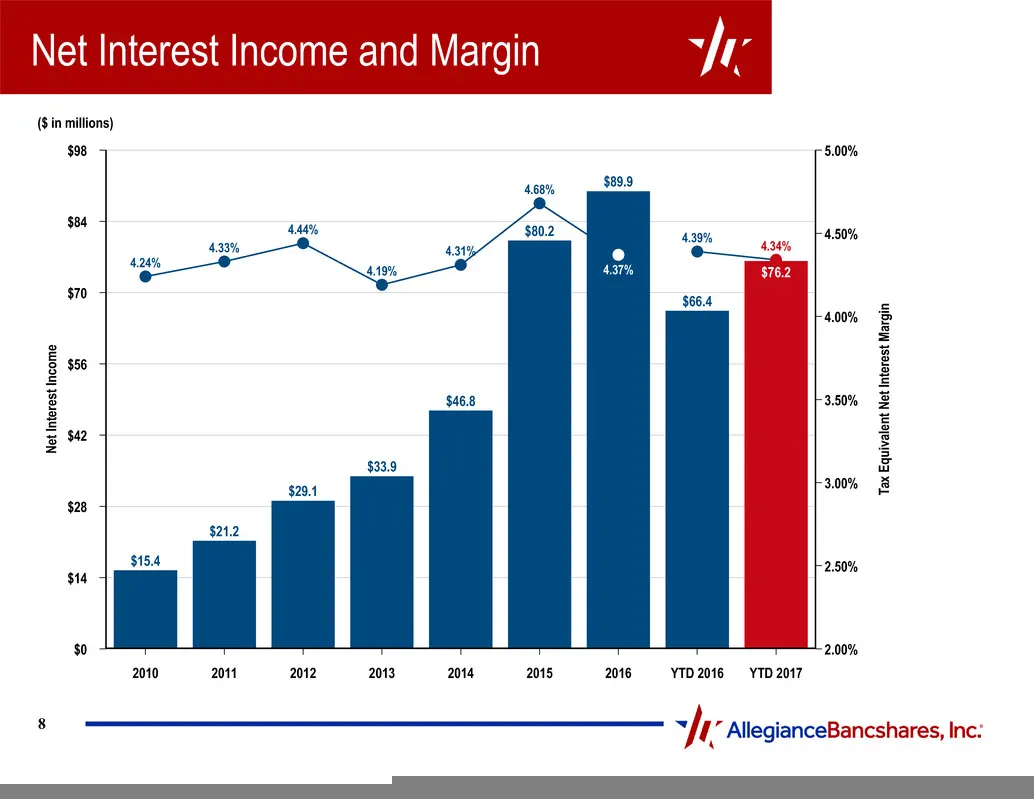
8 $98 $84 $70 $56 $42 $28 $14 $0 Ne tI nt er es tI nc om e 5.00% 4.50% 4.00% 3.50% 3.00% 2.50% 2.00% Ta xE qu iva len tN et In te re st Ma rg in 2010 2011 2012 2013 2014 2015 2016 YTD 2016 YTD 2017 $15.4 $21.2 $29.1 $33.9 $46.8 $80.2 $89.9 $66.4 $76.24.24% 4.33% 4.44% 4.19% 4.31% 4.68% 4.37% 4.39% 4
Slide 9: Performance Metrics
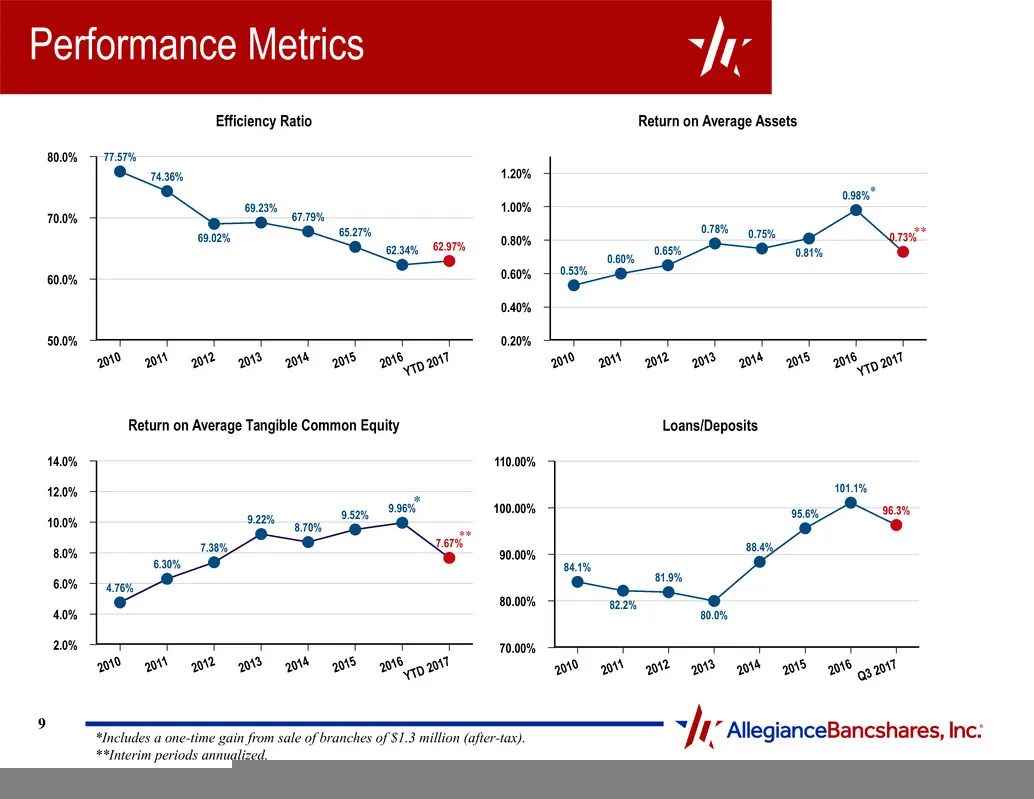
9 Performance Metrics Efficiency Ratio 80.0% 70.0% 60.0% 50.0% 2010 2011 2012 2013 2014 2015 2016 YTD 2 017 77.57% 74.36% 69.02% 69.23% 67.79% 65.27% 62.34% 62.97% Return on Average Assets 1.20% 1.00% 0.80% 0.60% 0.40% 0.20% 2010 2011 2012 2013 2014 2015 2016 YTD 2 017 0.53% 0.60% 0.65% 0.78% 0.75%
Slide 10: Balance Sheet Growth
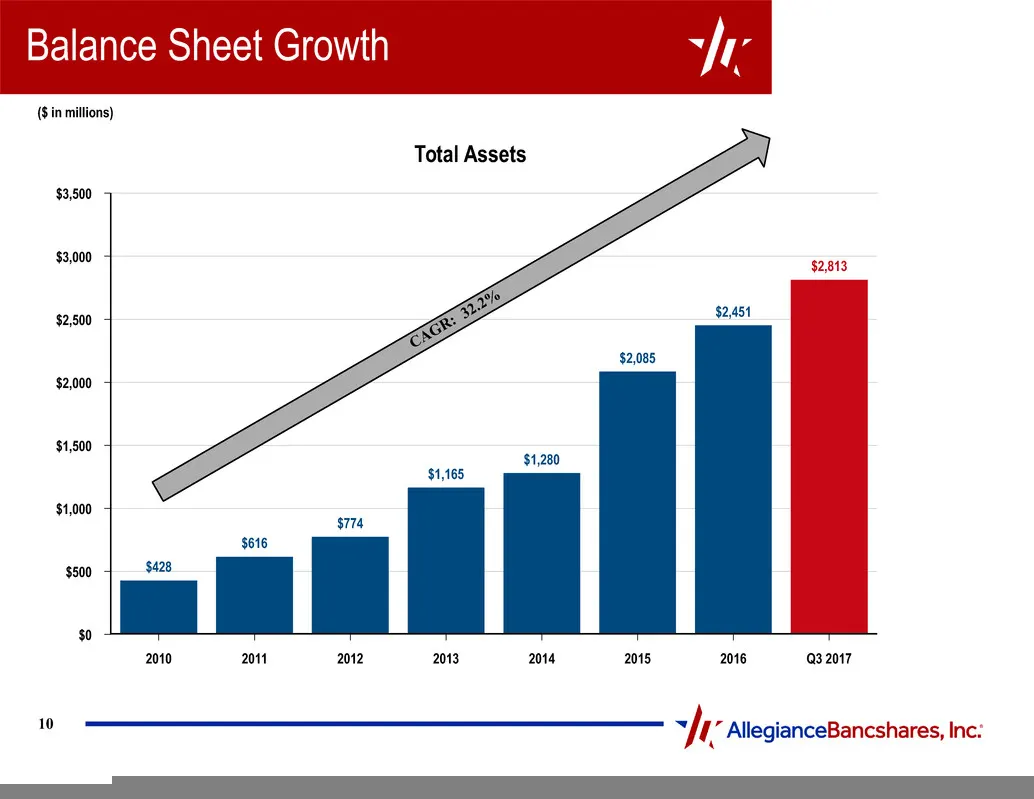
10 ($ in millions) Balance Sheet Growth Total Assets $3,500 $3,000 $2,500 $2,000 $1,500 $1,000 $500 $0 2010 2011 2012 2013 2014 2015 2016 Q3 2017 $428 $616 $774 $1,165 $1,280 $2,085 $2,451 $2,813 CAGR: 32.2 %
Slide 11: Loan Growth
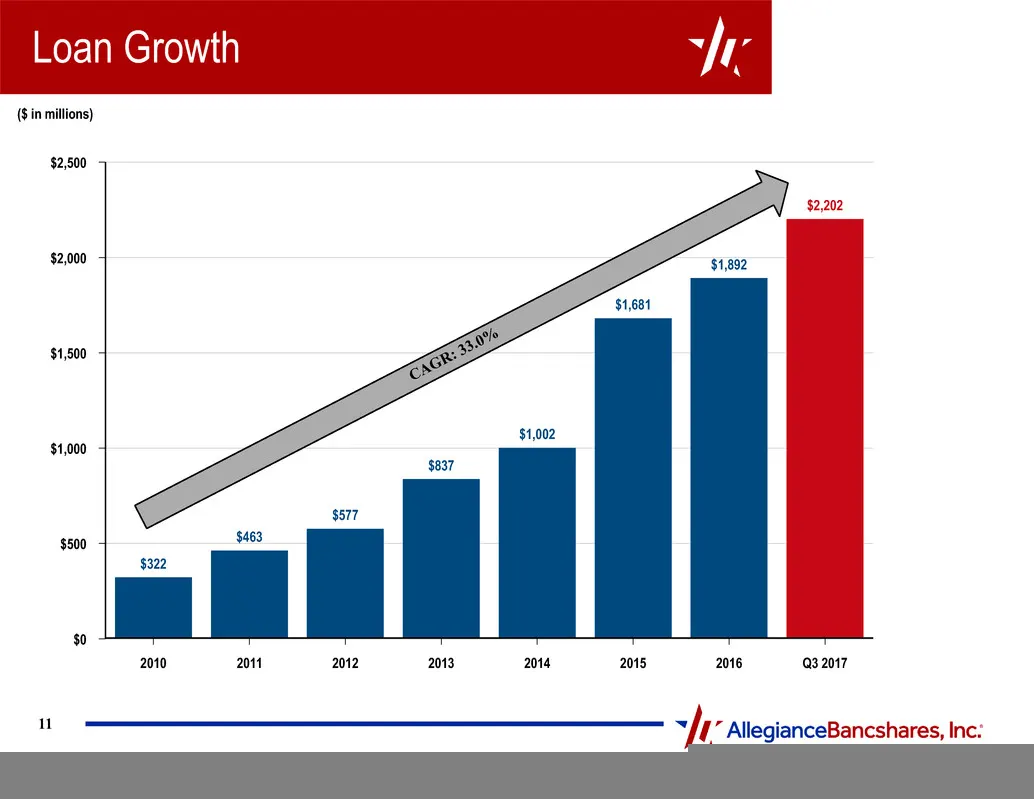
11 Loan Growth $2,500 $2,000 $1,500 $1,000 $500 $0 2010 2011 2012 2013 2014 2015 2016 Q3 2017 $322 $463 $577 $837 $1,002 $1,681 $1,892 $2,202 CAGR: 33.0 % ($ in millions)
Slide 12: Loan Portfolio Composition
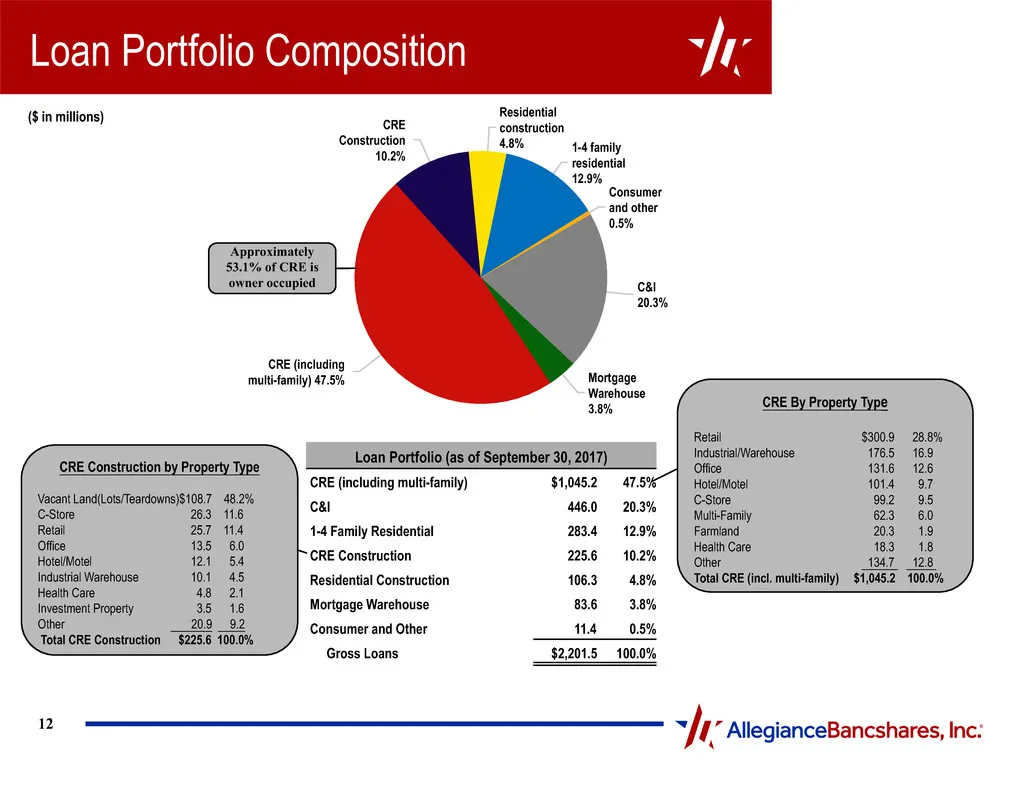
12 Loan Portfolio Composition Loan Portfolio (as of September 30, 2017) CRE (including multi-family) $1,045.2 47.5% C&I 446.0 20.3% 1-4 Family Residential 283.4 12.9% CRE Construction 225.6 10.2% Residential Construction 106.3 4.8% Mortgage Warehouse 83.6 3.8% Consumer and Other 11.4 0.5% Gross Loan
Slide 13: Deposit Growth and Composition
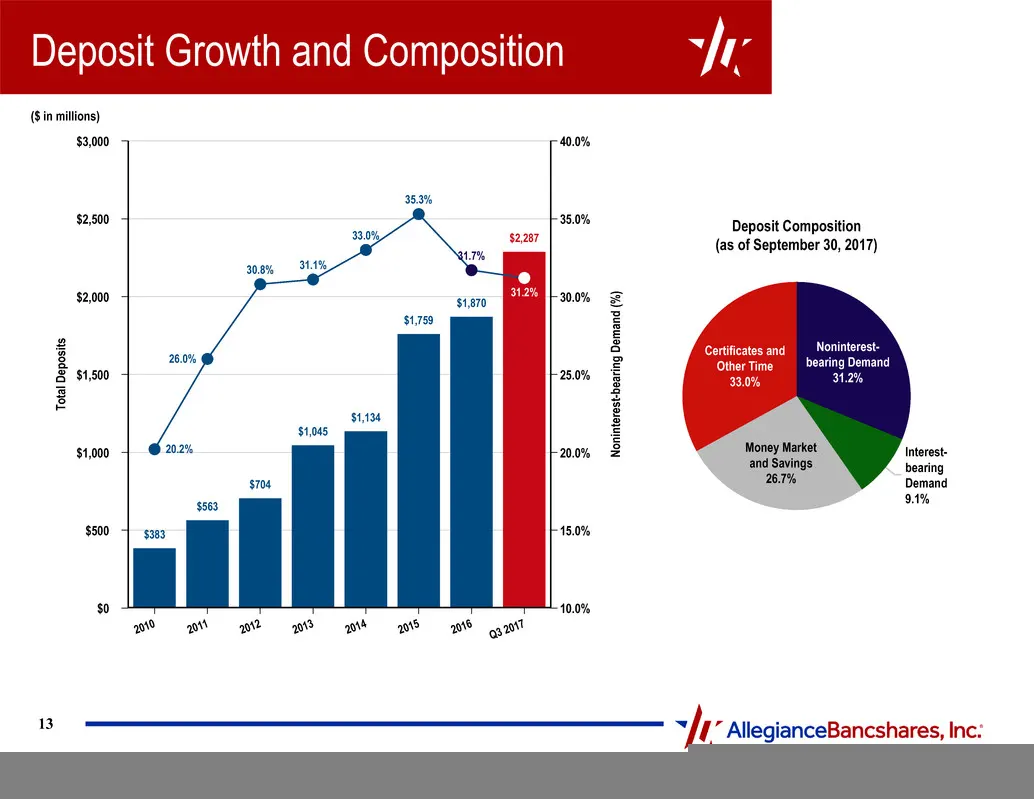
13 Deposit Growth and Composition Deposit Composition (as of September 30, 2017) Noninterest- bearing Demand 31.2% Interest- bearing Demand 9.1% Money Market and Savings 26.7% Certificates and Other Time 33.0% $3,000 $2,500 $2,000 $1,500 $1,000 $500 $0 To ta lD ep os its 40.0% 35.0% 30.0% 25.0% 20.0
Slide 14: Strong Credit Quality
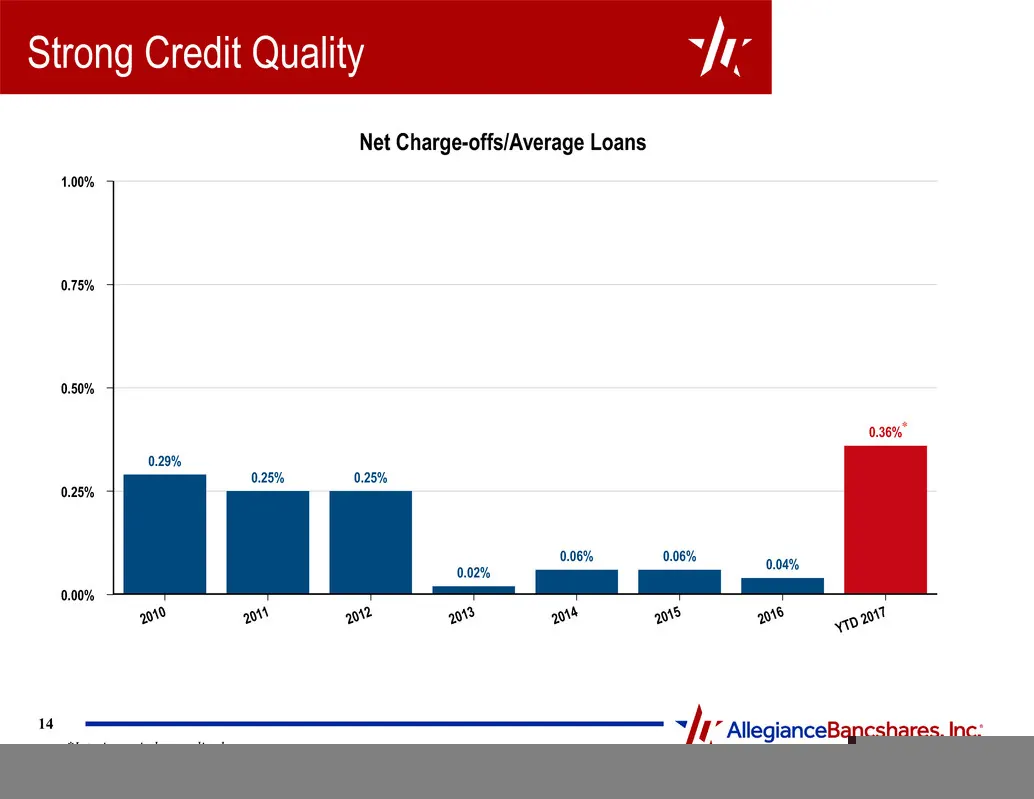
14 Strong Credit Quality Net Charge-offs/Average Loans 1.00% 0.75% 0.50% 0.25% 0.00% 2010 2011 2012 2013 2014 2015 2016 YTD 2 017 0.29% 0.25% 0.25% 0.02% 0.06% 0.06% 0.04% 0.36% * *Interim period annualized. *
Slide 15: Corporate Office and Investor Relations
Corporate Office 8847 West Sam Houston Parkway North, Suite 200 Houston, Texas 77040 Investor Relations I ir@allegiancebank.com
Source: SEC EDGAR · 8-K filed Oct 24, 2017
More decks from Allegiance Bancshares Inc
 Q2 2022 Earnings Presentation16 slides · Jul 29, 2022
 Q1 2022 Earnings Presentation19 slides · Apr 28, 2022
 FY2021 Earnings Presentation18 slides · Jan 28, 2022
 Q4 2021 Earnings Presentation19 slides · Jan 28, 2022
 Merger or Acquisition (November 2021)28 slides · Nov 8, 2021
 Q3 2021 Earnings Presentation17 slides · Oct 28, 2021