Acadian Asset Management Inc. · NYSE:AAMI
Acadian Asset Management — Q1 2023 Earnings Presentation
30 slides from Acadian Asset Management's earnings presentation, May 4, 2023
Slide 1: Q1 2023 Earnings Presentation
Q1 2023 EARNINGS PRESENTATION May 4, 2023 4
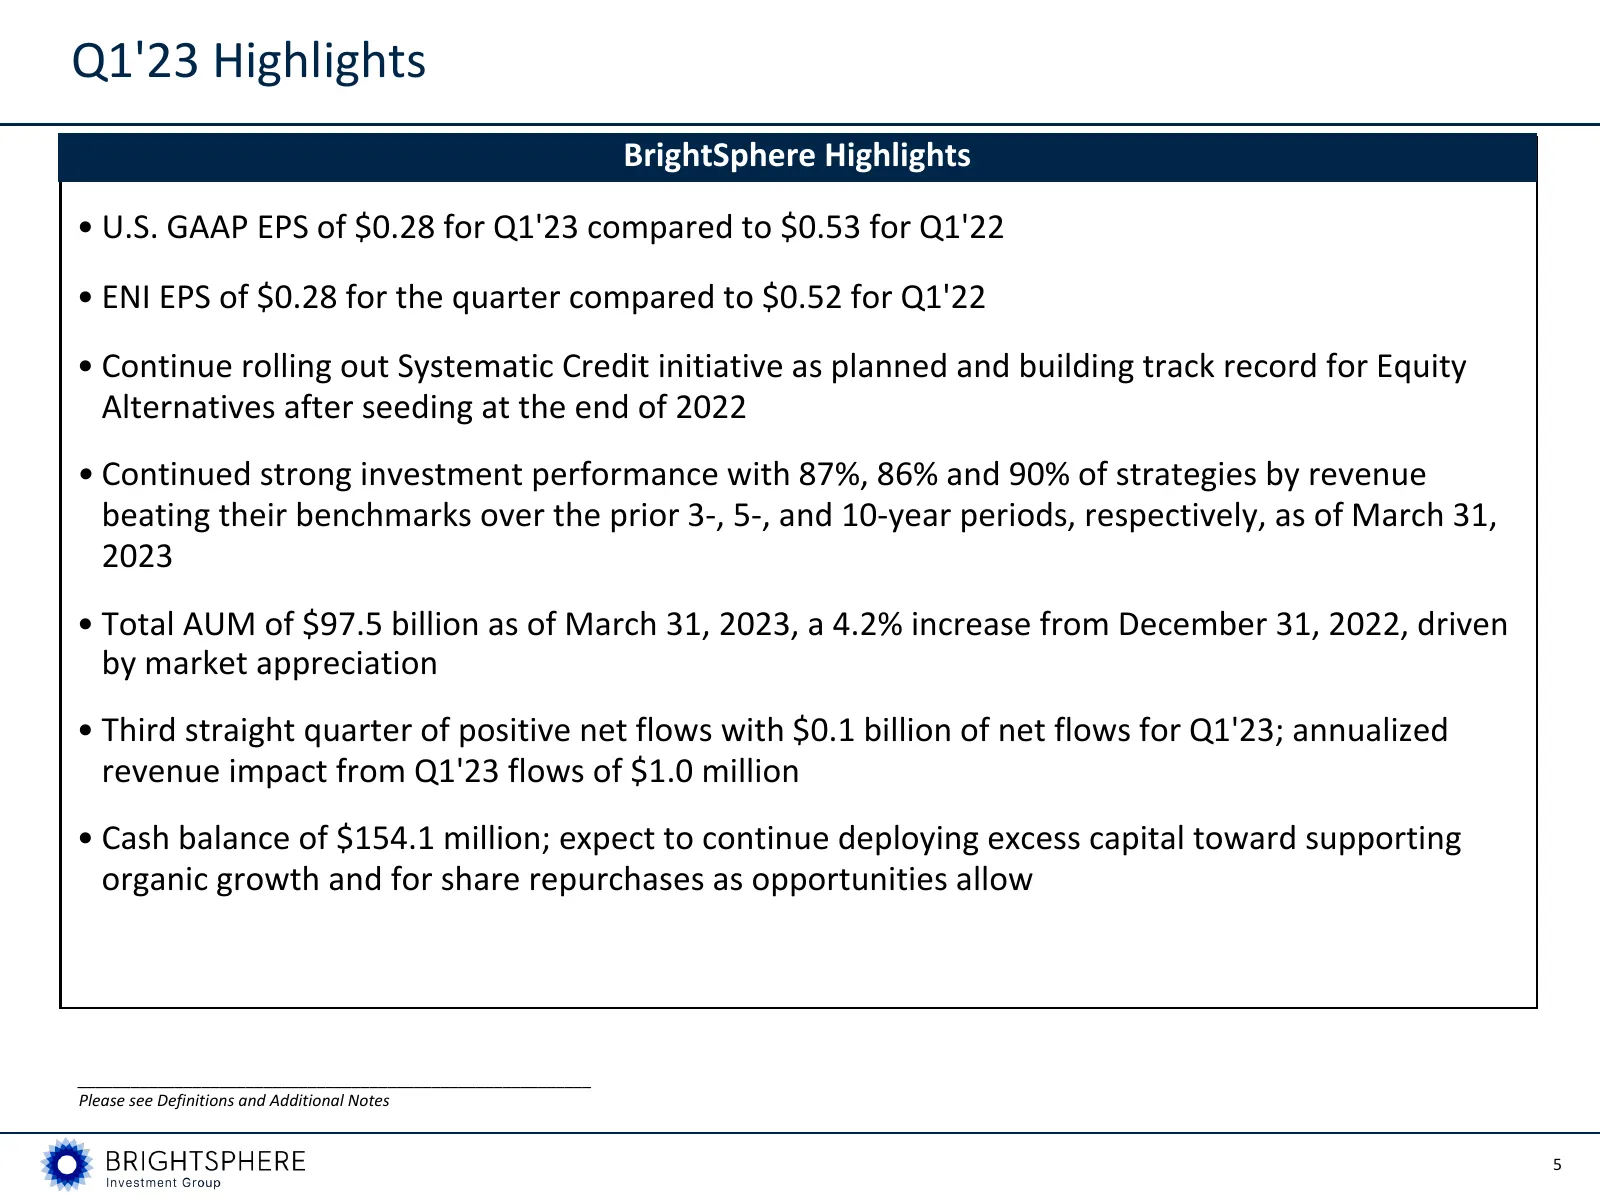
Slide 2: Q1'23 Highlights
Q1'23 Highlights BrightSphere Highlights • U.S. GAAP EPS of $0.28 for Q1'23 compared to $0.53 for Q1'22 • ENI EPS of $0.28 for the quarter compared to $0.52 for Q1'22 • Continue rolling out Systematic Credit initiative as planned and building track record for Equity Alternatives after seeding at the
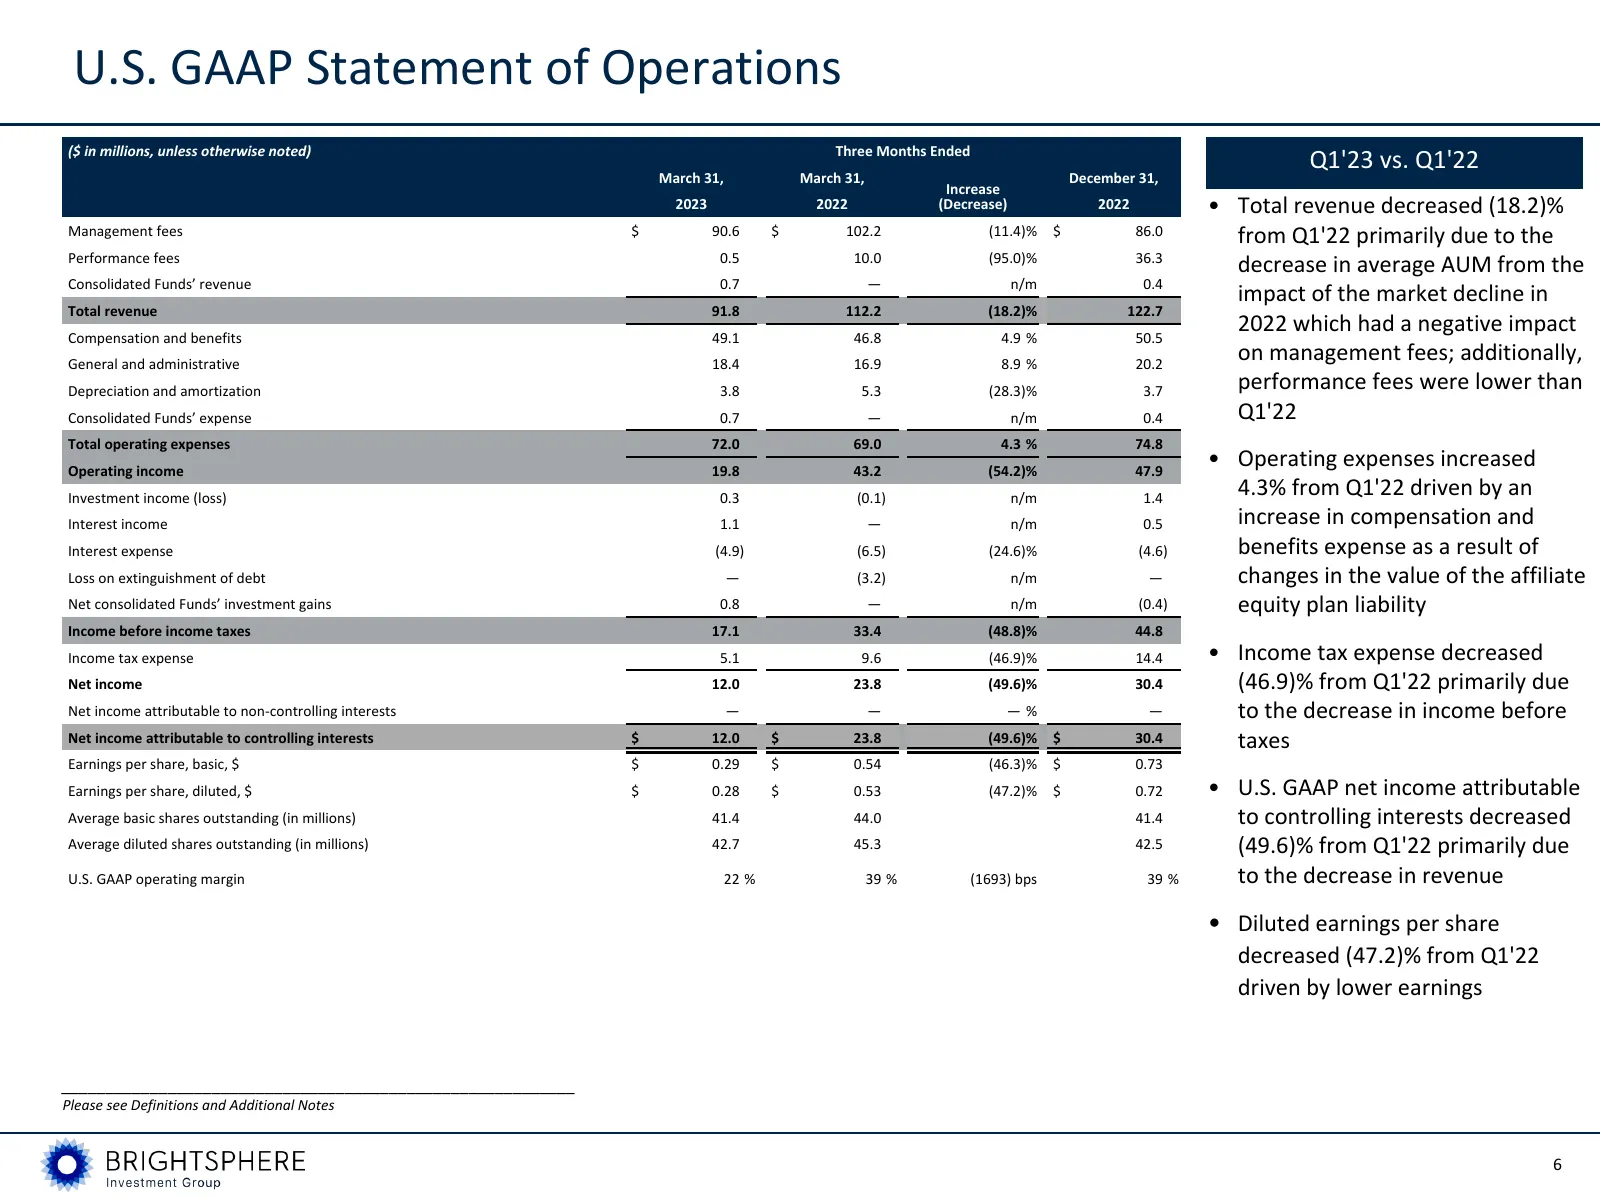
Slide 3: U.S. GAAP Statement of Operations
U.S. GAAP Statement of Operations ($ in millions, unless otherwise noted) Three Months Ended Q1'23 vs. Q1'22 March 31, March 31, December 31, Increase 2023 2022 (Decrease) 2022 • Total revenue decreased (18.2)% Management fees $ 90.6 $ 102.2 (11.4)% $ 86.0 from Q1'22 primarily due to the Performance
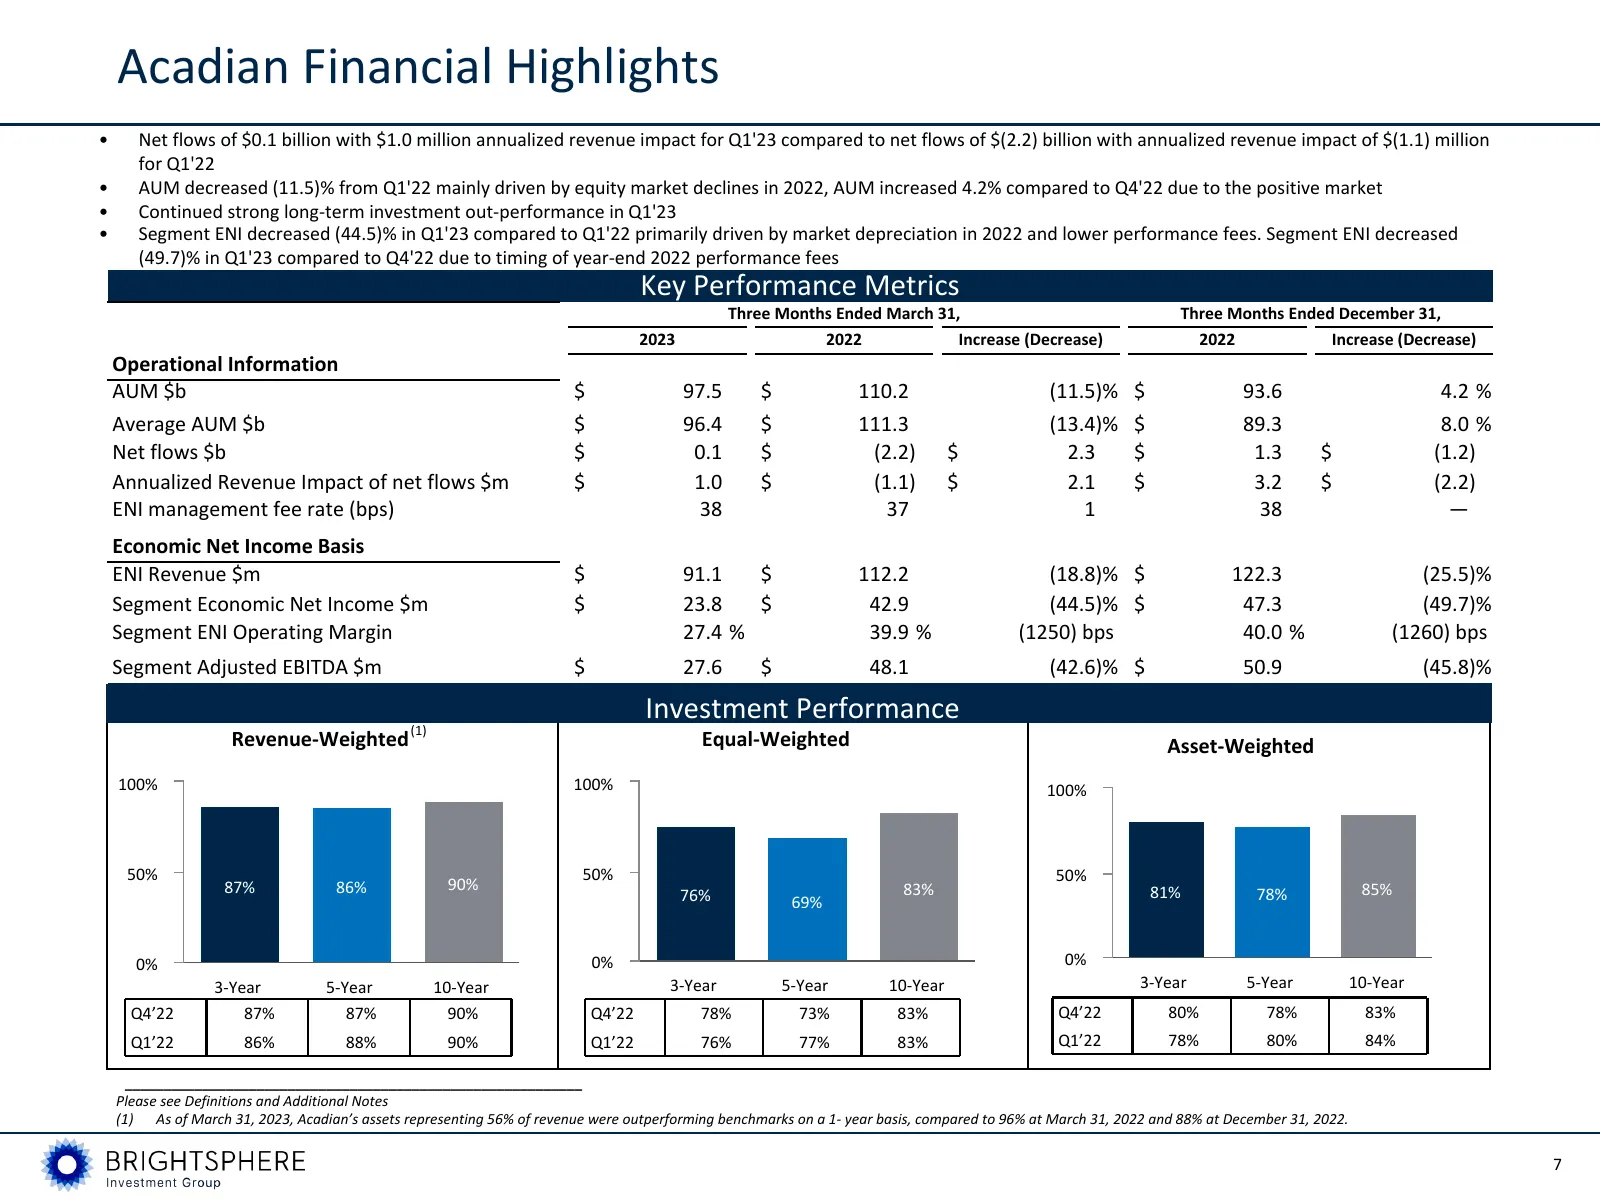
Slide 4: Acadian Financial Highlights
Acadian Financial Highlights • Net flows of $0.1 billion with $1.0 million annualized revenue impact for Q1'23 compared to net flows of $(2.2) billion with annualized revenue impact of $(1.1) million for Q1'22 • AUM decreased (11.5)% from Q1'22 mainly driven by equity market declines in 2022, AUM in
Slide 5: Acadian Platform Overview
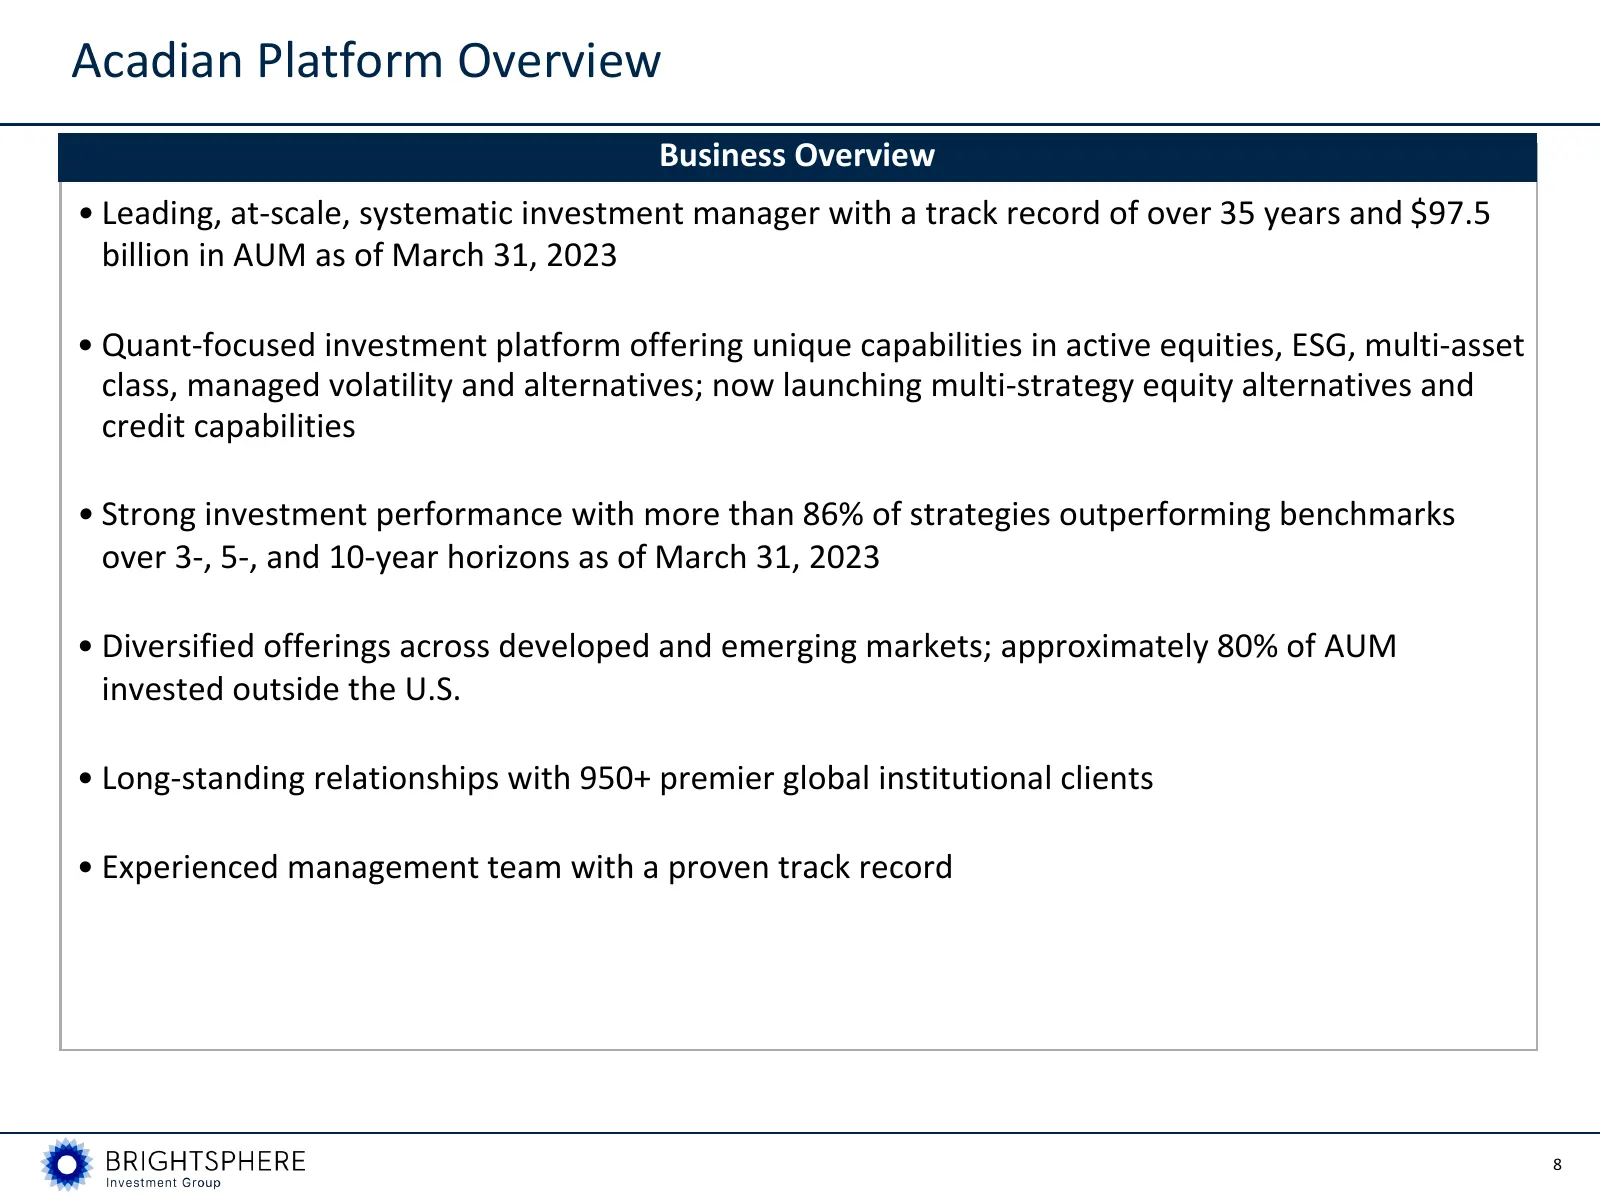
Acadian Platform Overview Business Overview • Leading, at-scale, systematic investment manager with a track record of over 35 years and $97.5 billion in AUM as of March 31, 2023 • Quant-focused investment platform offering unique capabilities in active equities, ESG, multi-asset class, managed volat
Slide 6: Systematic Investing Capabilities Built On
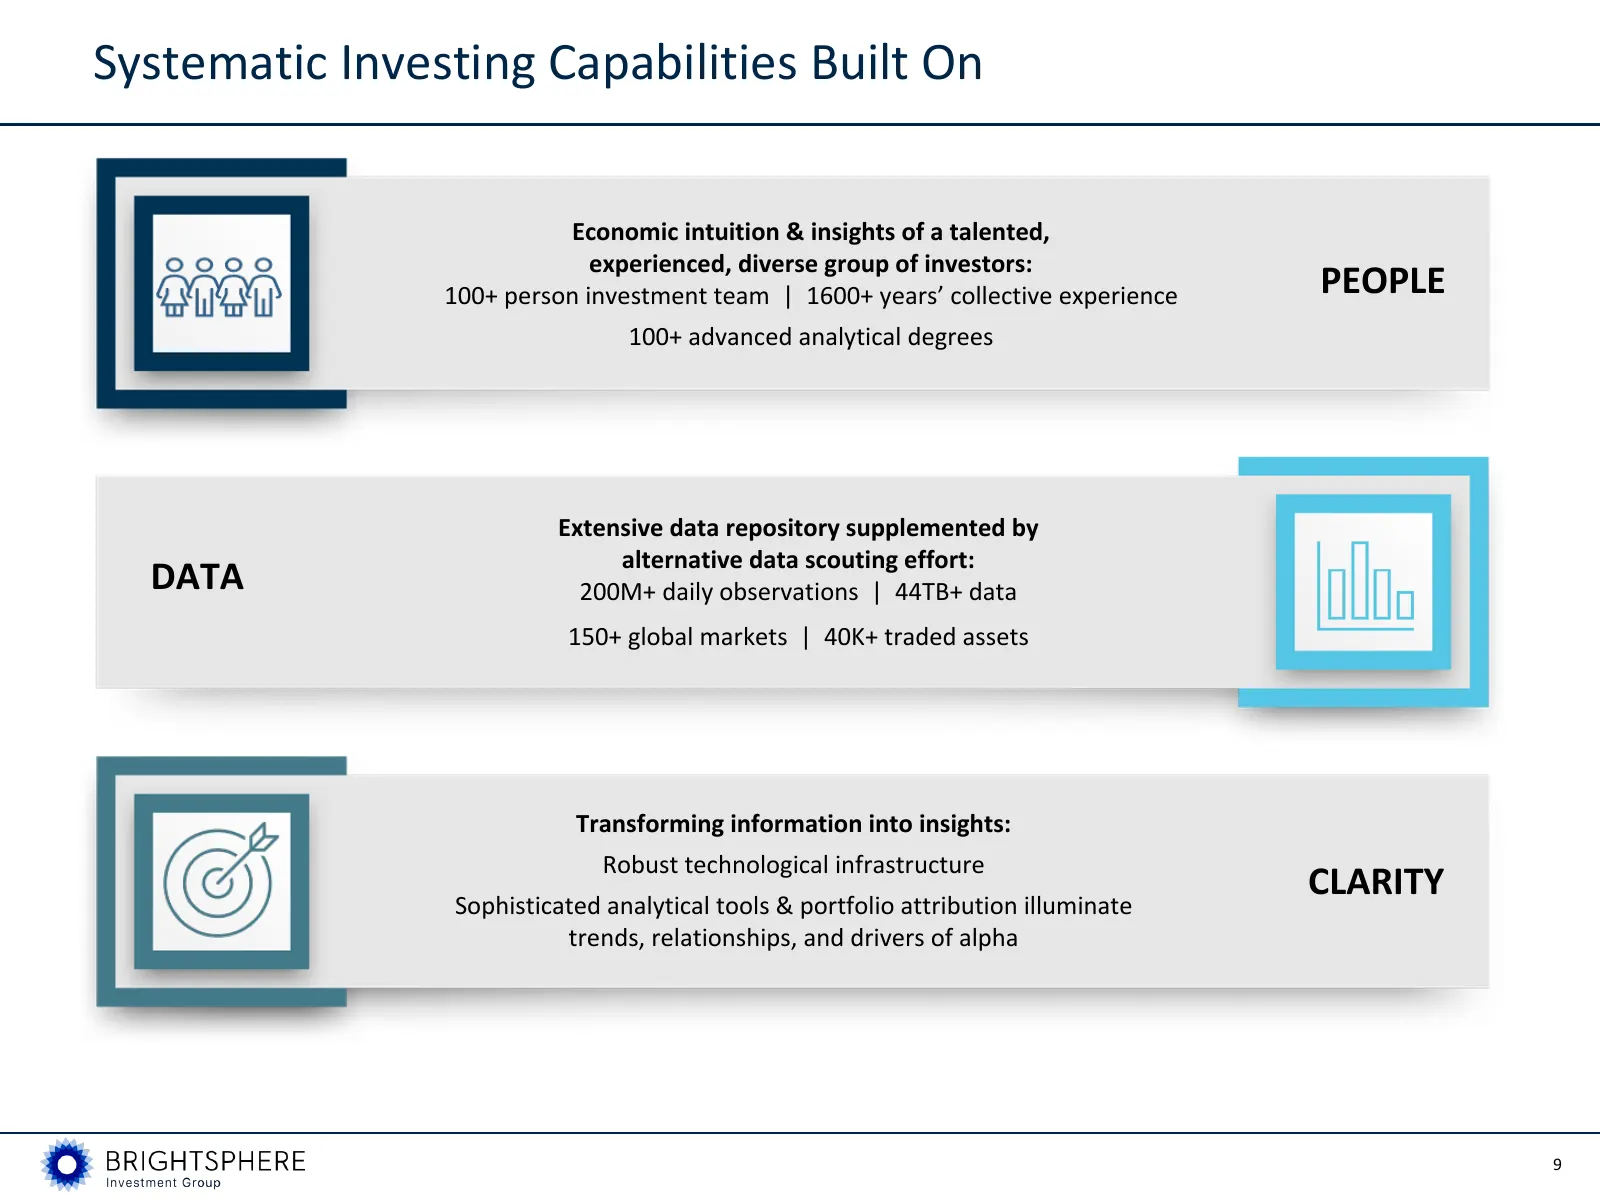
Systematic Investing Capabilities Built On Economic intuition & insights of a talented, experienced, diverse group of investors: 100+ person investment team | 1600+ years’ collective experience PEOPLE 100+ advanced analytical degrees Extensive data repository supplemented by alternative data scoutin
Slide 7: Diversified Asset Base
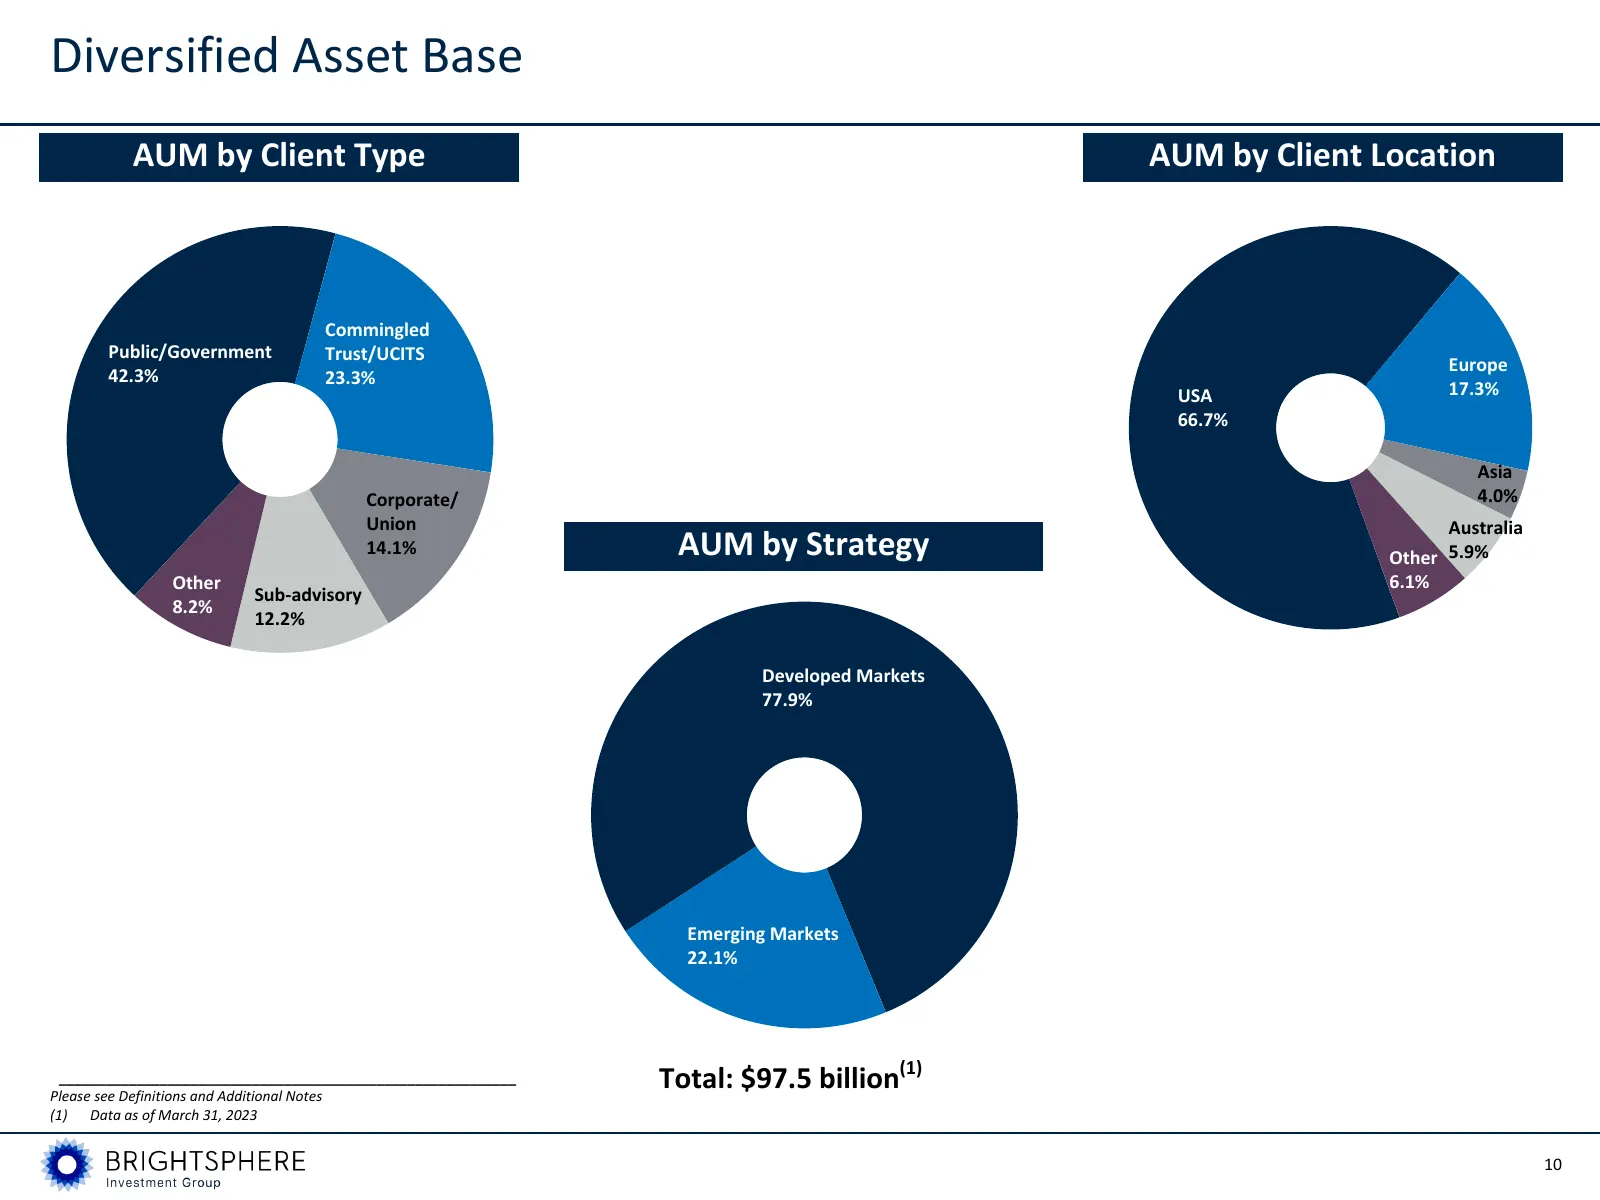
Diversified Asset Base AUM by Client Type AUM by Client Location Commingled Public/Government Trust/UCITS Europe 42.3% 23.3% USA 17.3% 66.7% Asia Corporate/ 4.0% Union Australia 14.1% AUM by Strategy Other 5.9% Other 6.1% Sub-advisory 8.2% 12.2% Developed Markets 77.9% Emerging Markets 22.1% _______
Slide 8: Systematic Investment Capabilities
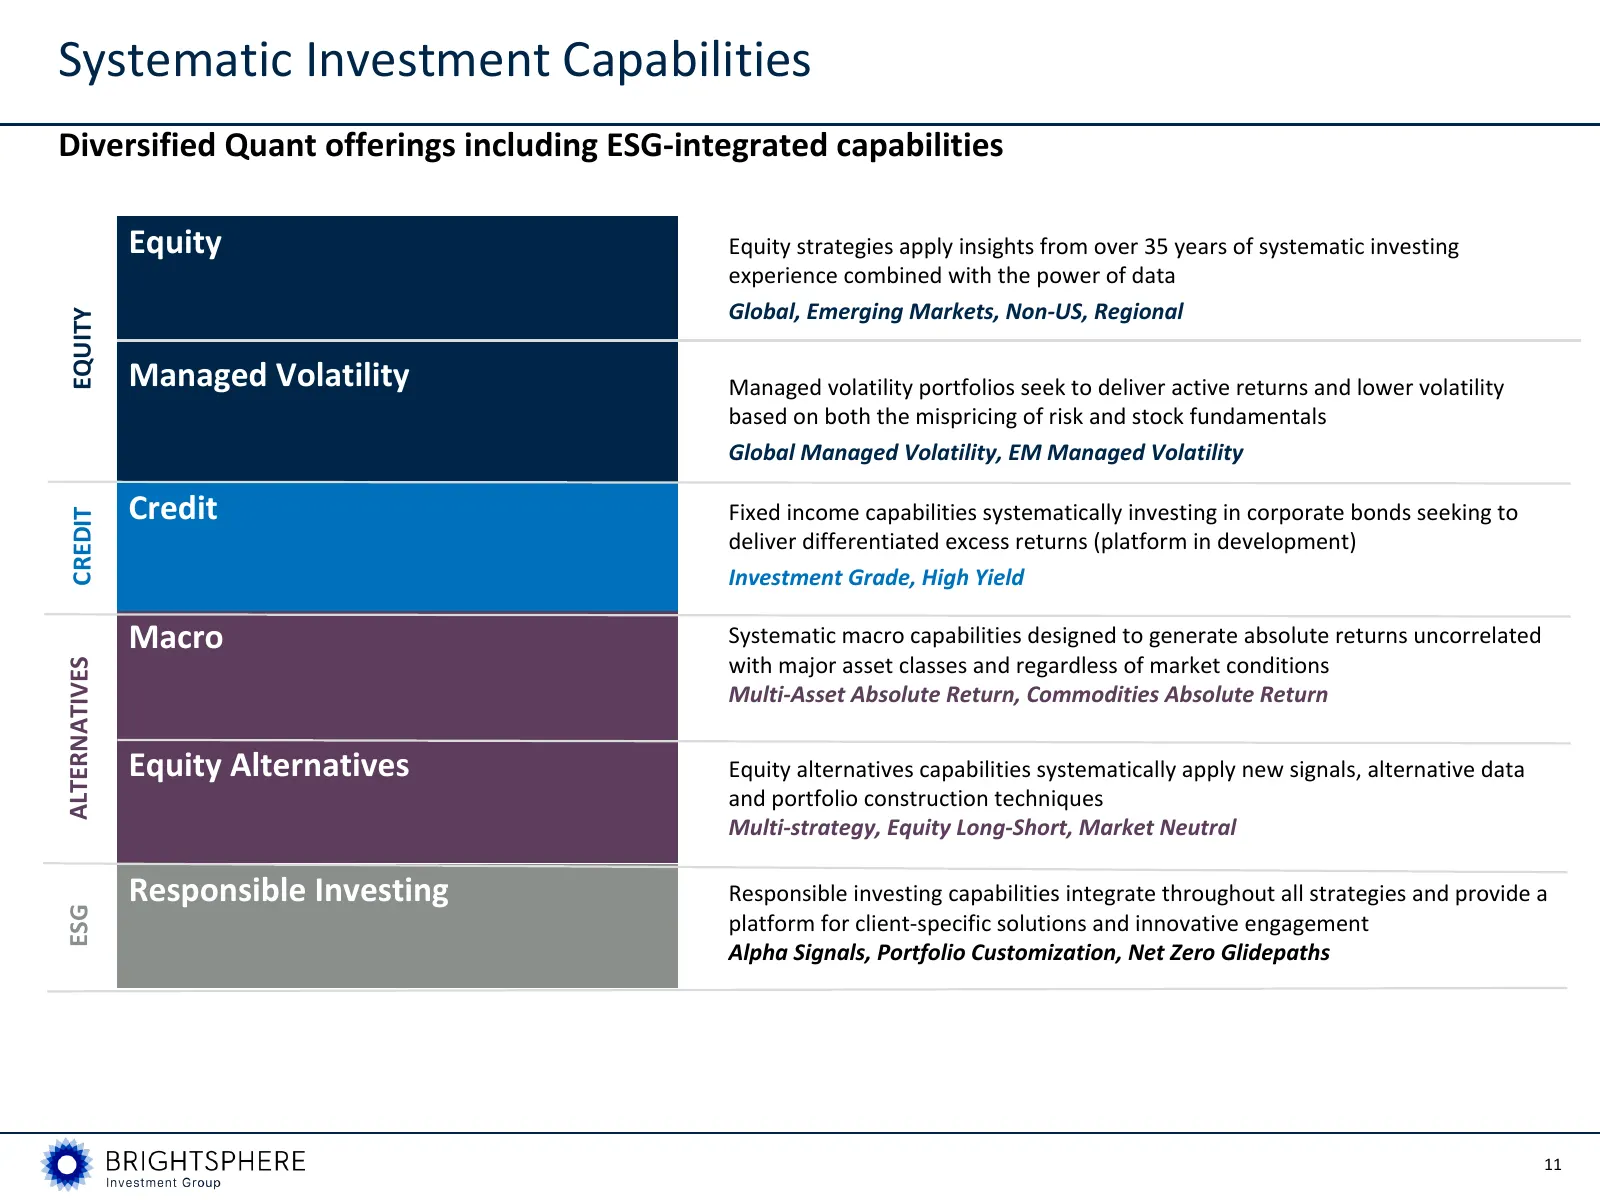
Systematic Investment Capabilities Diversified Quant offerings including ESG-integrated capabilities Equity Equity strategies apply insights from over 35 years of systematic investing experience combined with the power of data Global, Emerging Markets, Non-US, Regional EQUITY Managed Volatility Mana
Slide 9: Sector Tailwinds Expected to Support Organic Long-term Growth
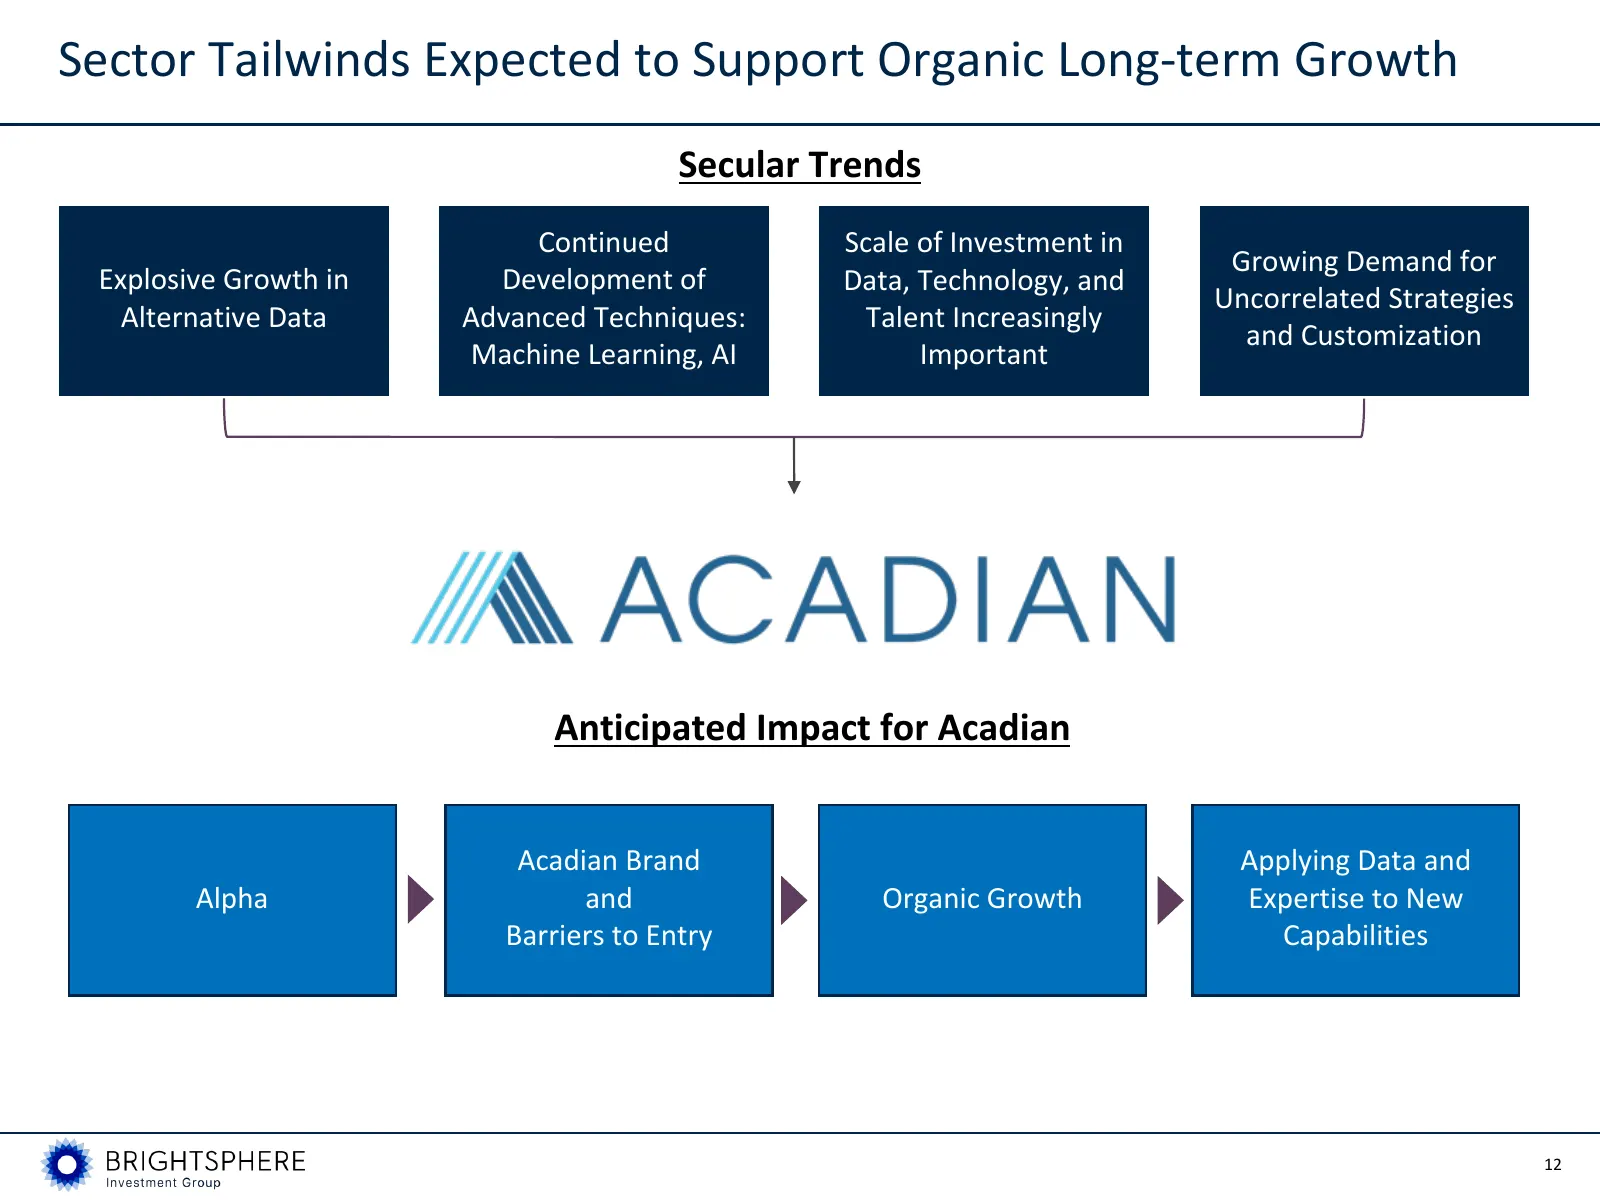
Sector Tailwinds Expected to Support Organic Long-term Growth Secular Trends Continued Scale of Investment in Growing Demand for Explosive Growth in Development of Data, Technology, and Uncorrelated Strategies Alternative Data Advanced Techniques: Talent Increasingly and Customization Machine Learni
Slide 10: Acadian's Recent and Ongoing Growth Initiatives
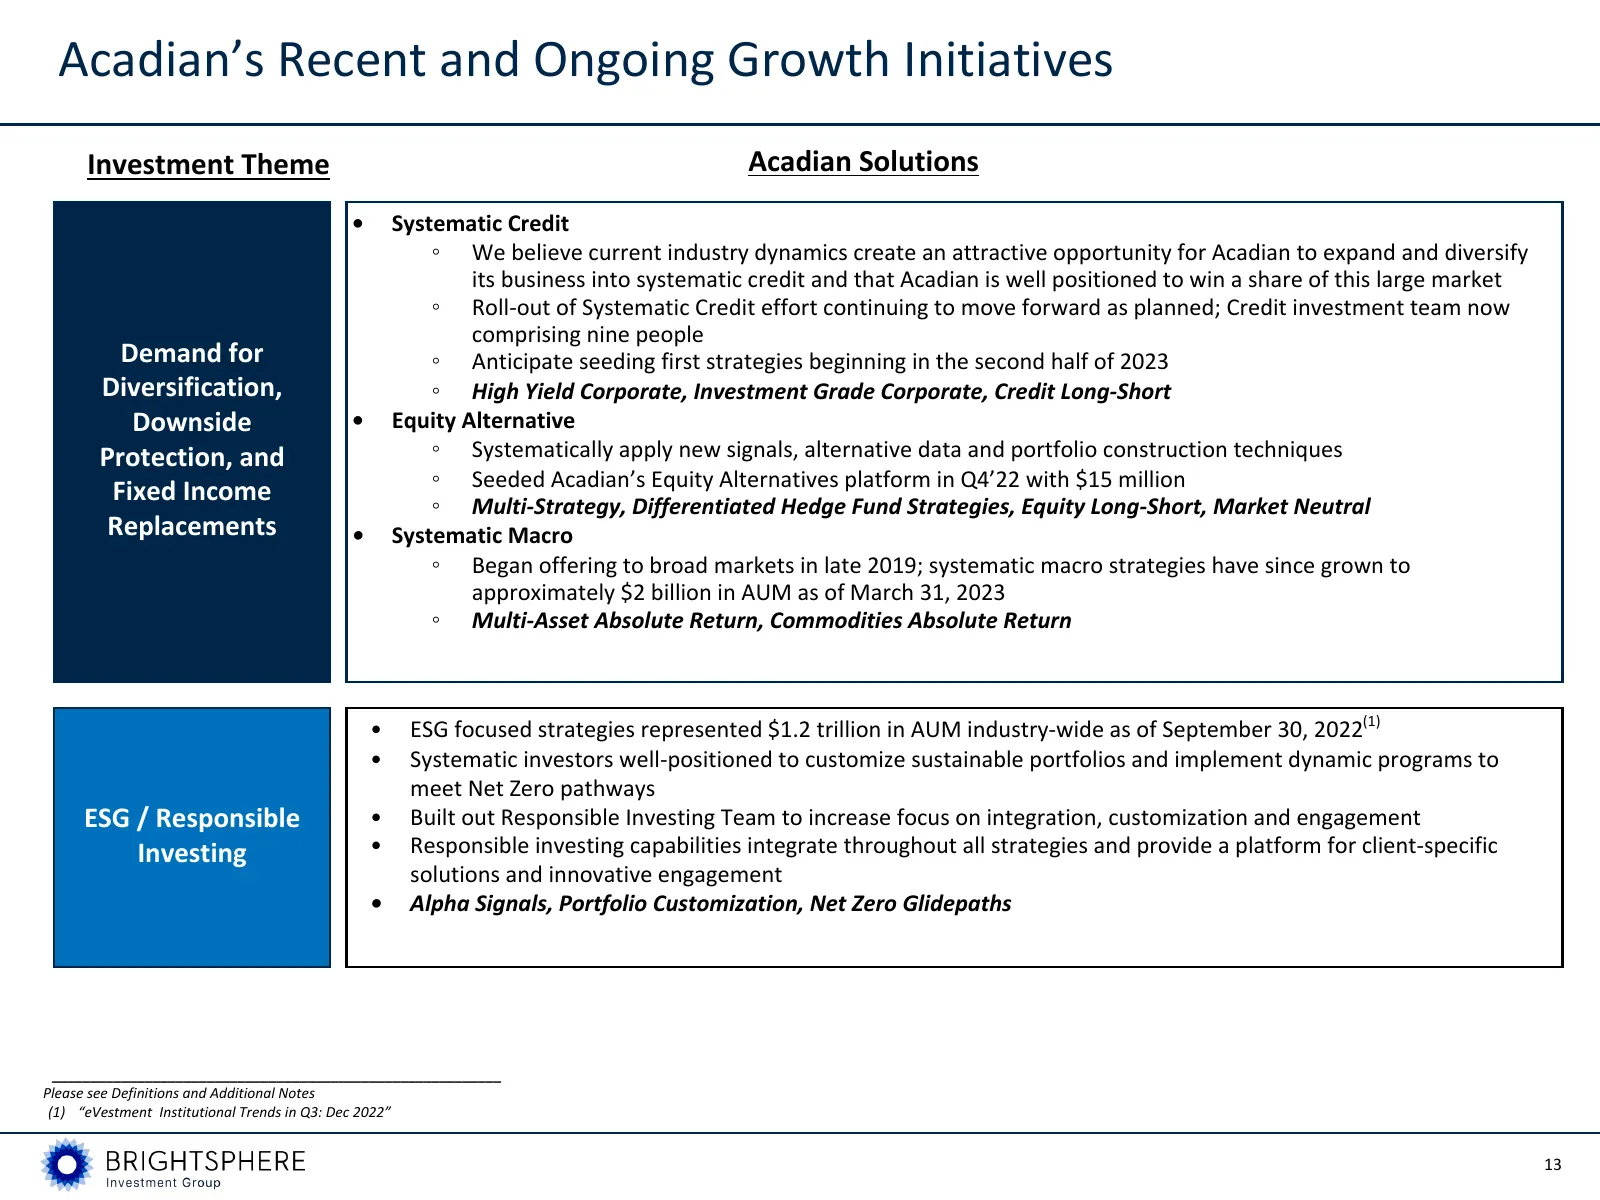
Acadian’s Recent and Ongoing Growth Initiatives Investment Theme Acadian Solutions • Systematic Credit ◦ We believe current industry dynamics create an attractive opportunity for Acadian to expand and diversify its business into systematic credit and that Acadian is well positioned to win a share of
Slide 11: ESG: Over Two Decades of Investment, Innovation & Leadership
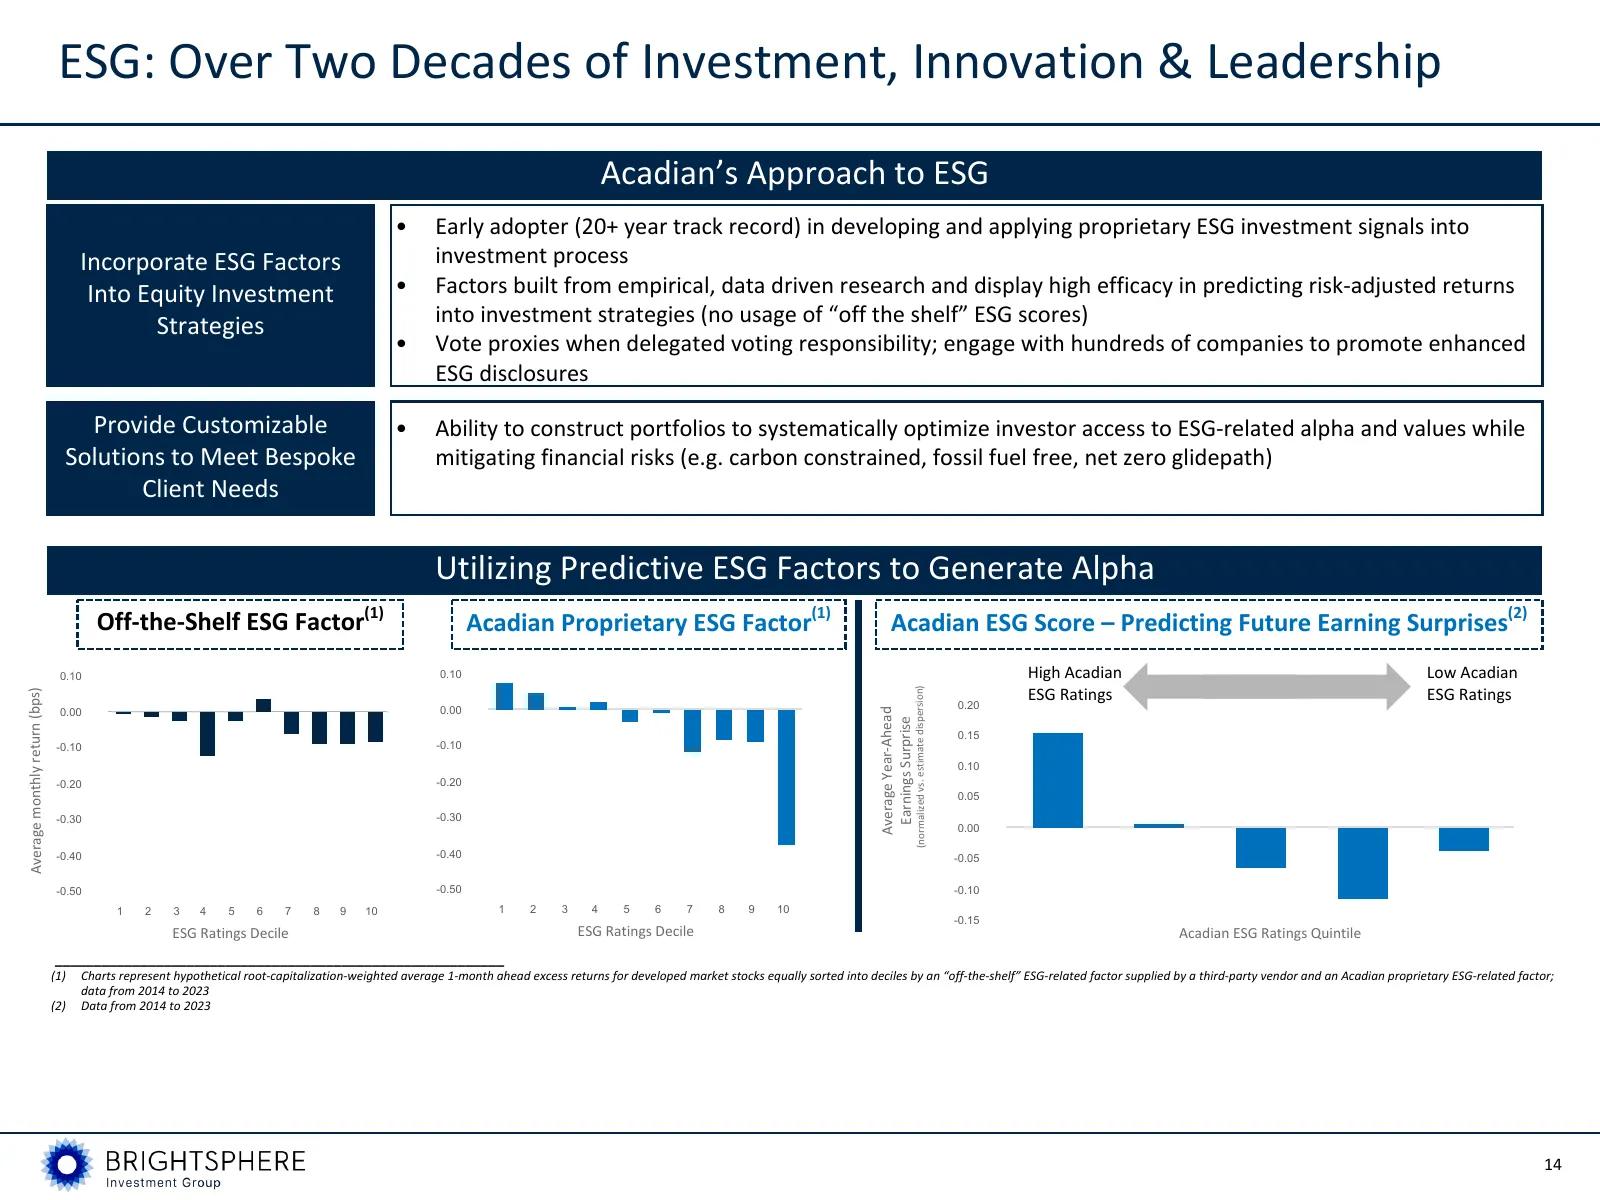
ESG: Over Two Decades of Investment, Innovation & Leadership Acadian’s Approach to ESG • Early adopter (20+ year track record) in developing and applying proprietary ESG investment signals into Incorporate ESG Factors investment process Into Equity Investment • Factors built from empirical, data dri
Slide 12: Disciplined Execution of Long-Term Growth Strategy
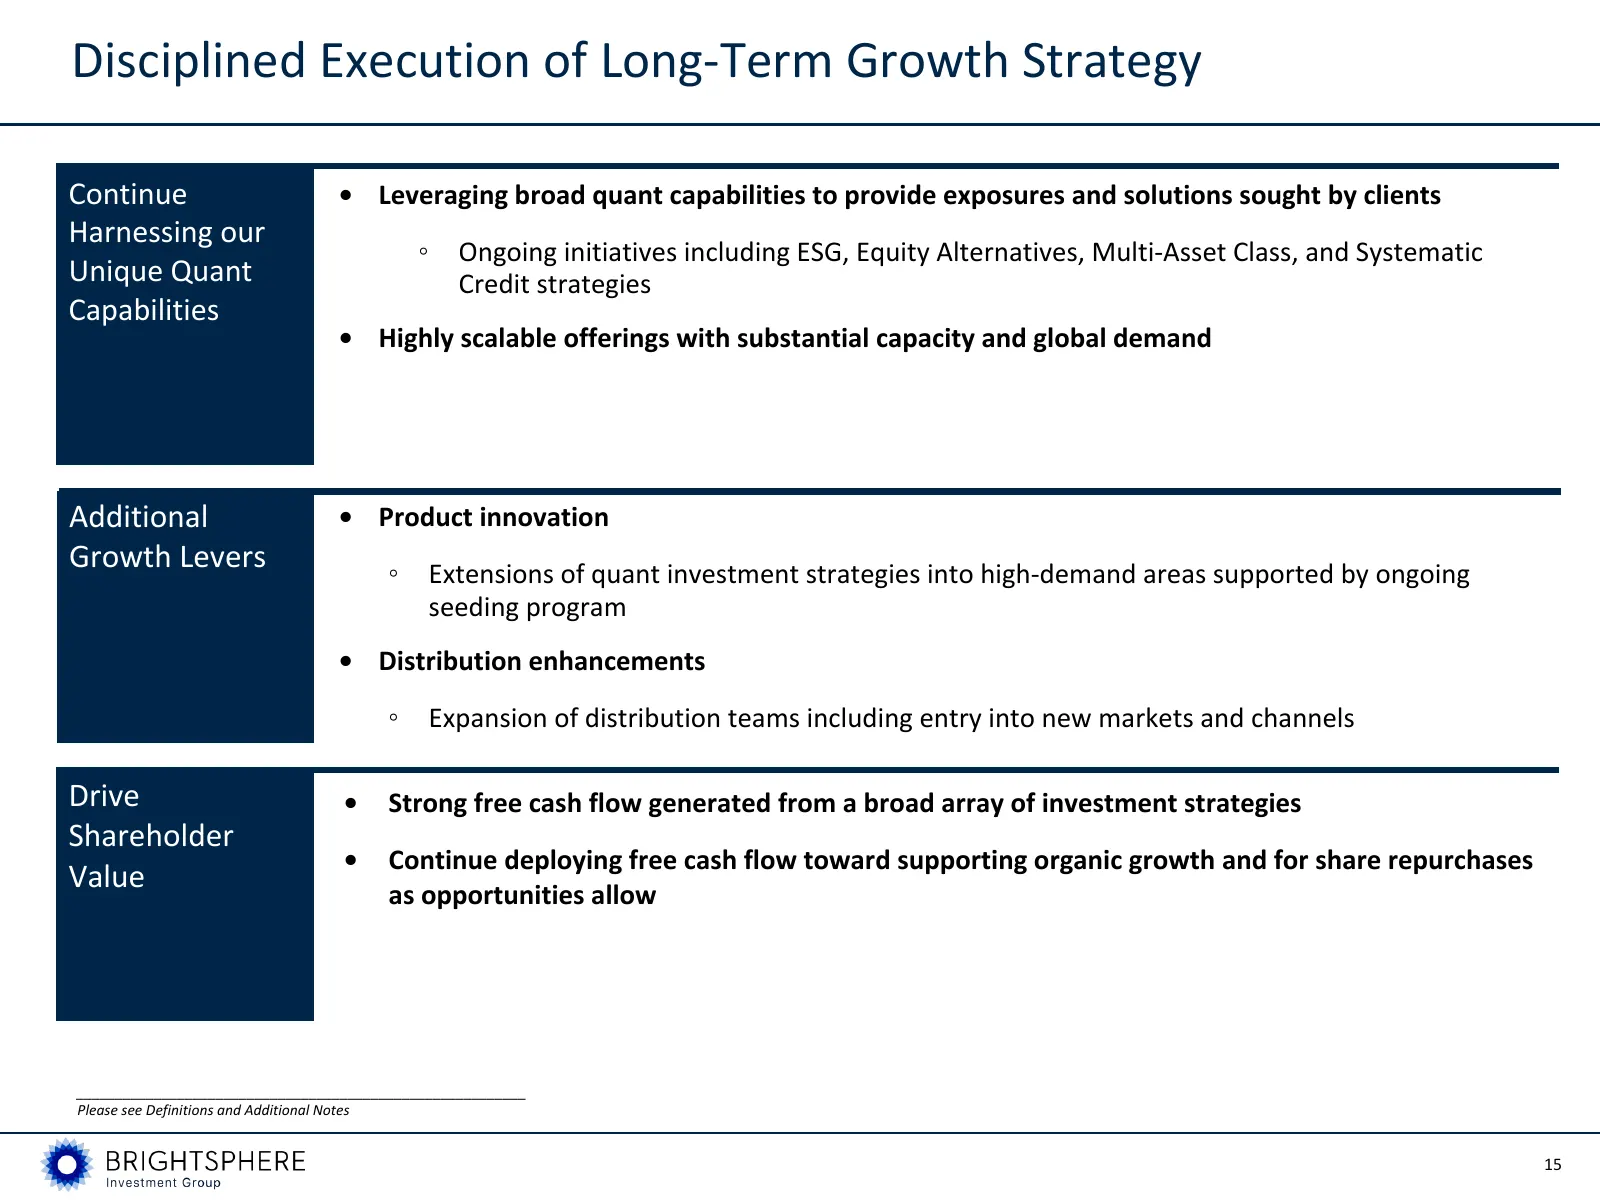
Disciplined Execution of Long-Term Growth Strategy Continue • Leveraging broad quant capabilities to provide exposures and solutions sought by clients Harnessing our ◦ Ongoing initiatives including ESG, Equity Alternatives, Multi-Asset Class, and Systematic Unique Quant Credit strategies Capabilitie
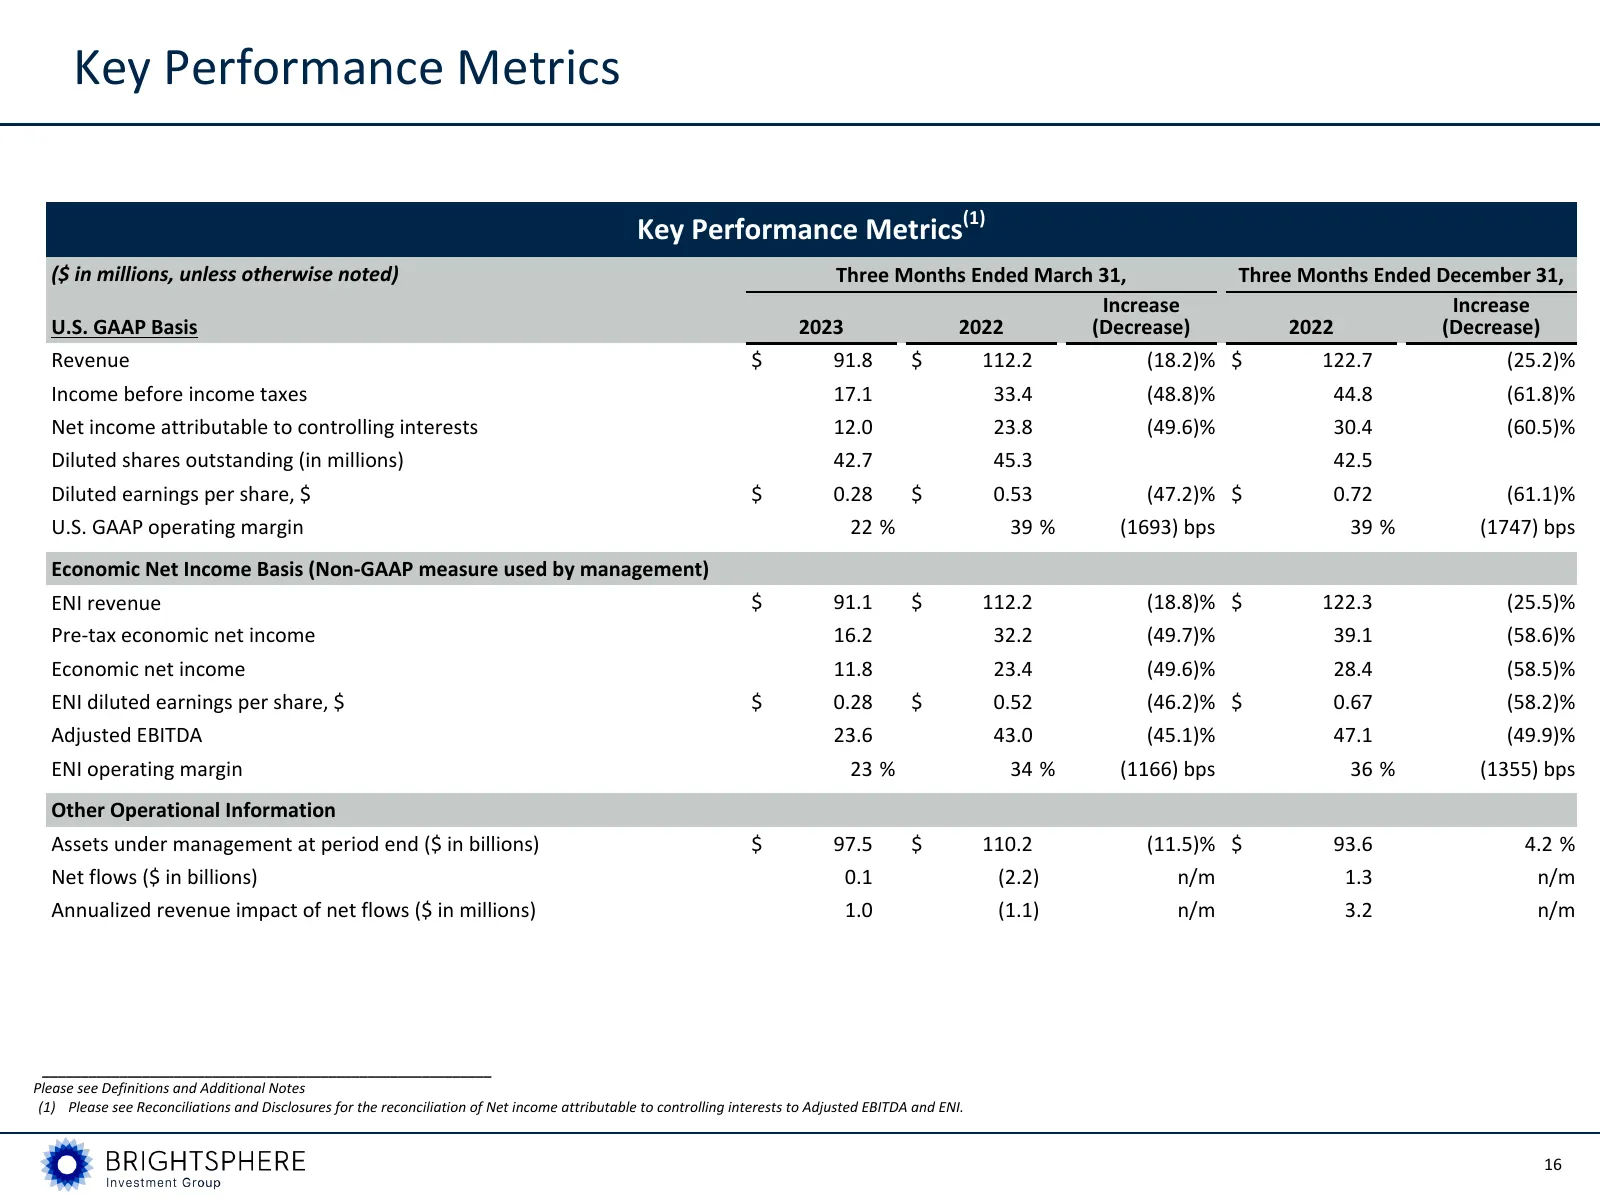
Slide 13: Key Performance Metrics
Key Performance Metrics Key Performance Metrics(1) ($ in millions, unless otherwise noted) Three Months Ended March 31, Three Months Ended December 31, Increase Increase U.S. GAAP Basis 2023 2022 (Decrease) 2022 (Decrease) Revenue $ 91.8 $ 112.2 (18.2)% $ 122.7 (25.2)% Income before income taxes 17.
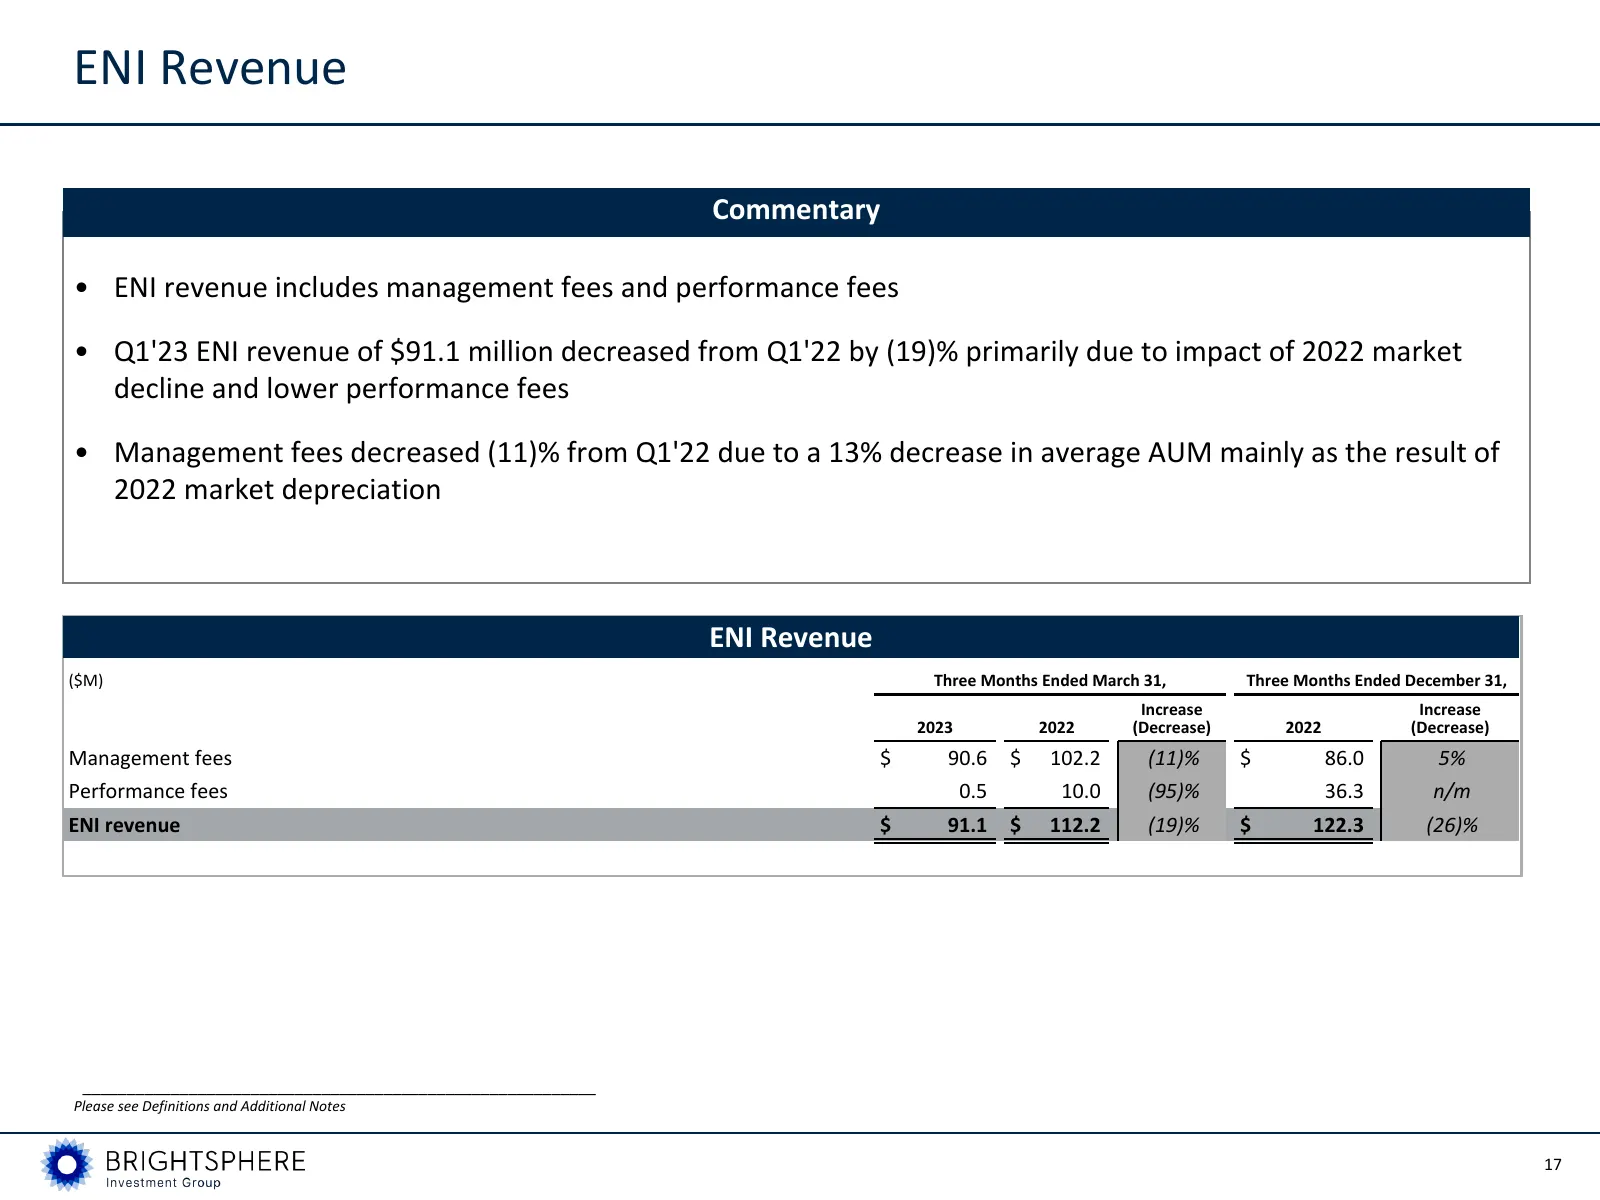
Slide 14: ENI Revenue
ENI Revenue Commentary • ENI revenue includes management fees and performance fees • Q1'23 ENI revenue of $91.1 million decreased from Q1'22 by (19)% primarily due to impact of 2022 market decline and lower performance fees • Management fees decreased (11)% from Q1'22 due to a 13% decrease in averag
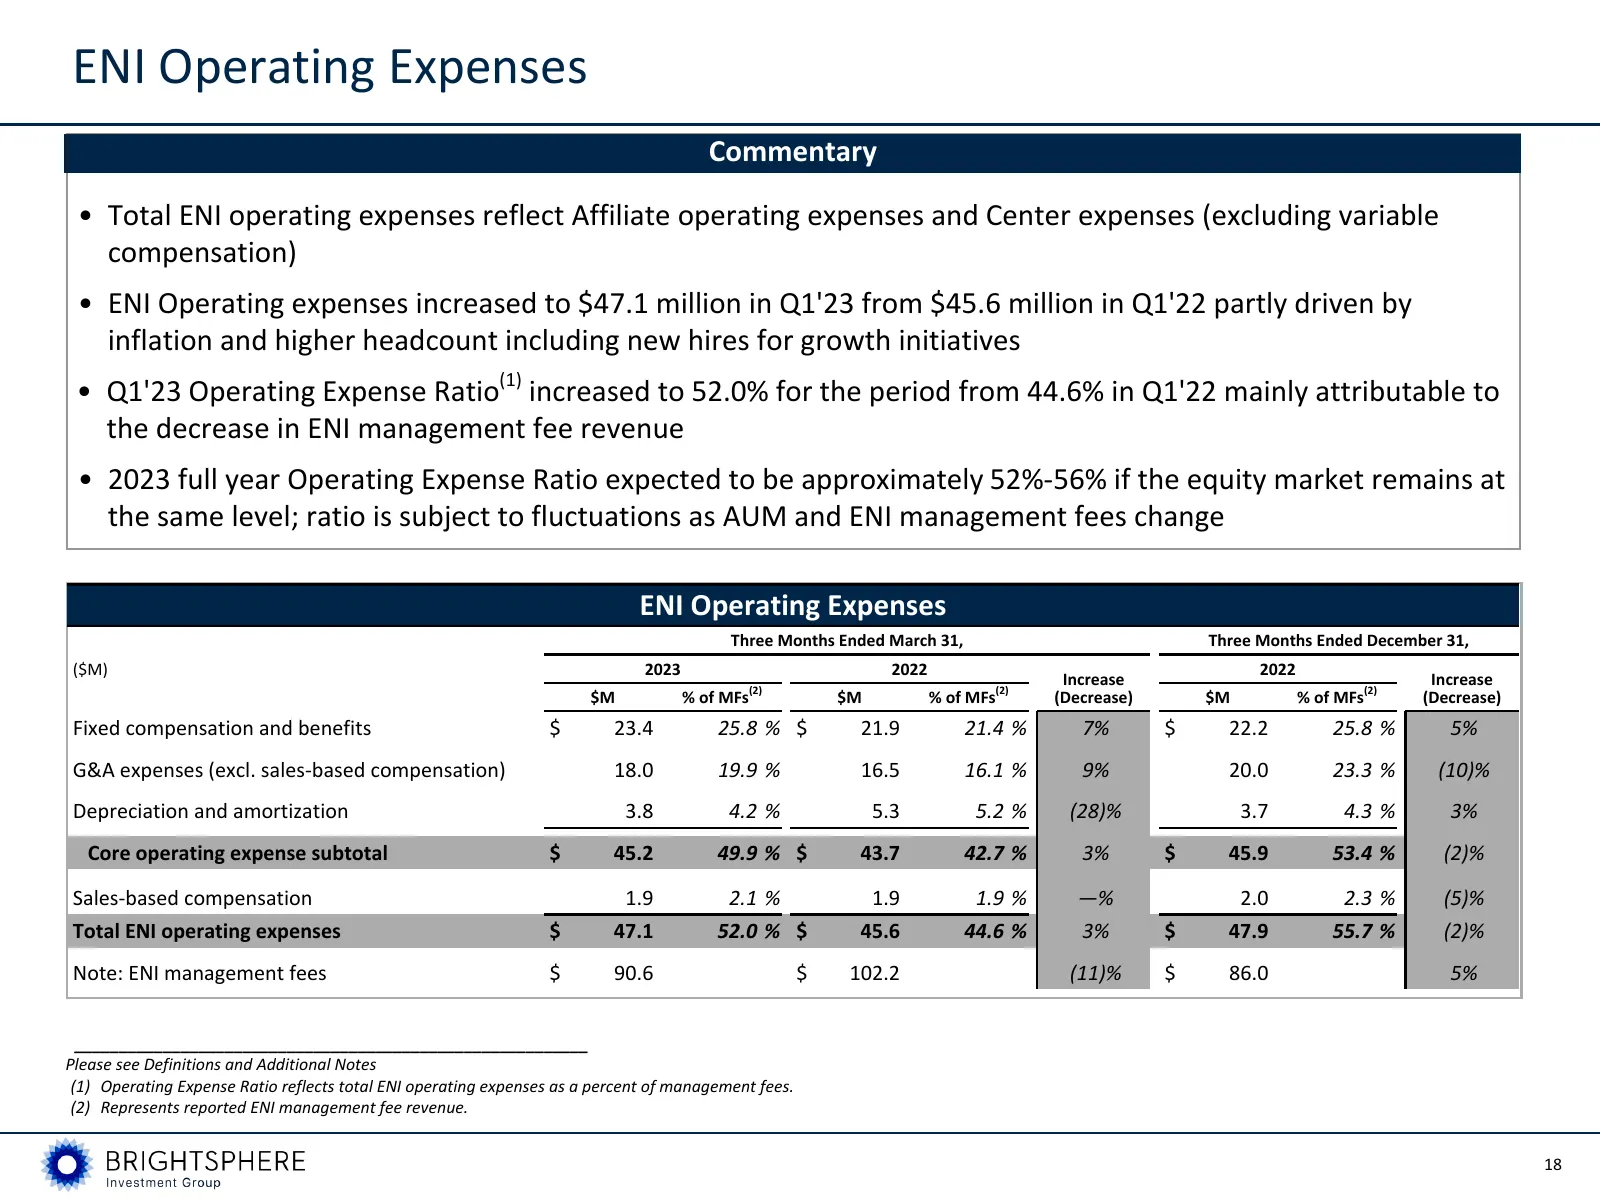
Slide 15: ENI Operating Expenses
ENI Operating Expenses Commentary • Total ENI operating expenses reflect Affiliate operating expenses and Center expenses (excluding variable compensation) • ENI Operating expenses increased to $47.1 million in Q1'23 from $45.6 million in Q1'22 partly driven by inflation and higher headcount includi
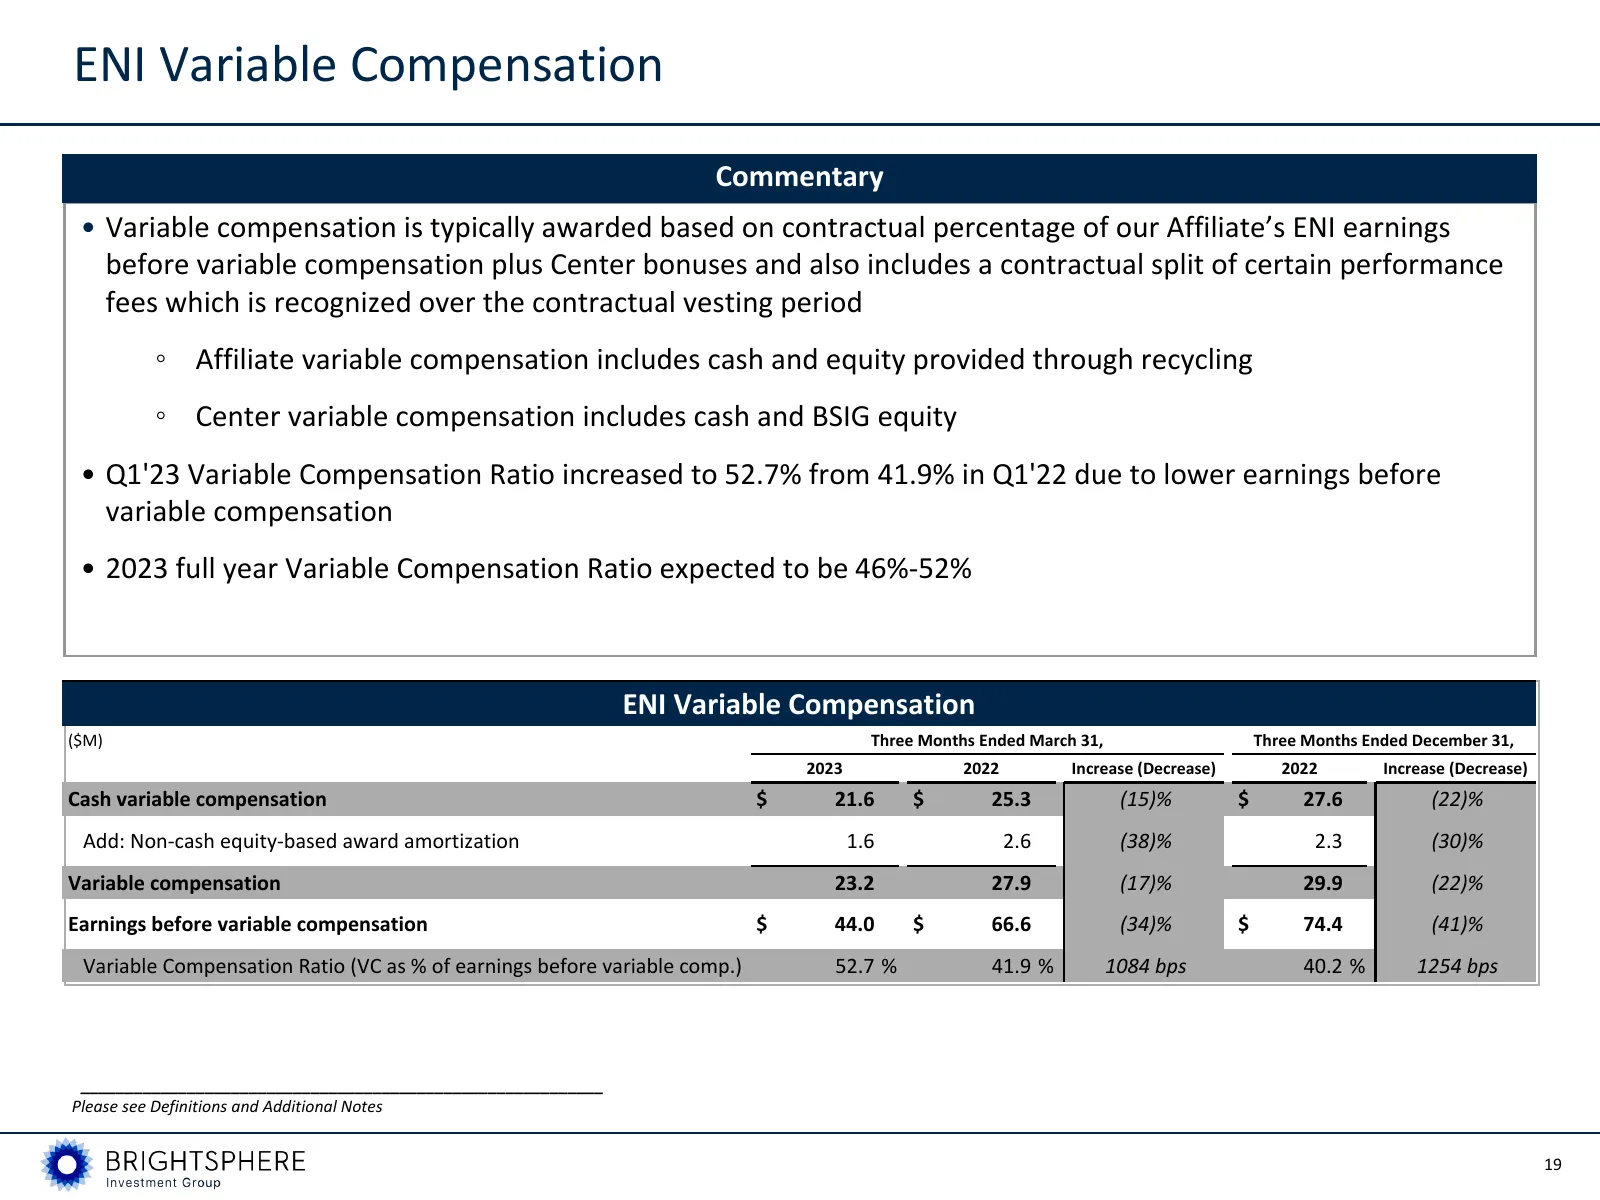
Slide 16: ENI Variable Compensation
ENI Variable Compensation Commentary • Variable compensation is typically awarded based on contractual percentage of our Affiliate’s ENI earnings before variable compensation plus Center bonuses and also includes a contractual split of certain performance fees which is recognized over the contractua
Slide 17: Affiliate Key Employee Distributions
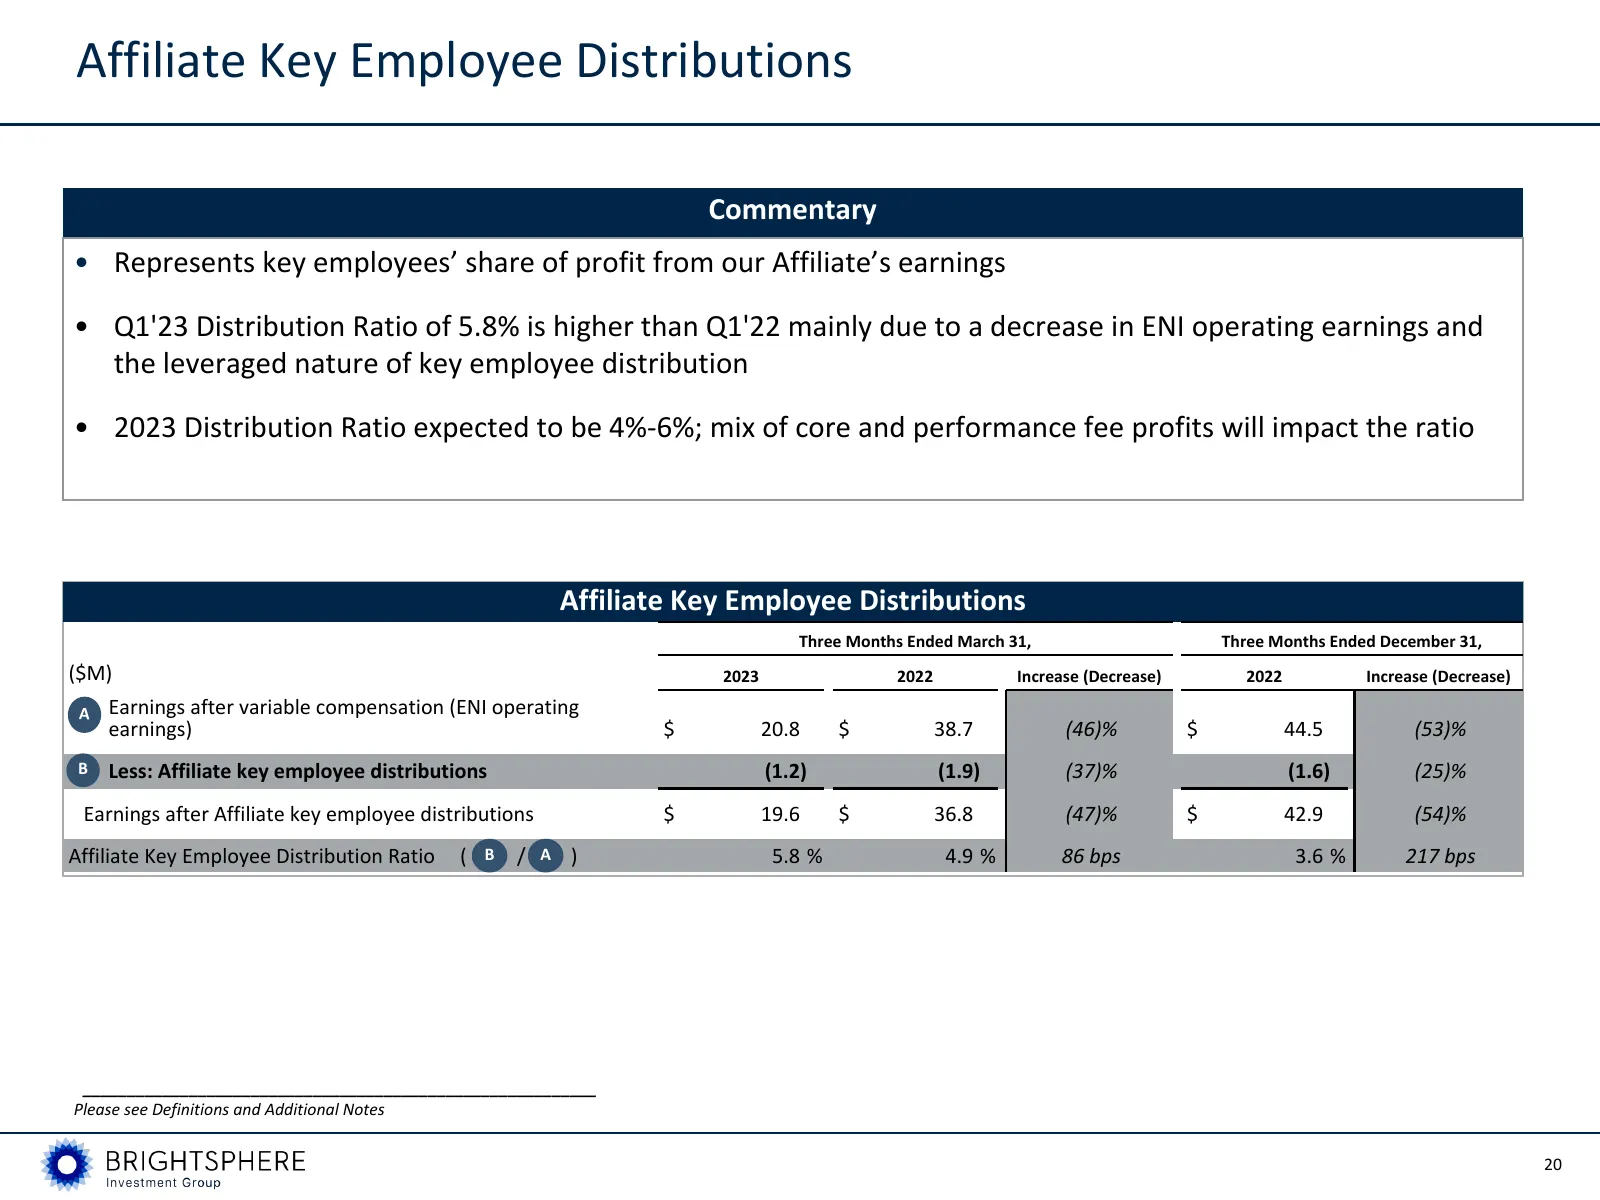
Affiliate Key Employee Distributions Commentary • Represents key employees’ share of profit from our Affiliate’s earnings • Q1'23 Distribution Ratio of 5.8% is higher than Q1'22 mainly due to a decrease in ENI operating earnings and the leveraged nature of key employee distribution • 2023 Distributi
Slide 18: Balance Sheet Management
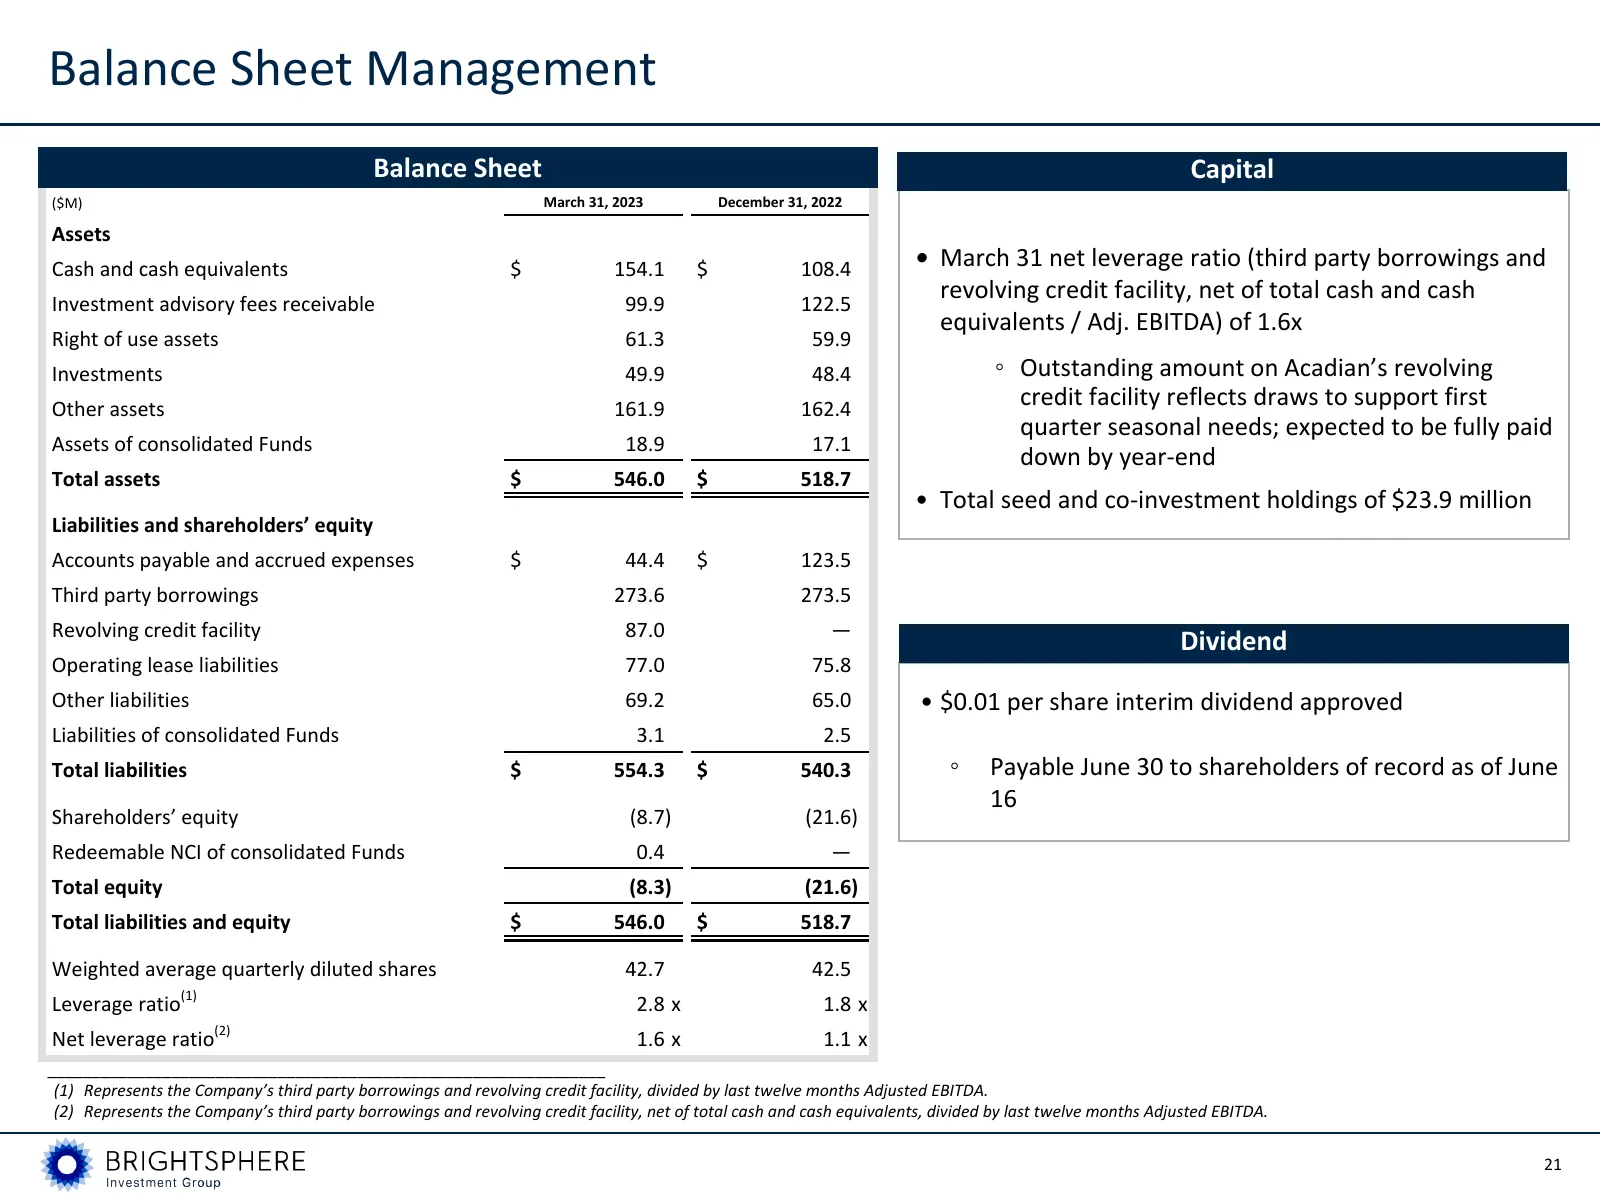
Balance Sheet Management Balance Sheet Capital ($M) March 31, 2023 December 31, 2022 Assets Cash and cash equivalents $ 154.1 $ 108.4 • March 31 net leverage ratio (third party borrowings and Investment advisory fees receivable 99.9 122.5 revolving credit facility, net of total cash and cash equival
Slide 19: Supplemental Information
Supplemental Information 22
Slide 20: Segment Information for Q1'23 and Q1'22
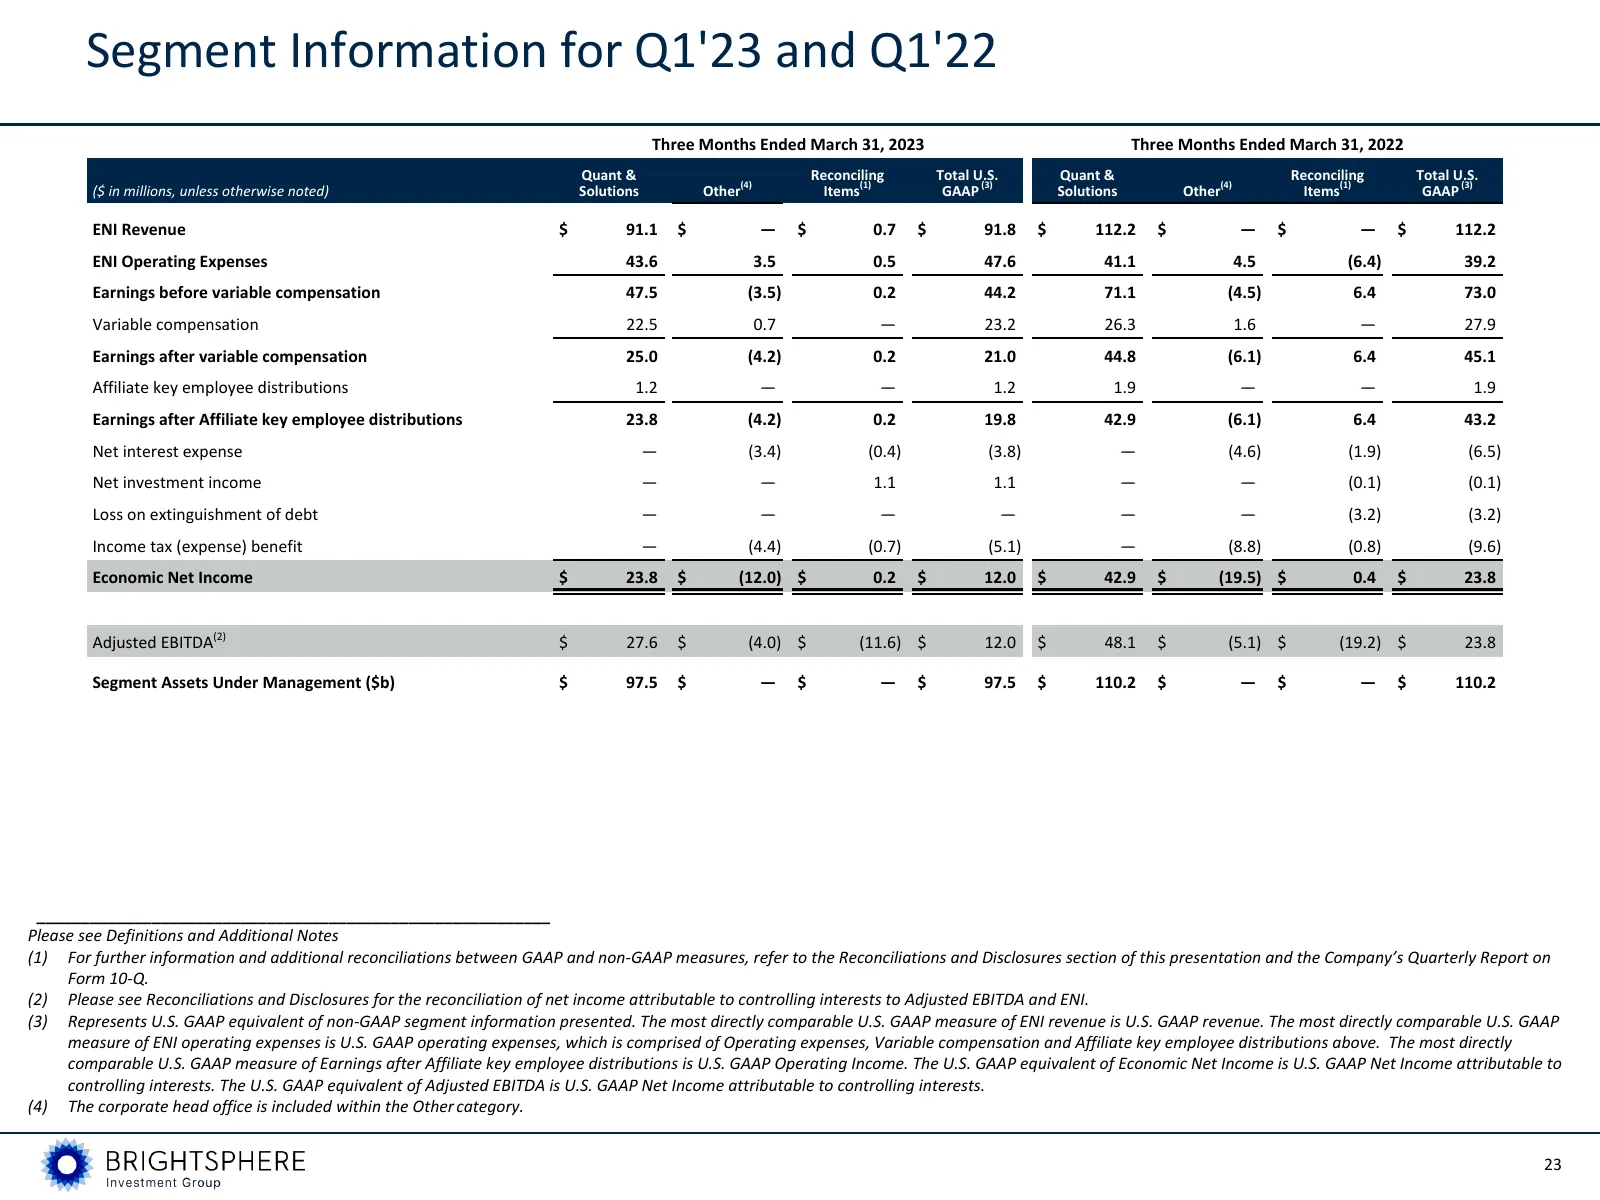
Segment Information for Q1'23 and Q1'22 Three Months Ended March 31, 2023 Three Months Ended March 31, 2022 Quant & Reconciling Total U.S. Quant & Reconciling Total U.S. ($ in millions, unless otherwise noted) Solutions Other(4) Items(1) GAAP (3) Solutions Other(4) Items(1) GAAP (3) ENI Revenue $ 91
Slide 21: Segment Information for Q4'22
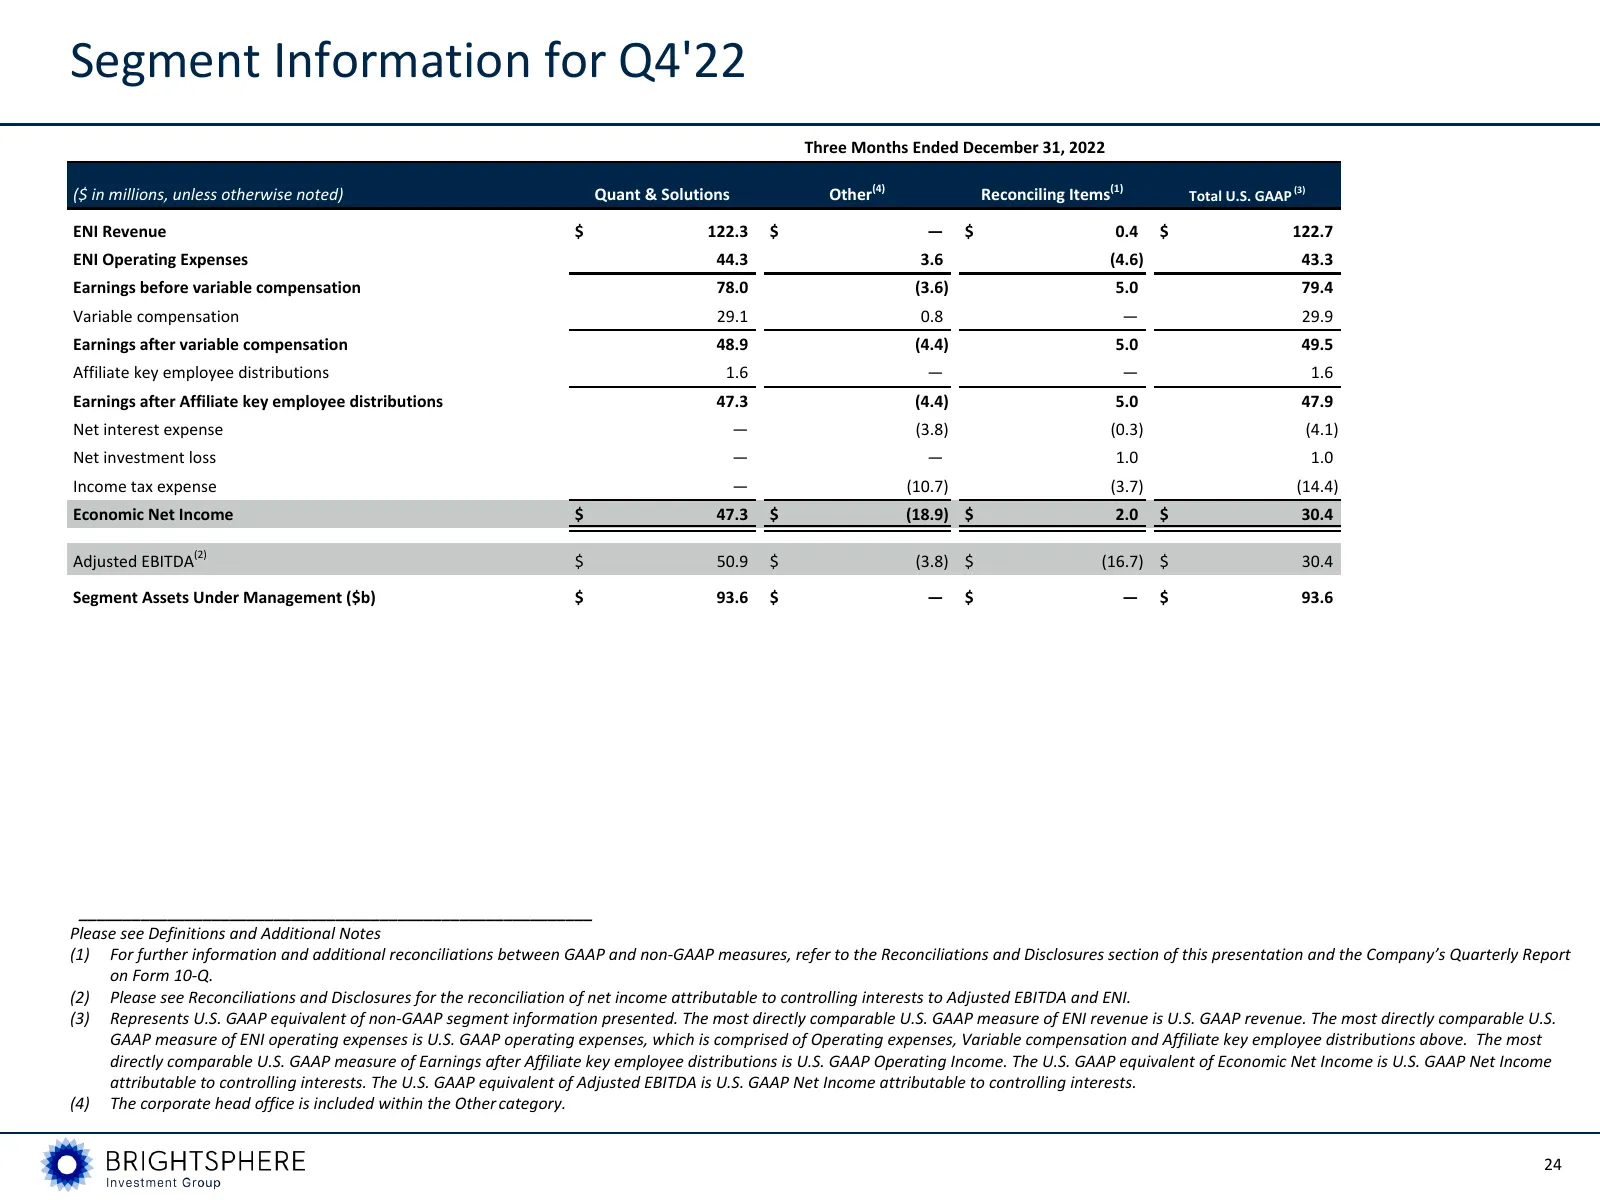
Segment Information for Q4'22 Three Months Ended December 31, 2022 ($ in millions, unless otherwise noted) Quant & Solutions Other(4) Reconciling Items(1) Total U.S. GAAP (3) ENI Revenue $ 122.3 $ — $ 0.4 $ 122.7 ENI Operating Expenses 44.3 3.6 (4.6) 43.3 Earnings before variable compensation 78.0 (
Slide 22: Assets Under Management Rollforward
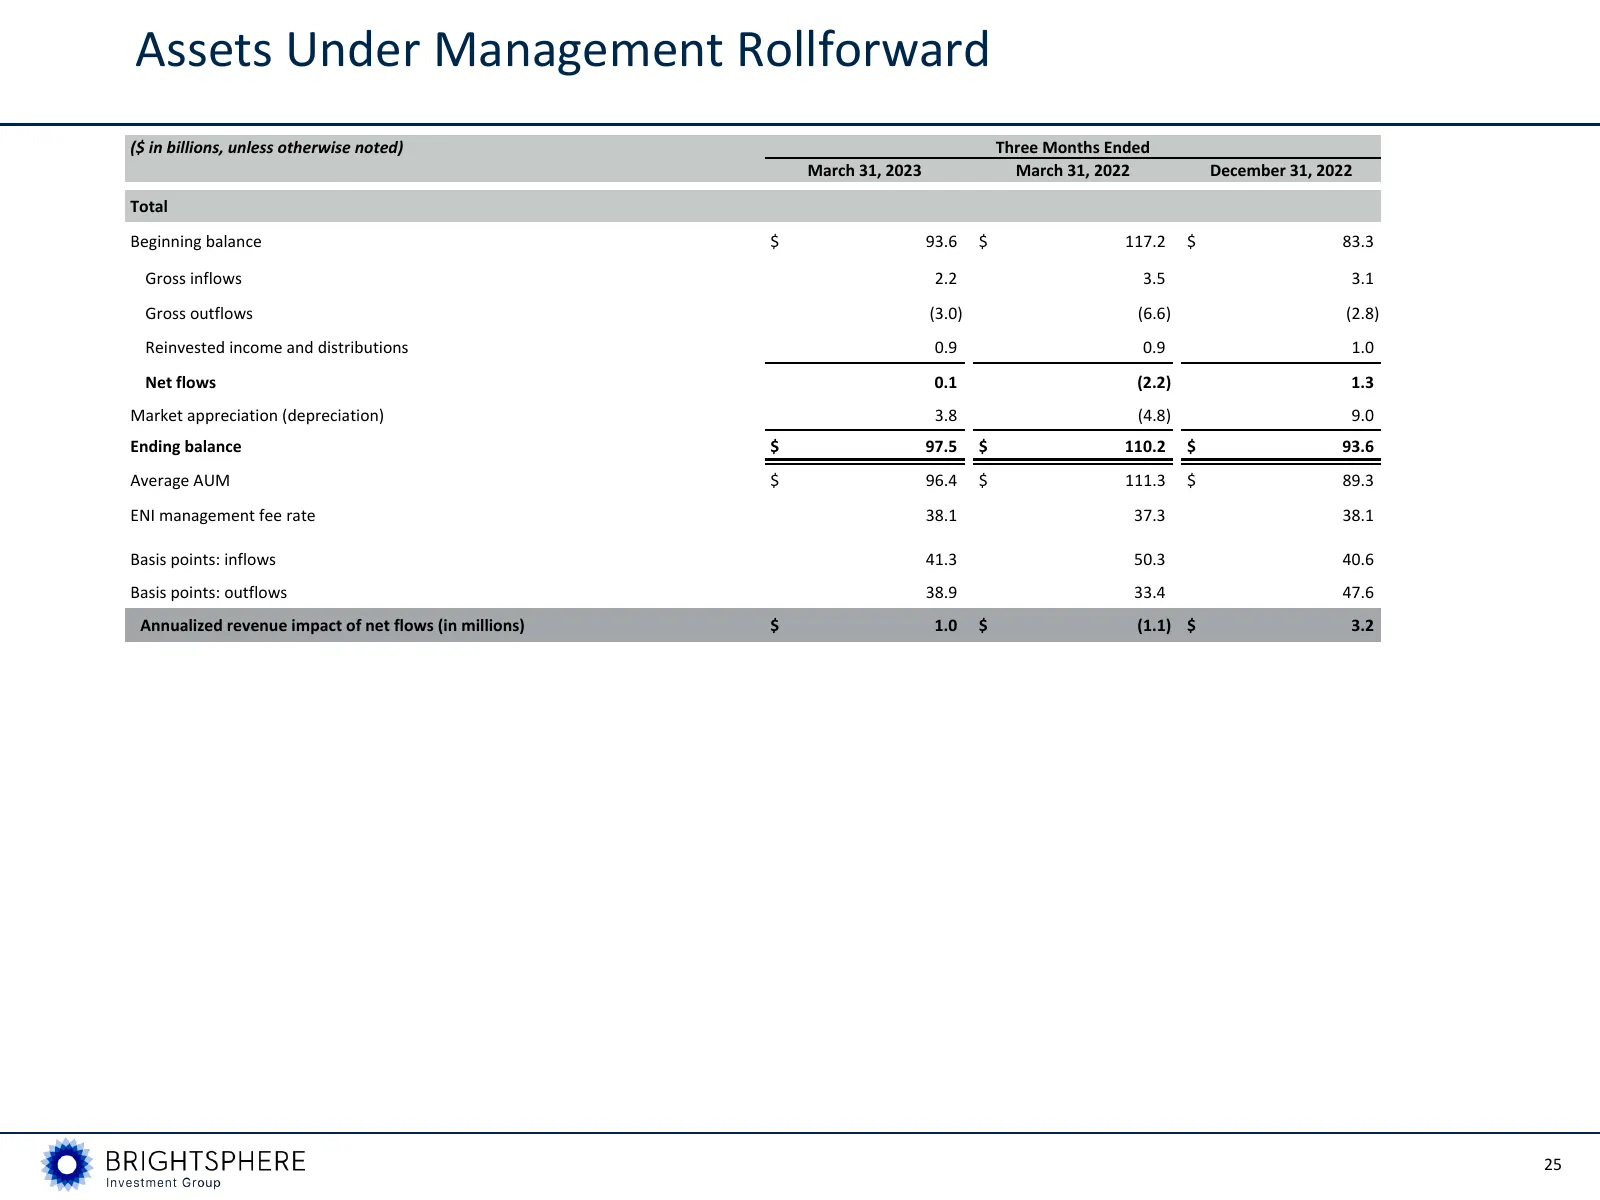
Assets Under Management Rollforward ($ in billions, unless otherwise noted) Three Months Ended March 31, 2023 March 31, 2022 December 31, 2022 Total Beginning balance $ 93.6 $ 117.2 $ 83.3 Gross inflows 2.2 3.5 3.1 Gross outflows (3.0) (6.6) (2.8) Reinvested income and distributions 0.9 0.9 1.0 Net
Slide 23: Reconciliations and Disclosures
Reconciliations and Disclosures 26
Slide 24: Reconciliations from U.S. GAAP to Non-GAAP Measures
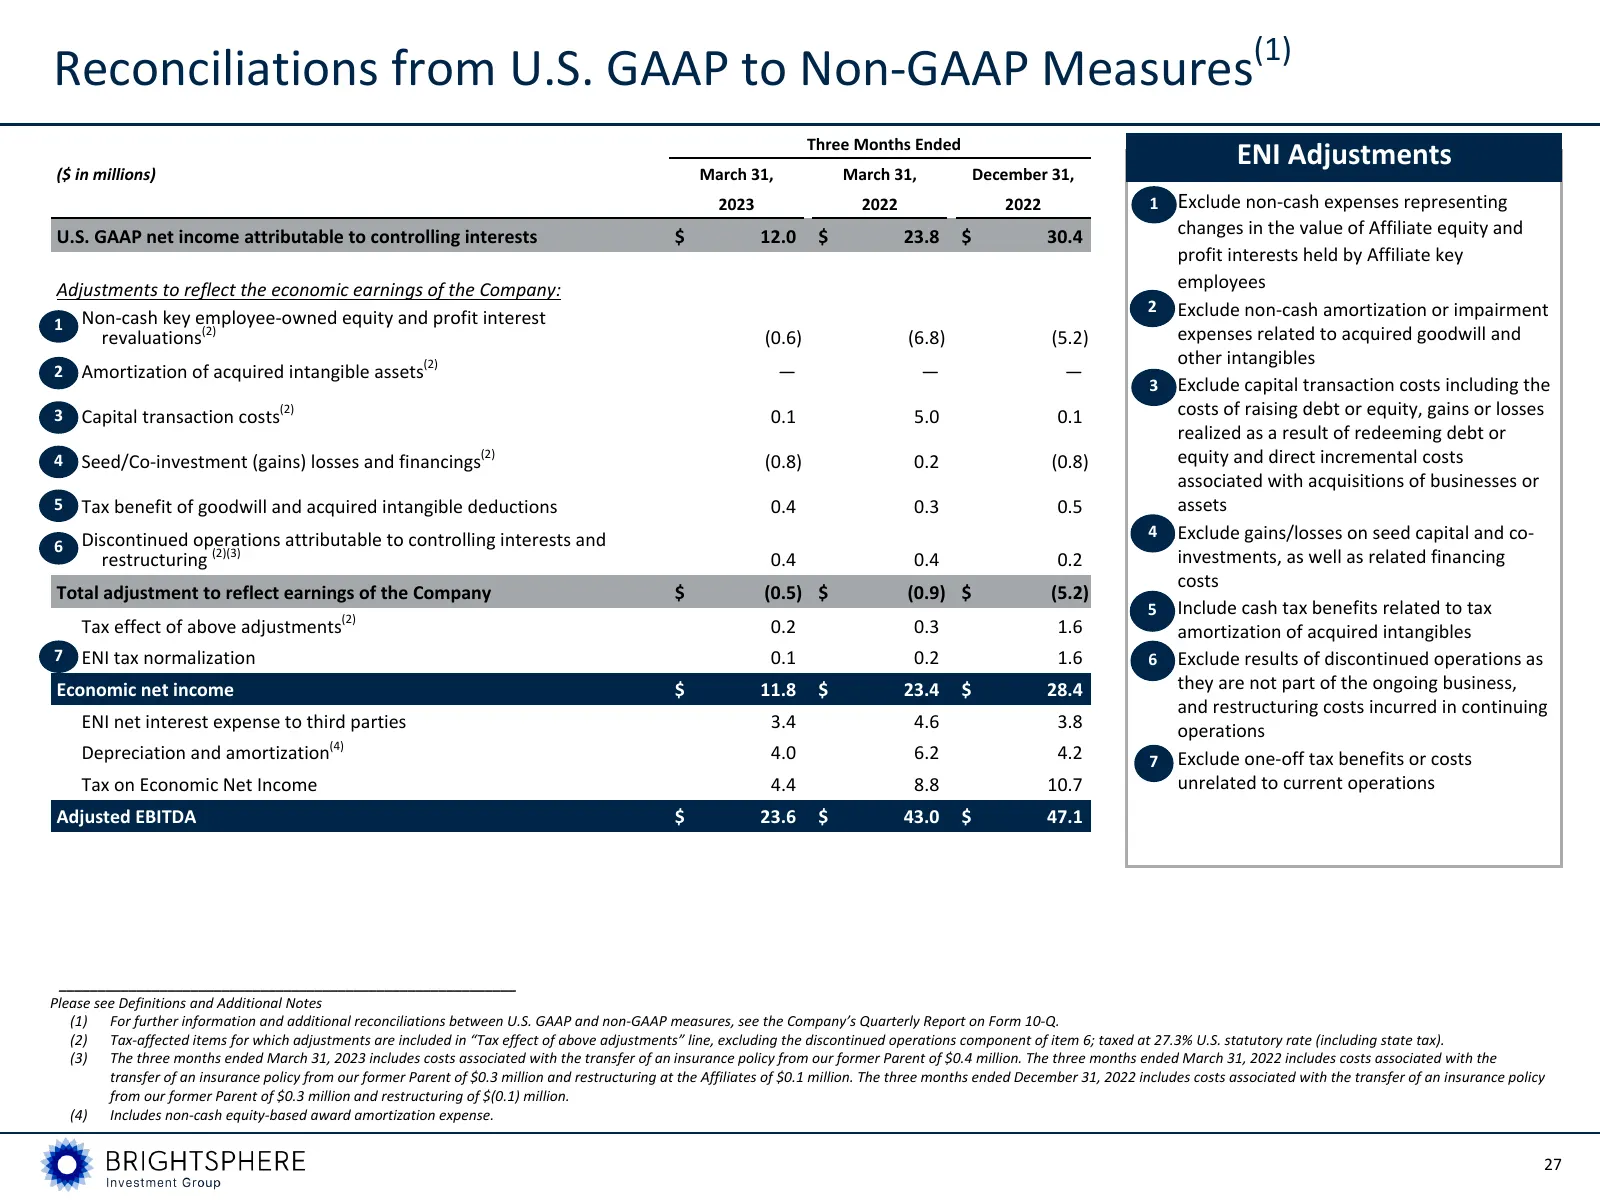
Reconciliations from U.S. GAAP to Non-GAAP Measures(1) Three Months Ended ENI Adjustments ($ in millions) March 31, March 31, December 31, 2023 2022 2022 1i. Exclude non-cash expenses representing U.S. GAAP net income attributable to controlling interests $ 12.0 $ 23.8 $ 30.4 changes in the value of
Slide 25: Reconciliations from U.S. GAAP to Non-GAAP Measures (cont.)
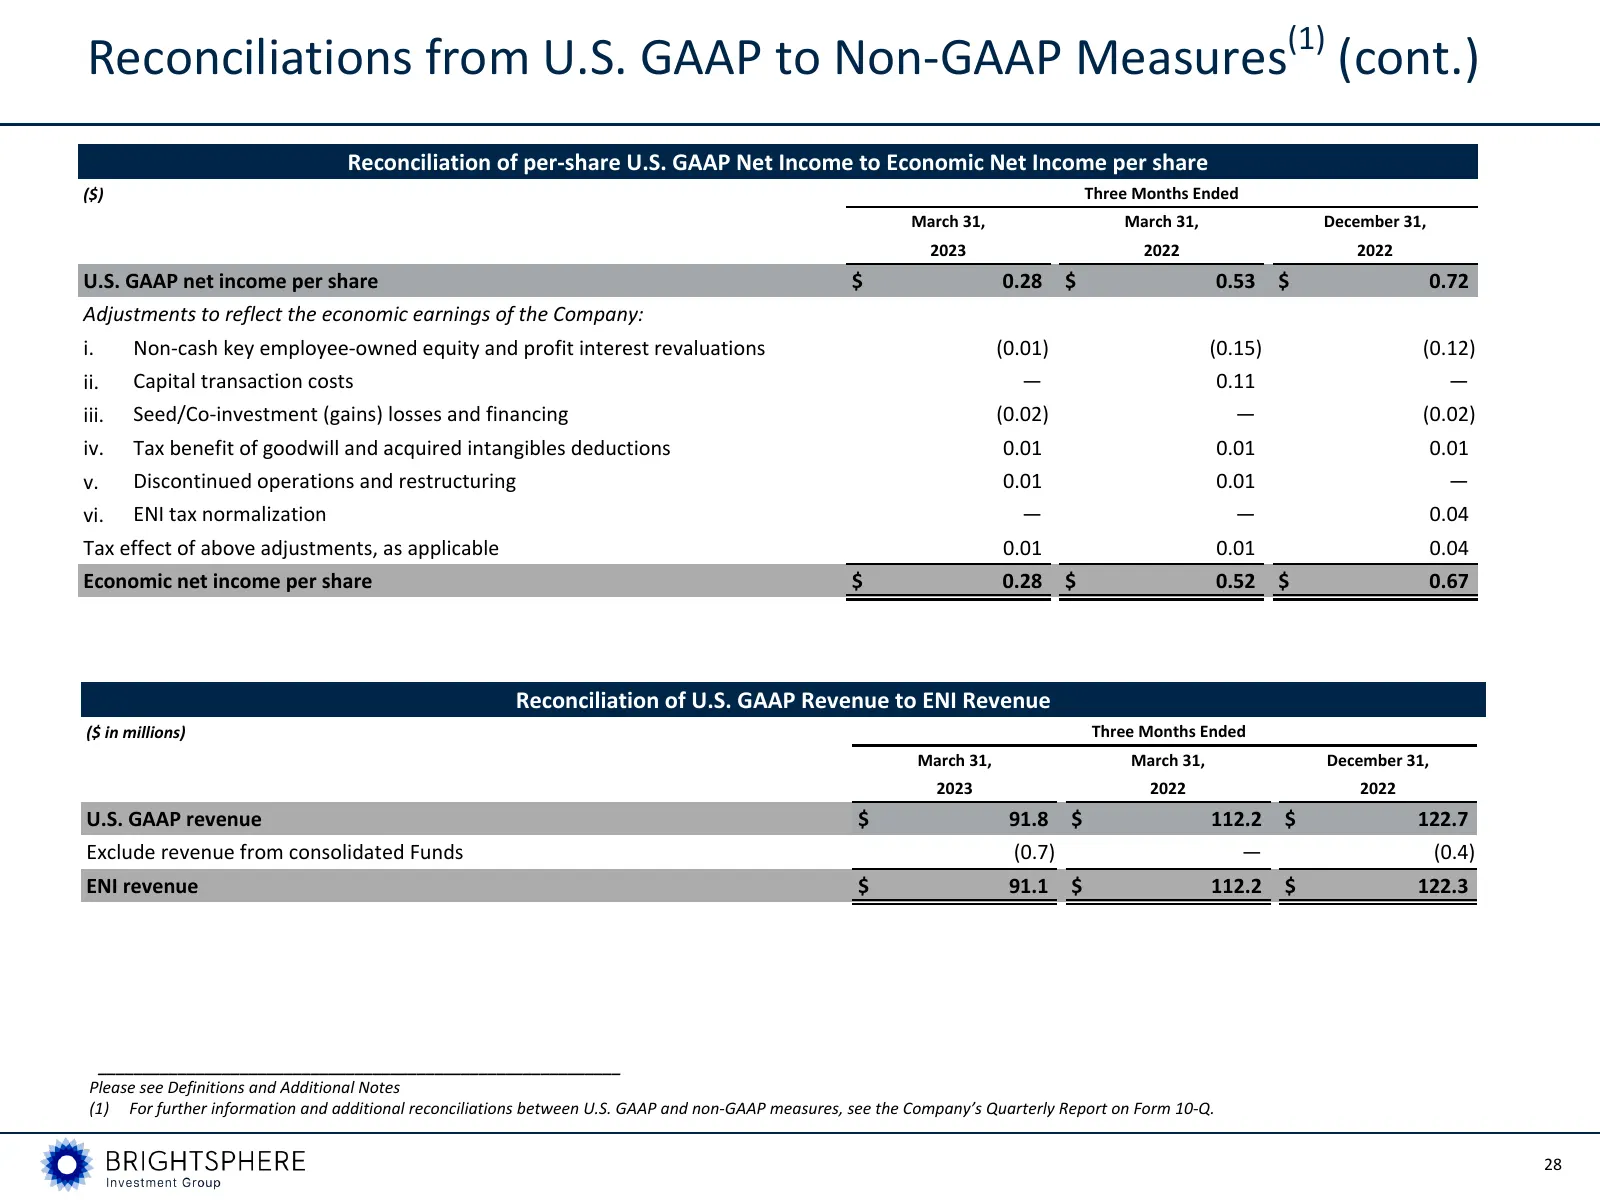
Reconciliations from U.S. GAAP to Non-GAAP Measures(1) (cont.) Reconciliation of per-share U.S. GAAP Net Income to Economic Net Income per share ($) Three Months Ended March 31, March 31, December 31, 2023 2022 2022 U.S. GAAP net income per share $ 0.28 $ 0.53 $ 0.72 Adjustments to reflect the econo
Slide 26: Reconciliations from U.S. GAAP to Non-GAAP Measures (cont.)
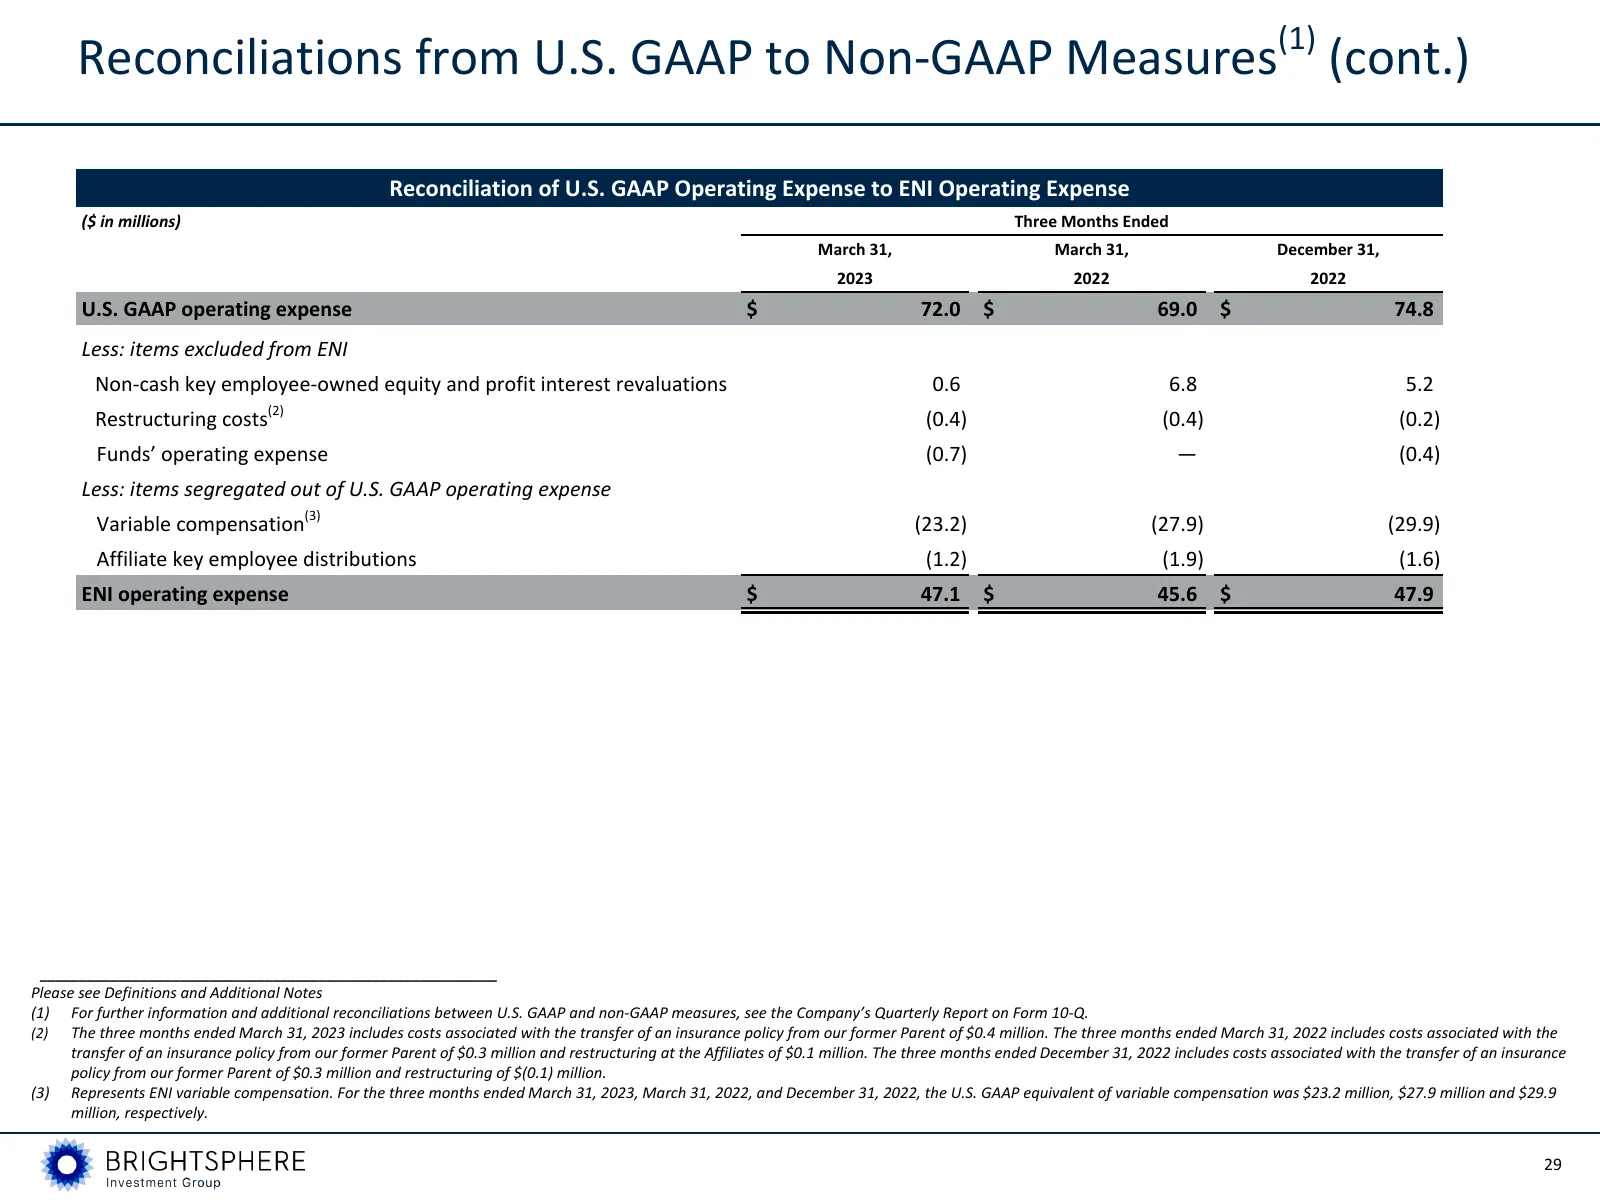
Reconciliations from U.S. GAAP to Non-GAAP Measures(1) (cont.) Reconciliation of U.S. GAAP Operating Expense to ENI Operating Expense ($ in millions) Three Months Ended March 31, March 31, December 31, 2023 2022 2022 U.S. GAAP operating expense $ 72.0 $ 69.0 $ 74.8 Less: items excluded from ENI Non-
Slide 27: Reconciliations from U.S. GAAP to Non-GAAP Measures (cont.)
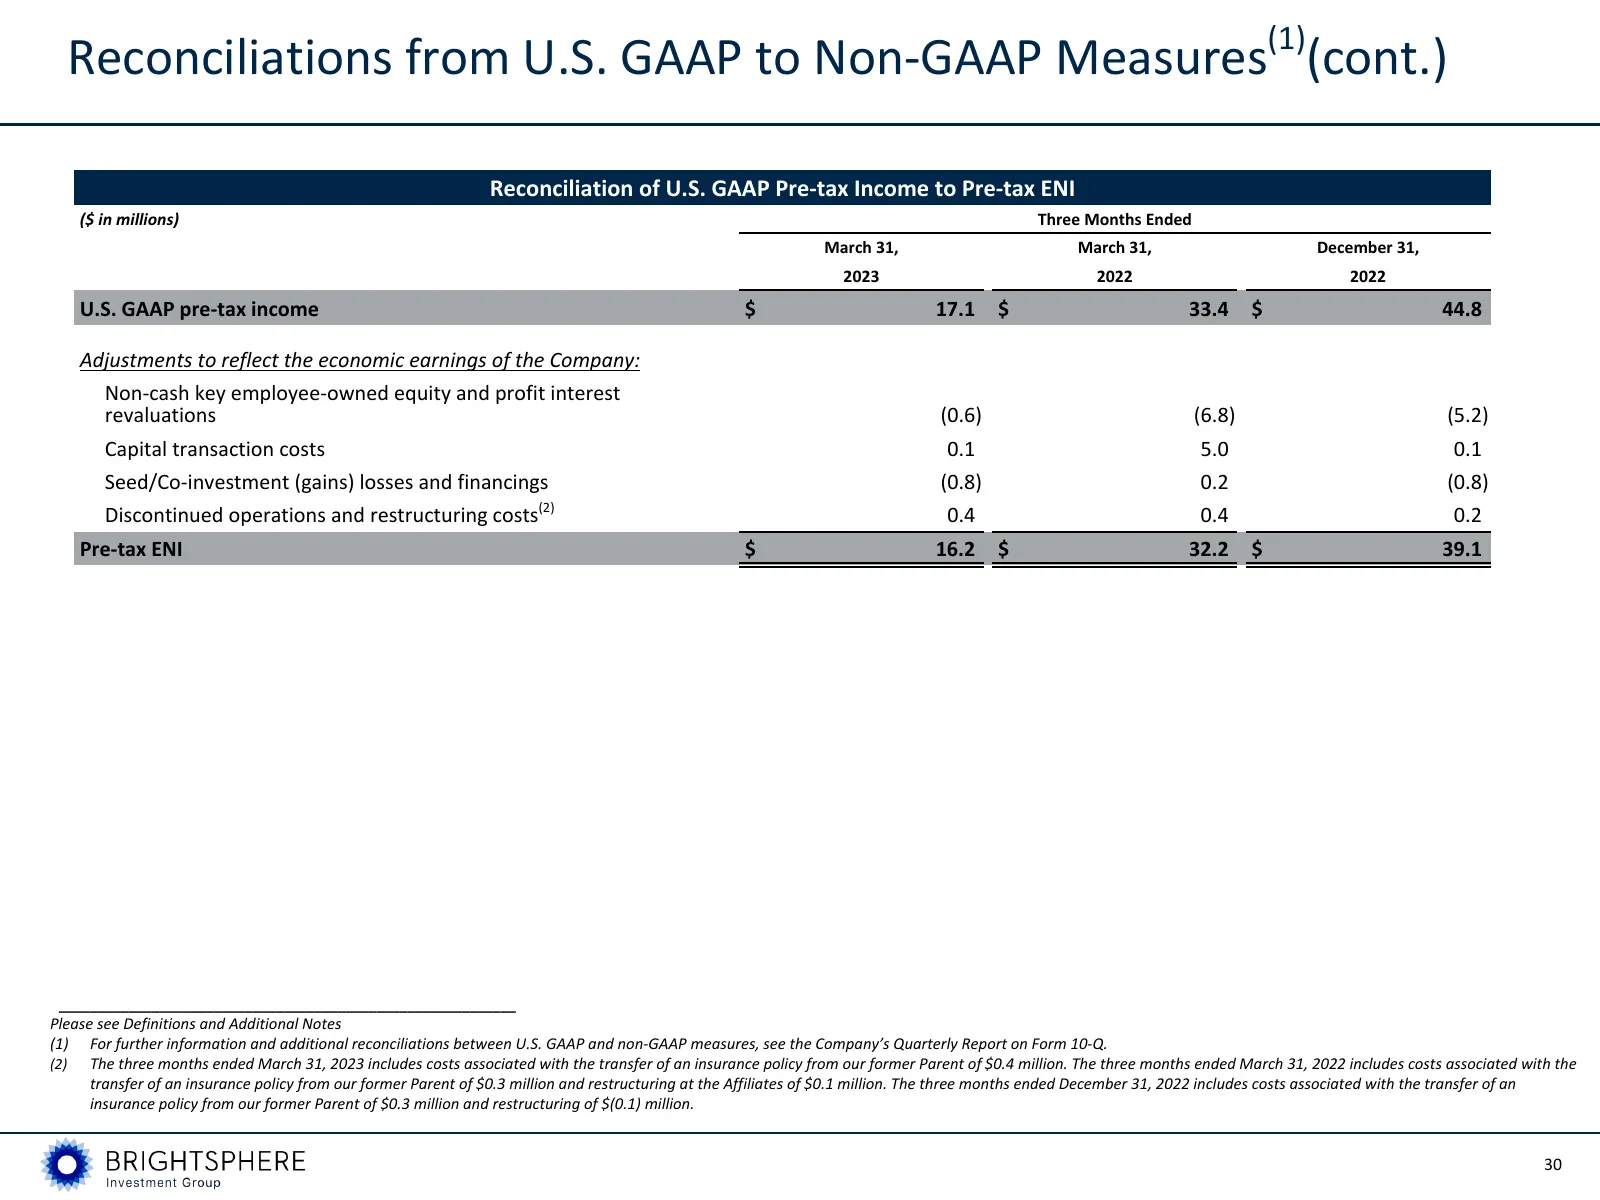
Reconciliations from U.S. GAAP to Non-GAAP Measures(1)(cont.) Reconciliation of U.S. GAAP Pre-tax Income to Pre-tax ENI ($ in millions) Three Months Ended March 31, March 31, December 31, 2023 2022 2022 U.S. GAAP pre-tax income $ 17.1 $ 33.4 $ 44.8 Adjustments to reflect the economic earnings of the
Slide 28: Definitions and Additional Notes
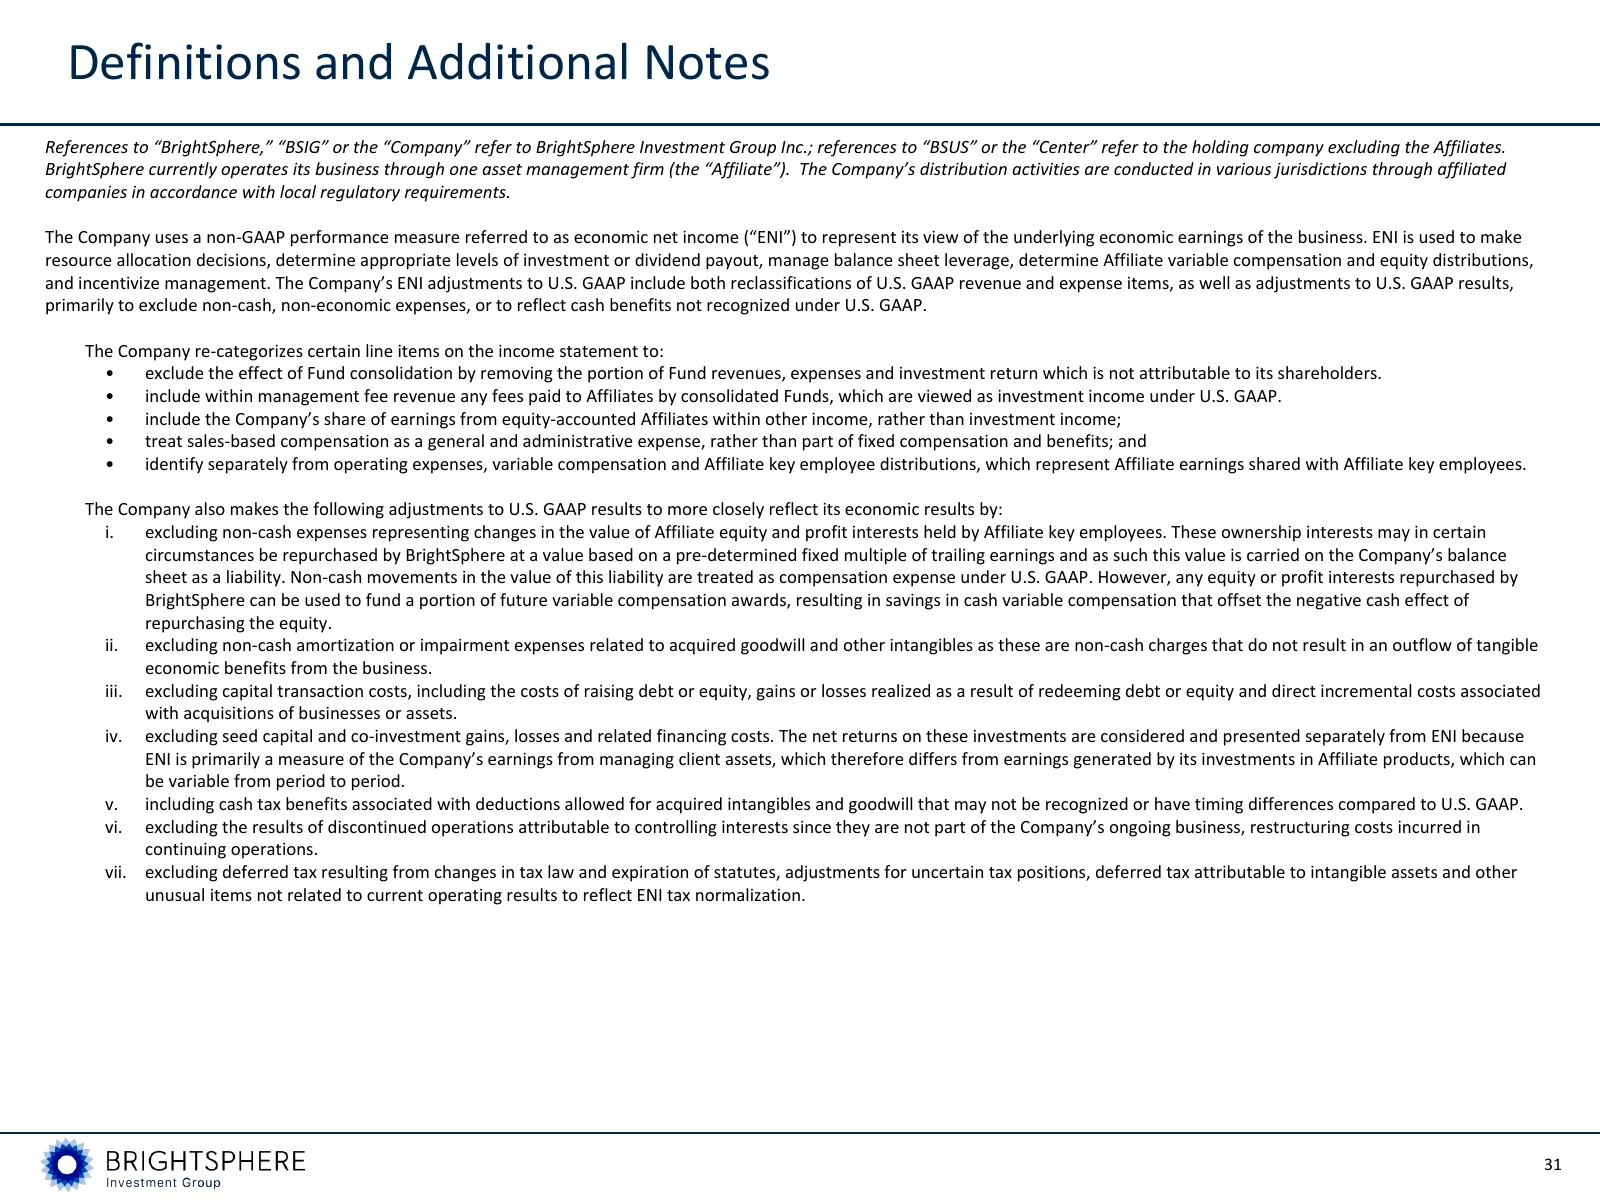
Definitions and Additional Notes References to “BrightSphere,” “BSIG” or the “Company” refer to BrightSphere Investment Group Inc.; references to “BSUS” or the “Center” refer to the holding company excluding the Affiliates. BrightSphere currently operates its business through one asset management fi
Slide 29: Definitions and Additional Notes
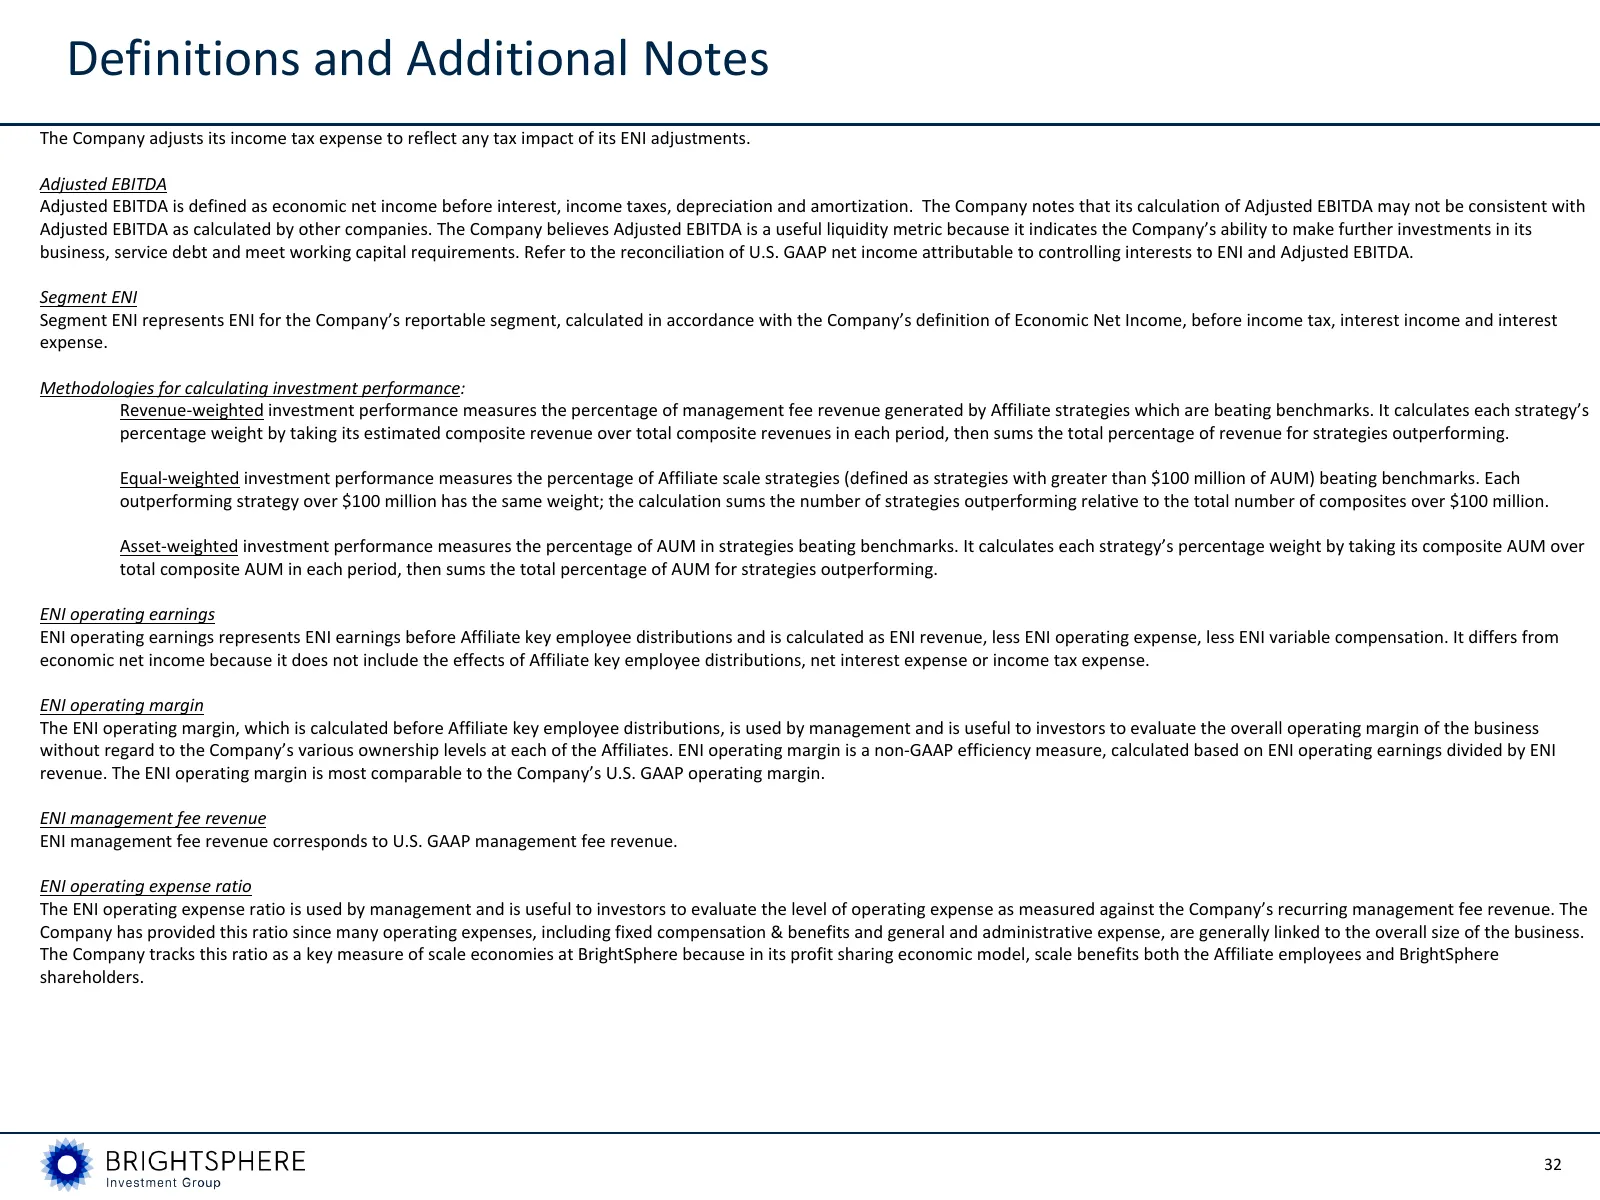
Definitions and Additional Notes The Company adjusts its income tax expense to reflect any tax impact of its ENI adjustments. Adjusted EBITDA Adjusted EBITDA is defined as economic net income before interest, income taxes, depreciation and amortization. The Company notes that its calculation of Adju
Slide 30: Definitions and Additional Notes
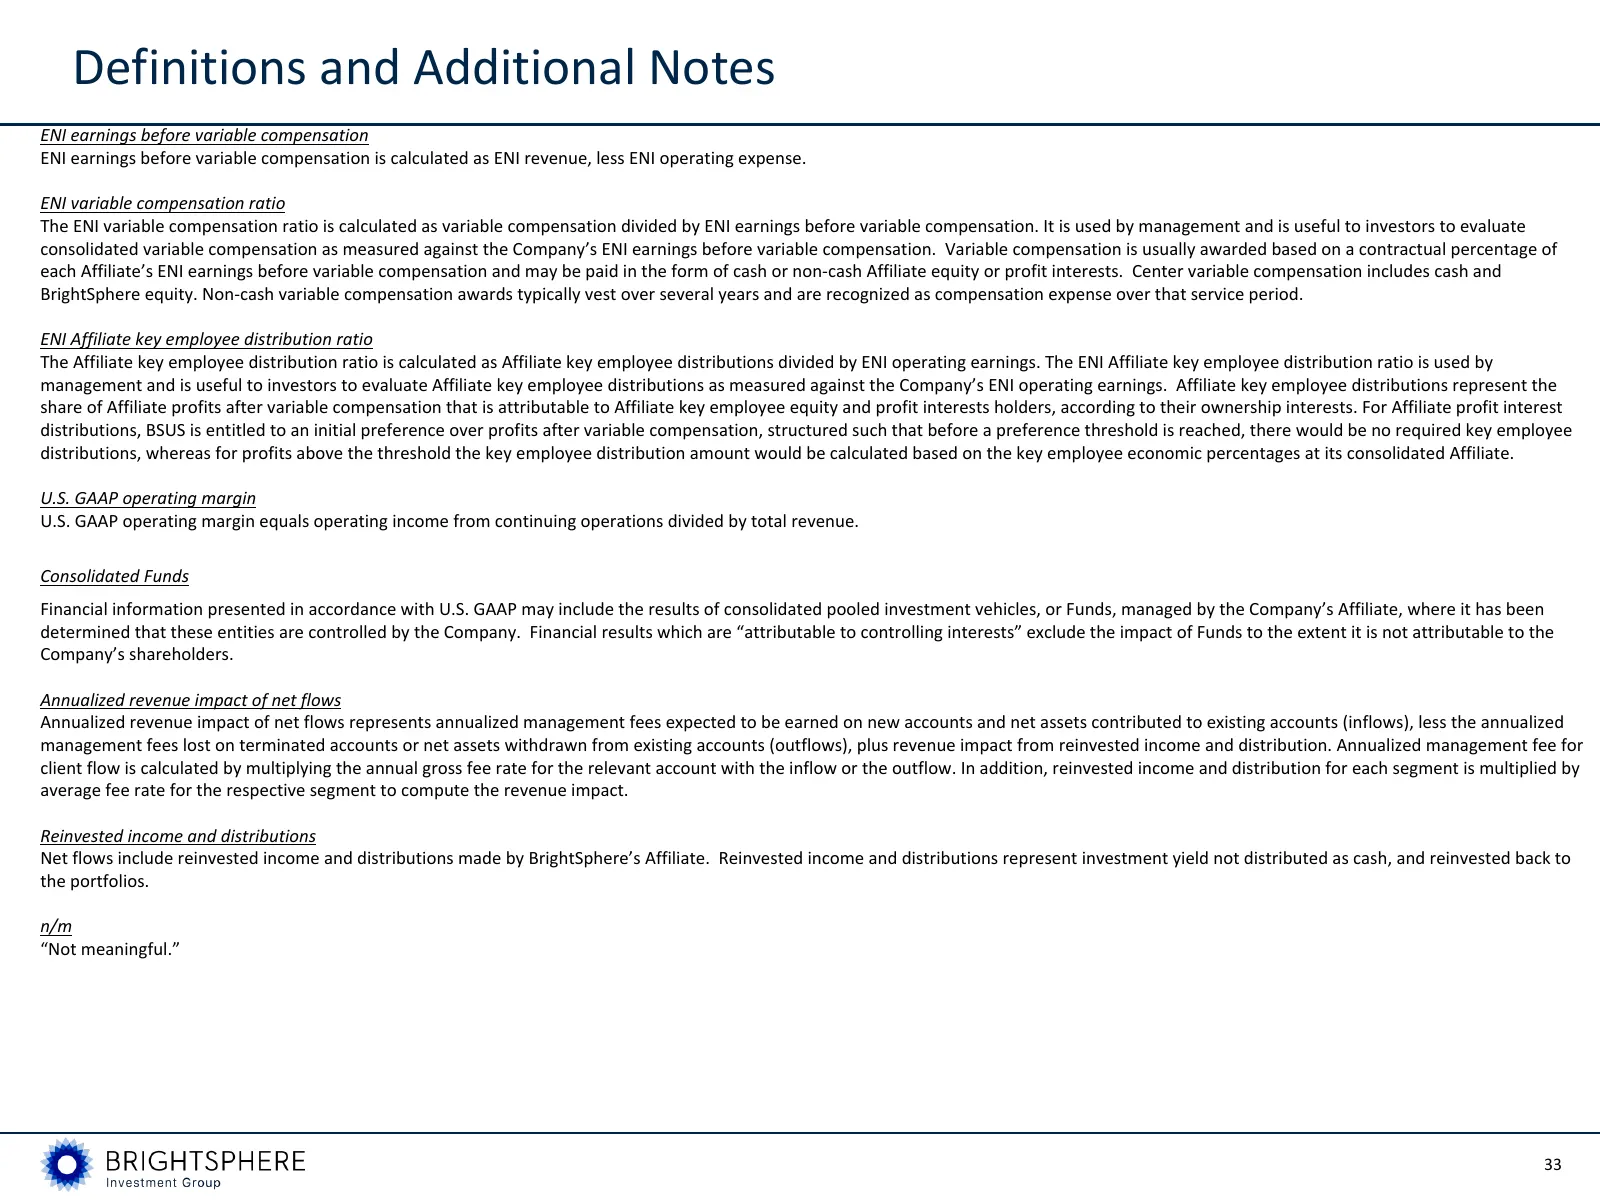
Definitions and Additional Notes ENI earnings before variable compensation ENI earnings before variable compensation is calculated as ENI revenue, less ENI operating expense. ENI variable compensation ratio The ENI variable compensation ratio is calculated as variable compensation divided by ENI ear
Source: company website
More decks from Acadian Asset Management Inc.
 Q3 2026 Earnings Presentation26 slides · Oct 29, 2026
 Q3 2026 Earnings Presentation28 slides · Oct 29, 2026
 Q2 2026 Earnings Presentation28 slides · Jul 30, 2026
 Q2 2026 Earnings Presentation26 slides · Jul 30, 2026
 Investor Day (May 2026)62 slides · May 19, 2026
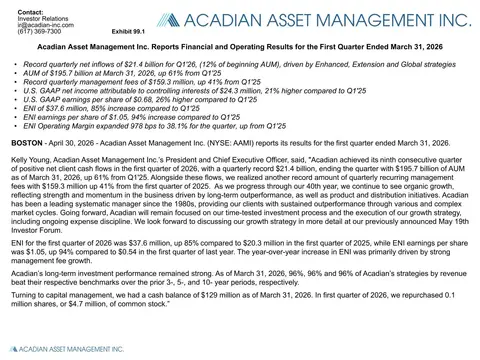 Q1 2026 Earnings Presentation27 slides · Apr 30, 2026