Pacific Mercantile Bancorp — Investor Presentation (February 2015)
20 slides from Pacific Mercantile Bancorp's investor presentation, Feb 9, 2015
Slide 1: Presentation February 2015
PRESENTATION February 2015
Slide 2: Forward Looking Statements
Forward Looking Statements This presentation contains statements regarding our expectations, beliefs and views about our future financial performance and our business, trends and expectations regarding the markets in which we operate, and our future plans. Those statements constitute “forward-lookin
Slide 3: Corporate Overview
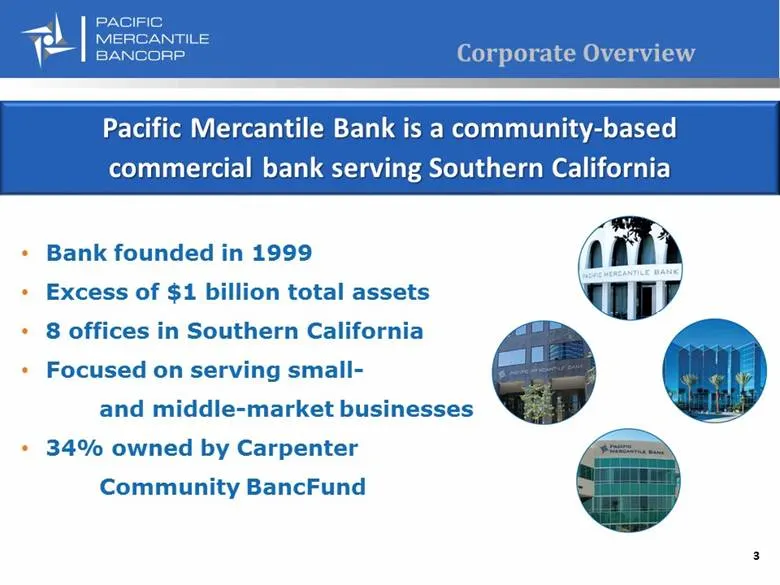
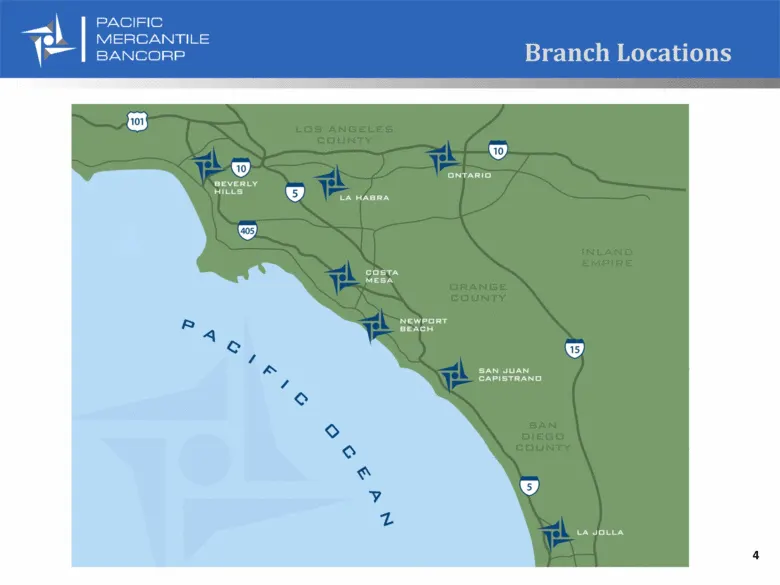
Corporate Overview Bank founded in 1999 Excess of $1 billion total assets 8 offices in Southern California Focused on serving small- and middle-market businesses 34% owned by Carpenter Community BancFund 3
Slide 4: Branch Locations
Branch Locations 4
Slide 5: Investment Highlights
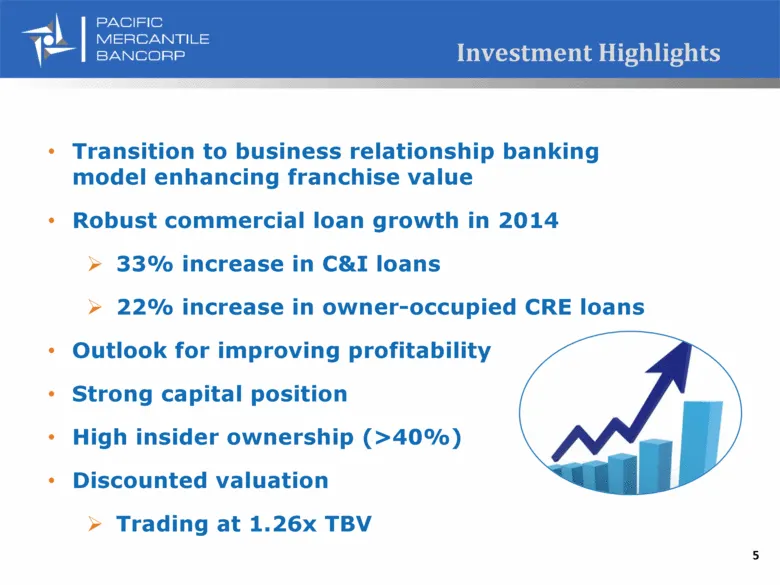
Investment Highlights Transition to business relationship banking model enhancing franchise value Robust commercial loan growth in 2014 33% increase in C&I loans 22% increase in owner-occupied CRE loans Outlook for improving profitability Strong capital position High insider ownership (>40%) Discoun
Slide 6: Core Market Overview
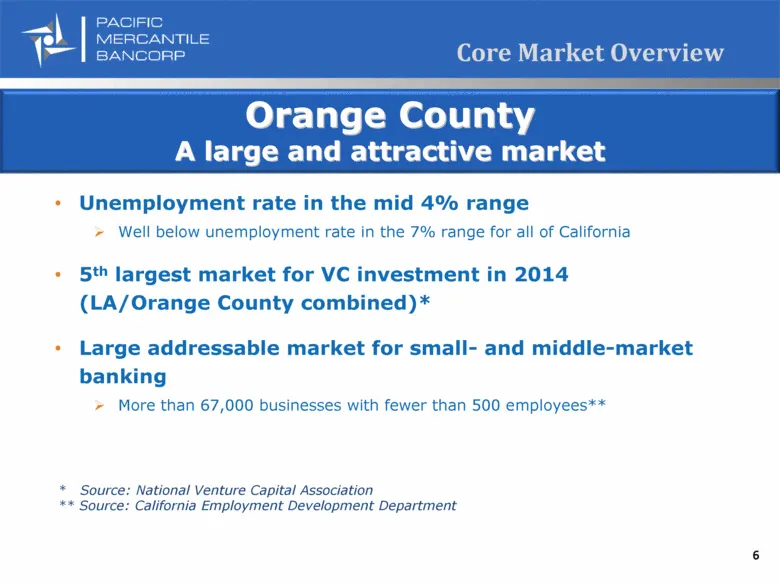
Core Market Overview Unemployment rate in the mid 4% range Well below unemployment rate in the 7% range for all of California 5th largest market for VC investment in 2014 (LA/Orange County combined)* Large addressable market for small- and middle-market banking More than 67,000 businesses with fewer
Slide 7: Strong Executive Team
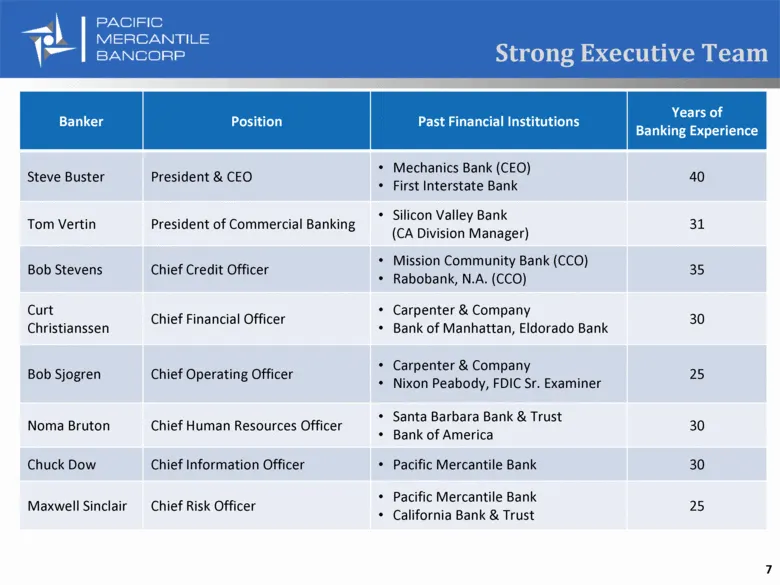
Strong Executive Team Banker Position Past Financial Institutions Years of Banking Experience Steve Buster President & CEO Mechanics Bank (CEO) First Interstate Bank 40 Tom Vertin President of Commercial Banking Silicon Valley Bank (CA Division Manager) 31 Bob Stevens Chief Credit Officer Mission Co
Slide 8: Strong Commercial Banking Team
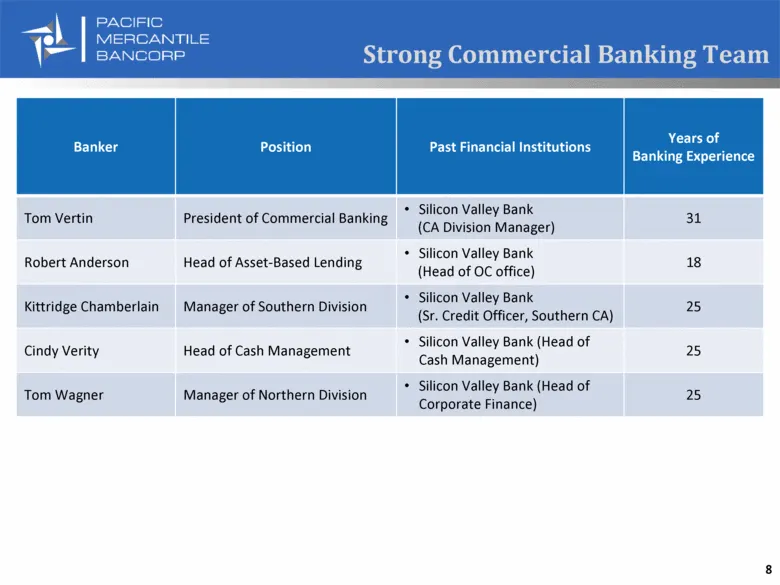
Strong Commercial Banking Team Banker Position Past Financial Institutions Years of Banking Experience Tom Vertin President of Commercial Banking Silicon Valley Bank (CA Division Manager) 31 Robert Anderson Head of Asset-Based Lending Silicon Valley Bank (Head of OC office) 18 Kittridge Chamberlain
Slide 9: Client Profile
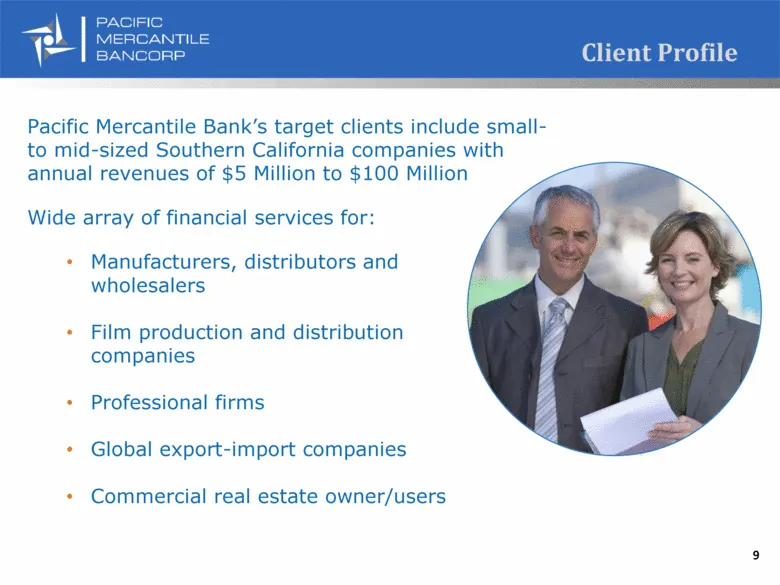
Client Profile Pacific Mercantile Bank’s target clients include small- to mid-sized Southern California companies with annual revenues of $5 Million to $100 Million Wide array of financial services for: Manufacturers, distributors and wholesalers Film production and distribution companies Profession
Slide 10: Balance Sheet Overview: Loans, Deposits, Asset Quality, Capital
Balance Sheet Overview: Loans, Deposits, Asset Quality, Capital
Slide 11: Loan Portfolio: Focused on Relationship Lending
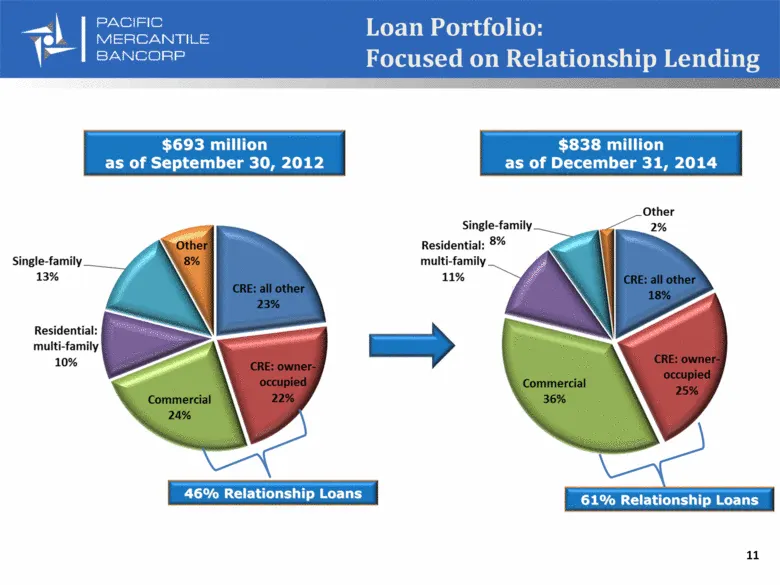
Loan Portfolio: Focused on Relationship Lending $838 million as of December 31, 2014 $693 million as of September 30, 2012 46% Relationship Loans 61% Relationship Loans 11
Slide 12: Continuing Growth in Relationship Loans
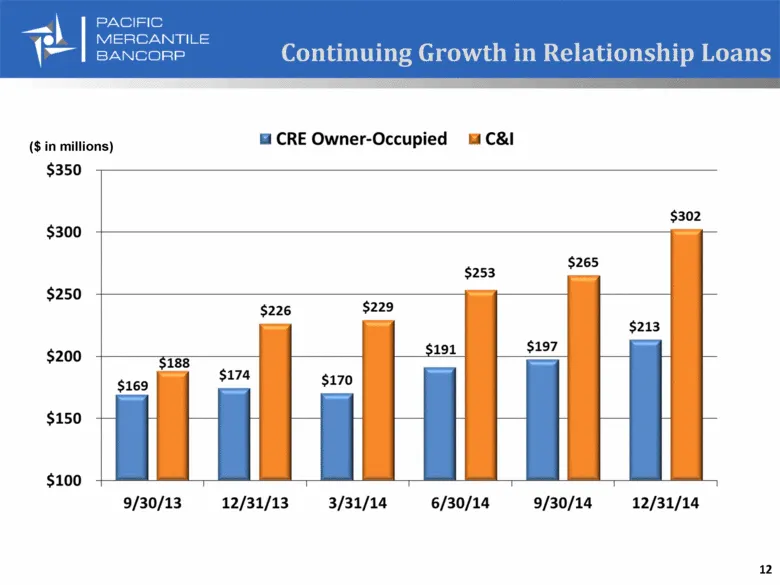
Continuing Growth in Relationship Loans 12 ($ in millions)
Slide 13: Deposit Composition: Focused on Core Deposits
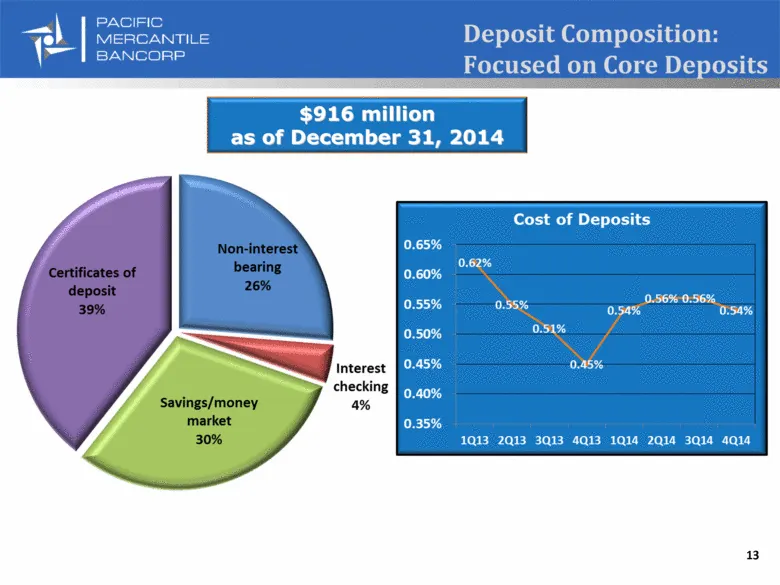
Deposit Composition: Focused on Core Deposits $916 million as of December 31, 2014 13
Slide 14: Improving Asset Quality
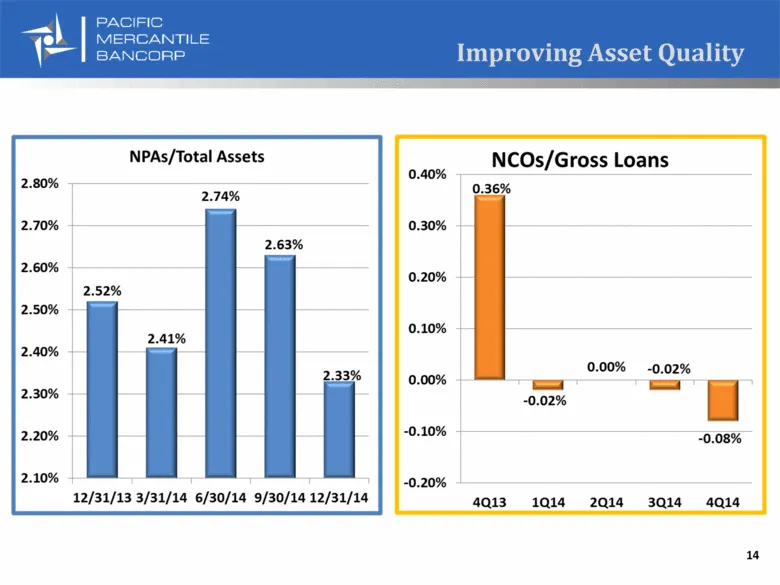
PACIFIC MERCANTILE . . BANCORP Improving Asset Quality NPAs/Total Assets NCOs/Gross Loans Z74a% 0.36% 2.52% 2.41% 12/31/13 3/31/14 6/30/14 9/30/14 12/31/14 4013 1014 2Q14 1“
Slide 15: Strong Capital Position
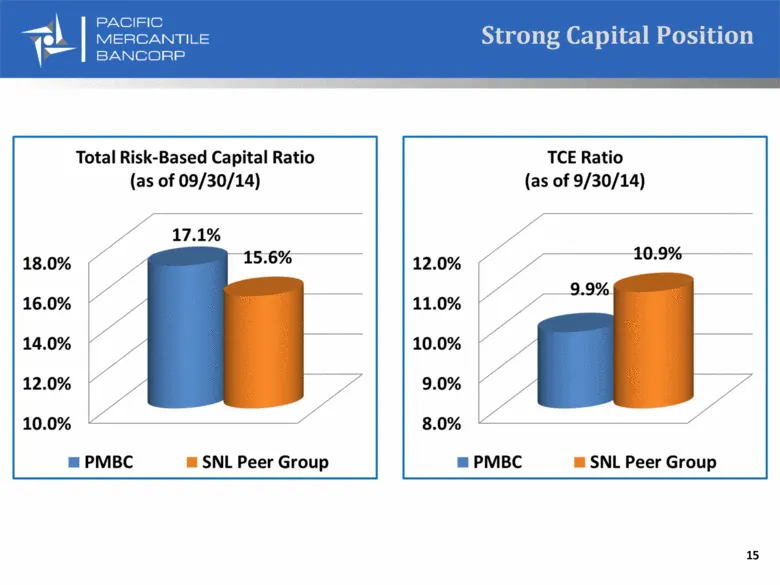
Strong Capital Position Total Risk-Based Capital Ratio (as of 09/30/14) 17.1% 18.0% 15.6% 16.0% 14.0% 12.0% 10.0% m= PMBC ™ SNL Peer Group 12.0% 11.0% 10.0% 9.0% 8.0% m= PMBC TCE Ratio (as of 9/30/14) 10.9% 9.9% | SNL Peer Group 15
Slide 16: Growth Strategies: Improve Profits & Expand Business Relationships
GROWTH STRATEGIES: Improve Profits & Expand Business Relationships
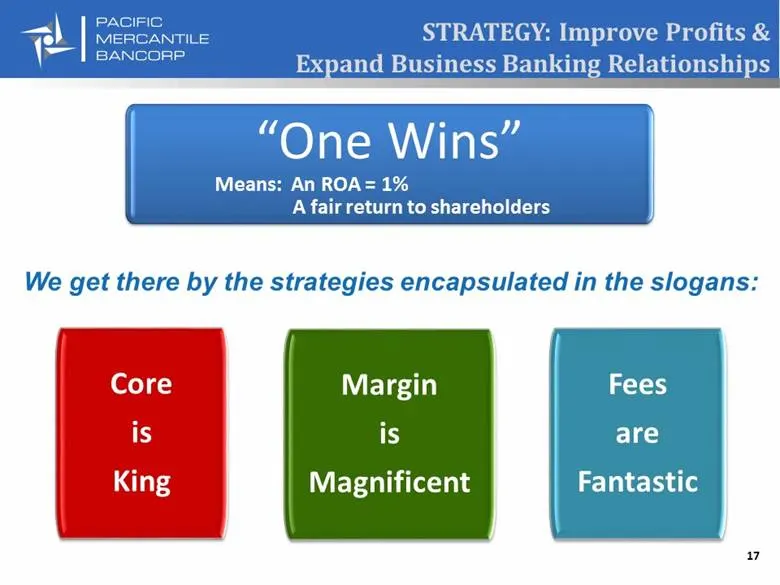
Slide 17: Strategy: Improve Profits & Expand Business Banking Relationships
STRATEGY: Improve Profits & Expand Business Banking Relationships We get there by the strategies encapsulated in the slogans: “One Wins” Means: An ROA = 1% A fair return to shareholders Core is King Margin is Magnificent Fees are Fantastic 17
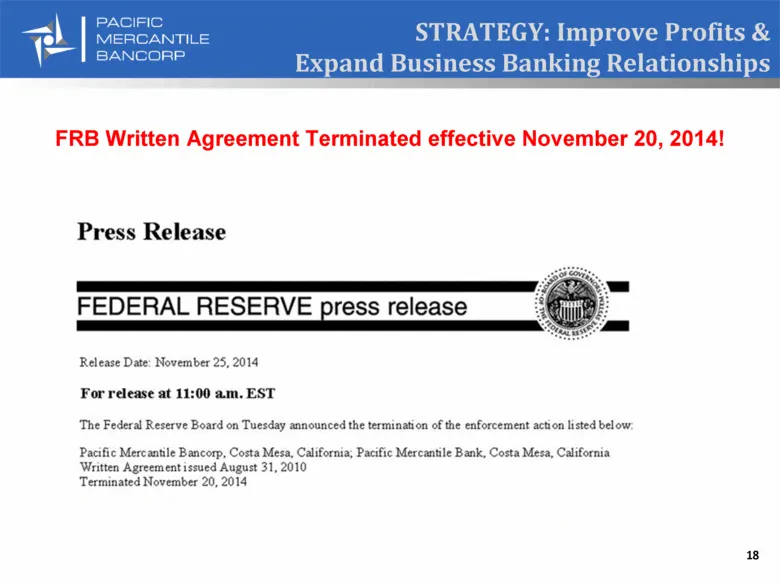
Slide 18: FRB Written Agreement Terminated
STRATEGY: Improve Profits & Expand Business Banking Relationships 18 FRB Written Agreement Terminated effective November 20, 2014!
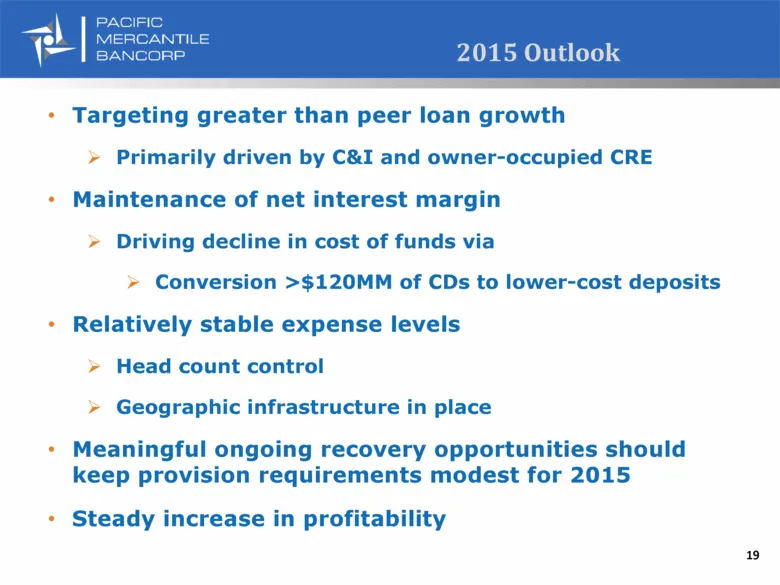
Slide 19: 2015 Outlook
2015 Outlook Targeting greater than peer loan growth Primarily driven by C&I and owner-occupied CRE Maintenance of net interest margin Driving decline in cost of funds via Conversion >$120MM of CDs to lower-cost deposits Relatively stable expense levels Head count control Geographic infrastructure i

Slide 20: Wives
Wives MERCANTILE &A
Source: SEC EDGAR · 8-K filed Feb 9, 2015
More decks from Pacific Mercantile Bancorp
 Q1 2021 Earnings Presentation18 slides · Apr 26, 2021
 Merger or Acquisition (March 2021)9 slides · Mar 23, 2021
 Q4 2020 Earnings Presentation22 slides · Jan 25, 2021
 Q3 2020 Earnings Presentation23 slides · Nov 2, 2020
 Corporate Update (September 2020)25 slides · Sep 8, 2020
 Corporate Update (August 2020)25 slides · Aug 5, 2020