PVA TePla AG · XETR:TPE
PVA TePla — Investor Presentation (September 2023)
31 slides from PVA TePla's investor presentation, Sep 14, 2023
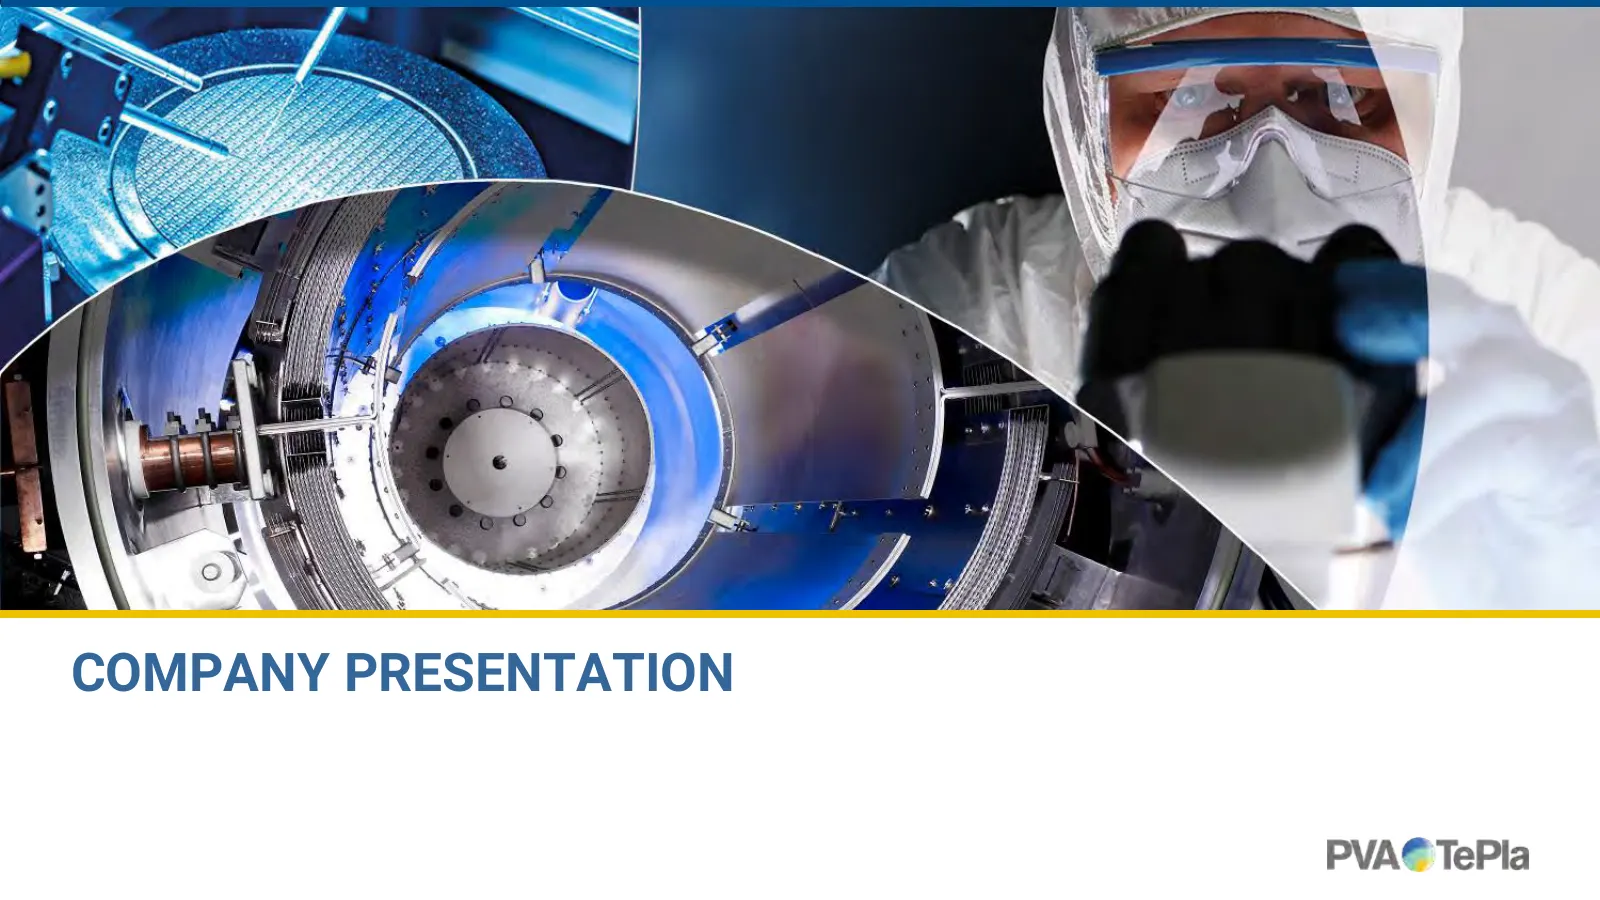
Slide 1: Company Presentation
i\ “y x COMPANY PRESENTATION PVA€ TePla
Slide 2: Agenda
AGENDA WHO WE ARE WHERE WE ARE GOING FINANCIAL HIGHLIGHTS H1 2023 2
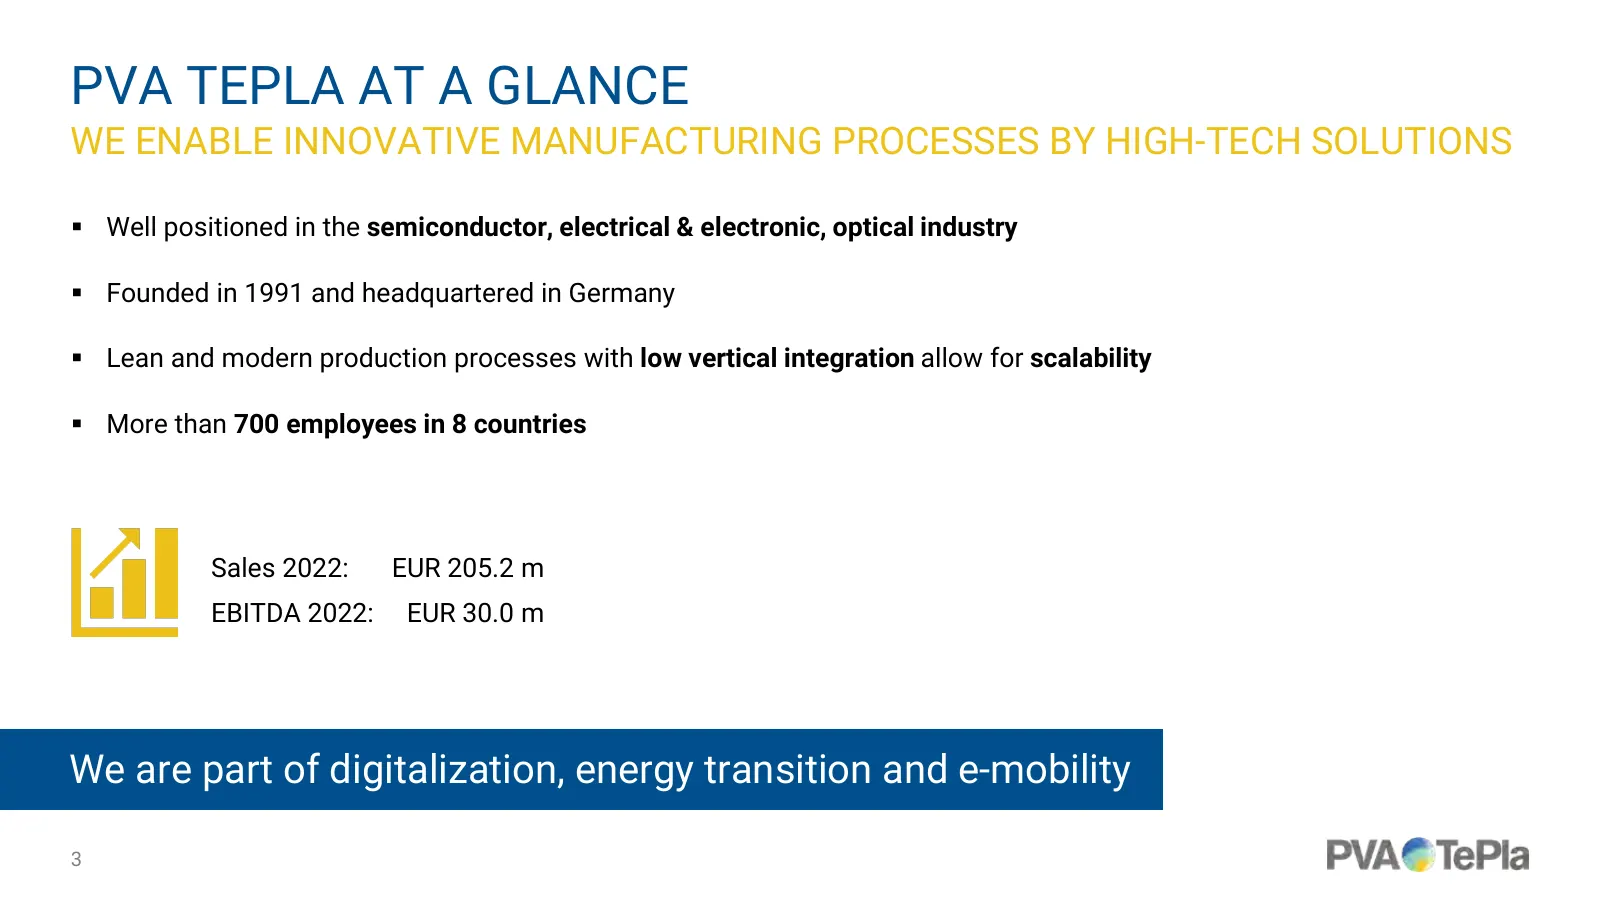
Slide 3: PVA TePla at a Glance
PVA TEPLA AT A GLANCE WE ENABLE INNOVATIVE MANUFACTURING PROCESSES BY HIGH-TECH SOLUTIONS Well positioned in the semiconductor, electrical & electronic, optical industry Founded in 1991 and headquartered in Germany Lean and modern production processes with low vertical integration allow for sc
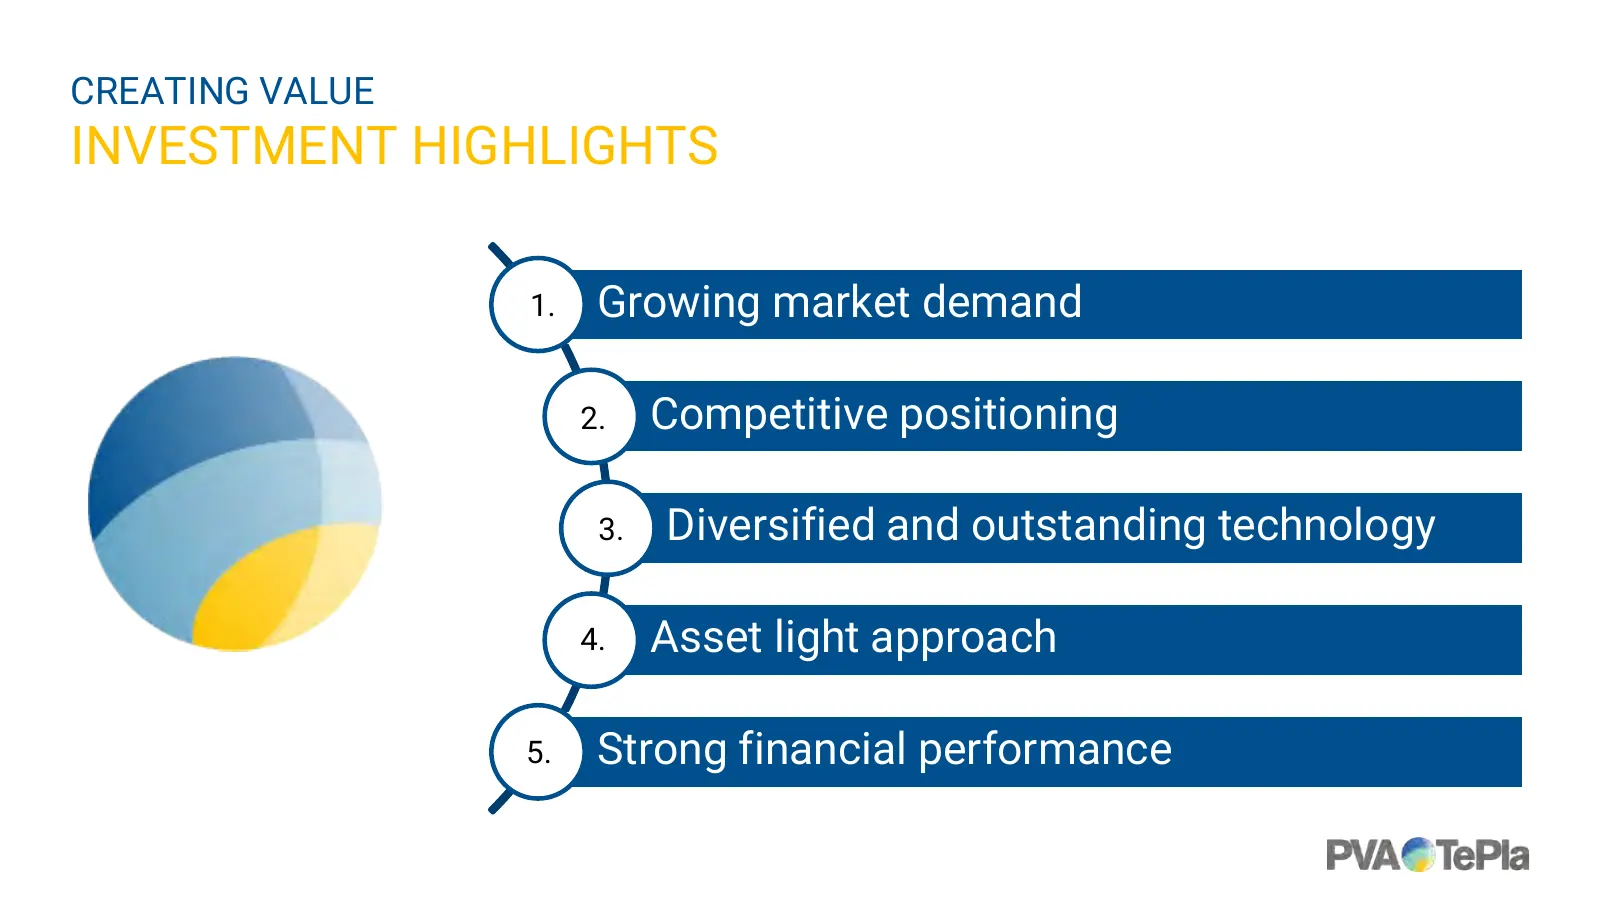
Slide 4: Investment Highlights
CREATING VALUE INVESTMENT HIGHLIGHTS 1. Growing market demand 2. Competitive positioning 3. Diversified and outstanding technology 4. Asset light approach 5. Strong financial performance
Slide 5: How We Have Evolved
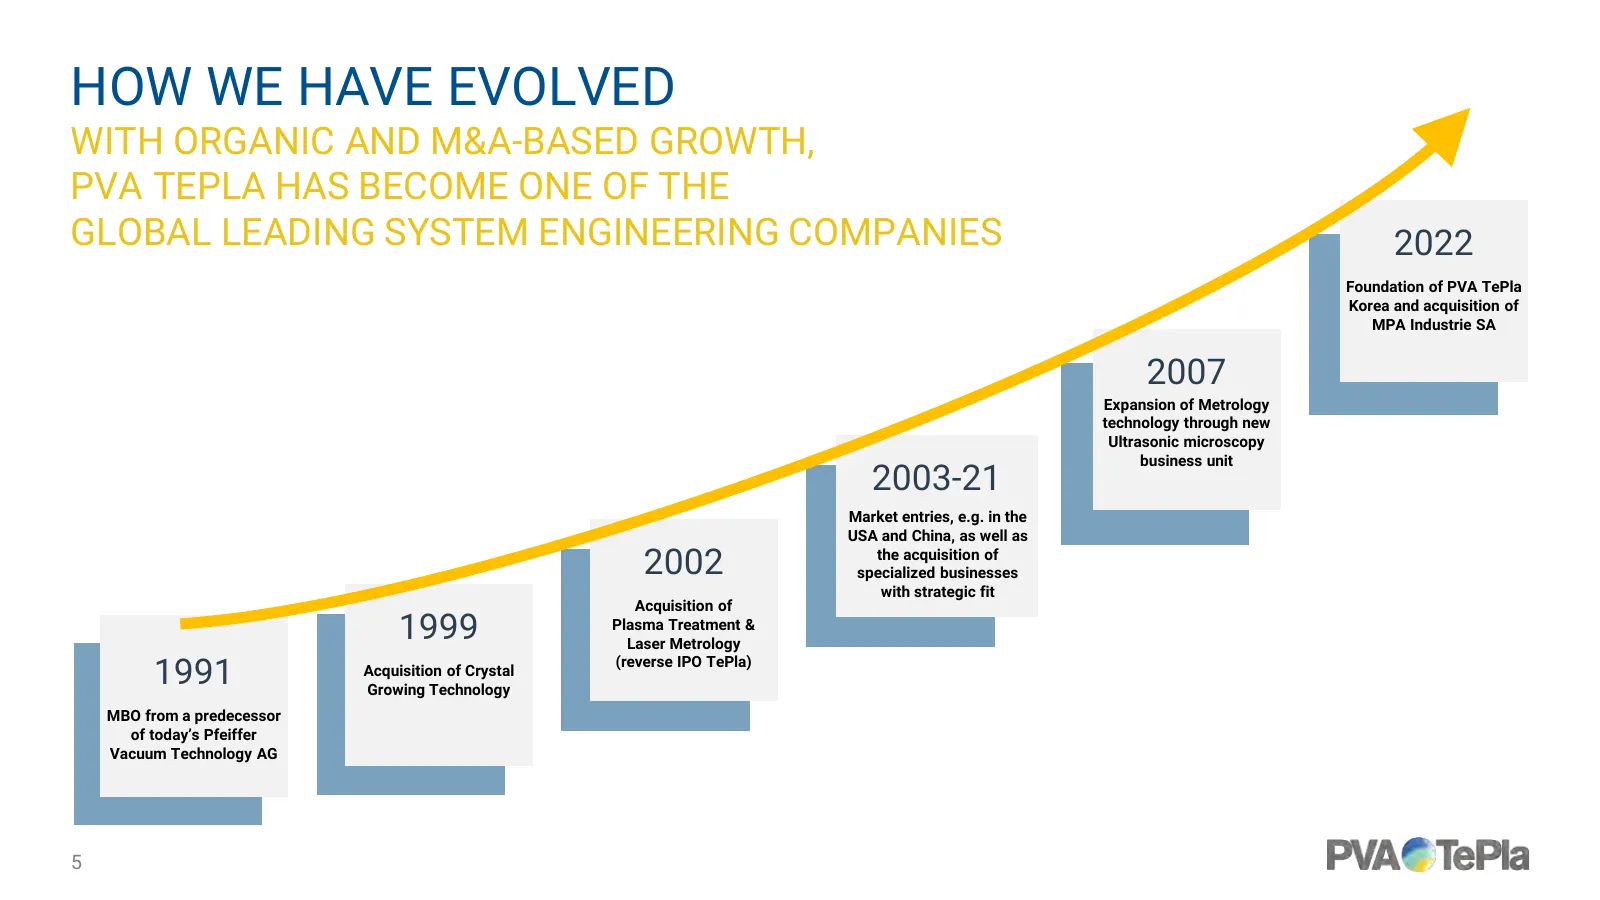
HOW WE HAVE EVOLVED WITH ORGANIC AND M&A-BASED GROWTH, PVA TEPLA HAS BECOME ONE OF THE GLOBAL LEADING SYSTEM ENGINEERING COMPANIES 2022 Foundation of PVA TePla Korea and acquisition of MPA Industrie SA 2007 Expansion of Metrology technology through new Ultrasonic microscopy business unit 2003-21 Mar
Slide 6: Committed to Sustainability
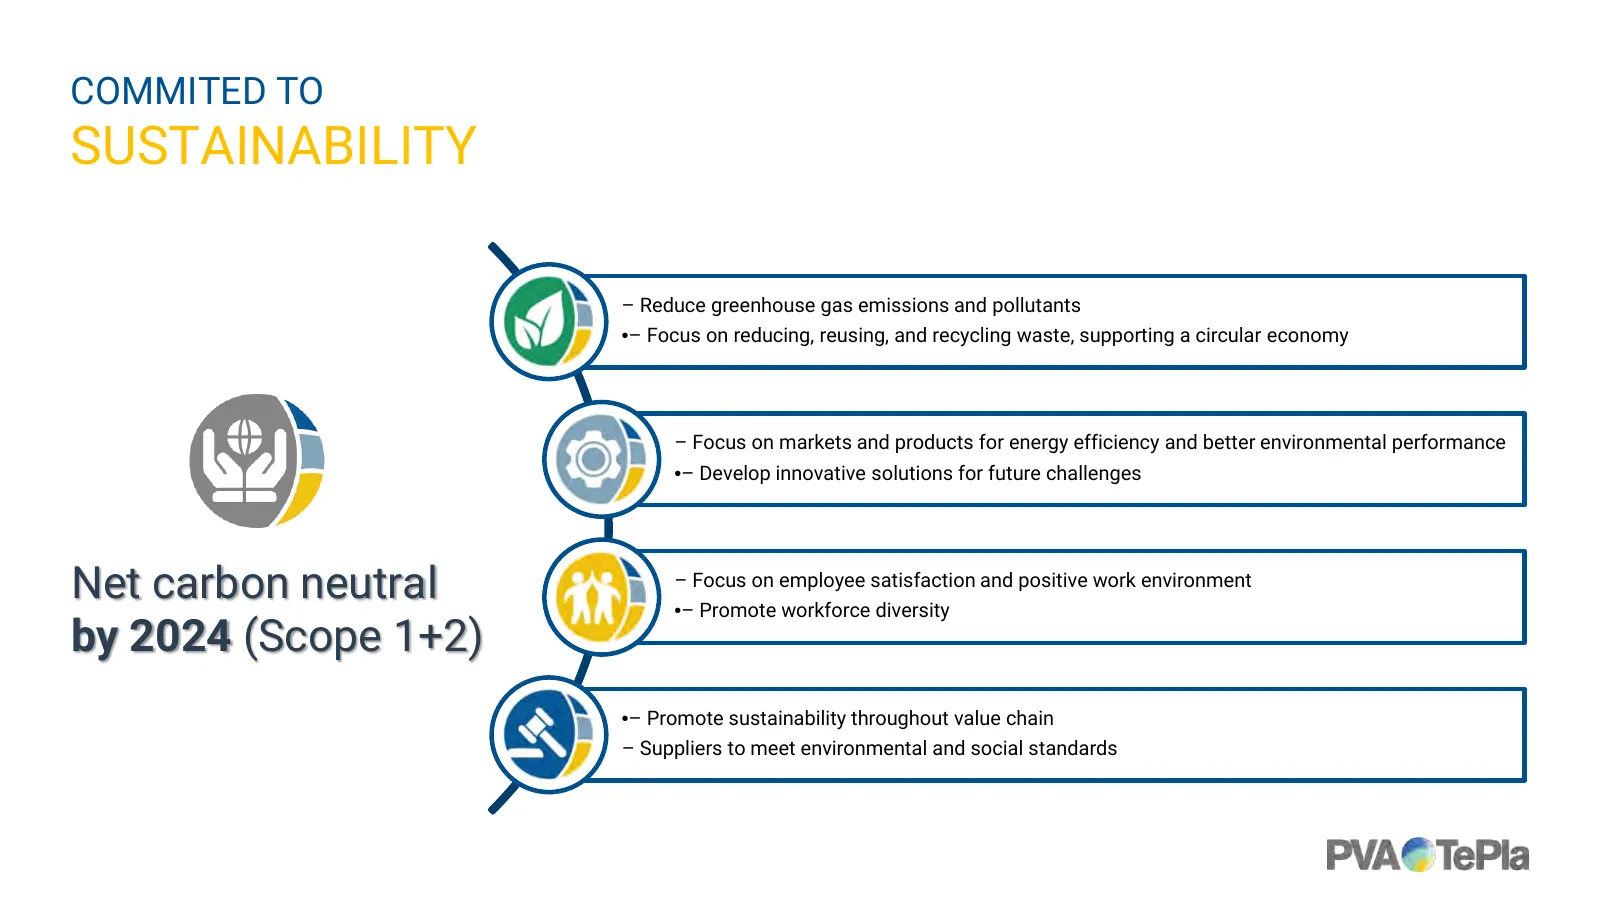
COMMITED TO SUSTAINABILITY – Reduce greenhouse gas emissions and pollutants •– Focus on reducing, reusing, and recycling waste, supporting a circular economy – Focus on markets and products for energy efficiency and better environmental performance •– Develop innovative solutions for future challeng
Slide 7: PVA TePla Today: Global Reach with Strong Presence
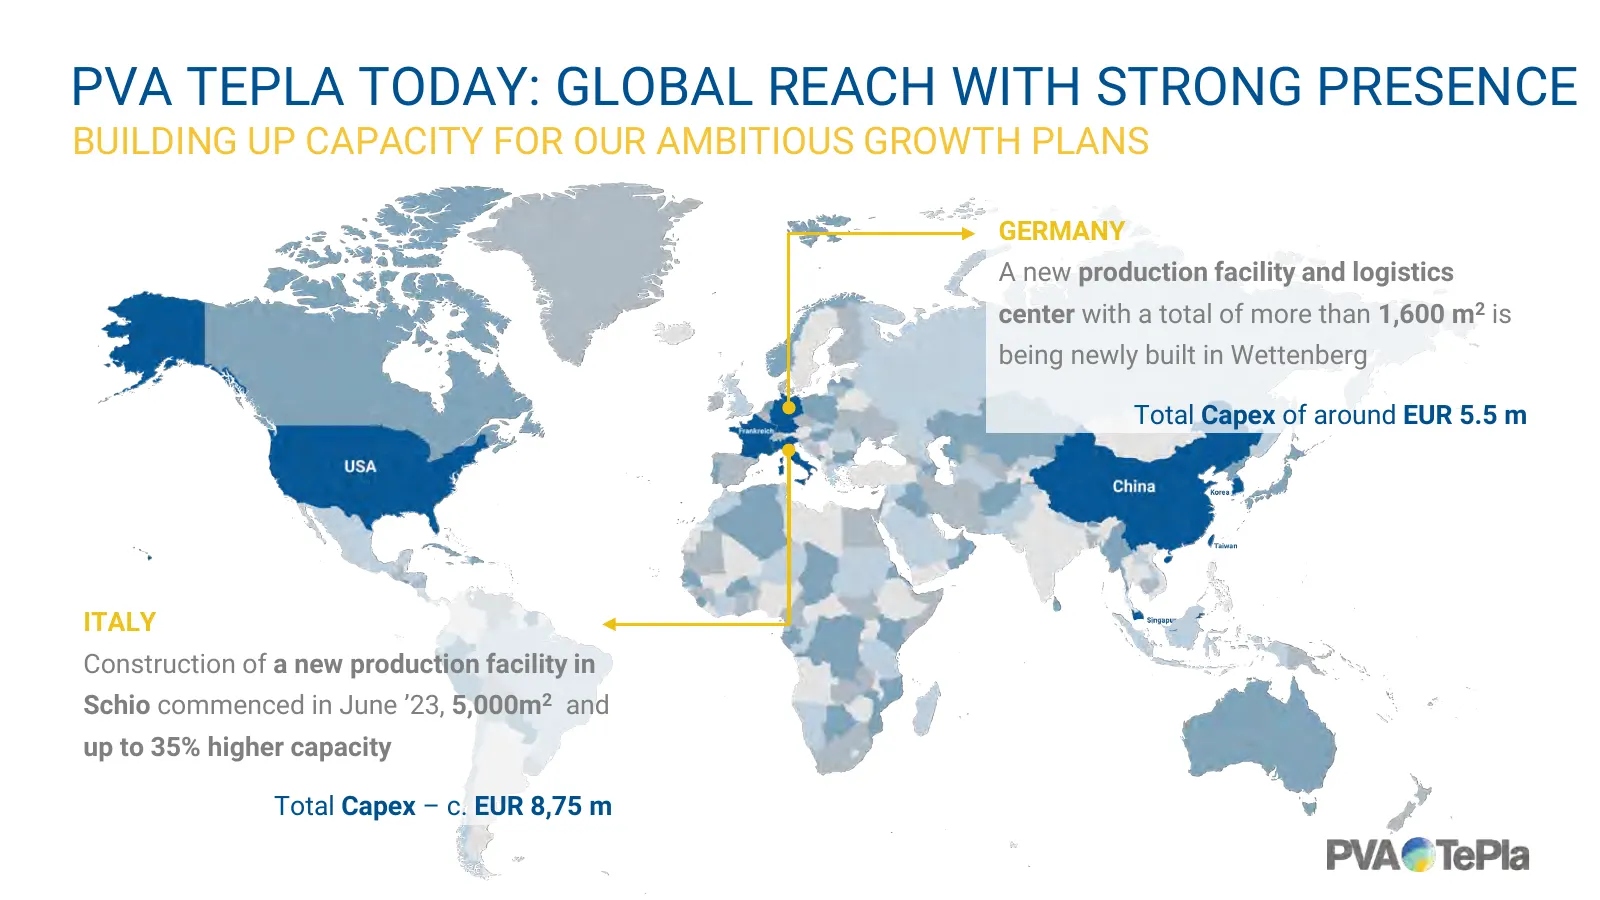
PVA TEPLA TODAY: GLOBAL REACH WITH STRONG PRESENCE BUILDING UP CAPACITY FOR OUR AMBITIOUS GROWTH PLANS GERMANY A new production facility and logistics center with a total of more than 1,600 m2 is being newly built in Wettenberg Total Capex of around EUR 5.5 m ITALY Construction of a new production f
Slide 8: Broad Portfolio of Innovative Solutions
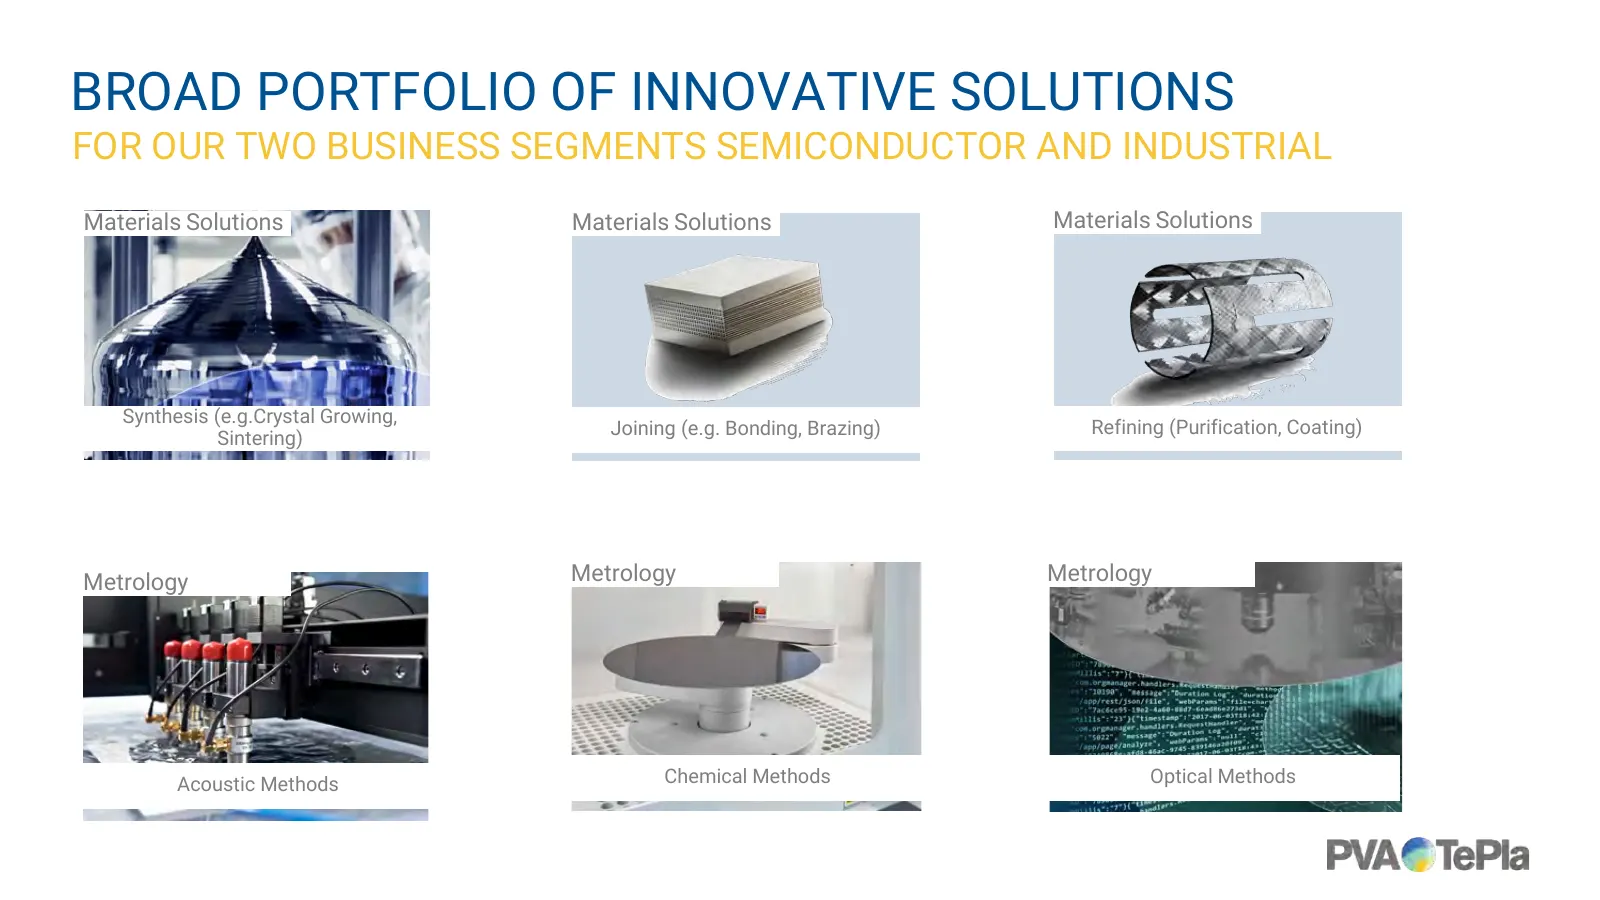
BROAD PORTFOLIO OF INNOVATIVE SOLUTIONS FOR OUR TWO BUSINESS SEGMENTS SEMICONDUCTOR AND INDUSTRIAL Materials Solutions Materials Solutions Materials Solutions Synthesis (e.g.Crystal Growing, Joining (e.g. Bonding, Brazing) Refining (Purification, Coating) Sintering) Metrology Metrology Metrology Aco
Slide 9: Materials Solutions
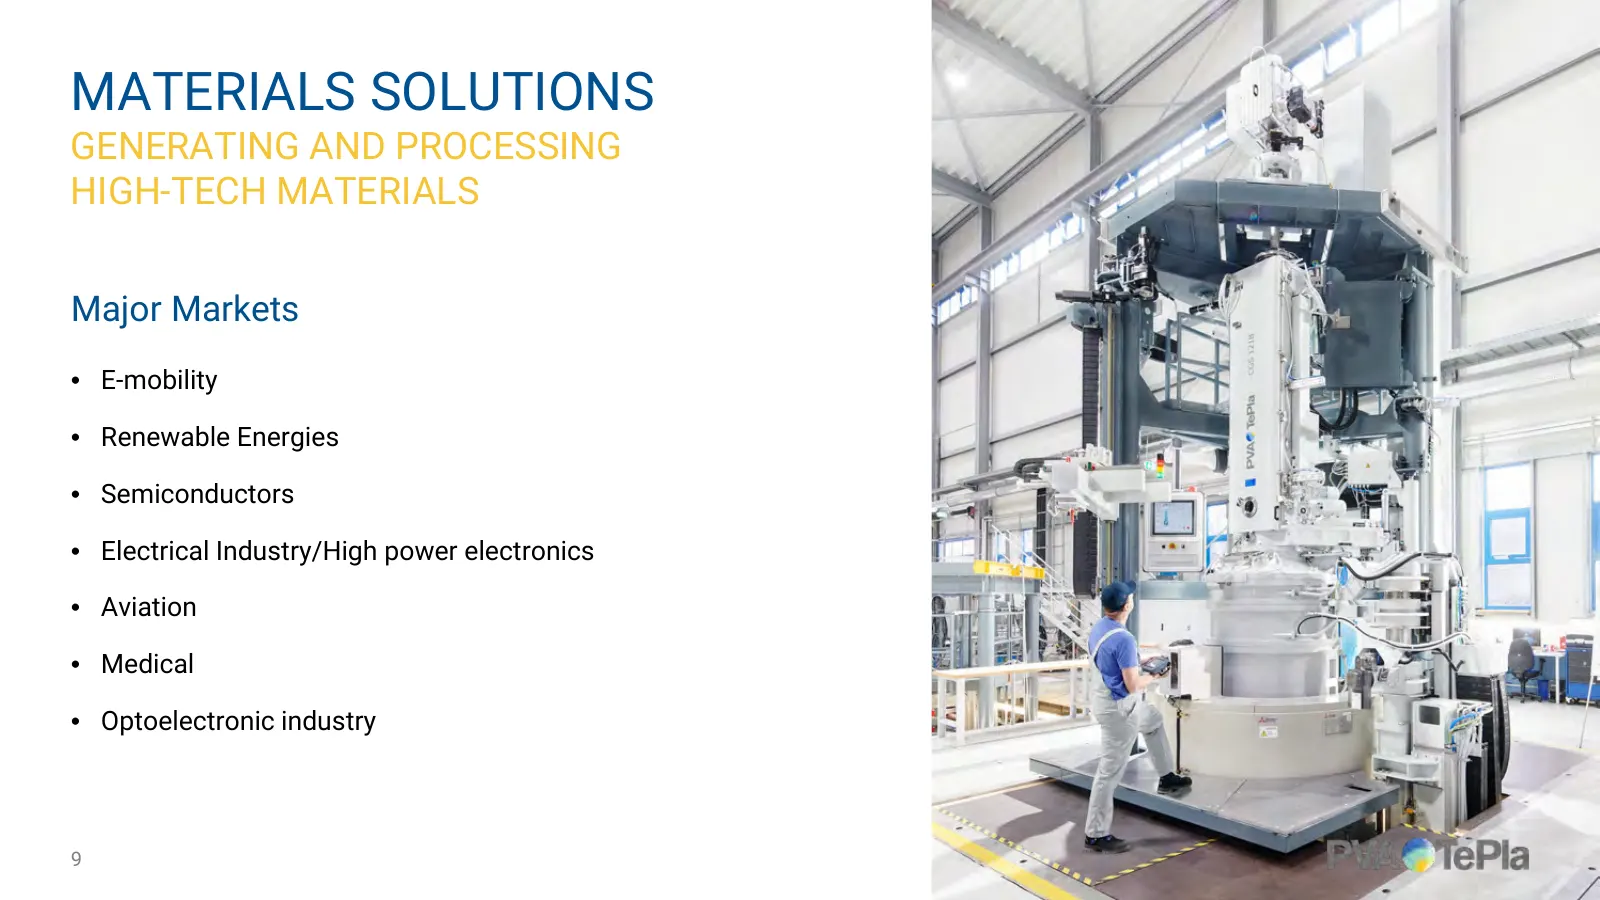
MATERIALS SOLUTIONS GENERATING AND PROCESSING HIGH-TECH MATERIALS Major Markets • E-mobility • Renewable Energies • Semiconductors • Electrical Industry/High power electronics • Aviation • Medical • Optoelectronic industry 9
Slide 10: Metrology Systems
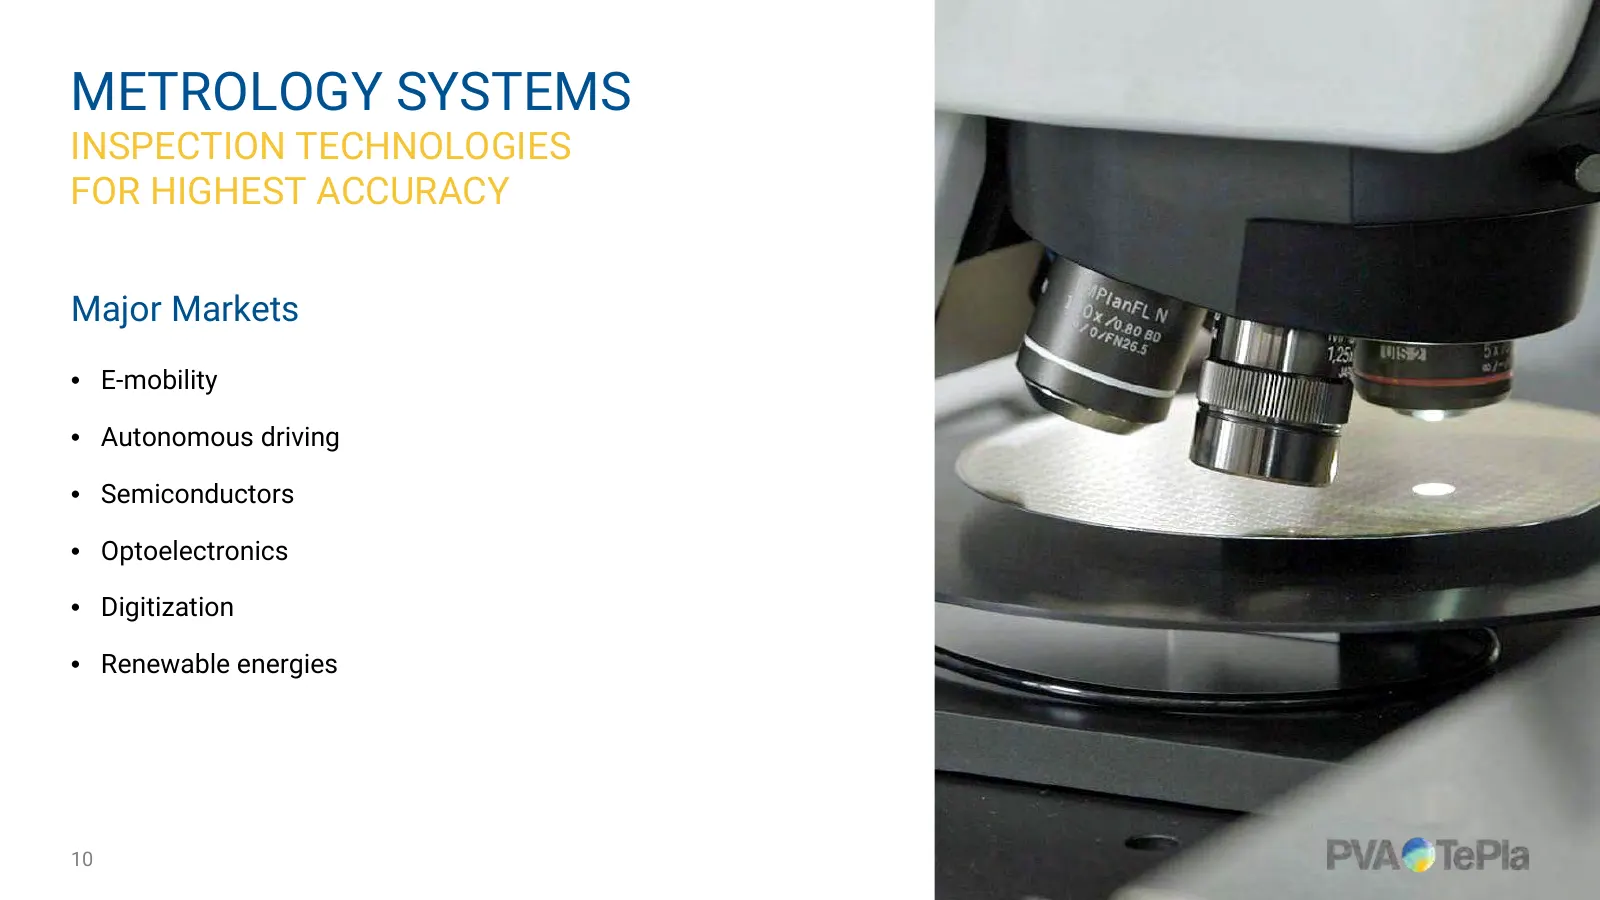
METROLOGY SYSTEMS INSPECTION TECHNOLOGIES FOR HIGHEST ACCURACY Major Markets • E-mobility • Autonomous driving • Semiconductors • Optoelectronics • Digitization • Renewable energies 10
Slide 11: Revenue Split by Product Categories
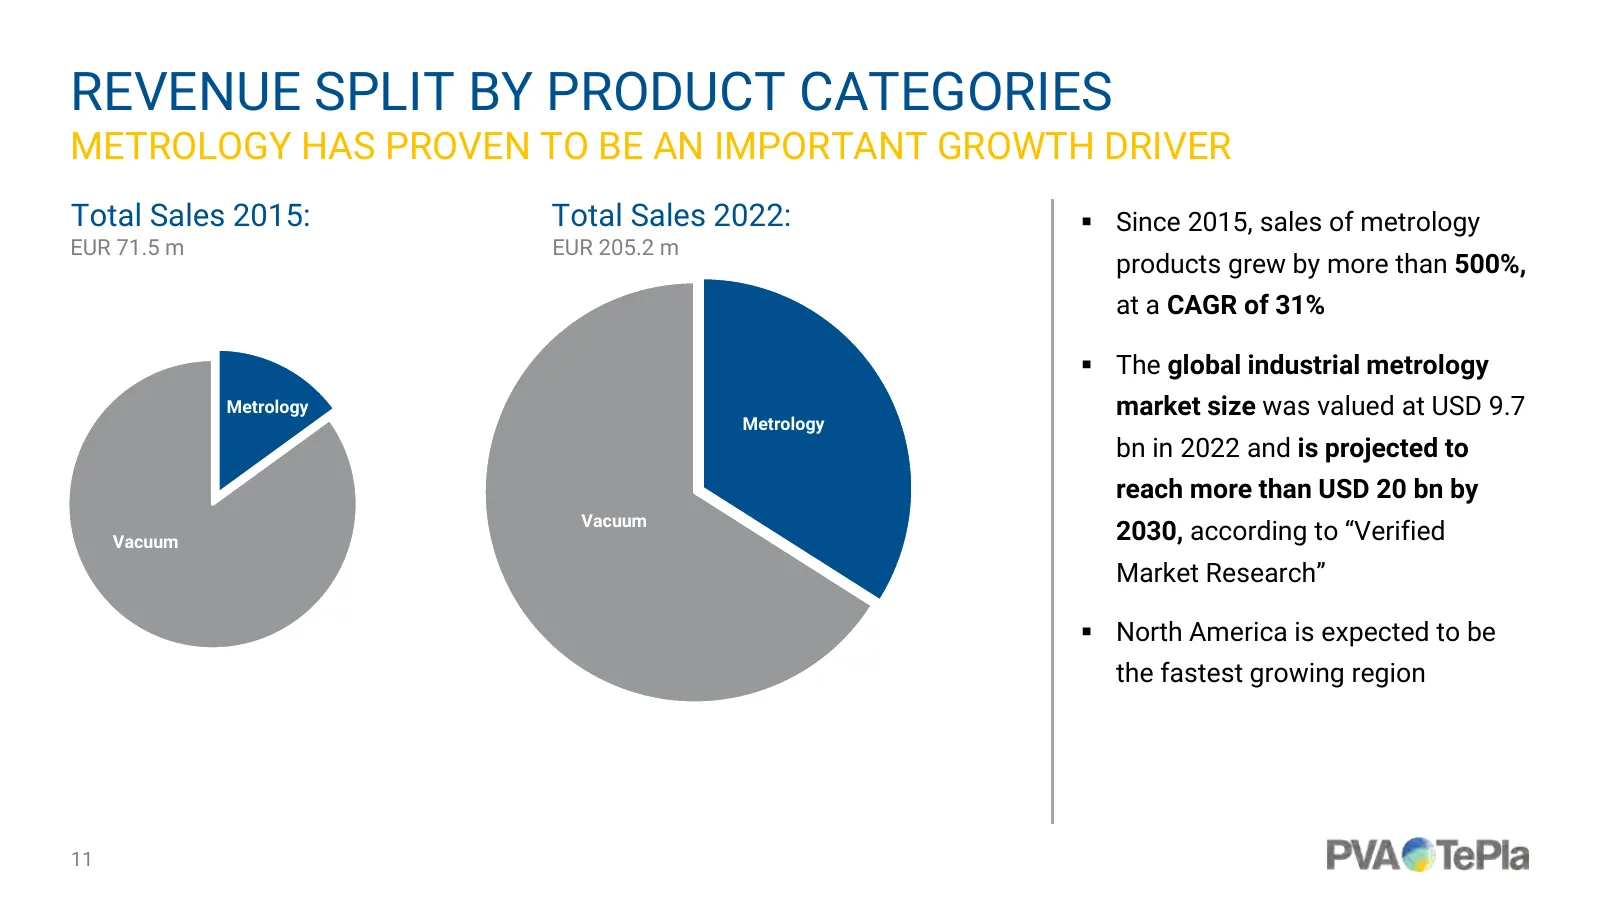
REVENUE SPLIT BY PRODUCT CATEGORIES METROLOGY HAS PROVEN TO BE AN IMPORTANT GROWTH DRIVER Total Sales 2015: Total Sales 2022: Since 2015, sales of metrology EUR 71.5 m EUR 205.2 m products grew by more than 500%, at a CAGR of 31% The global industrial metrology Metrology market size was valued a
Slide 12: Agenda
AGENDA WHO WE ARE WHERE WE ARE GOING FINANCIAL HIGHLIGHTS H1 2023 12
Slide 13: Positioned for Sustainable and Profitable Growth
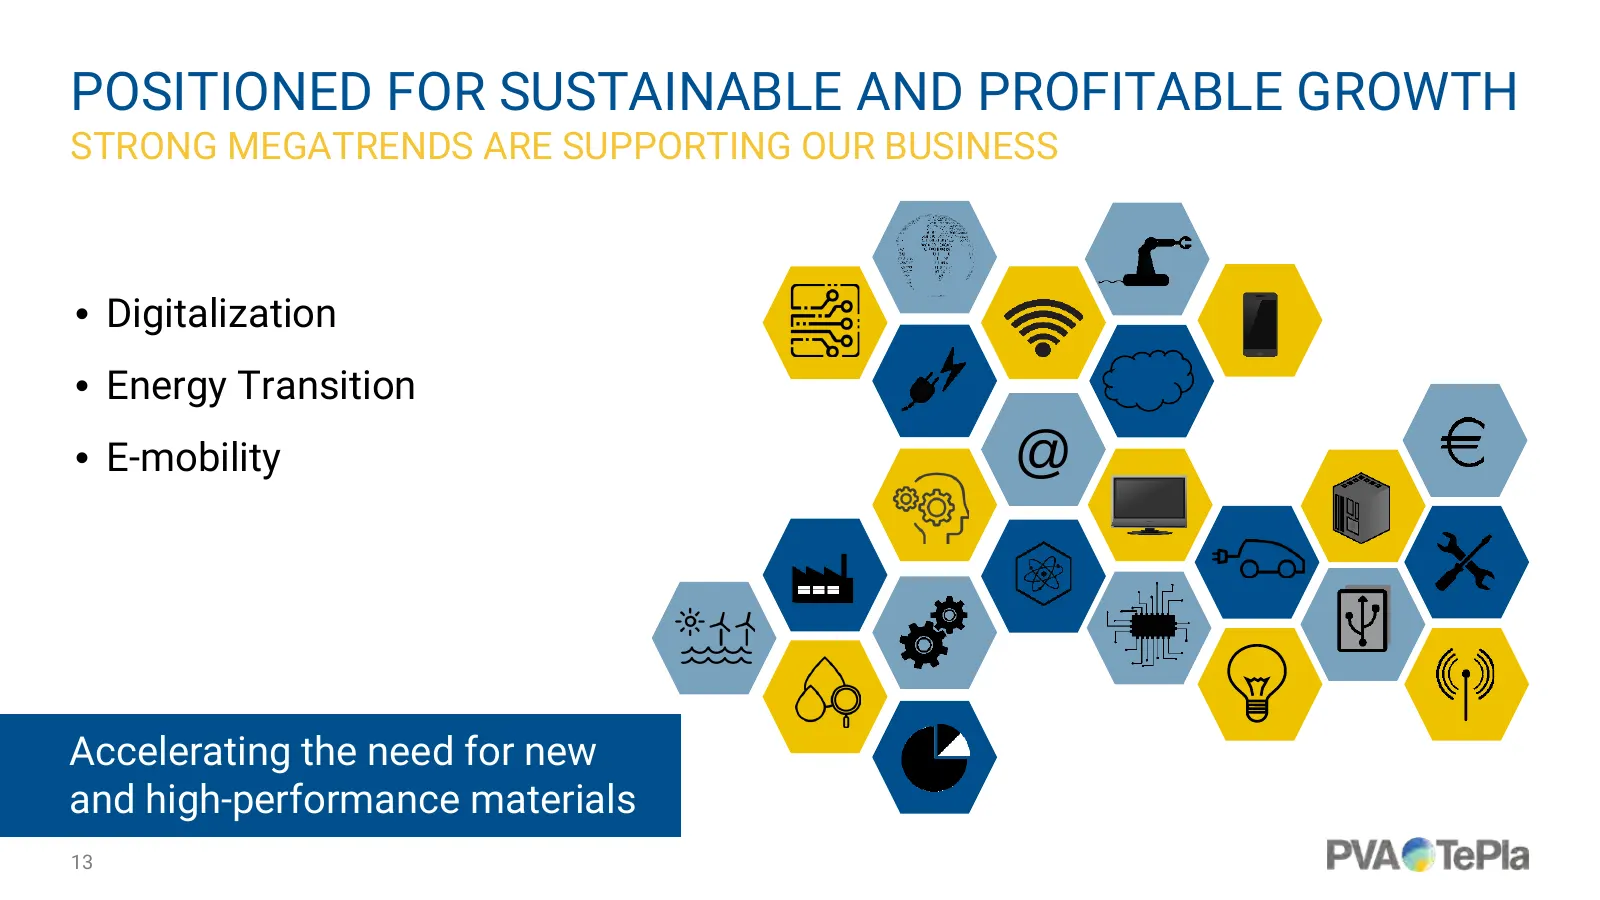
POSITIONED FOR SUSTAINABLE AND PROFITABLE GROWTH STRONG MEGATRENDS ARE SUPPORTING OUR BUSINESS • Digitalization • Energy Transition • E-mobility @ Accelerating the need for new and high-performance materials 13
Slide 14: Innovation Drives Future Growth
INNOVATION DRIVES FUTURE GROWTH EVOLVING AS A SOLUTION PROVIDER Our key research areas: Process development Product automation Integration of AI solutions Productivity and efficiency gains Efficiently addressing our customer’s needs 14
Slide 15: Example: Silicon Carbide
EXAMPLE: SILICON CARBIDE THE NEXT GENERATION MATERIAL Benefits of the material Reduced power losses & energy saving Less heat & higher heat resistance Smaller & greater efficiency Relevant PVA TePla-Technologies Crystal Growing Metrology Cleaning Coating 15
Slide 16: We Will Prepare Our Organization for the Growing Future Markets
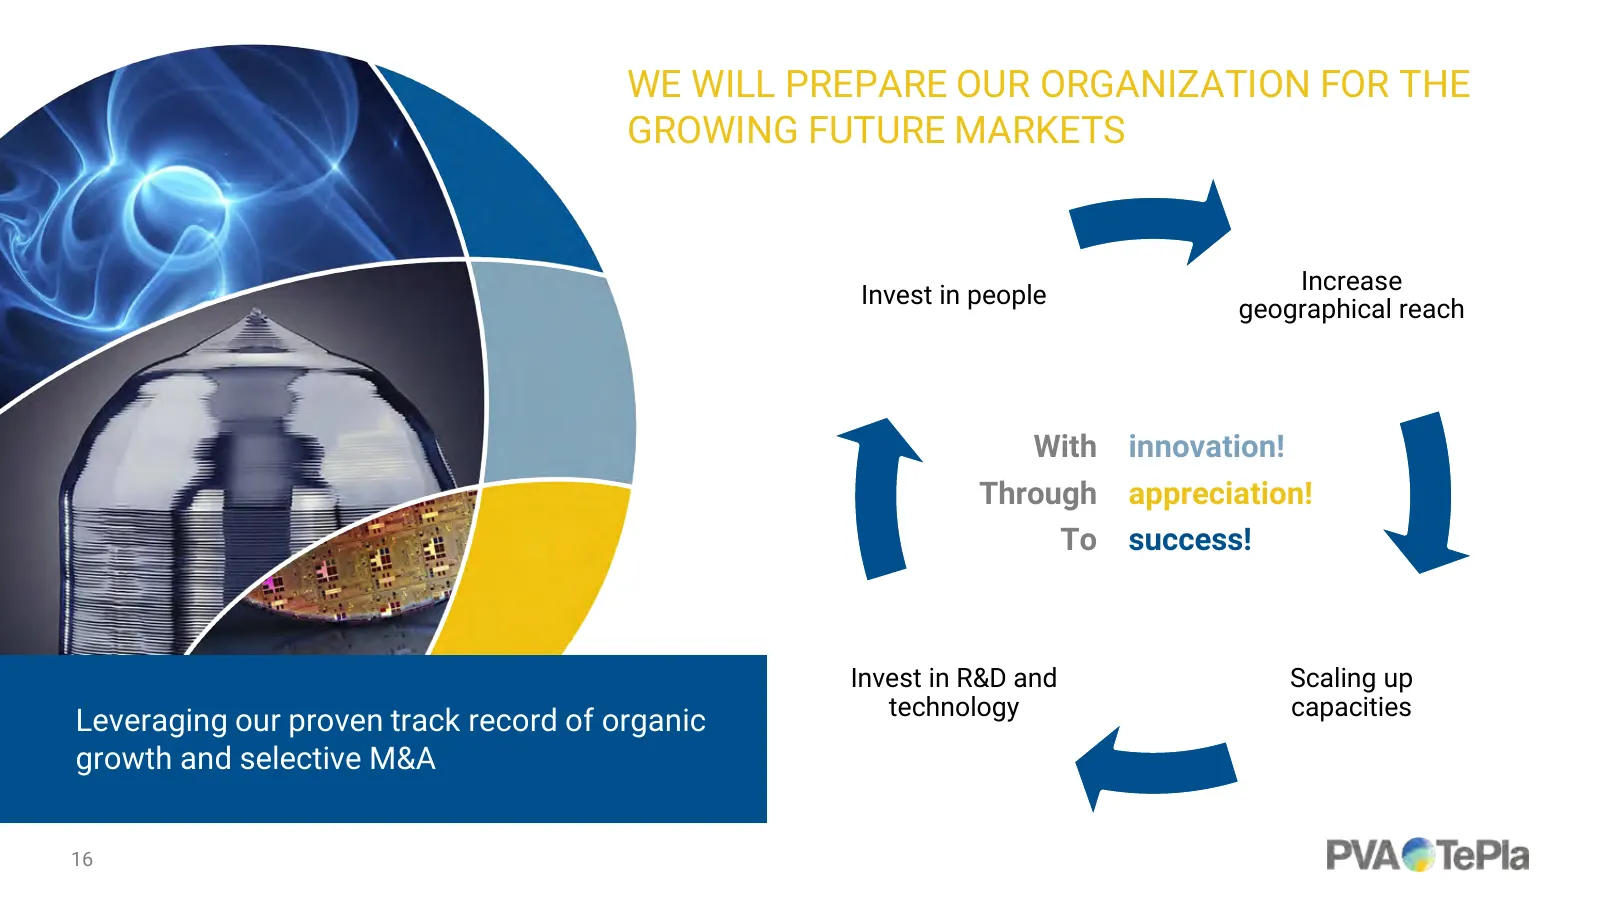
WE WILL PREPARE OUR ORGANIZATION FOR THE GROWING FUTURE MARKETS Increase Invest in people geographical reach With innovation! Through appreciation! To success! Invest in R&D and Scaling up technology capacities Leveraging our proven track record of organic growth and selective M&A 16
Slide 17: Agenda
AGENDA WHO WE ARE WHERE WE ARE GOING FINANCIAL HIGHLIGHTS H1 2023 17
Slide 18: Key Financials
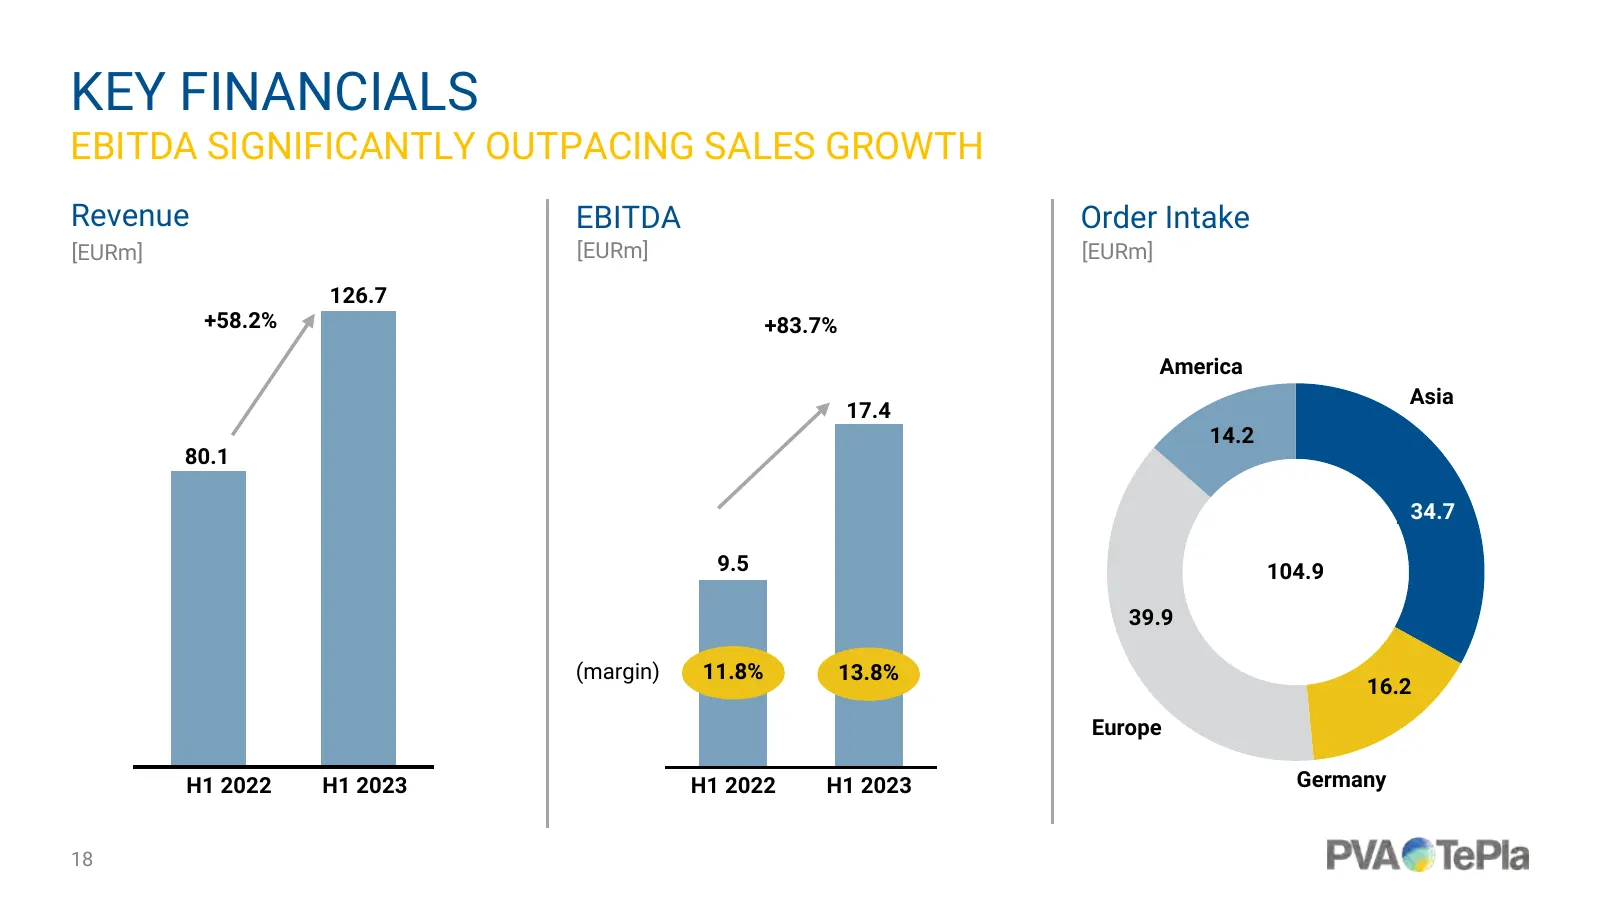
KEY FINANCIALS EBITDA SIGNIFICANTLY OUTPACING SALES GROWTH Revenue EBITDA Order Intake [EURm] [EURm] [EURm] 126.7 +58.2% +83.7% America Asia 17.4 14.2 80.1 34.7 9.5 104.9 39.9 (margin) 11.8% 13.8% 16.2 Europe H1 2022 H1 2023 H1 2022 H1 2023 Germany 18
Slide 19: Financial Guidance for Full Year 2023
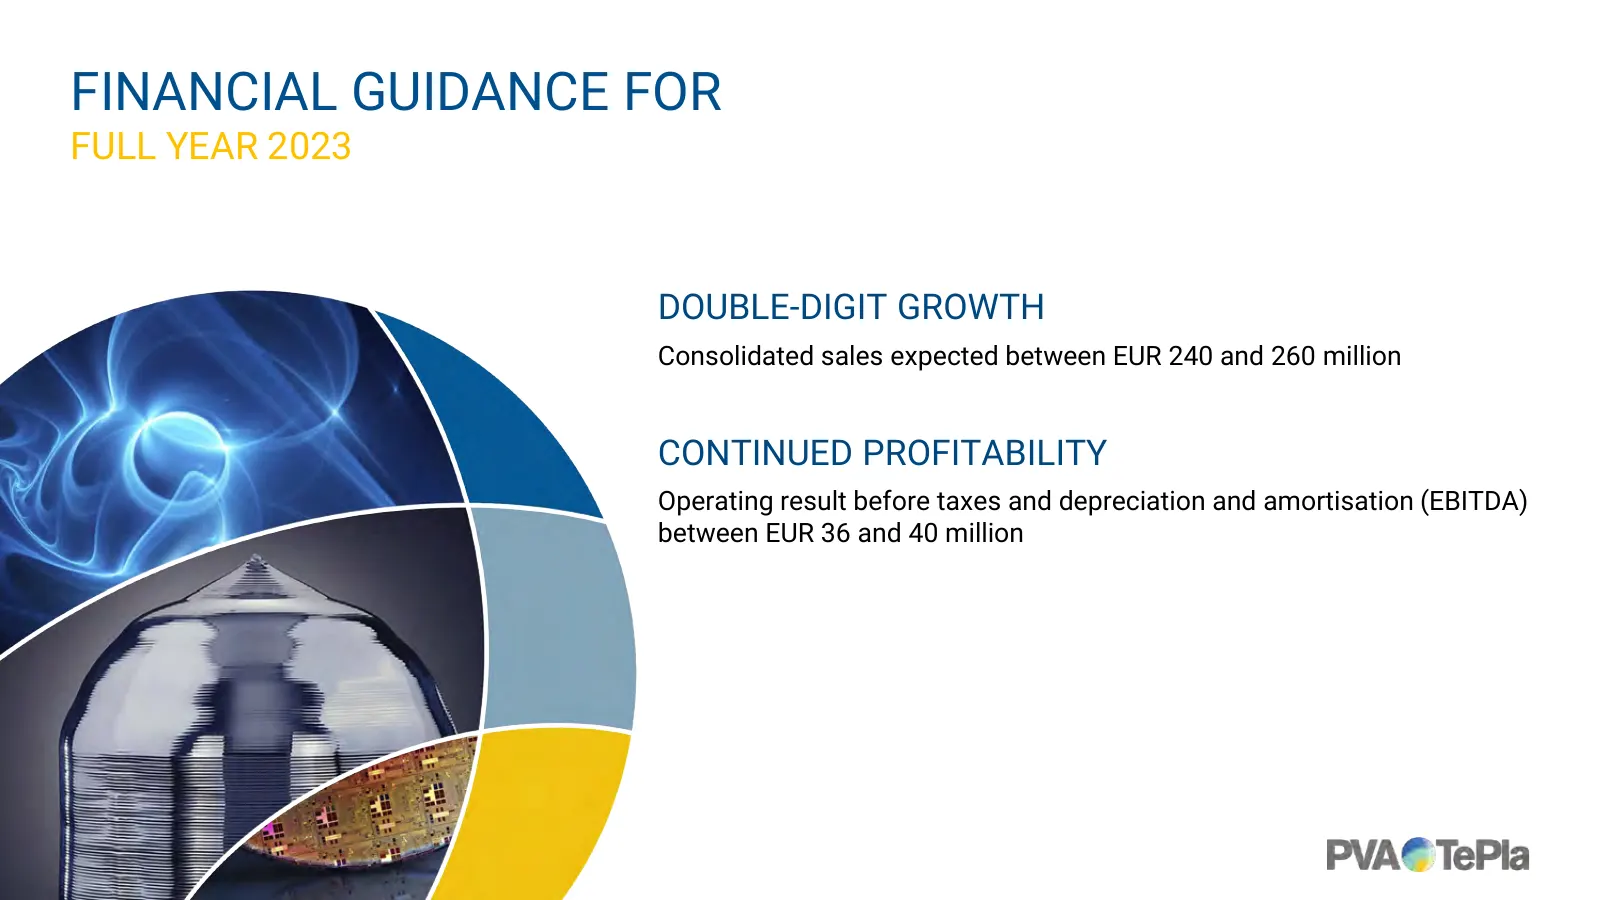
FINANCIAL GUIDANCE FOR FULL YEAR 2023 DOUBLE-DIGIT GROWTH Consolidated sales expected between EUR 240 and 260 million CONTINUED PROFITABILITY Operating result before taxes and depreciation and amortisation (EBITDA) between EUR 36 and 40 million
Slide 20: Forward-looking statements disclaimer
This presentation contains forward-looking statements which are based on certain assumptions, expectations and opinions of the management of PVA TePla (the "Company") or cited from third-party sources. These statements are, therefore, subject to certain known or unknown risks and uncertainties. A va
Slide 21: Key Figures
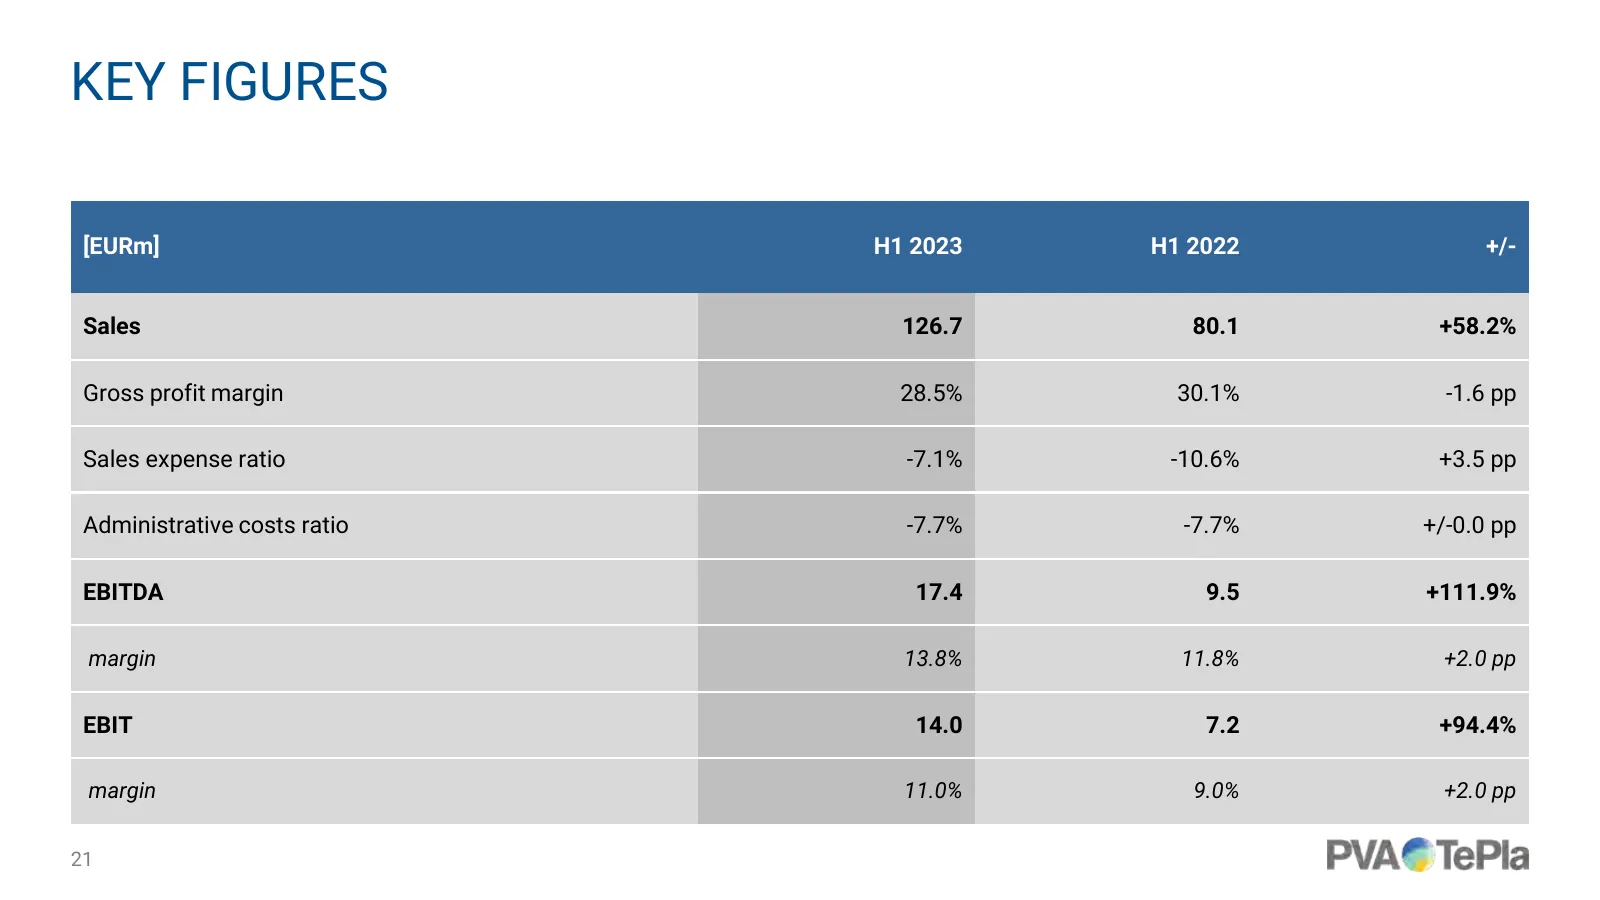
KEY FIGURES [EURm] H1 2023 H1 2022 +/- Sales 126.7 80.1 +58.2% Gross profit margin 28.5% 30.1% -1.6 pp Sales expense ratio -7.1% -10.6% +3.5 pp Administrative costs ratio -7.7% -7.7% +/-0.0 pp EBITDA 17.4 9.5 +111.9% margin 13.8% 11.8% +2.0 pp EBIT 14.0 7.2 +94.4% margin 11.0% 9.0% +2.0 pp 21
Slide 22: Group Sales
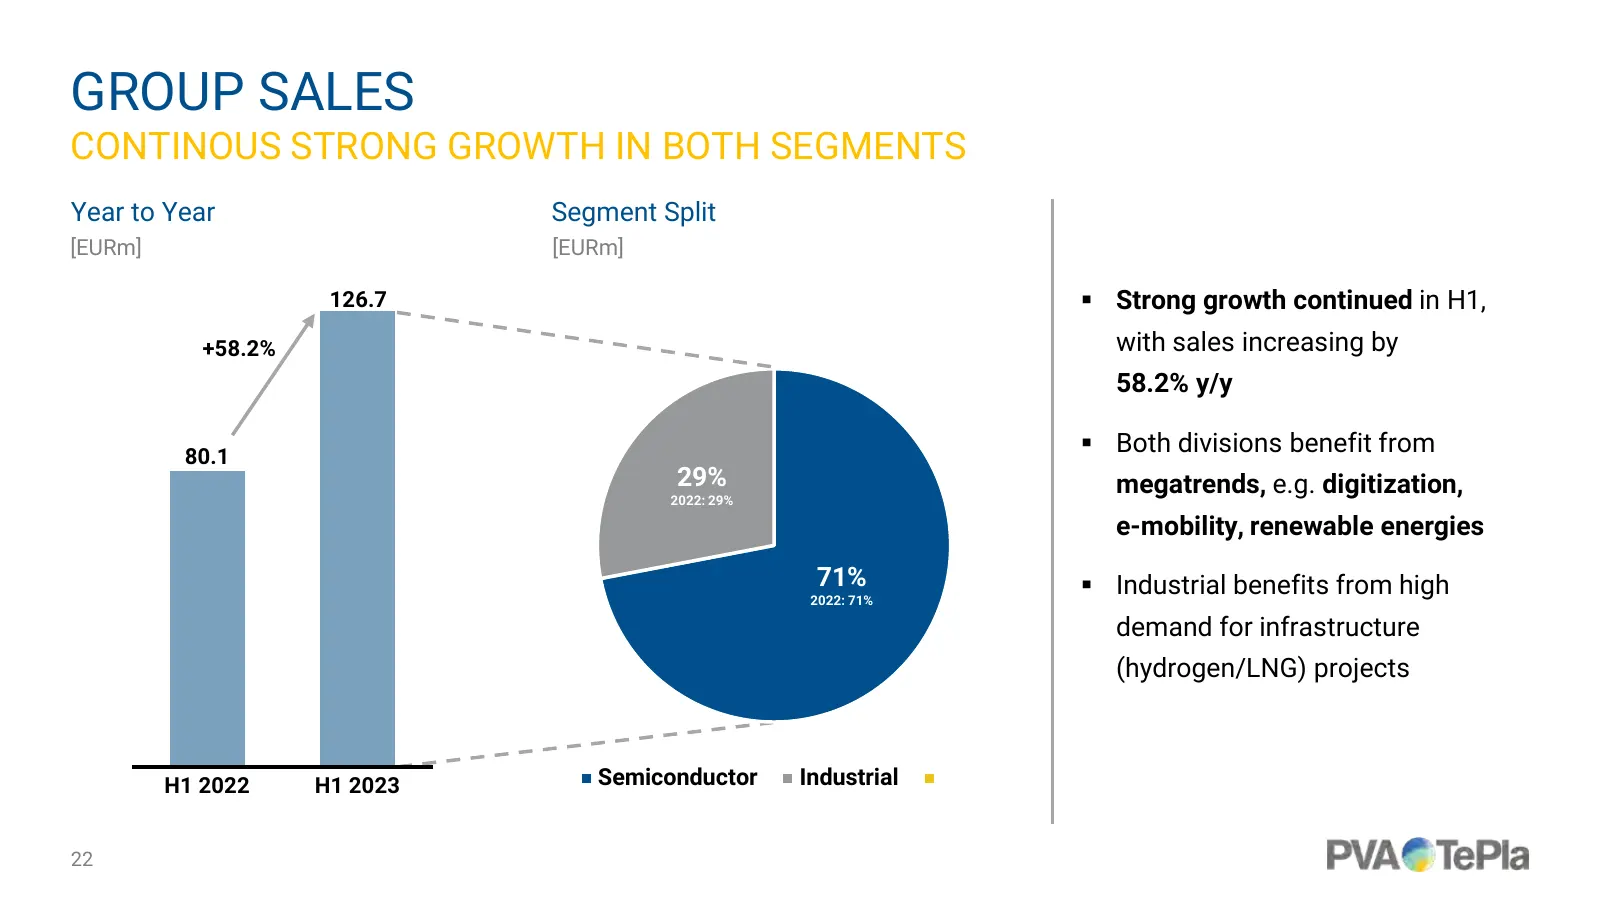
GROUP SALES CONTINOUS STRONG GROWTH IN BOTH SEGMENTS Year to Year Segment Split [EURm] [EURm] 126.7 Strong growth continued in H1, +58.2% with sales increasing by 58.2% y/y 80.1 Both divisions benefit from 29% megatrends, e.g. digitization, 2022: 29% e-mobility, renewable energies 71% Industri
Slide 23: Highlights H1 2023
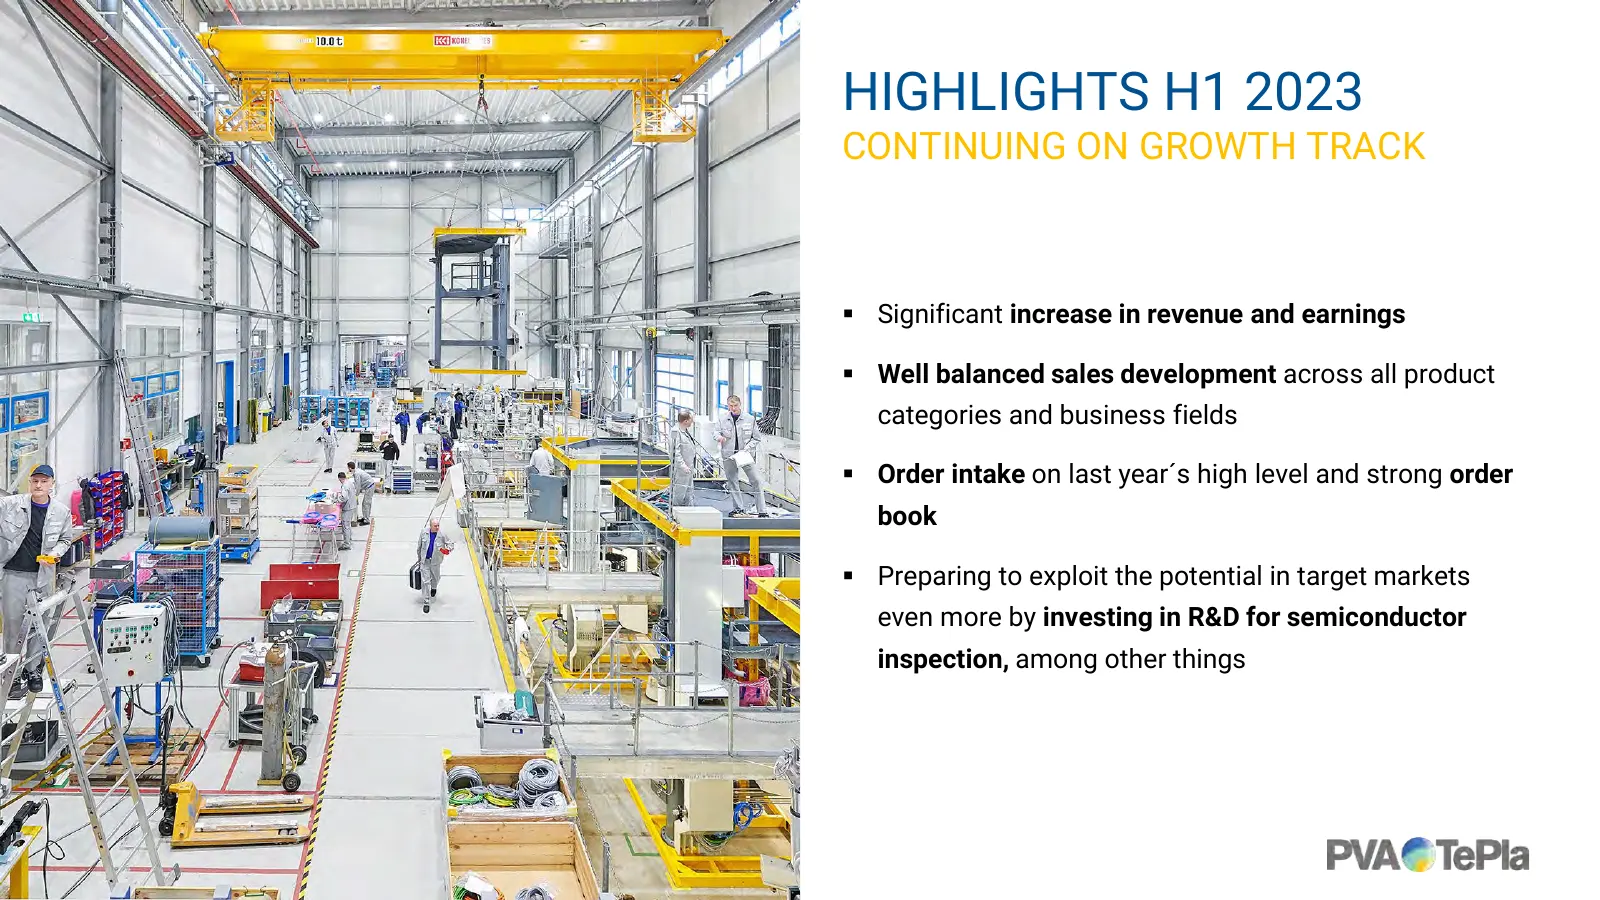
HIGHLIGHTS H1 2023 CONTINUING ON GROWTH TRACK Significant increase in revenue and earnings Well balanced sales development across all product categories and business fields Order intake on last year´s high level and strong order book Preparing to exploit the potential in target markets even
Slide 24: Group Profit
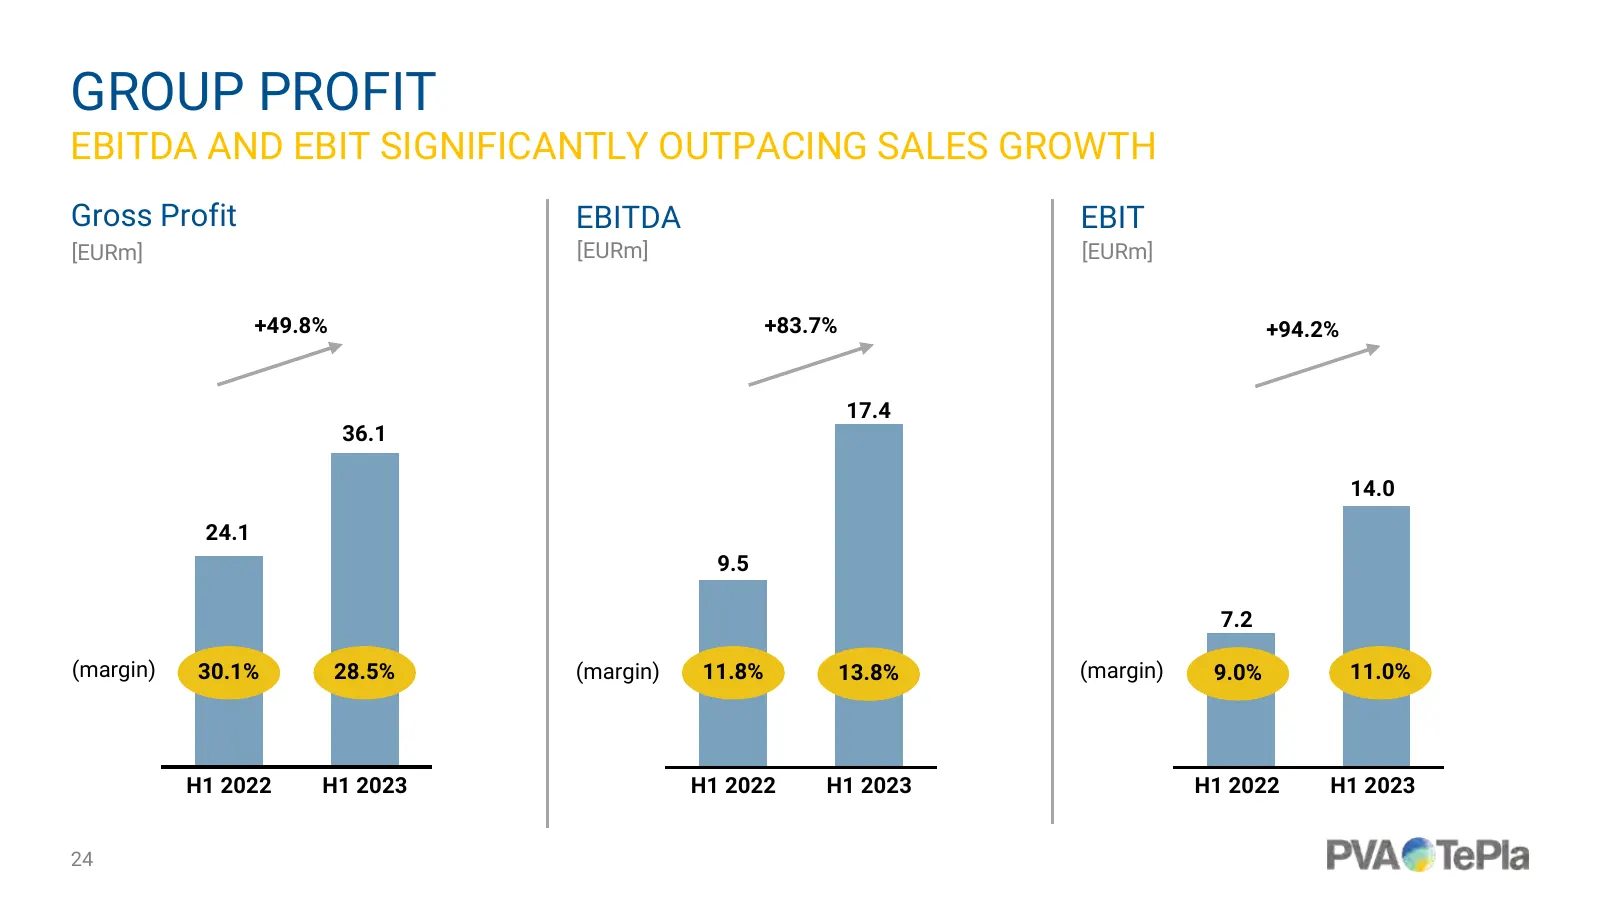
GROUP PROFIT EBITDA AND EBIT SIGNIFICANTLY OUTPACING SALES GROWTH Gross Profit EBITDA EBIT [EURm] [EURm] [EURm] +49.8% +83.7% +94.2% 17.4 36.1 14.0 24.1 9.5 7.2 (margin) 30.1% 28.5% (margin) 11.8% 13.8% (margin) 9.0% 11.0% H1 2022 H1 2023 H1 2022 H1 2023 H1 2022 H1 2023 24
Slide 25: Order Intake
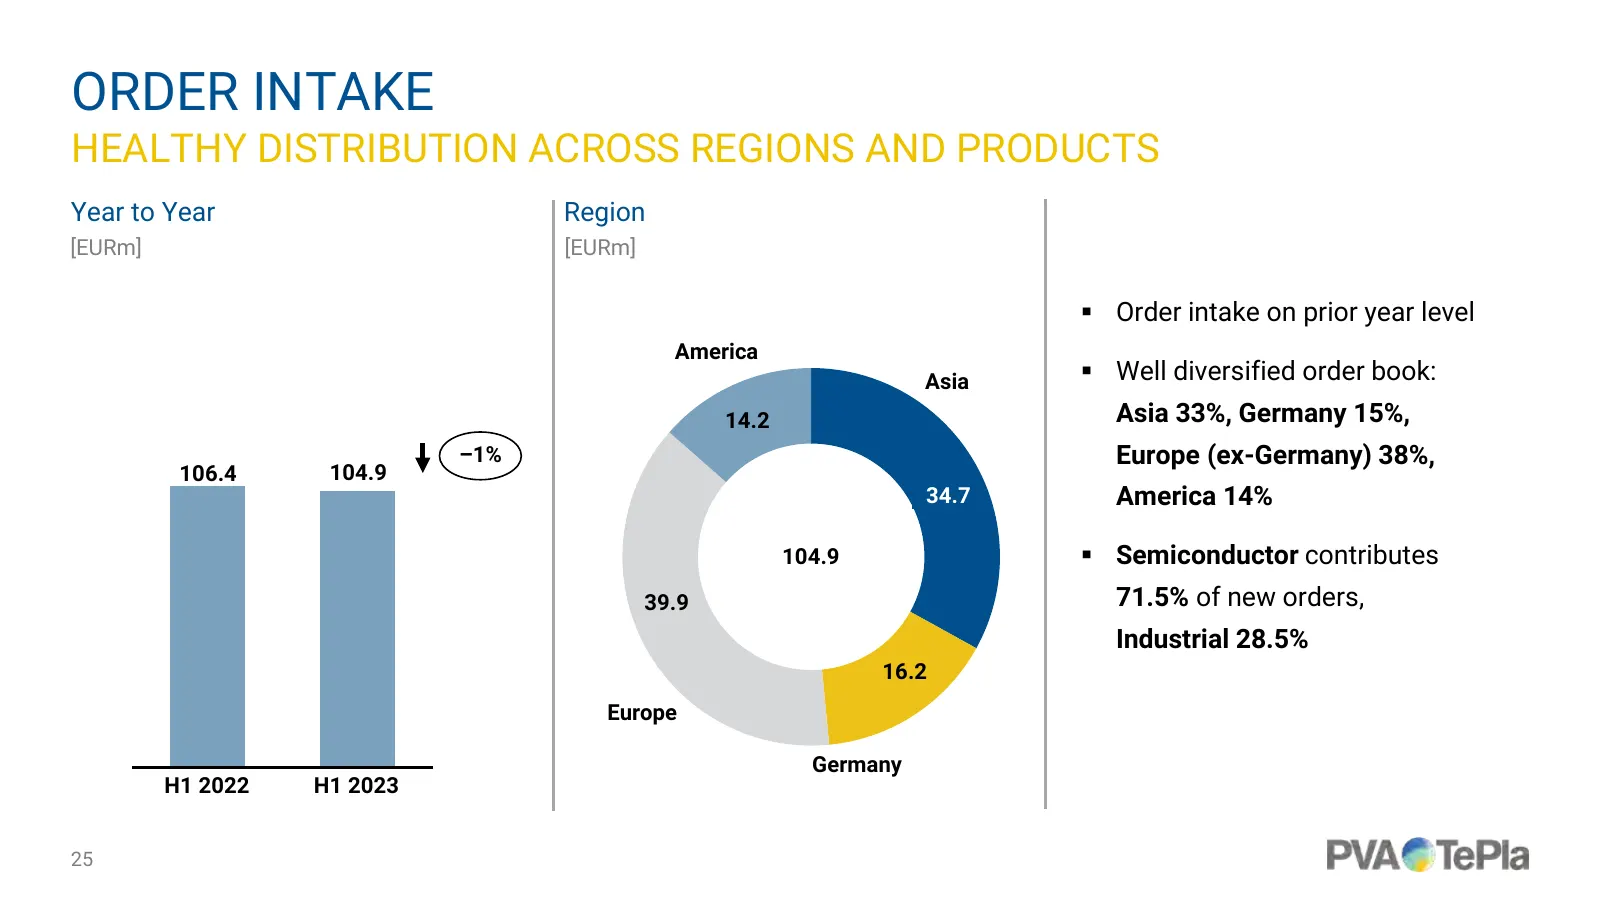
ORDER INTAKE HEALTHY DISTRIBUTION ACROSS REGIONS AND PRODUCTS Year to Year Region [EURm] [EURm] Order intake on prior year level America Asia Well diversified order book: 14.2 Asia 33%, Germany 15%, –1% Europe (ex-Germany) 38%, 106.4 104.9 34.7 America 14% 104.9 Semiconductor contributes 39.9
Slide 26: Key Figures
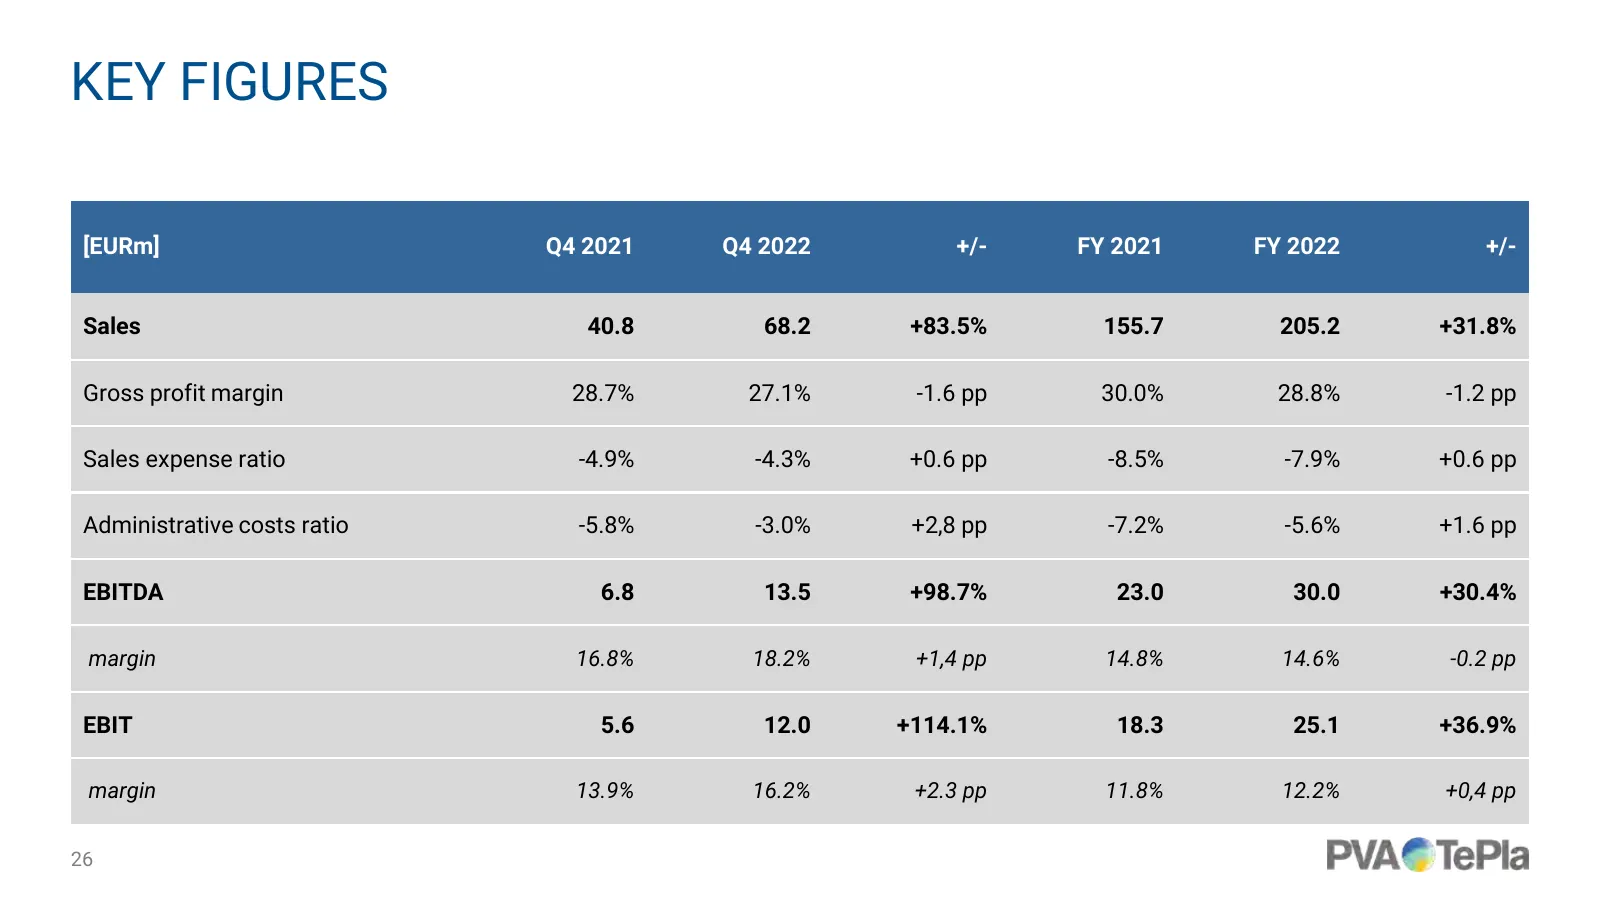
KEY FIGURES [EURm] Q4 2021 Q4 2022 +/- FY 2021 FY 2022 +/- Sales 40.8 68.2 +83.5% 155.7 205.2 +31.8% Gross profit margin 28.7% 27.1% -1.6 pp 30.0% 28.8% -1.2 pp Sales expense ratio -4.9% -4.3% +0.6 pp -8.5% -7.9% +0.6 pp Administrative costs ratio -5.8% -3.0% +2,8 pp -7.2% -5.6% +1.6 pp EBITDA 6.8 1
Slide 27: Semiconductor Segment
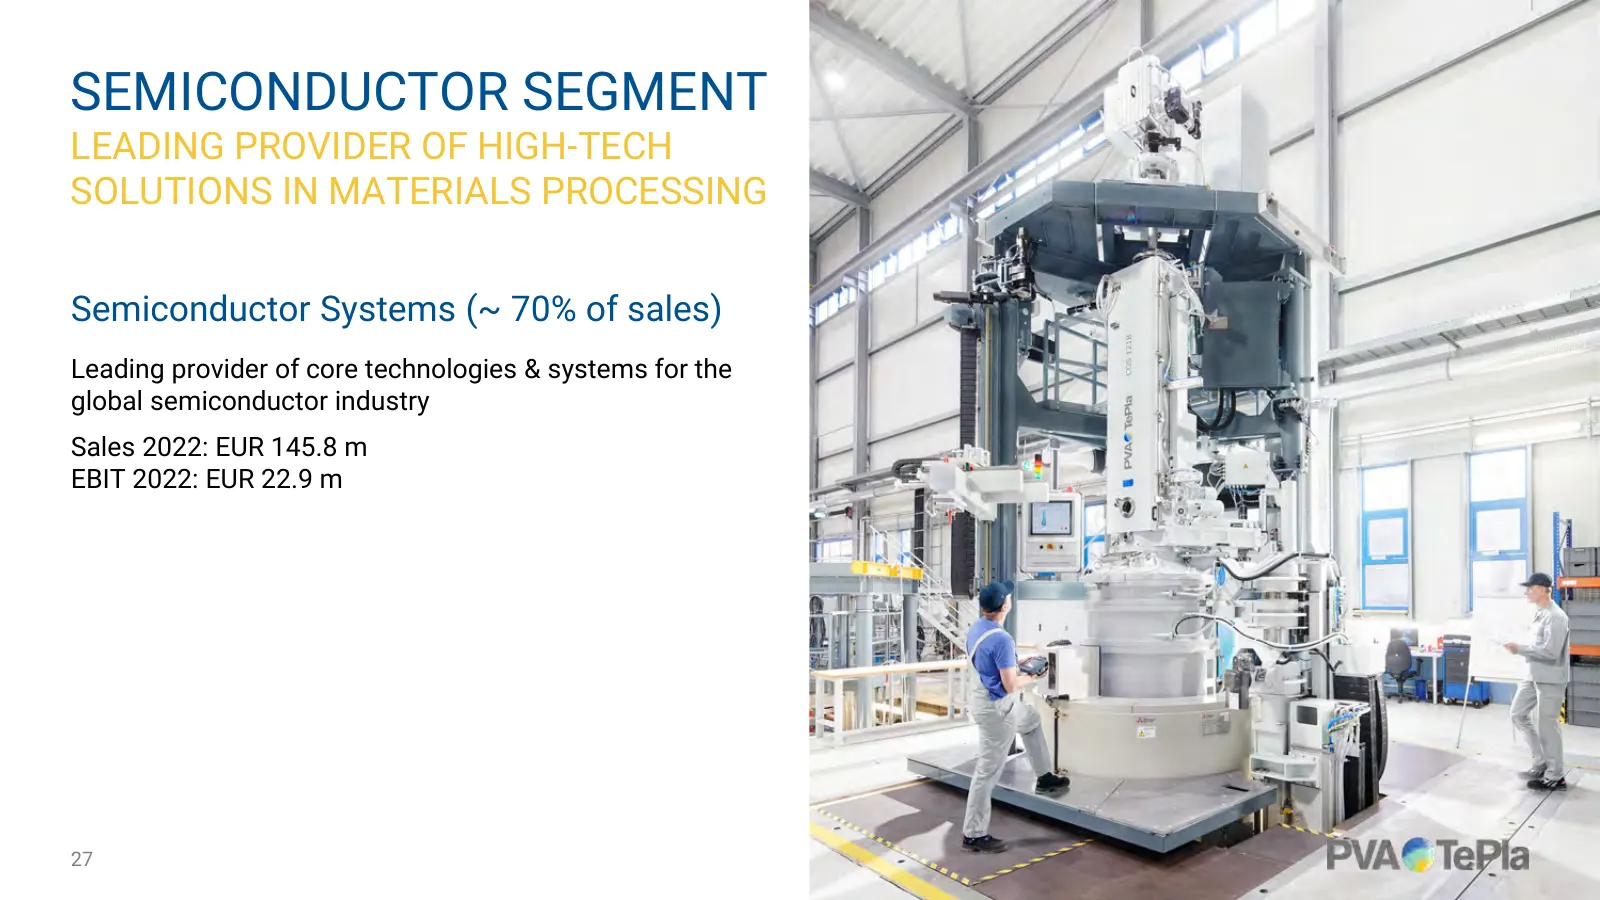
SEMICONDUCTOR SEGMENT LEADING PROVIDER OF HIGH-TECH SOLUTIONS IN MATERIALS PROCESSING Semiconductor Systems (~ 70% of sales) Leading provider of core technologies & systems for the global semiconductor industry Sales 2022: EUR 145.8 m EBIT 2022: EUR 22.9 m 27
Slide 28: Industrial Segment
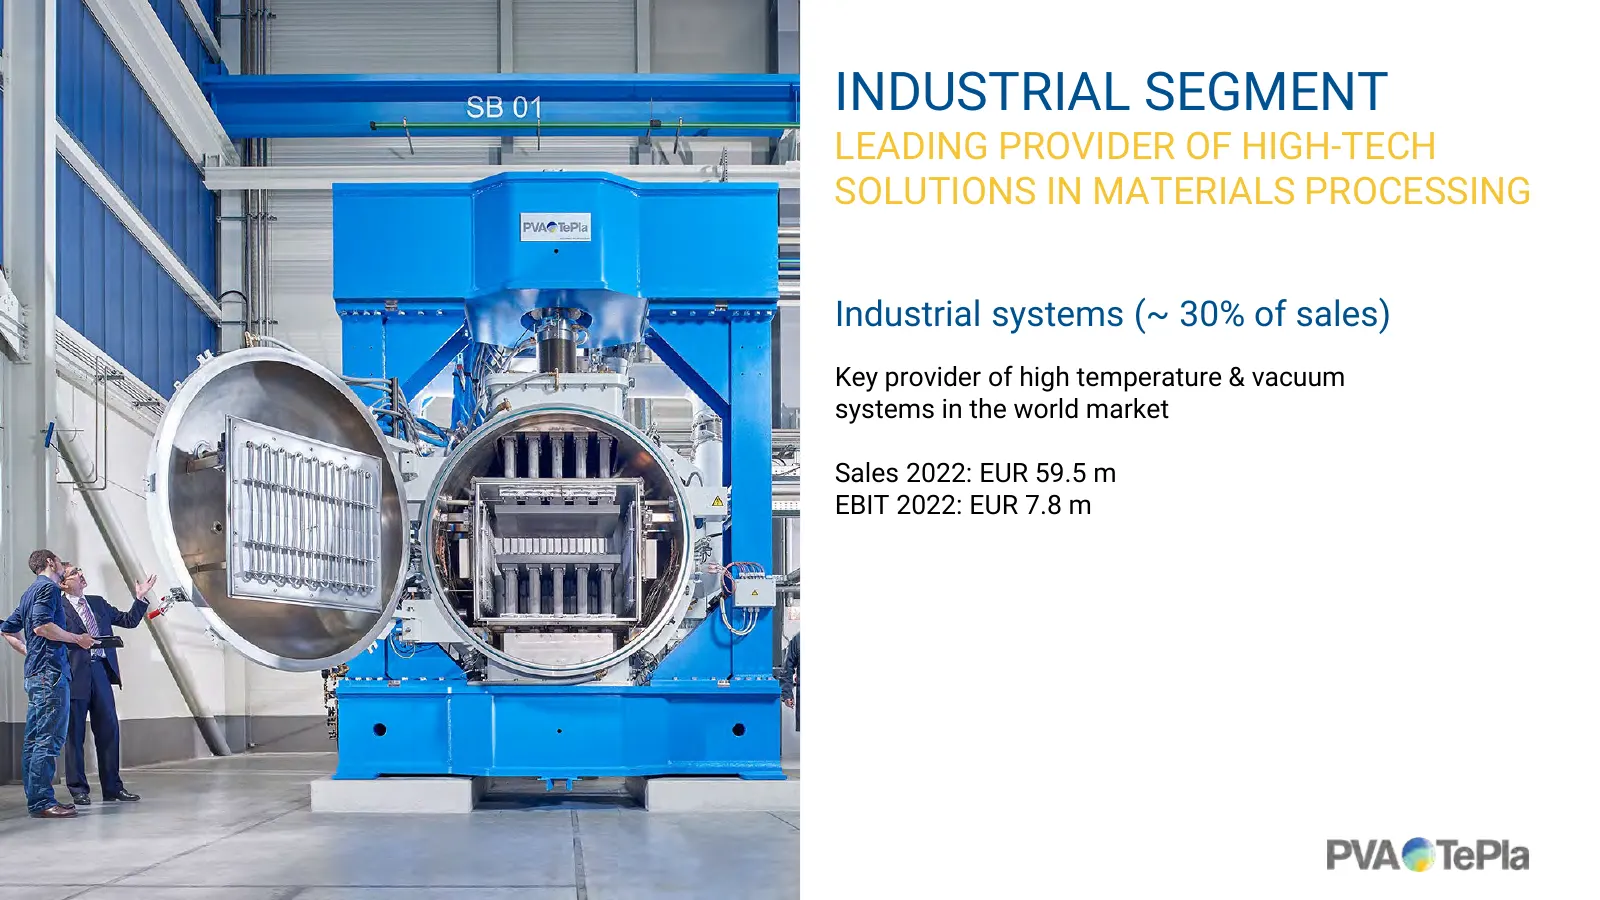
INDUSTRIAL SEGMENT LEADING PROVIDER OF HIGH-TECH SOLUTIONS IN MATERIALS PROCESSING Industrial systems (~ 30% of sales) Key provider of high temperature & vacuum systems in the world market Sales 2022: EUR 59.5 m EBIT 2022: EUR 7.8 m 28
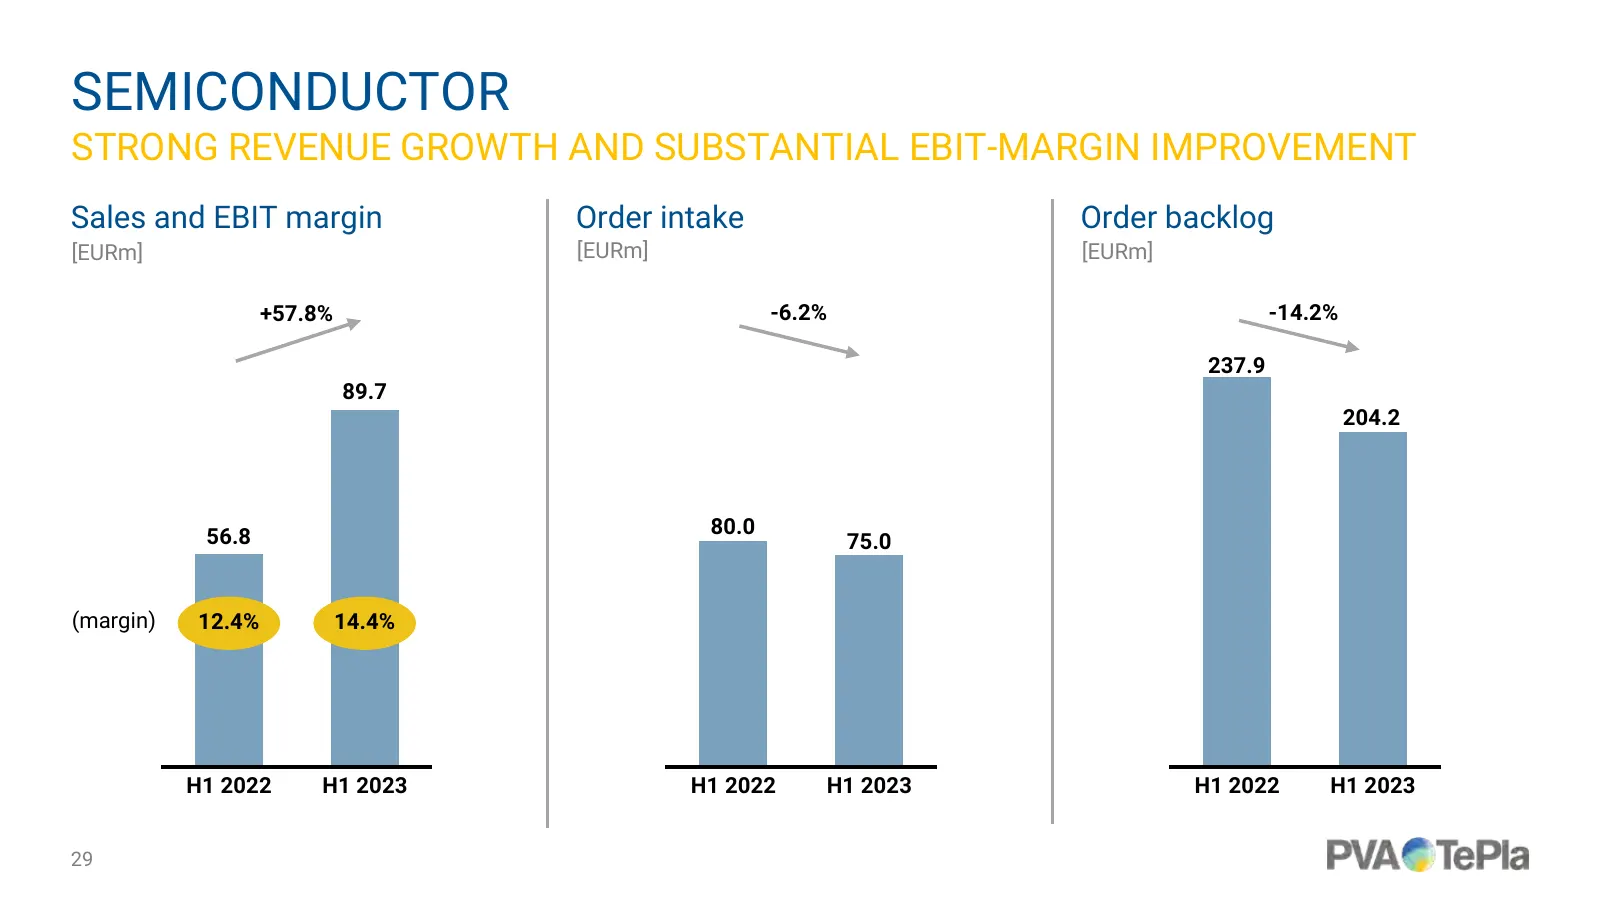
Slide 29: Semiconductor
SEMICONDUCTOR STRONG REVENUE GROWTH AND SUBSTANTIAL EBIT-MARGIN IMPROVEMENT Sales and EBIT margin Order intake Order backlog [EURm] [EURm] [EURm] +57.8% -6.2% -14.2% 237.9 89.7 204.2 56.8 80.0 75.0 (margin) 12.4% 14.4% H1 2022 H1 2023 H1 2022 H1 2023 H1 2022 H1 2023 29
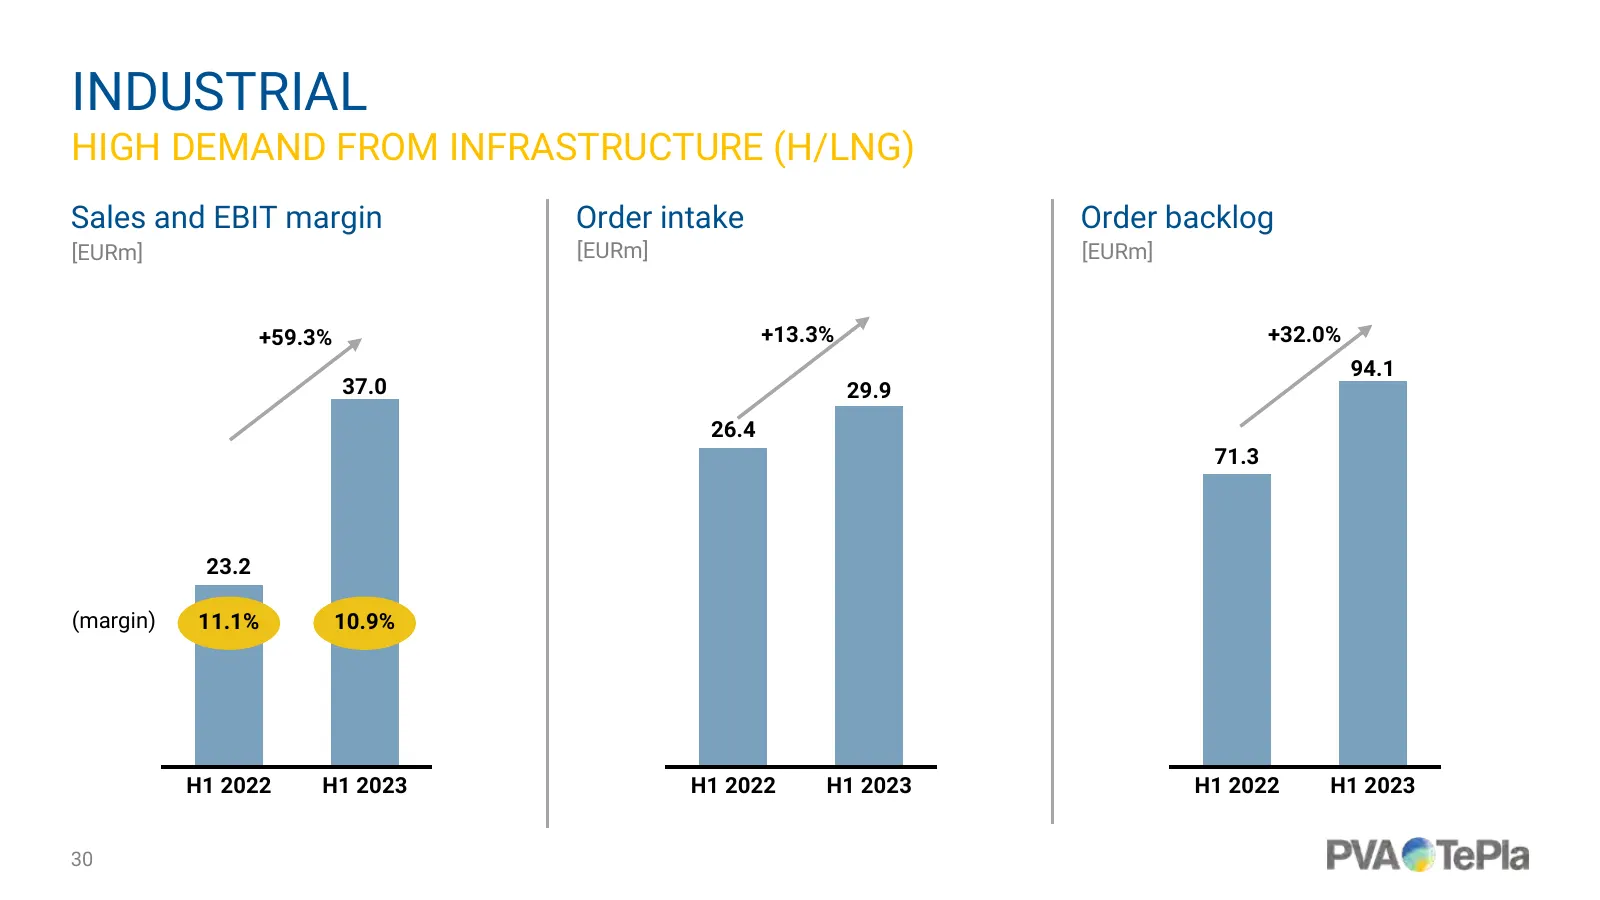
Slide 30: Industrial
INDUSTRIAL HIGH DEMAND FROM INFRASTRUCTURE (H/LNG) Sales and EBIT margin Order intake Order backlog [EURm] [EURm] [EURm] +59.3% +13.3% +32.0% 94.1 37.0 29.9 26.4 71.3 23.2 (margin) 11.1% 10.9% H1 2022 H1 2023 H1 2022 H1 2023 H1 2022 H1 2023 30
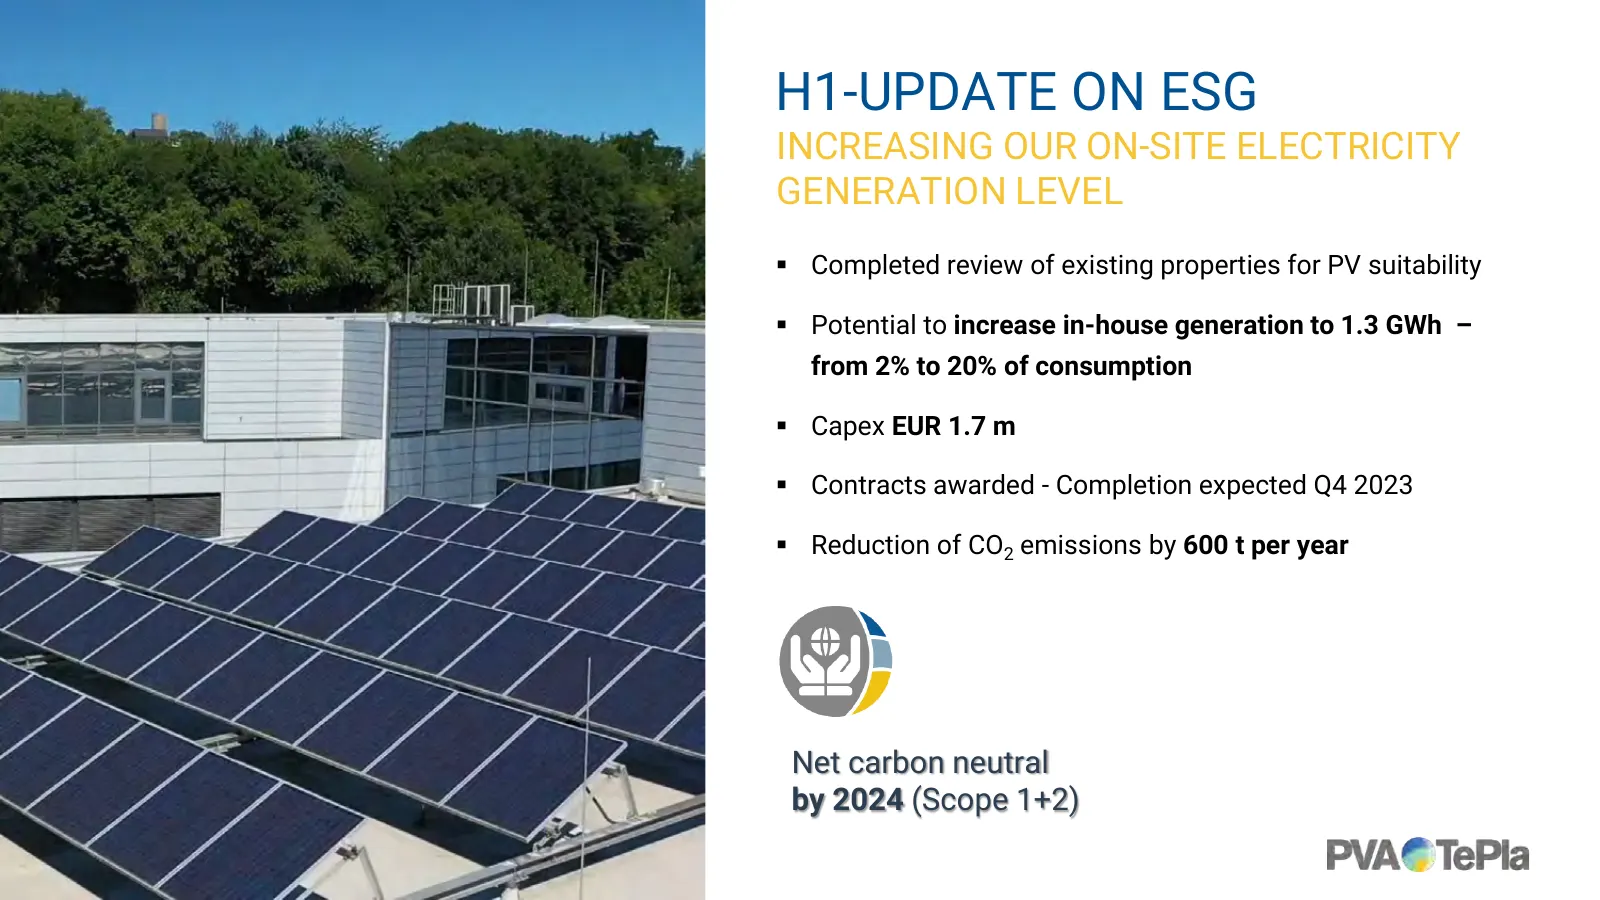
Slide 31: H1-Update on ESG
H1-UPDATE ON ESG INCREASING OUR ON-SITE ELECTRICITY GENERATION LEVEL Completed review of existing properties for PV suitability Potential to increase in-house generation to 1.3 GWh – from 2% to 20% of consumption Capex EUR 1.7 m Contracts awarded - Completion expected Q4 2023 Reduction of
Source: Internet Archive copy of pvatepla.com
More decks from PVA TePla AG
 H1 2026 Earnings Presentation18 slides · Aug 6, 2026
 Shareholder Meeting (June 2026)16 slides · Jun 16, 2026
 Q1 2026 Earnings Presentation20 slides · May 7, 2026
 FY 2025 Earnings Presentation20 slides · Mar 19, 2026
 Q3 2025 Earnings Presentation17 slides · Nov 12, 2025
 Investor Day (September 2025)48 slides · Sep 2, 2025