Scatec ASA · OSL:SCATC
Scatec ASA — Investor Presentation (May 2022)
28 slides from Scatec ASA's investor presentation, May 2022
Slide 1: Investor presentation May 2022
Investor presentation May 2022
Slide 2: Disclaimer
Disclaimer The following presentation is being made only to, and is only directed at, persons to whom such presentation may lawfully be communicated (’relevant persons’). Any person who is not a relevant person should not rely, act or make assessment on the basis of this presentation or anything inc
Slide 3: Contents
Contents 1. Scatec in brief 2. Our business model 3. Financials 4. Outlook

Slide 4: Scatec in brief
01 Scatec in brief Scatec
Slide 5: Key investment highlights
Key investment highlights A leading renewable power producer with 3.5 GW in operation and under construction Solid and predictable cash flow generation supported by 17+ years PPAs A track record of growth with a 14.5 GW project pipeline across high growth markets A business model to develop, build,
Slide 6: Scatec provides renewable energy solutions in high growth markets
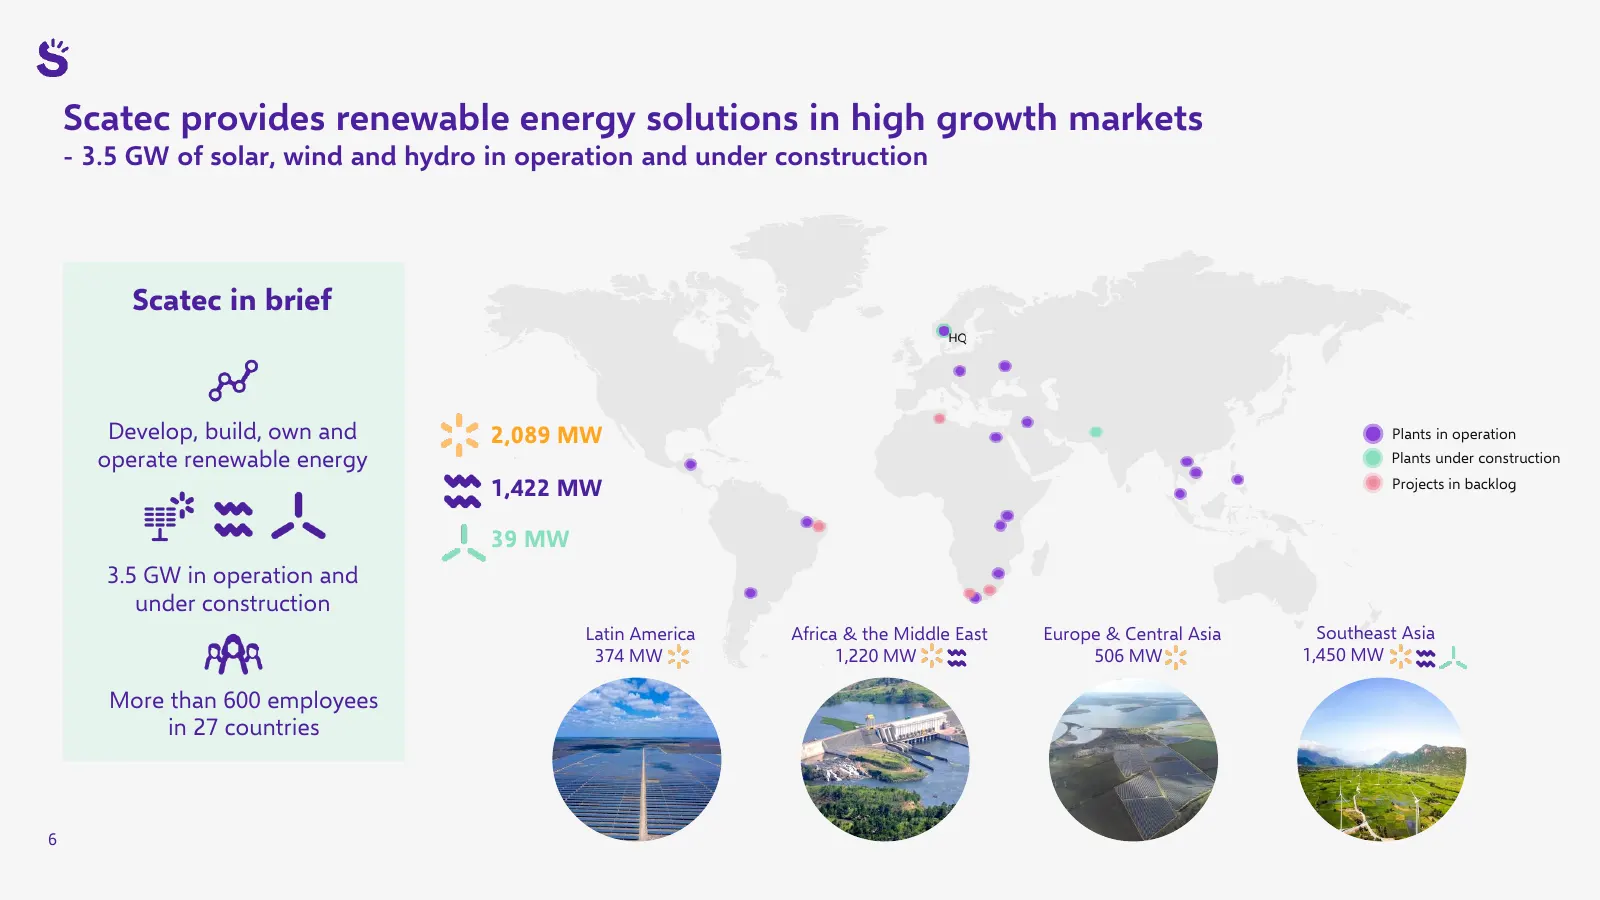
Scatec provides renewable energy solutions in high growth markets - 3.5 GW of solar, wind and hydro in operation and under construction Scatec in brief Develop, build, own and 2,089 MW Plants in operation operate renewable energy Plants under construction 1,422 MW Projects in backlog 39 MW 3.5 GW in
Slide 7: A growing portfolio of renewable assets
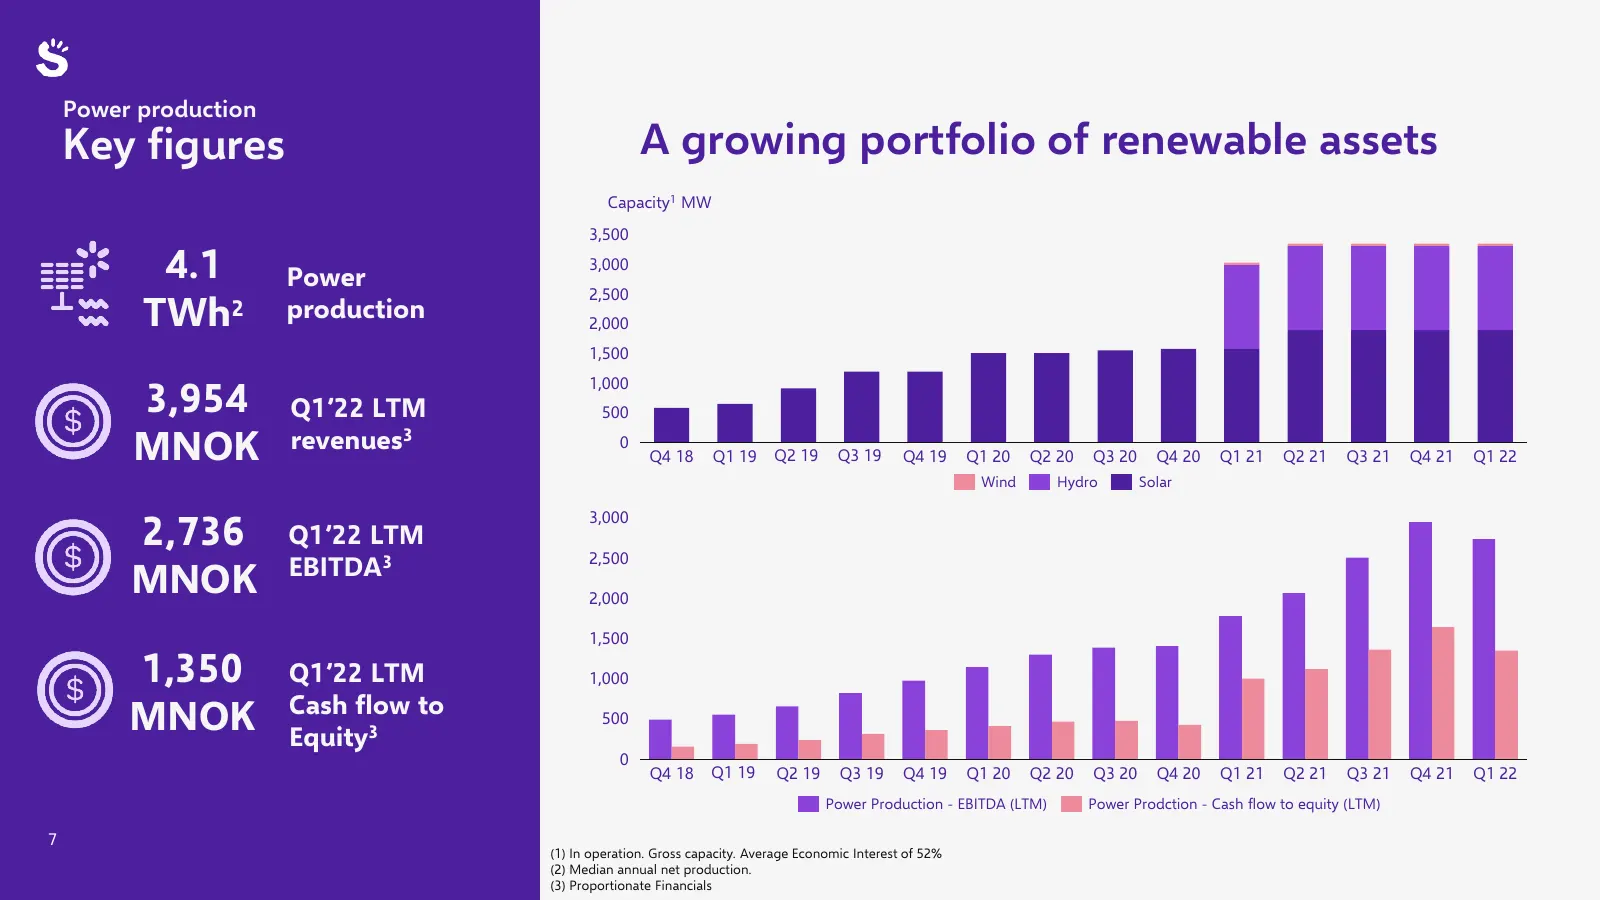
Power production Key figures A growing portfolio of renewable assets Capacity1 MW 3,500 4.1 Power 3,000 2,500 TWh2 production 2,000 1,500 3,954 1,000 Q1’22 LTM 500 MNOK revenues3 0 Q4 18 Q1 19 Q2 19 Q3 19 Q4 19 Q1 20 Q2 20 Q3 20 Q4 20 Q1 21 Q2 21 Q3 21 Q4 21 Q1 22 Wind Hydro Solar 2,736 3,000 Q1’22
Slide 8: Predictable and diversified long-term cash flows
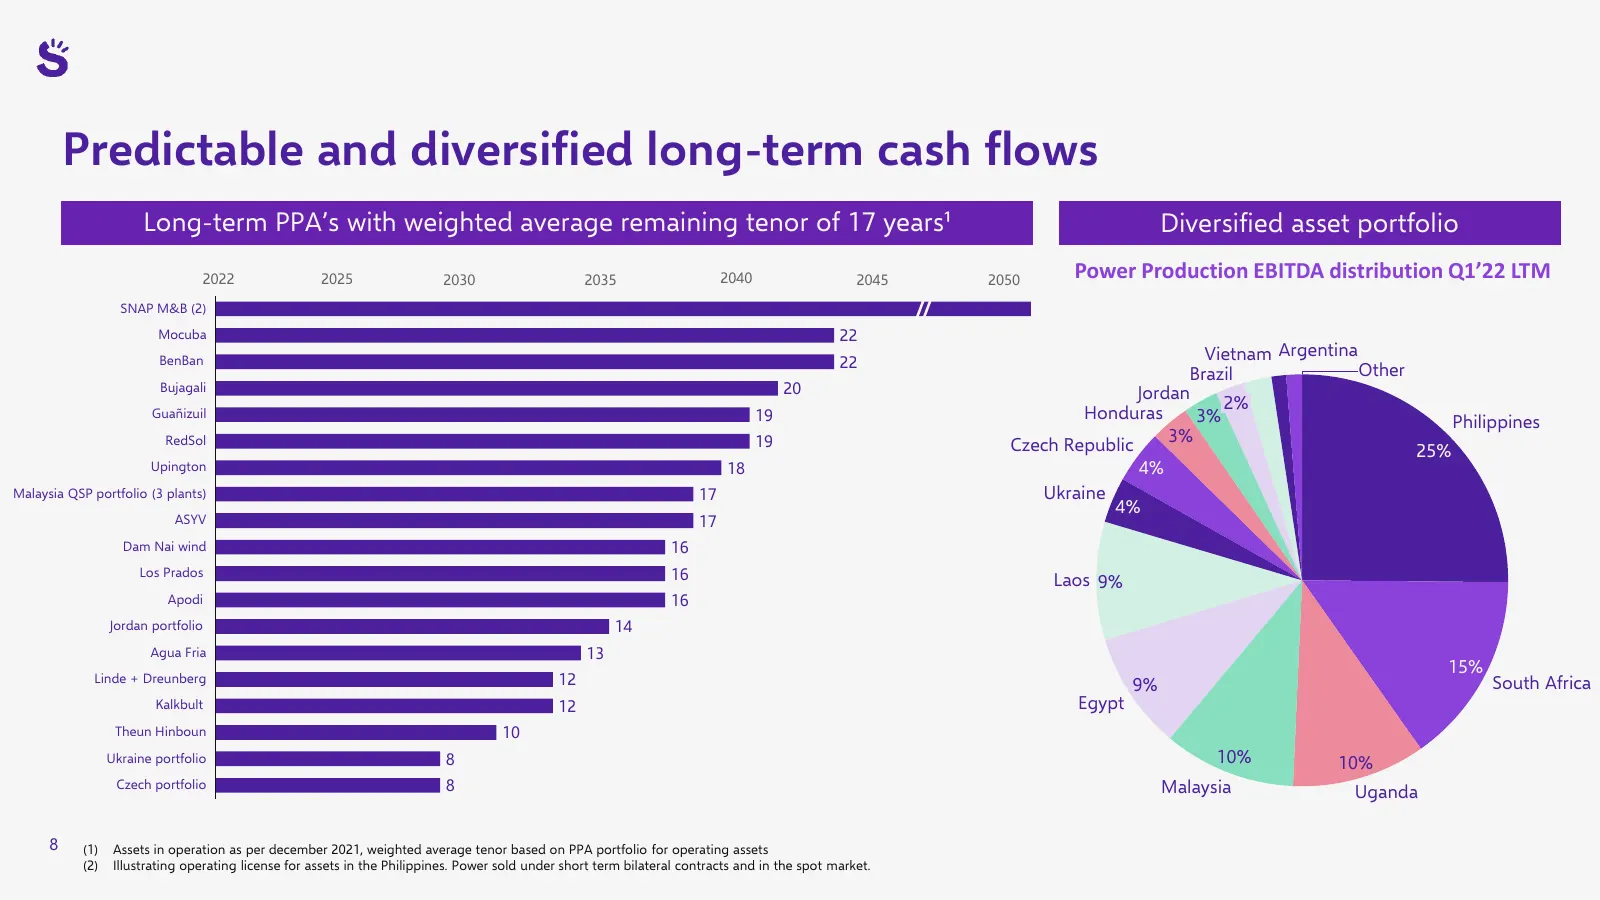
Predictable and diversified long-term cash flows Long-term PPA’s with weighted average remaining tenor of 17 years¹ Diversified asset portfolio 2022 2025 2030 2035 2040 2045 2050 Power Production EBITDA distribution Q1’22 LTM SNAP M&B (2) Mocuba 22 BenBan 22 Vietnam Argentina Brazil Other Bujagali 2
Slide 9: Our business model
02 Our business model Scatec
Slide 10: Scatec's integrated business model
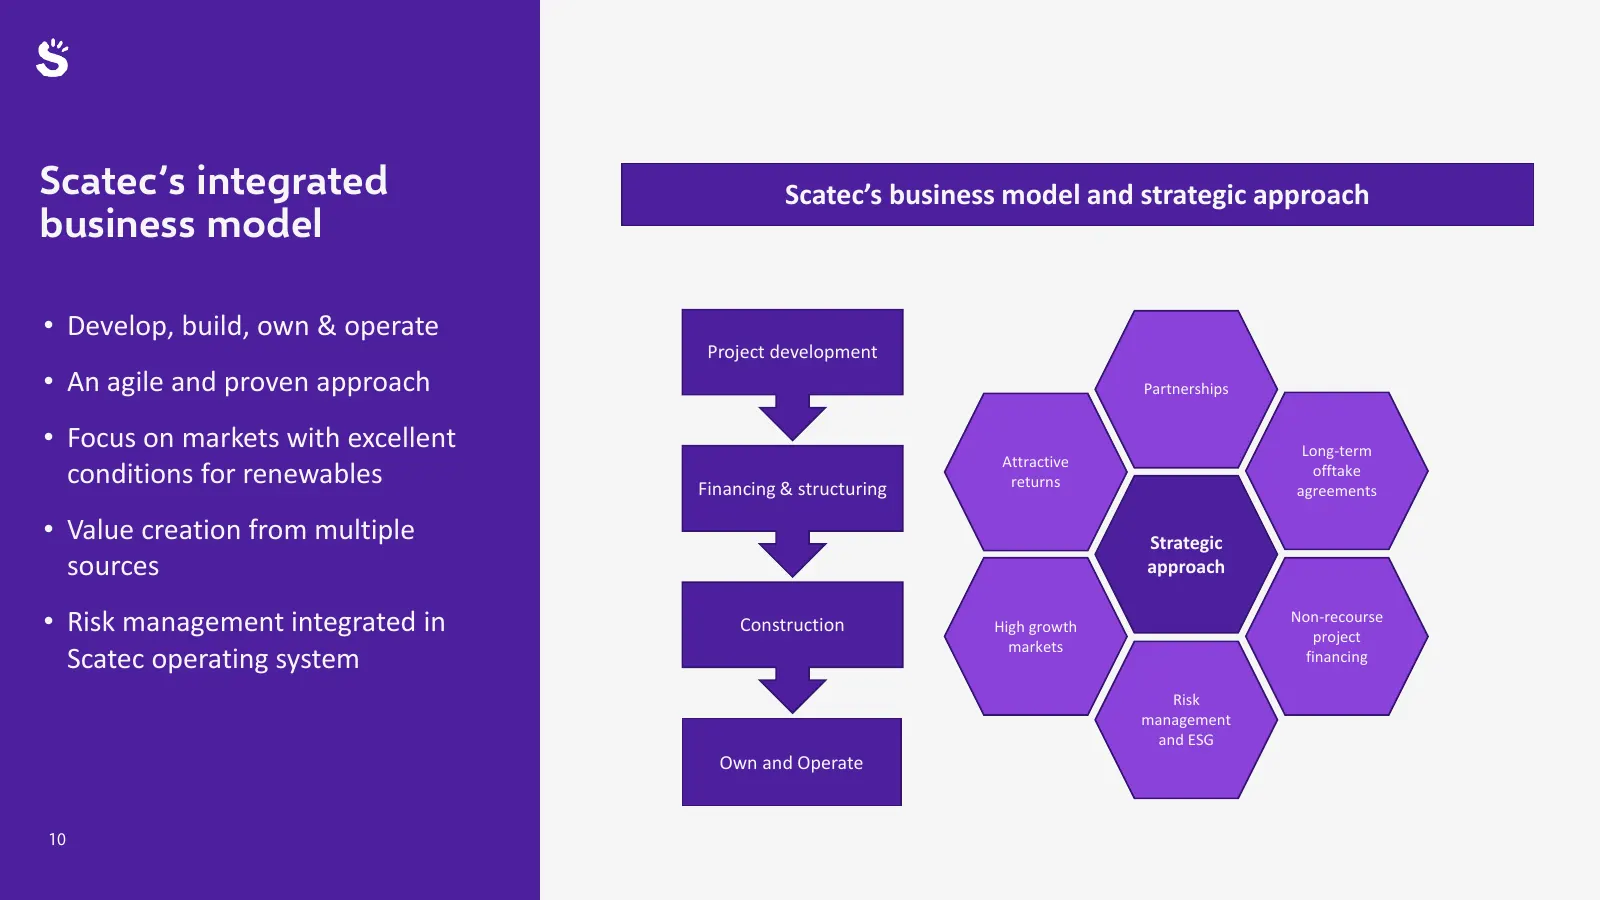
Scatec’s integrated Scatec’s business model and strategic approach business model • Develop, build, own & operate Project development • An agile and proven approach Partnerships • Focus on markets with excellent Long-term Attractive conditions for renewables Financing & structuring returns offtake a
Slide 11: A typical project structure
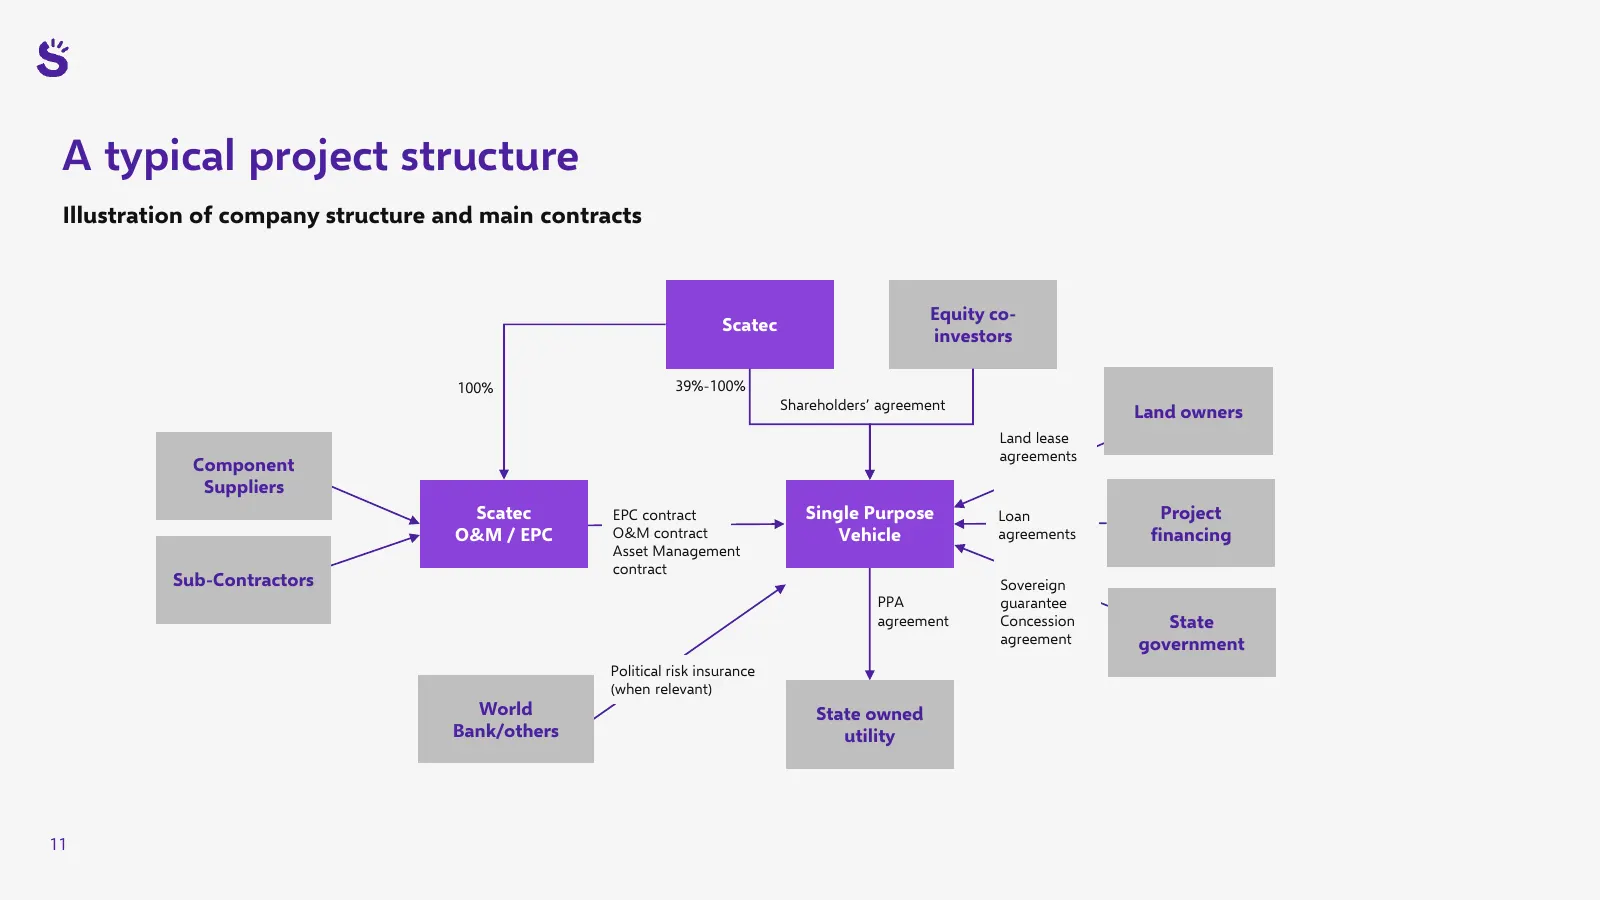
A typical project structure Illustration of company structure and main contracts Equity co- Scatec investors 100% 39%-100% Shareholders’ agreement Land owners Land lease agreements Component Suppliers Scatec EPC contract Single Purpose Loan Project O&M / EPC O&M contract Vehicle agreements financing
Slide 12: Value creation in Scatec's integrated business model
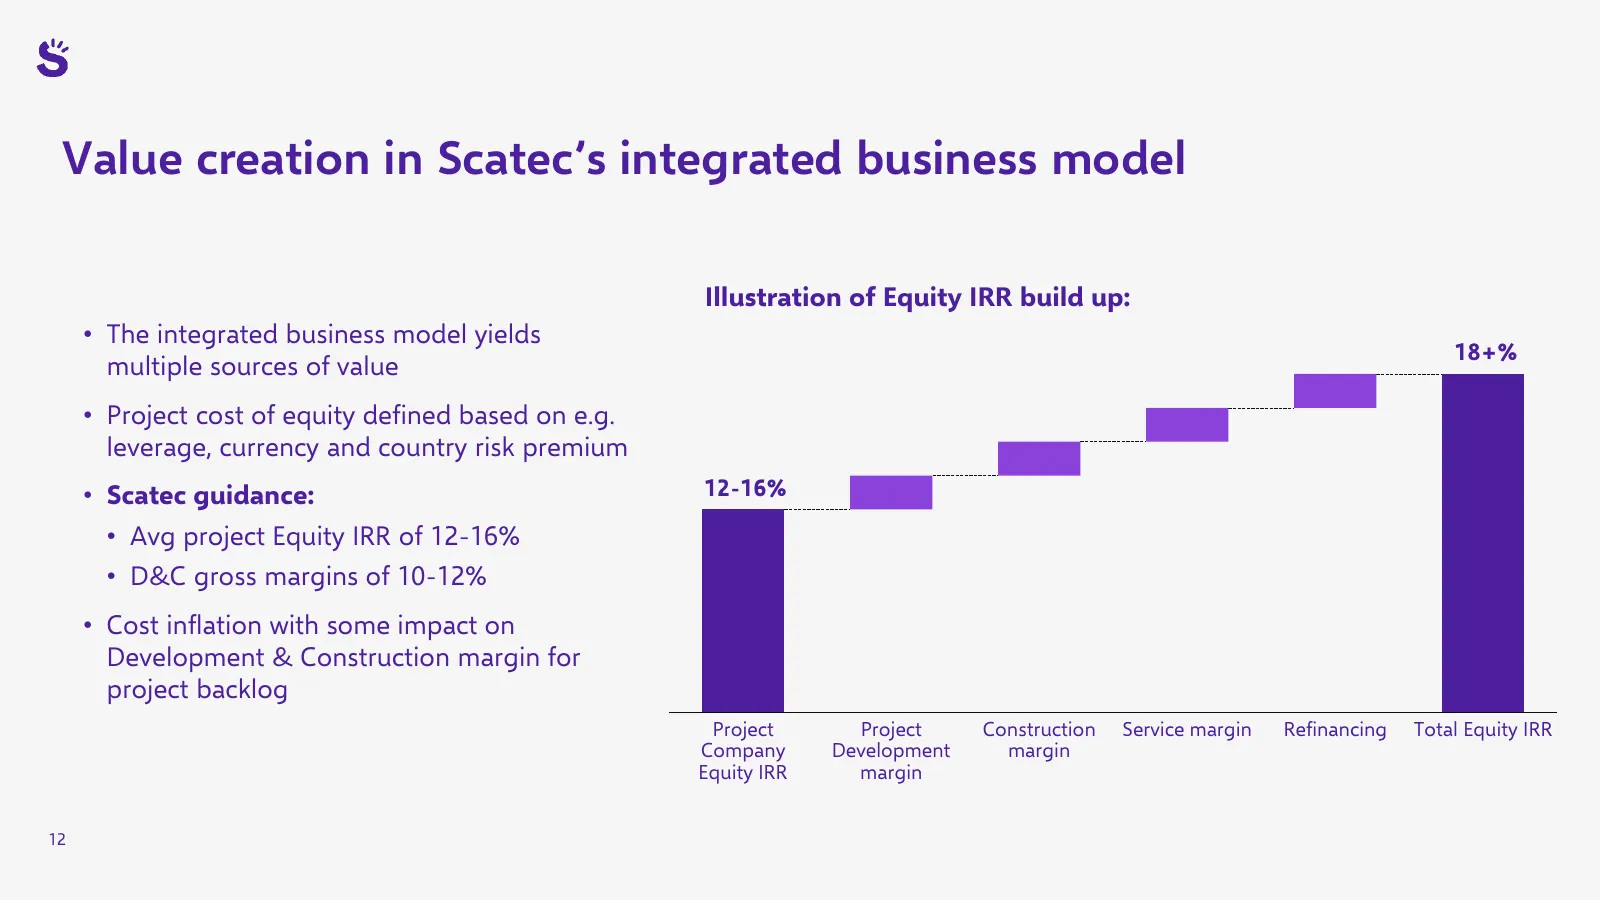
Value creation in Scatec’s integrated business model Illustration of Equity IRR build up: • The integrated business model yields 18+% multiple sources of value • Project cost of equity defined based on e.g. leverage, currency and country risk premium • Scatec guidance: 12-16% • Avg project Equity IR
Slide 13: Partnering with Development Banks for project finance and risk mitigation
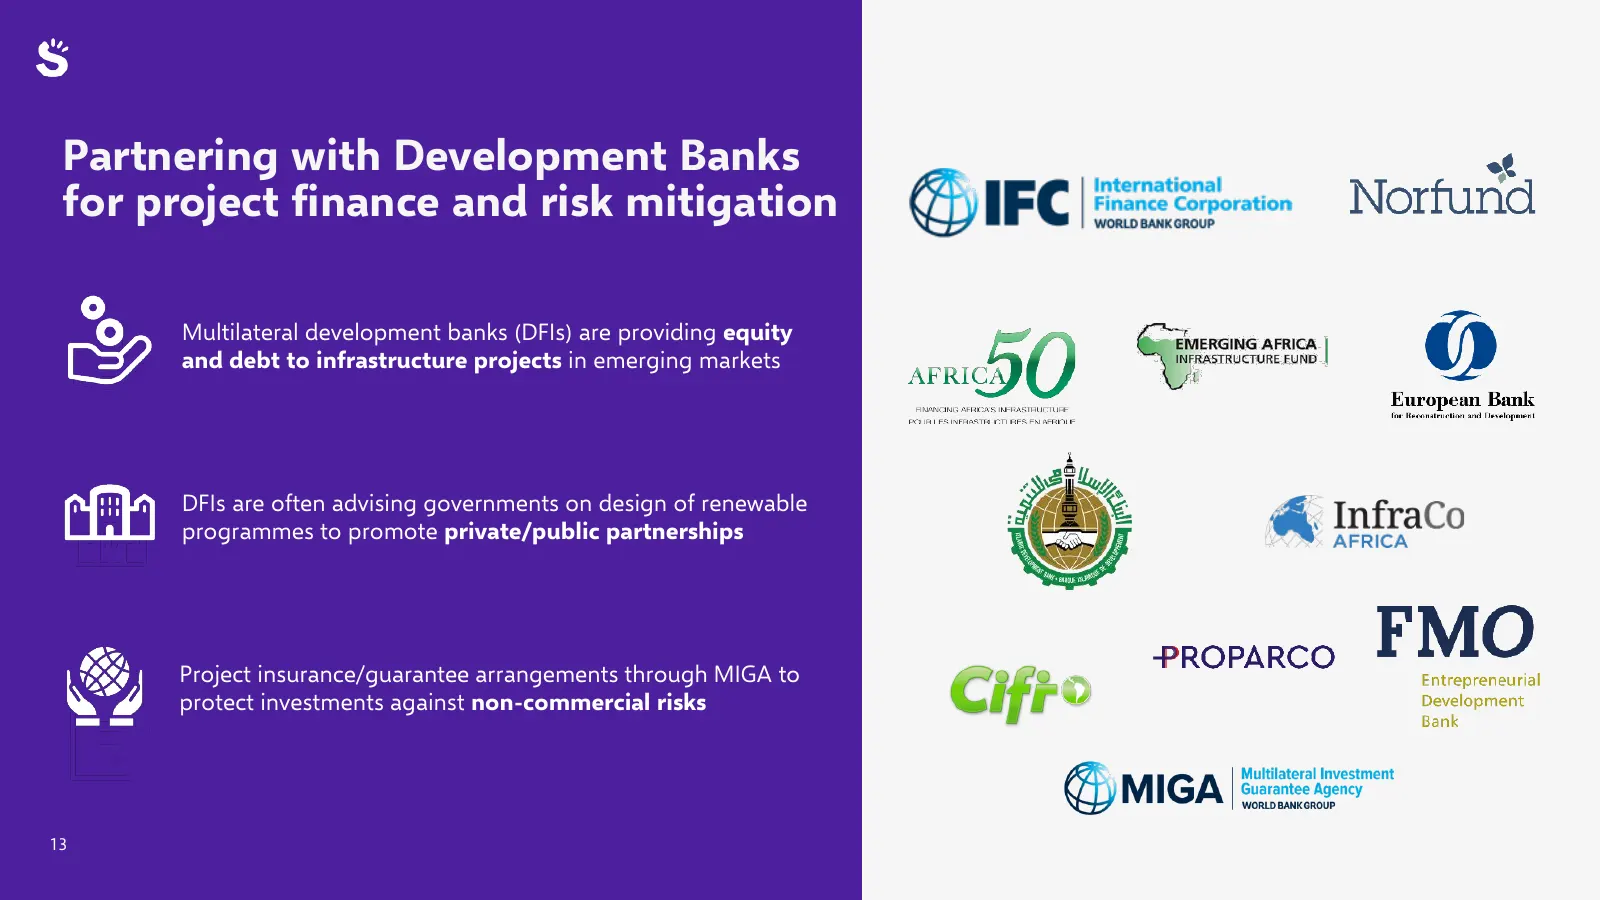
Partnering with Development Banks for project finance and risk mitigation Multilateral development banks (DFIs) are providing equity and debt to infrastructure projects in emerging markets DFIs are often advising governments on design of renewable programmes to promote private/public partnerships Pr
Slide 14: ESG aspects are integrated in our operating model
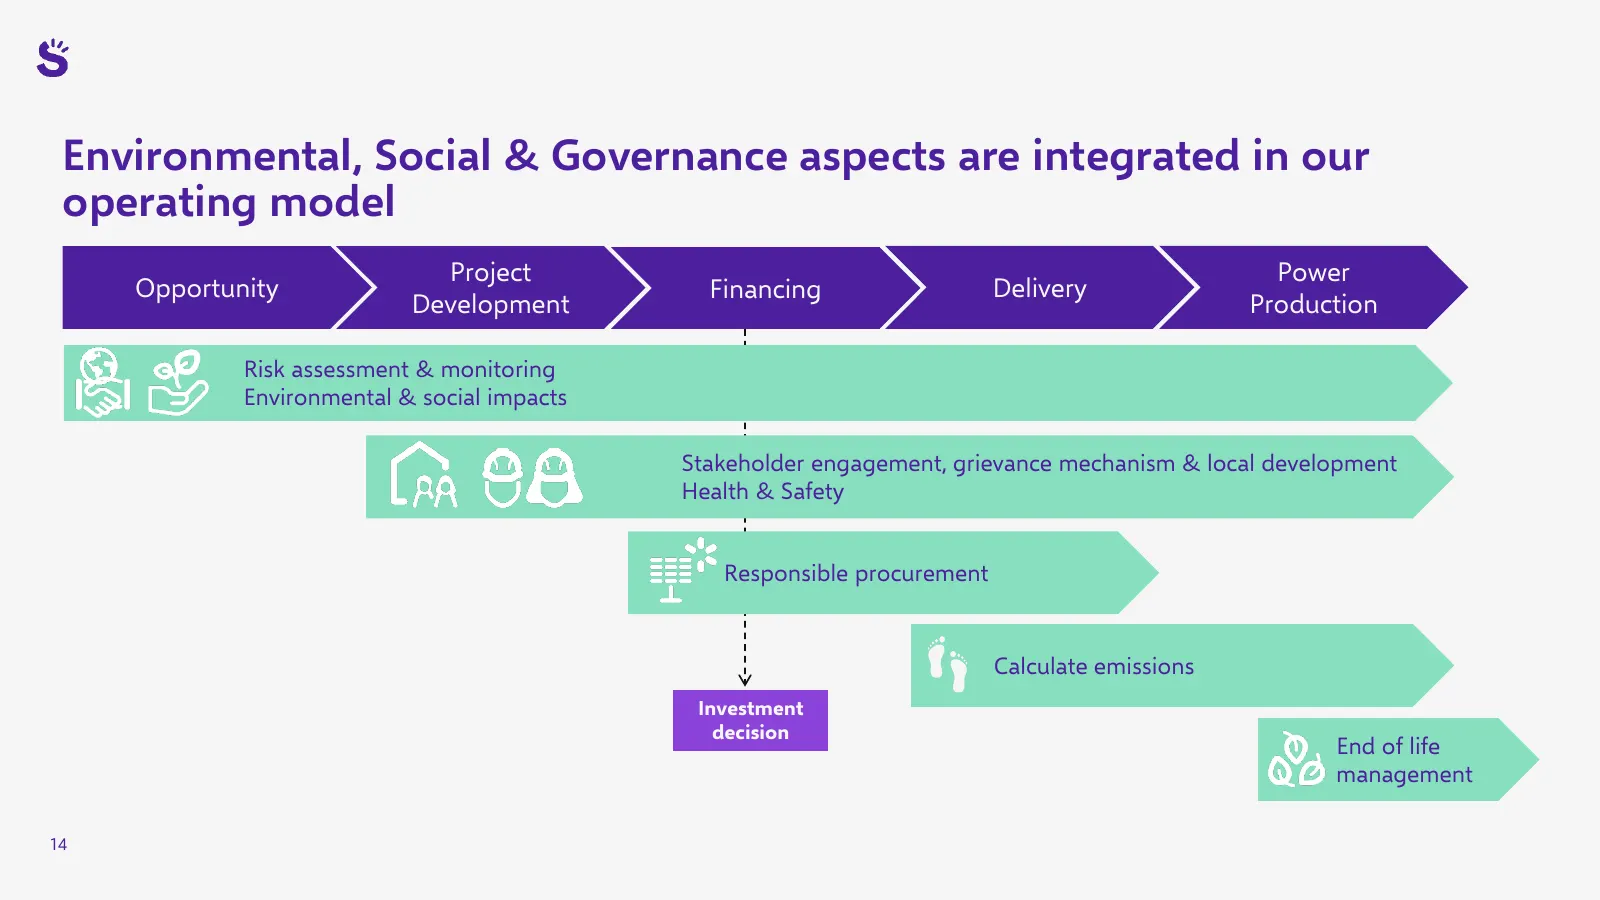
Environmental, Social & Governance aspects are integrated in our operating model Project Power Opportunity Financing Delivery Development Production Risk assessment & monitoring Environmental & social impacts Stakeholder engagement, grievance mechanism & local development Health & Safety Responsible
Slide 15: Top rating from independent rating agencies
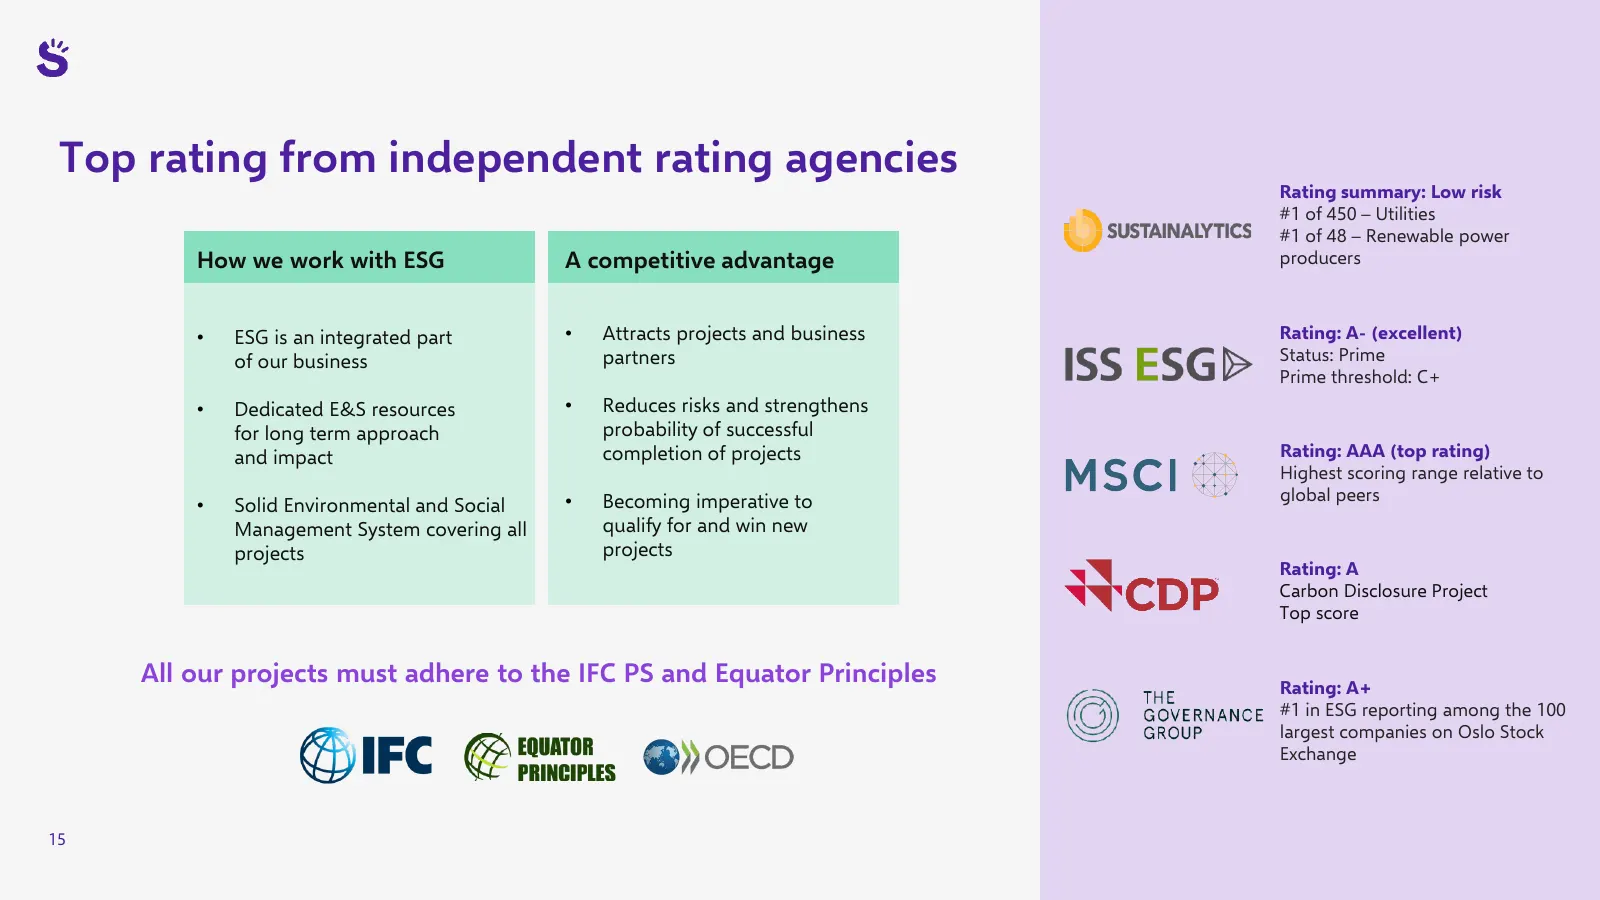
Top rating from independent rating agencies Rating summary: Low risk #1 of 450 – Utilities #1 of 48 – Renewable power How we work with ESG A competitive advantage producers • ESG is an integrated part • Attracts projects and business Rating: A- (excellent) of our business partners Status: Prime Prim

Slide 16: Financials
03 Financials Scatec
Slide 17: Proportionate financials
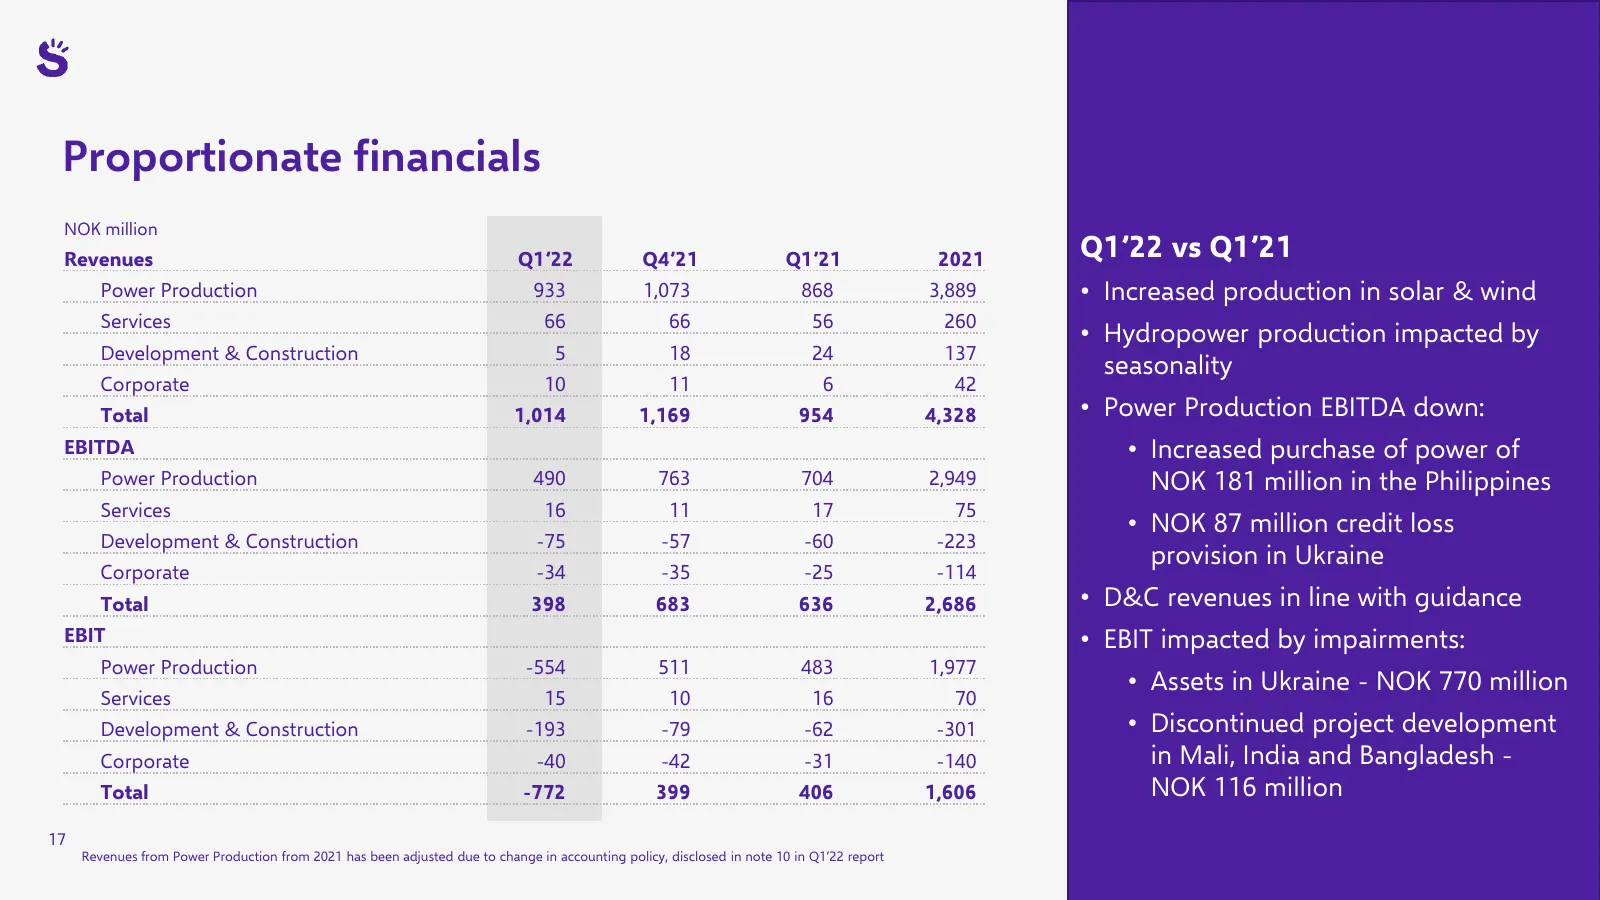
Proportionate financials NOK million Revenues Q1’22 Q4’21 Q1’21 2021 Q1’22 vs Q1’21 Power Production 933 1,073 868 3,889 • Increased production in solar & wind Services 66 66 56 260 • Hydropower production impacted by Development & Construction 5 18 24 137 seasonality Corporate 10 11 6 42 Total 1,01
Slide 18: Short-term impact by seasonality - long-term asset values increasing
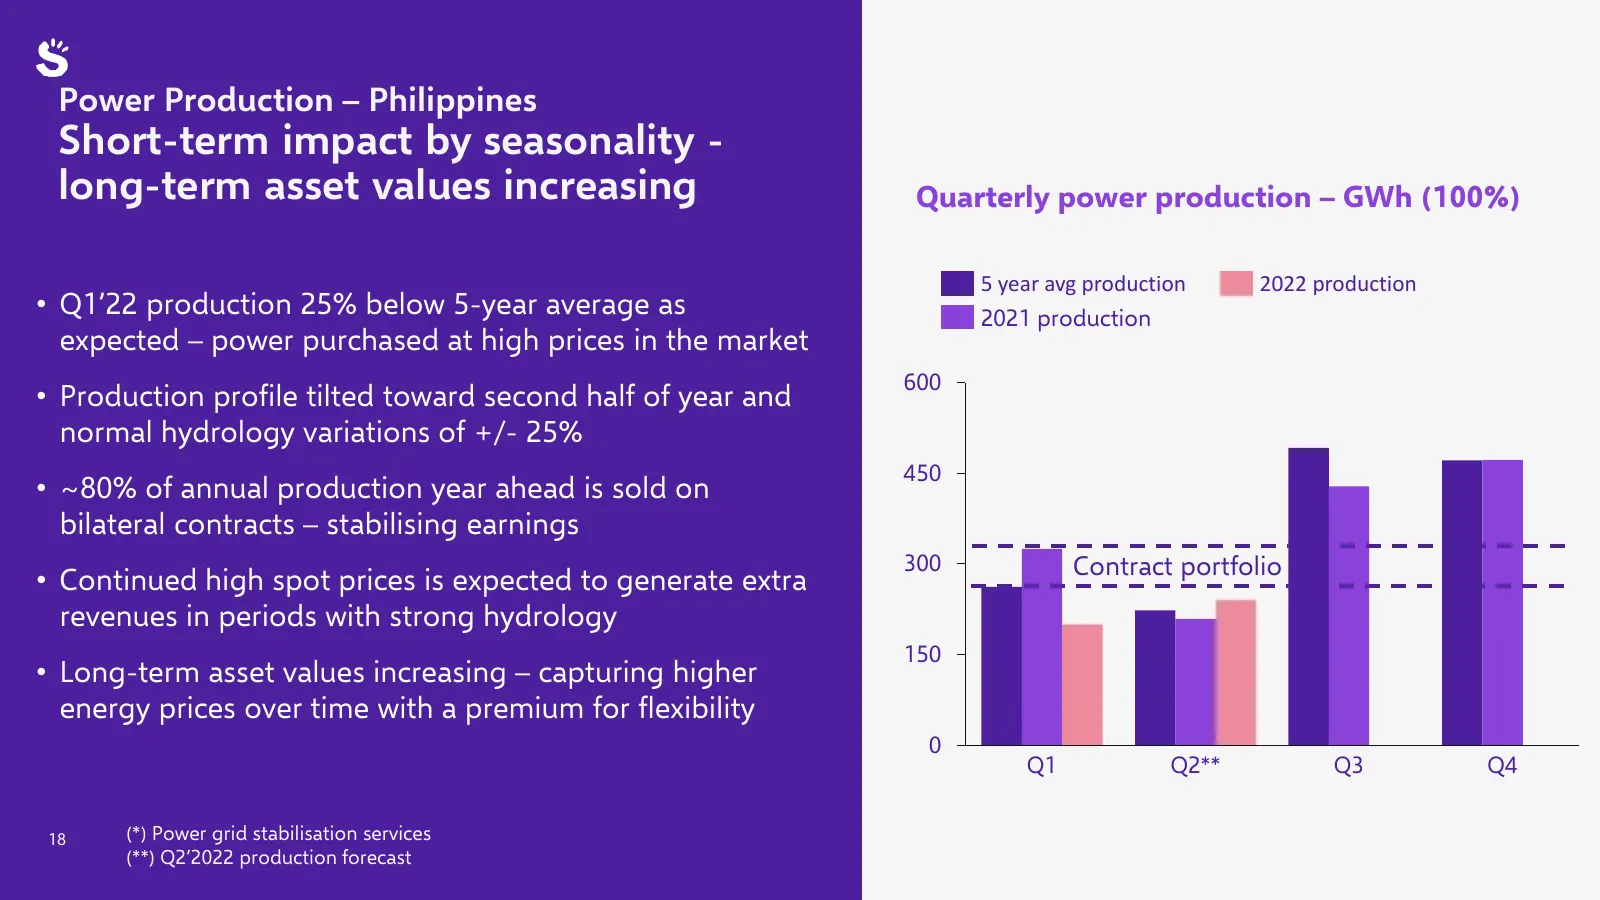
Power Production – Philippines Short-term impact by seasonality - long-term asset values increasing Quarterly power production – GWh (100%) 5 year avg production 2022 production • Q1’22 production 25% below 5-year average as 2021 production expected – power purchased at high prices in the market 600
Slide 19: A solid financial position
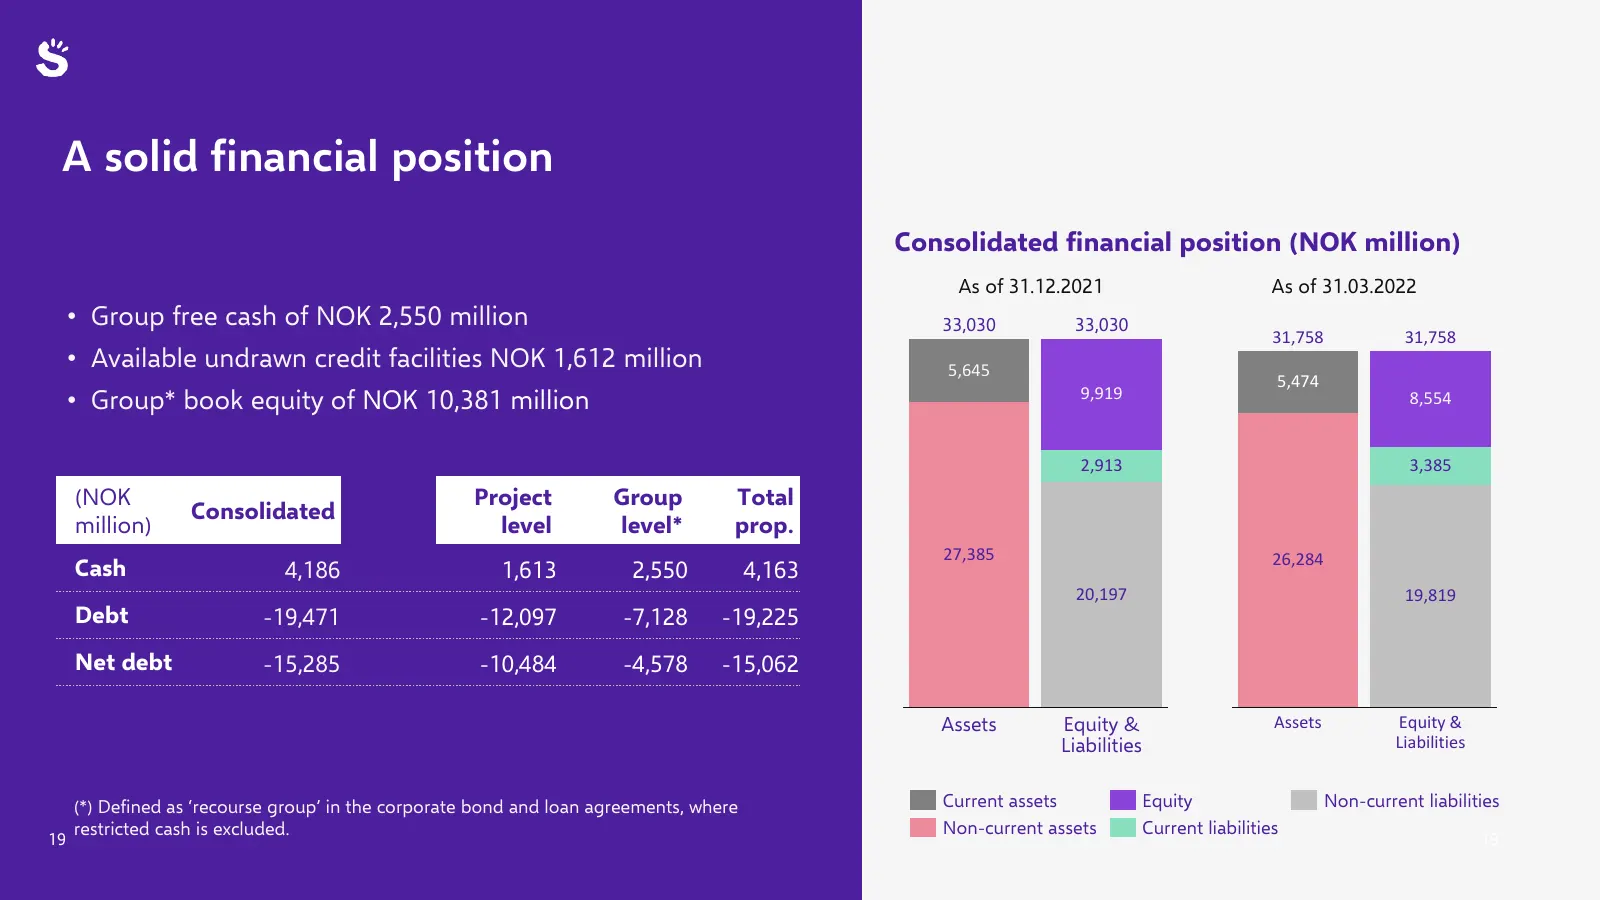
A solid financial position Consolidated financial position (NOK million) As of 31.12.2021 As of 31.03.2022 • Group free cash of NOK 2,550 million 33,030 33,030 31,758 31,758 • Available undrawn credit facilities NOK 1,612 million 5,645 5,474 • Group* book equity of NOK 10,381 million 9,919 8,554 2,9
Slide 20: Q1'22 movement of the Group's free cash
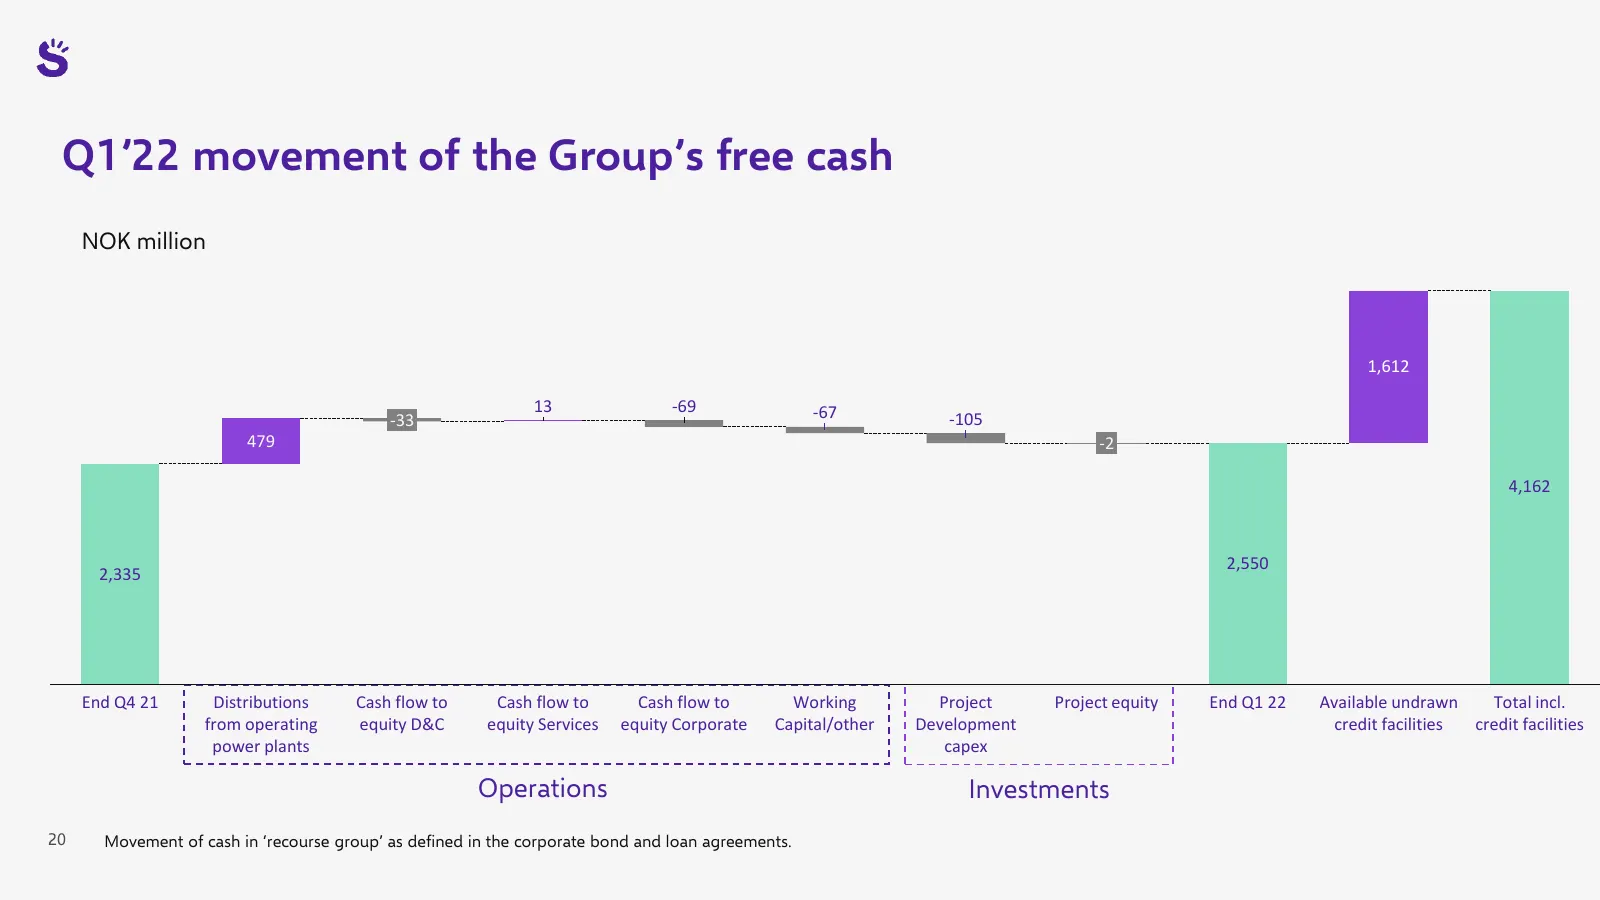
Q1’22 movement of the Group’s free cash NOK million 1,612 13 -69 -67 -33 -105 479 -2 4,162 2,550 2,335 End Q4 21 Distributions Cash flow to Cash flow to Cash flow to Working Project Project equity End Q1 22 Available undrawn Total incl. from operating equity D&C equity Services equity Corporate Capi

Slide 21: Outlook
04 Outlook Scatec
Slide 22: Project backlog progressing with returns in line with guidance
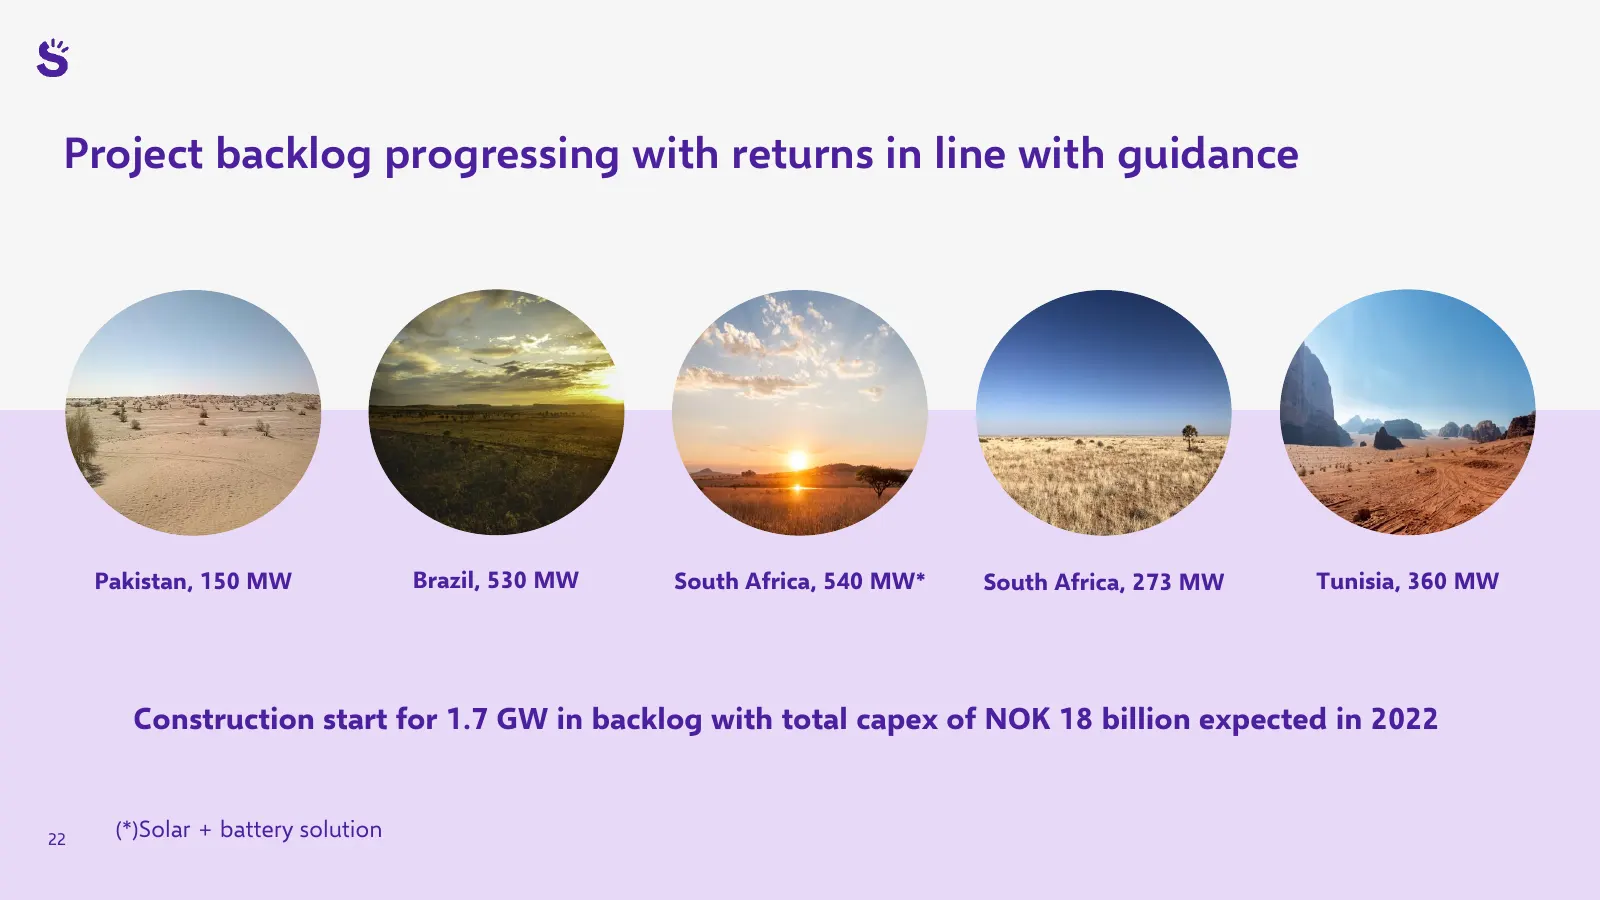
Project backlog progressing with returns in line with guidance Pakistan, 150 MW Brazil, 530 MW South Africa, 540 MW* South Africa, 273 MW Tunisia, 360 MW Construction start for 1.7 GW in backlog with total capex of NOK 18 billion expected in 2022 22 (*)Solar + battery solution
Slide 23: Developing a large pipeline across technologies to assure future growth
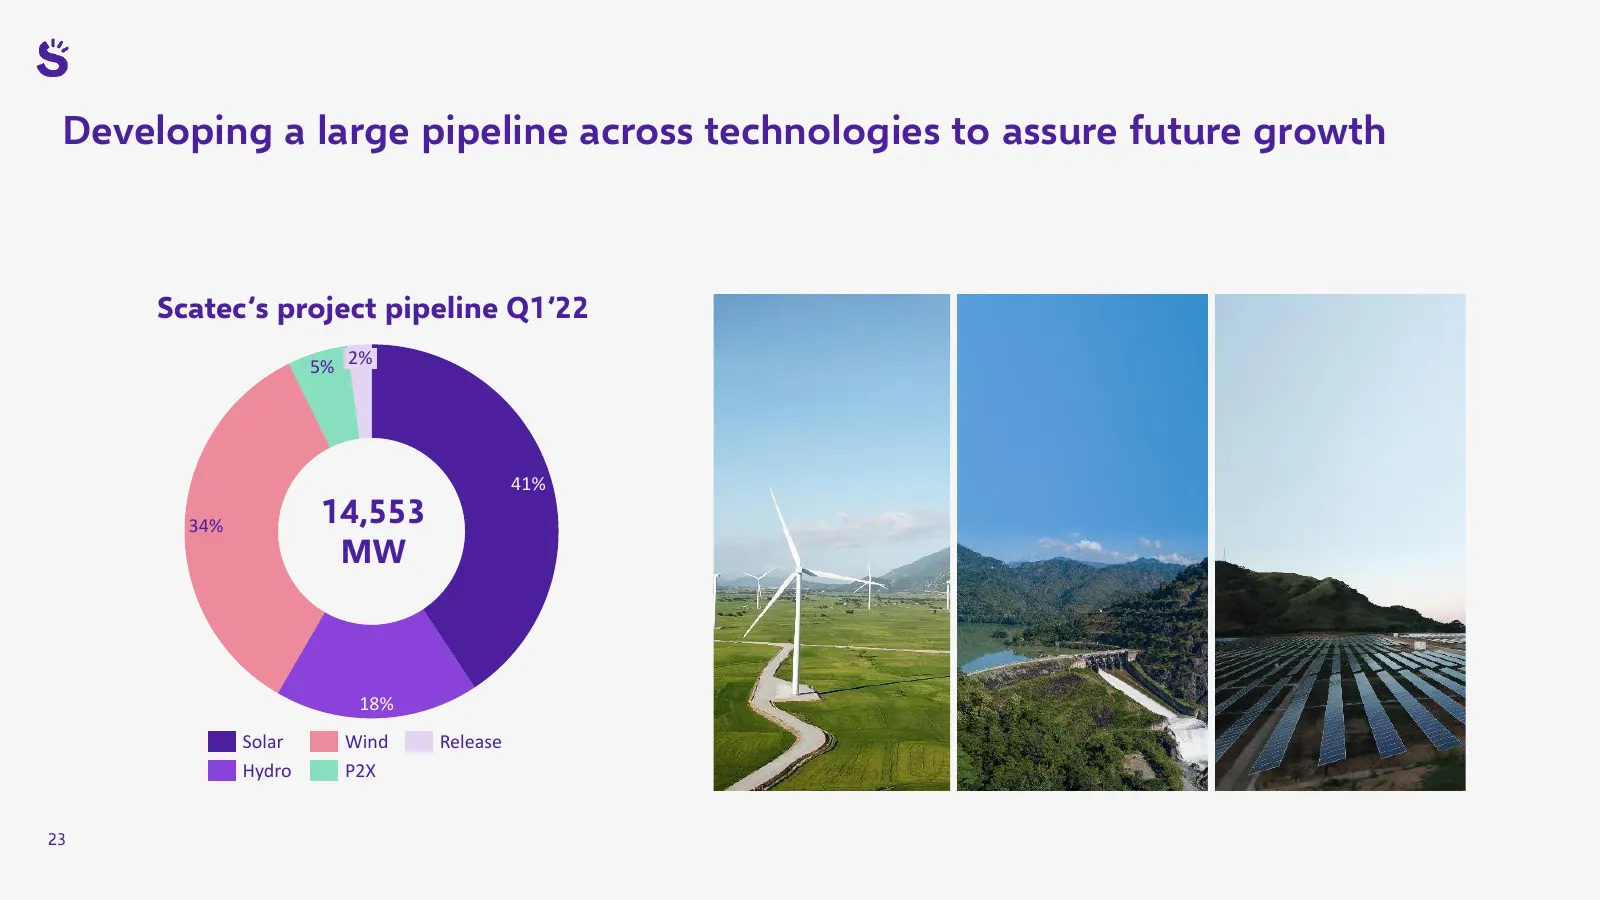
Developing a large pipeline across technologies to assure future growth Scatec’s project pipeline Q1’22 5% 2% 41% 34% 14,553 MW 18% Solar Wind Release Hydro P2X 23
Slide 24: Building strategic position within green ammonia and green hydrogen
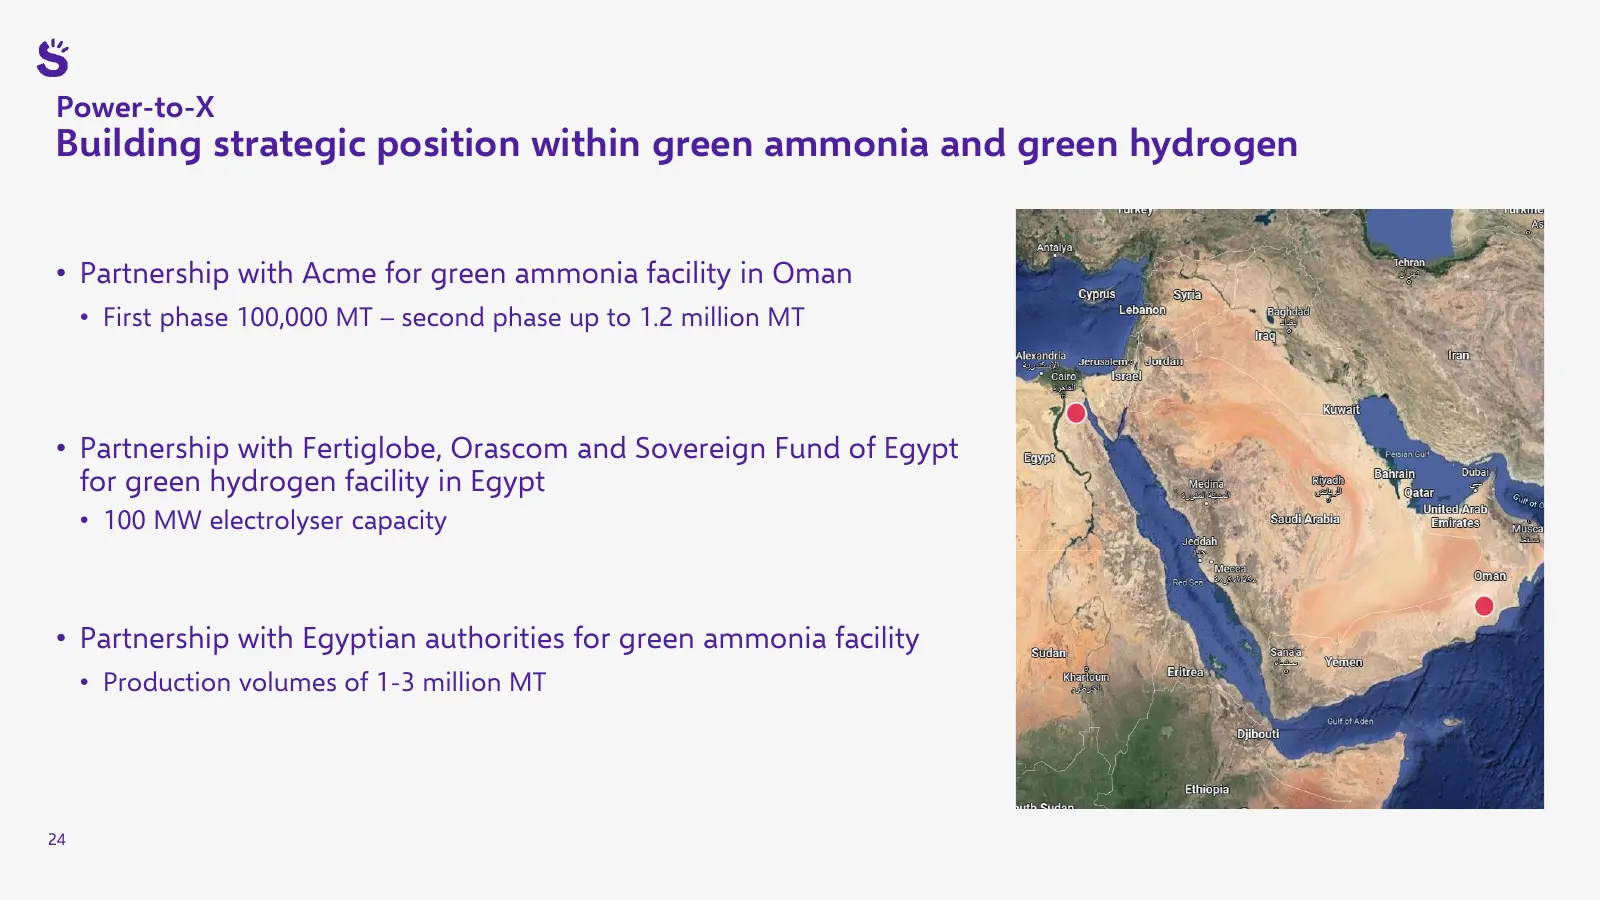
Power-to-X Building strategic position within green ammonia and green hydrogen • Partnership with Acme for green ammonia facility in Oman • First phase 100,000 MT – second phase up to 1.2 million MT • Partnership with Fertiglobe, Orascom and Sovereign Fund of Egypt for green hydrogen facility in Egy
Slide 25: 2022 guidance
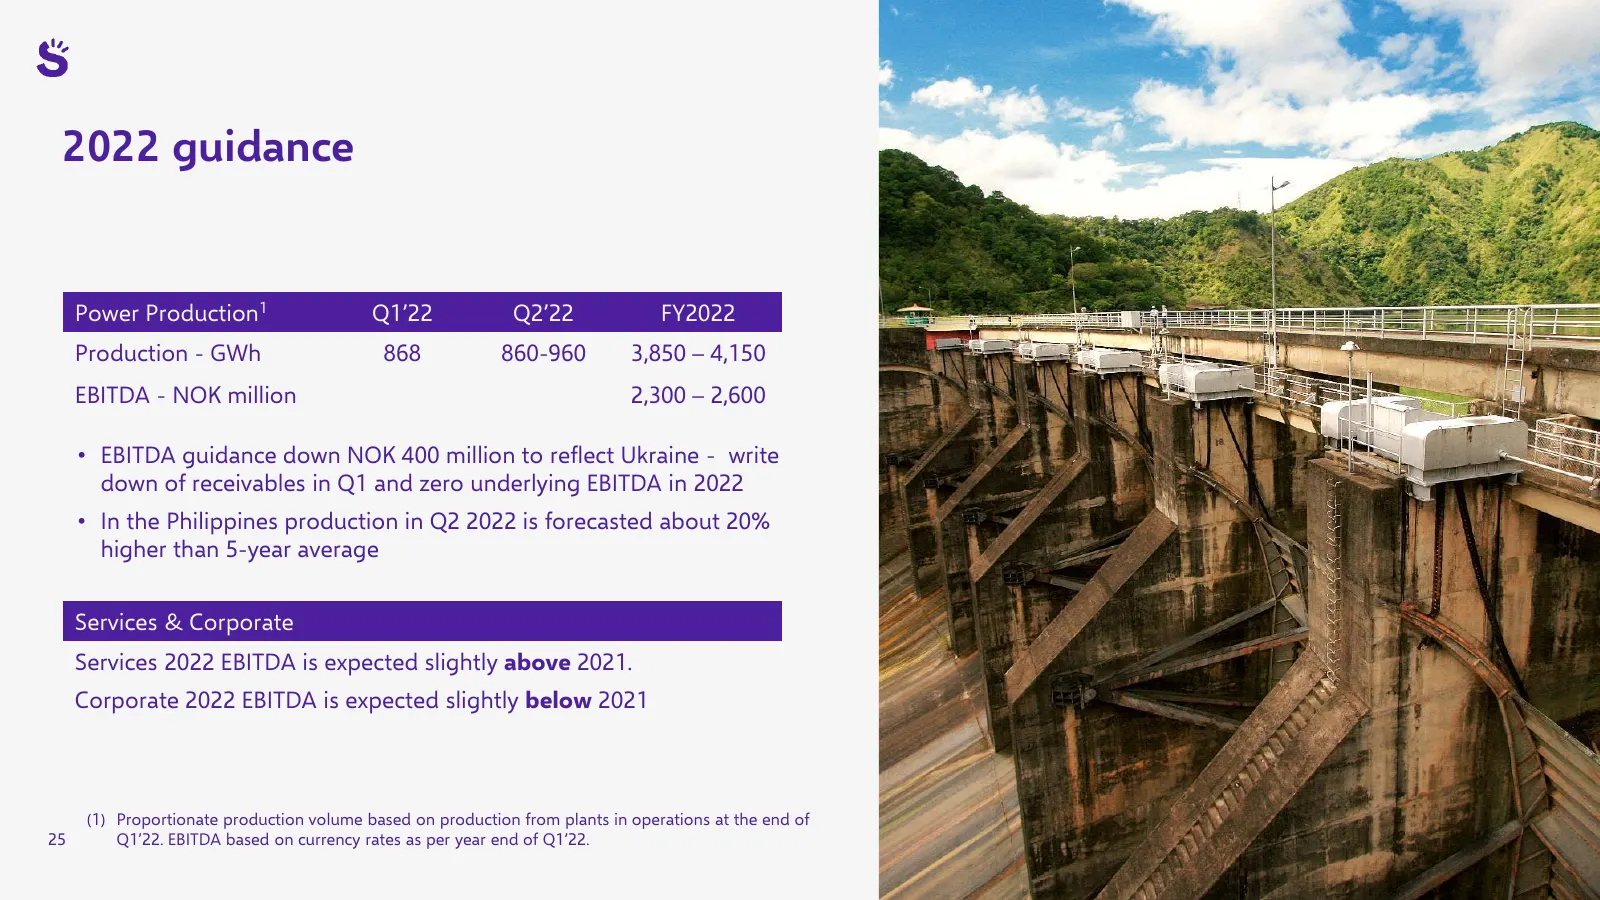
2022 guidance Power Production1 Q1’22 Q2’22 FY2022 Production - GWh 868 860-960 3,850 – 4,150 EBITDA - NOK million 2,300 – 2,600 INSERT • EBITDA guidance down NOK 400 million to reflect Ukraine - write PICTURE down of receivables in Q1 and zero underlying EBITDA in 2022 • In the Philippines producti
Slide 26: A renewable solution provider well positioned for further growth
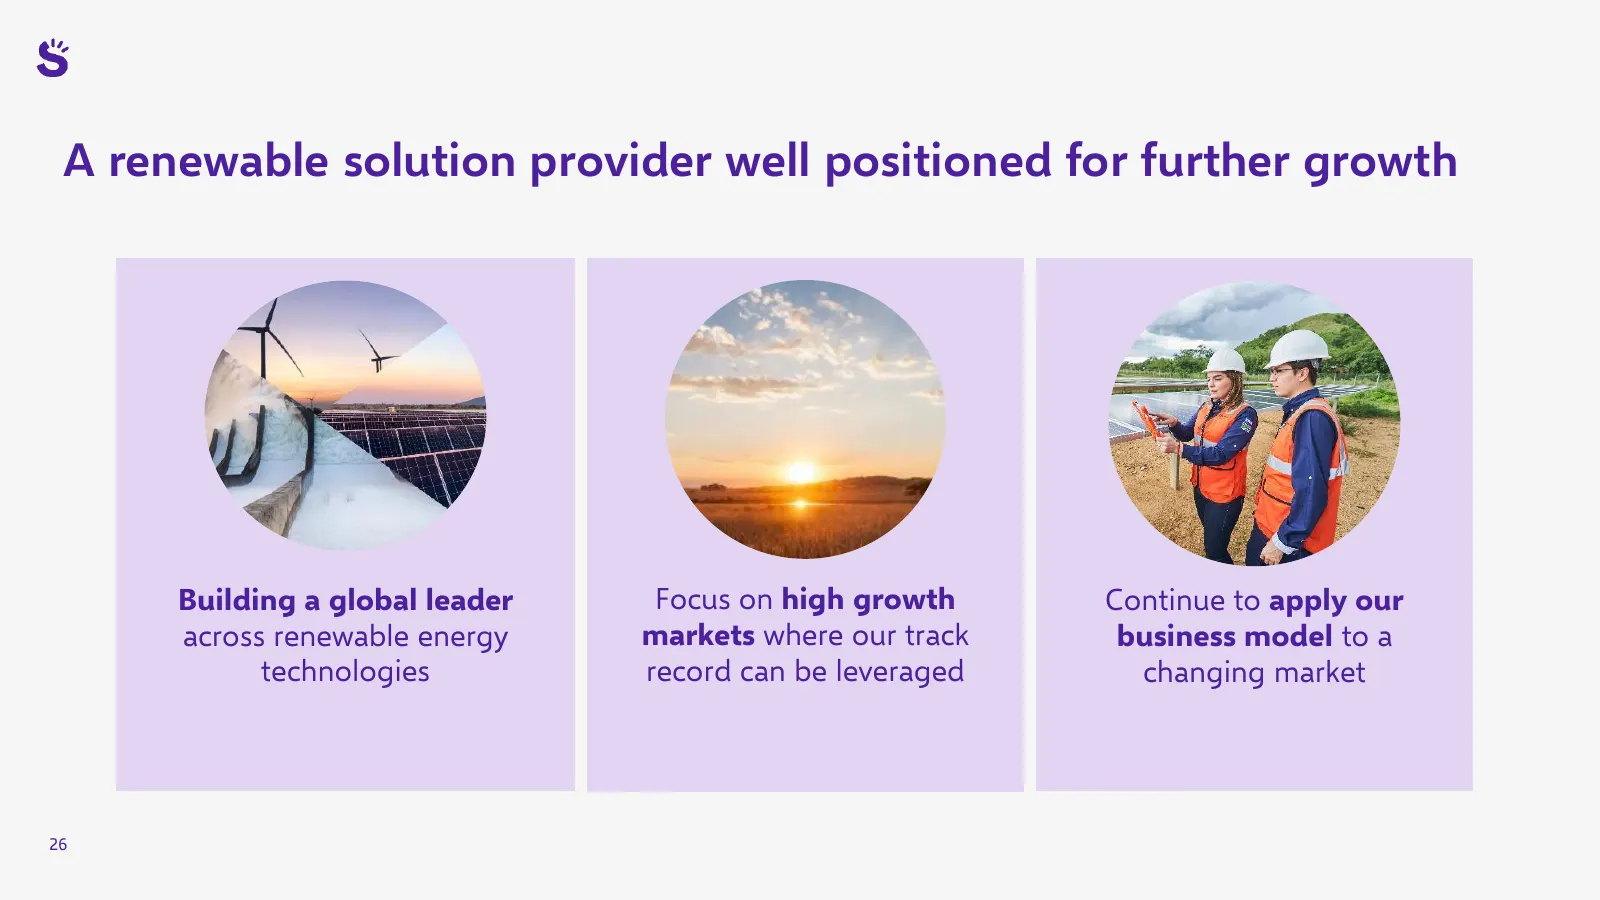
A renewable solution provider well positioned for further growth Building a global leader Focus on high growth Continue to apply our across renewable energy markets where our track business model to a technologies record can be leveraged changing market 26
Slide 27: Scatec improving our future
Scate improving our future
Slide 28: Our asset portfolio
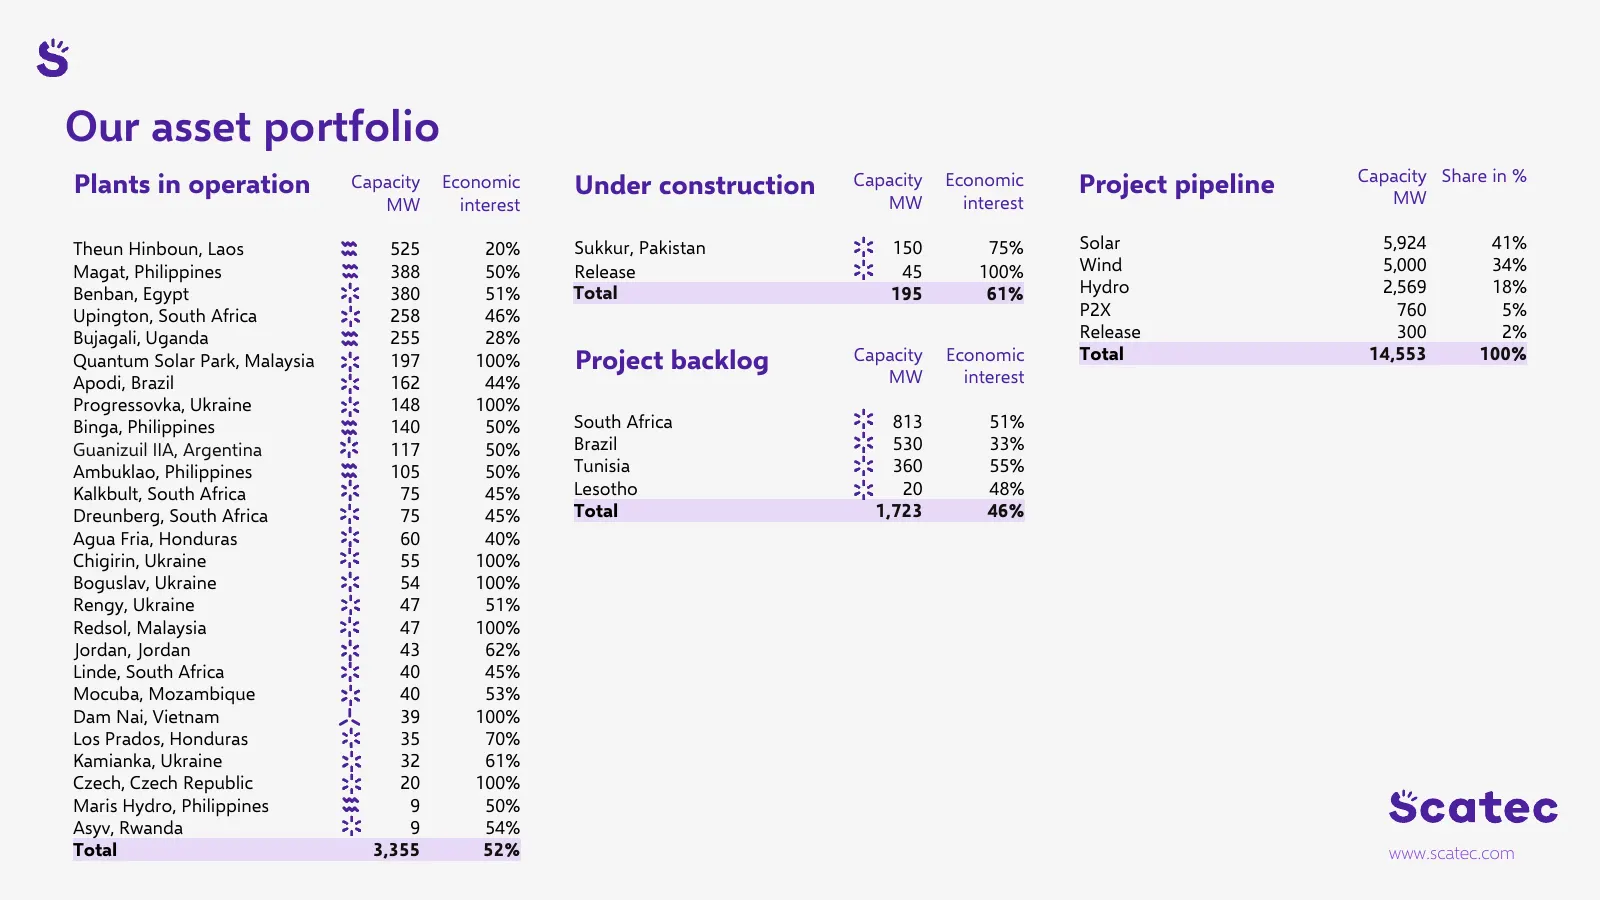
Our asset portfolio Capacity Share in % Plants in operation Capacity Economic Under construction Capacity Economic Project pipeline MW MW interest MW interest Theun Hinboun, Laos 525 20% Sukkur, Pakistan 150 75% Solar 5,924 41% Magat, Philippines 388 50% Release 45 100% Wind 5,000 34% Benban, Egypt
Source: Internet Archive copy of scatec.com
More decks from Scatec ASA
 Q3 2026 Earnings Presentation32 slides · Oct 30, 2026
 Q2 2026 Earnings Presentation23 slides · Aug 21, 2026
 Investor Presentation (August 2026)22 slides · August 2026
 Q1 2026 Earnings Presentation23 slides · May 6, 2026
 Investor Presentation (March 2026)22 slides · March 2026
 Q4 2025 Earnings Presentation24 slides · Jan 30, 2026