Pepco — Morgan Stanley Utilities Conference (March 2012)
28 slides from Pepco's conference presentation, Mar 7, 2012

Slide 1: Morgan Stanley Utilities Conference
NEW YORK, NY • MARCH 8, 2012 Morgan Stanley Utilities Conference
Slide 2: Safe Harbor Statement/Regulation G Information
Safe Harbor Statement/Regulation G Information Some of the statements contained in today’s presentation with respect to Pepco Holdings, Pepco, Delmarva Power and Atlantic City Electric, and each of their respective subsidiaries, are forward-looking statements within the meaning of the U.S. federal s
Slide 3: PHI's Strategic Focus
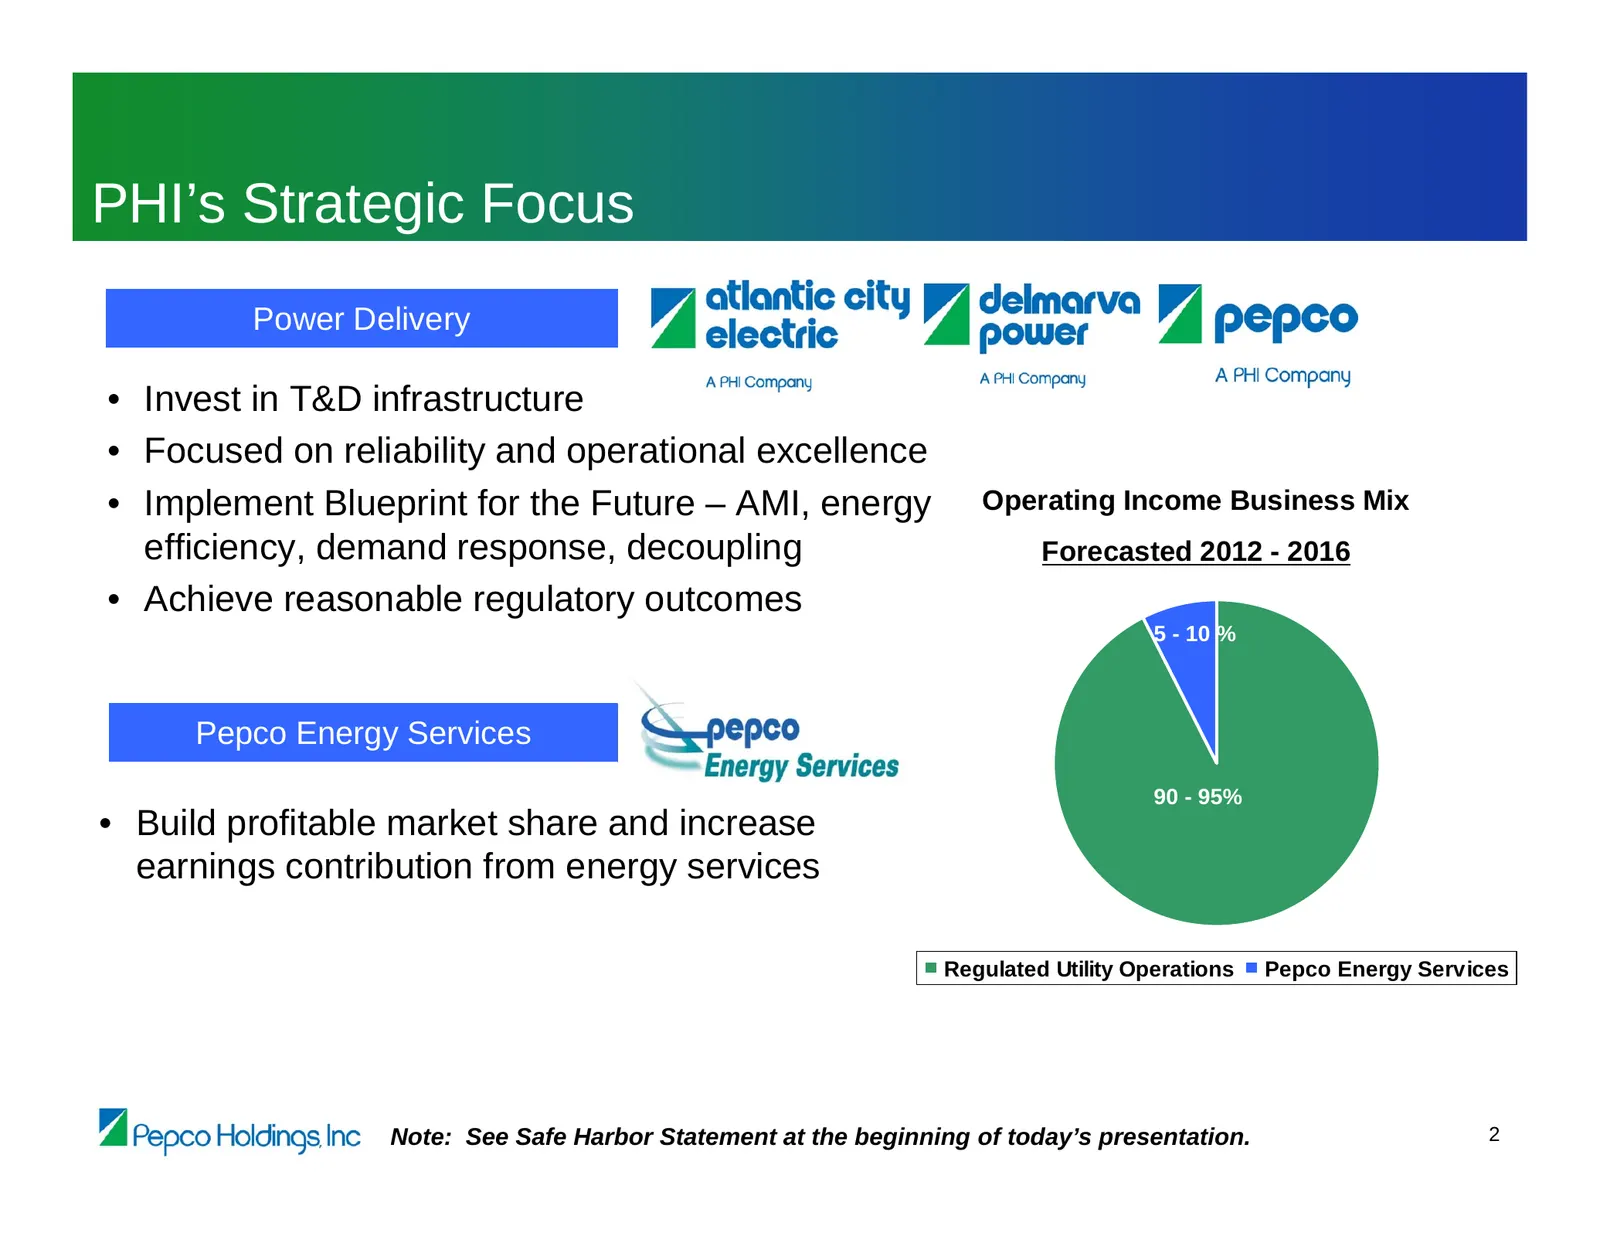
PHI’s Strategic Focus Power Delivery • Invest in T&D infrastructure • Focused on reliability and operational excellence • Implement Blueprint for the Future – AMI, energy Operating Income Business Mix efficiency, demand response, decoupling Forecasted 2012 - 2016 • Achieve reasonable regulatory outc
Slide 4: Power Delivery – Growth Opportunity
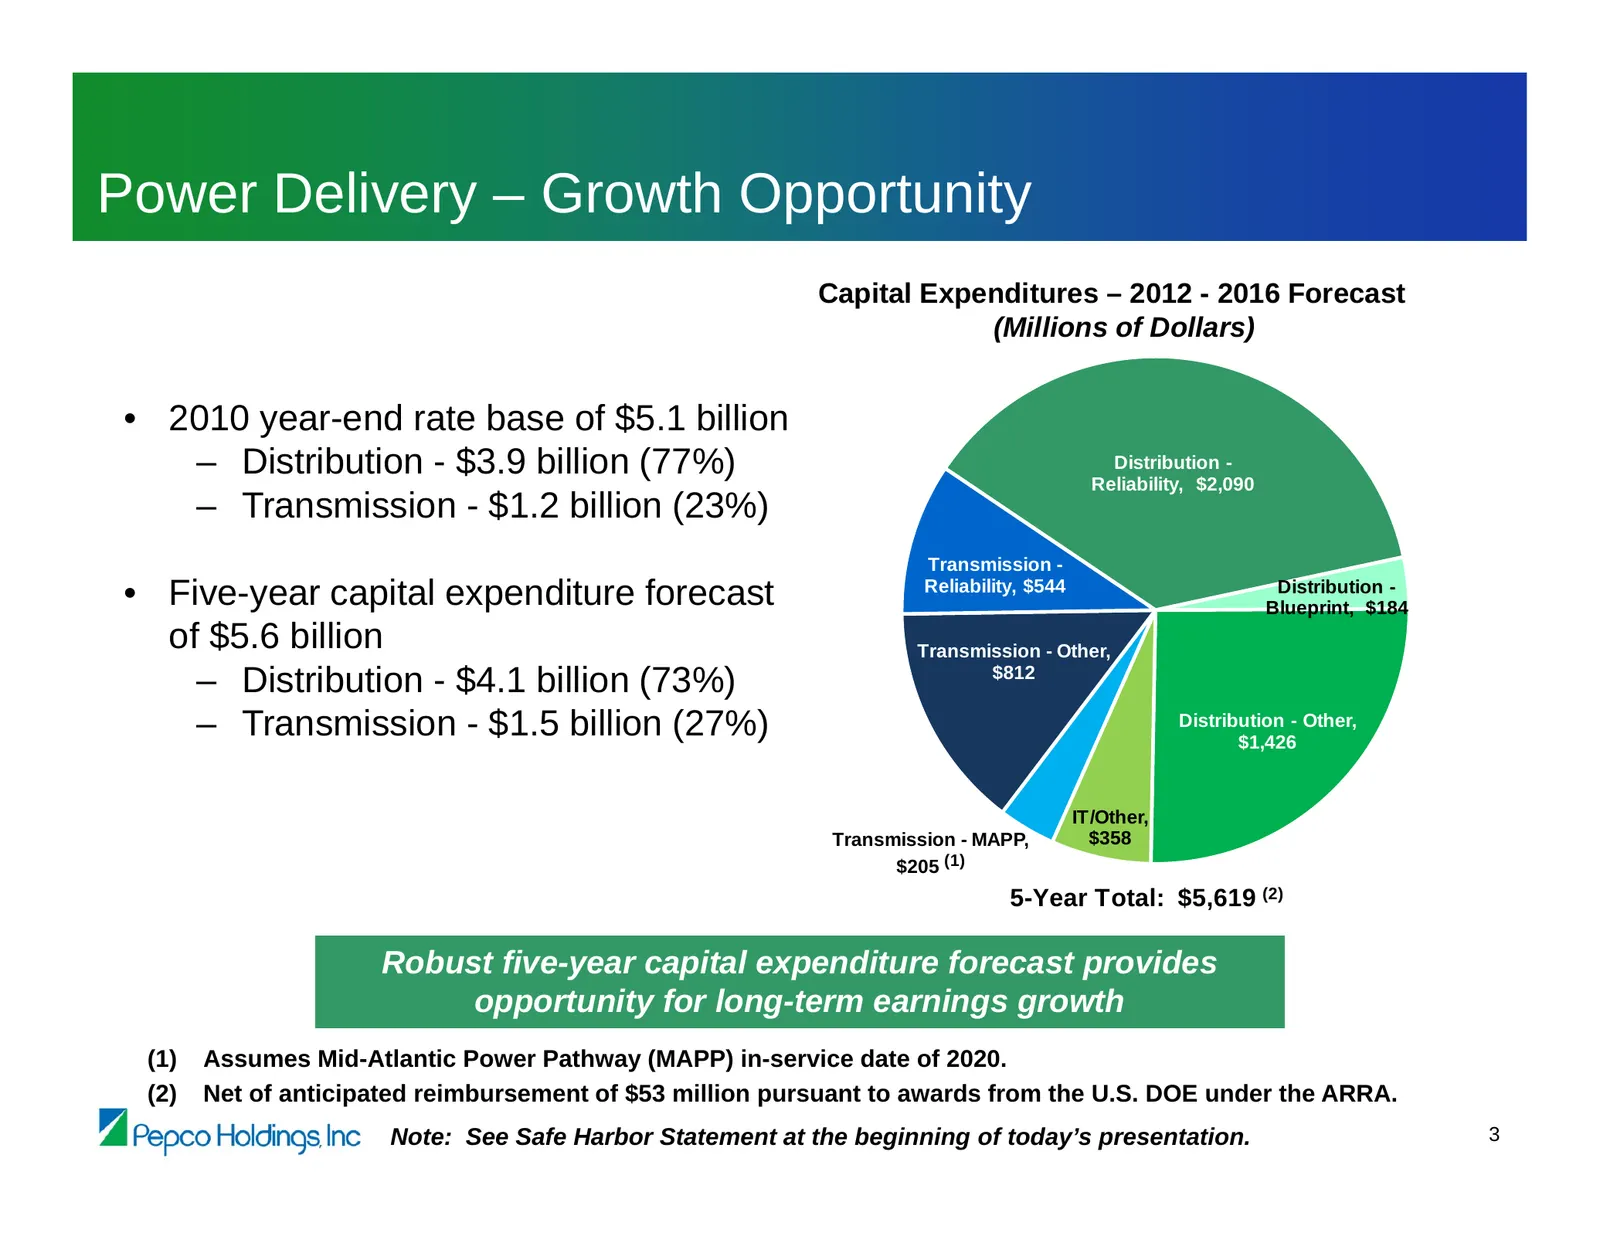
Power Delivery – Growth Opportunity Capital Expenditures – 2012 - 2016 Forecast (Millions of Dollars) • 2010 year-end rate base of $5.1 billion – Distribution - $3.9 billion (77%) Distribution - Reliability, $2,090 – Transmission - $1.2 billion (23%) Transmission - • Five-year capital expenditure fo
Slide 5: Reliability Enhancement Plan – Improving System Reliability is a Top Priority
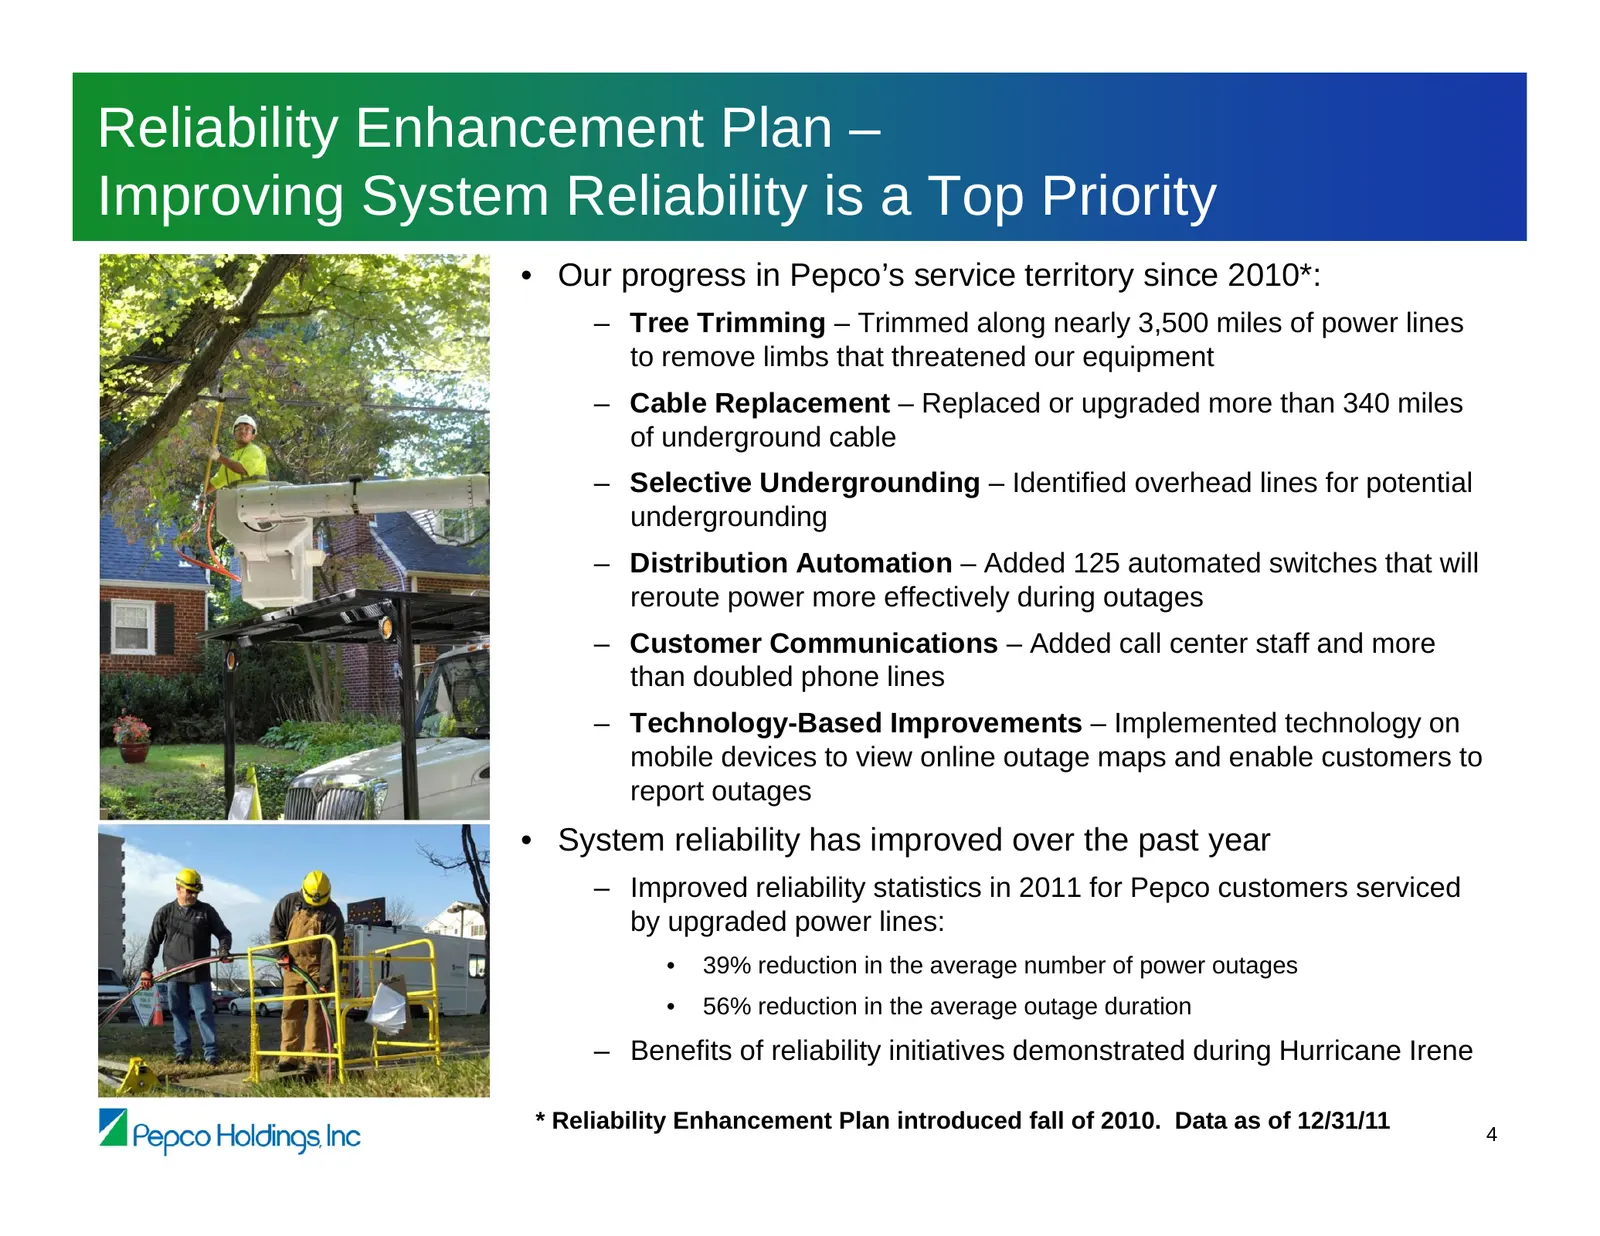
Reliability Enhancement Plan – Improving System Reliability is a Top Priority • Our progress in Pepco’s service territory since 2010*: – Tree Trimming – Trimmed along nearly 3,500 miles of power lines to remove limbs that threatened our equipment – Cable Replacement – Replaced or upgraded more than
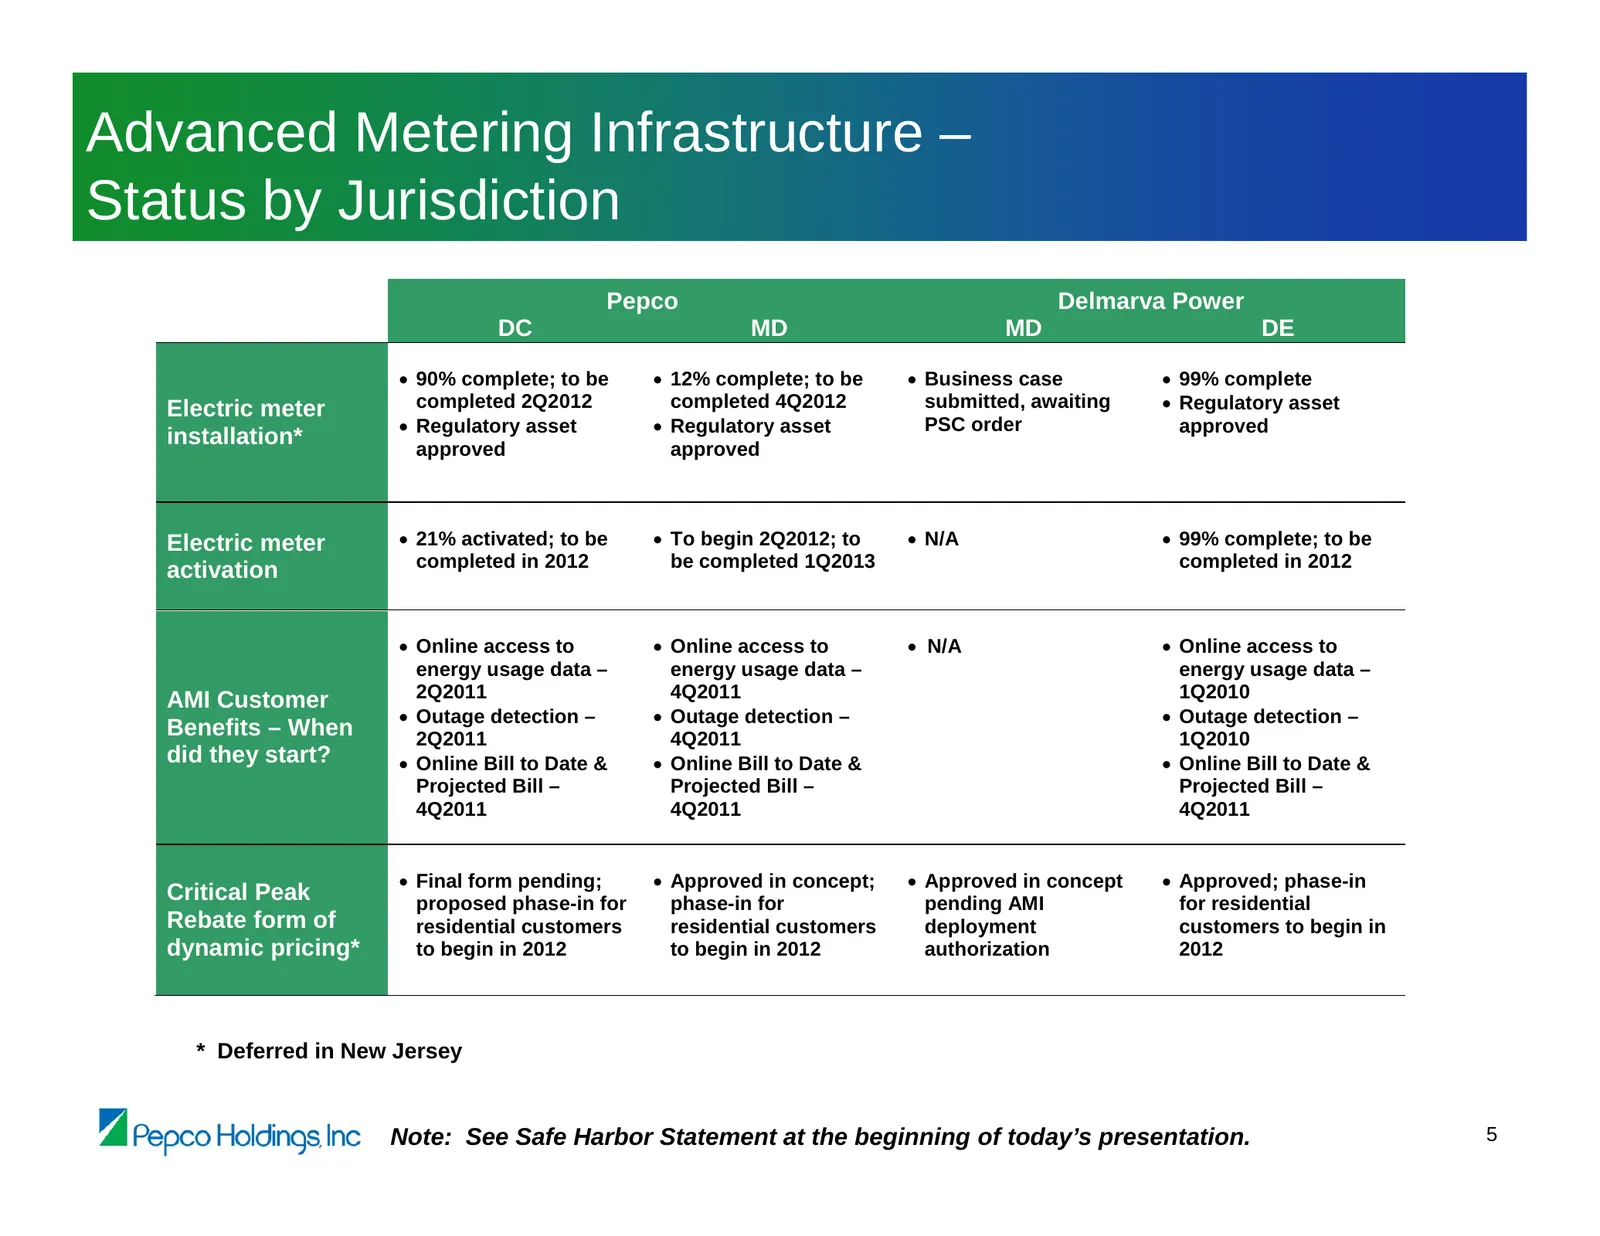
Slide 6: Advanced Metering Infrastructure – Status by Jurisdiction
Advanced Metering Infrastructure – Status by Jurisdiction Pepco Delmarva Power DC MD MD DE 90% complete; to be 12% complete; to be Business case 99% complete Electric meter completed 2Q2012 completed 4Q2012 submitted, awaiting Regulatory asset Regulatory asset Regulatory asset PSC orde
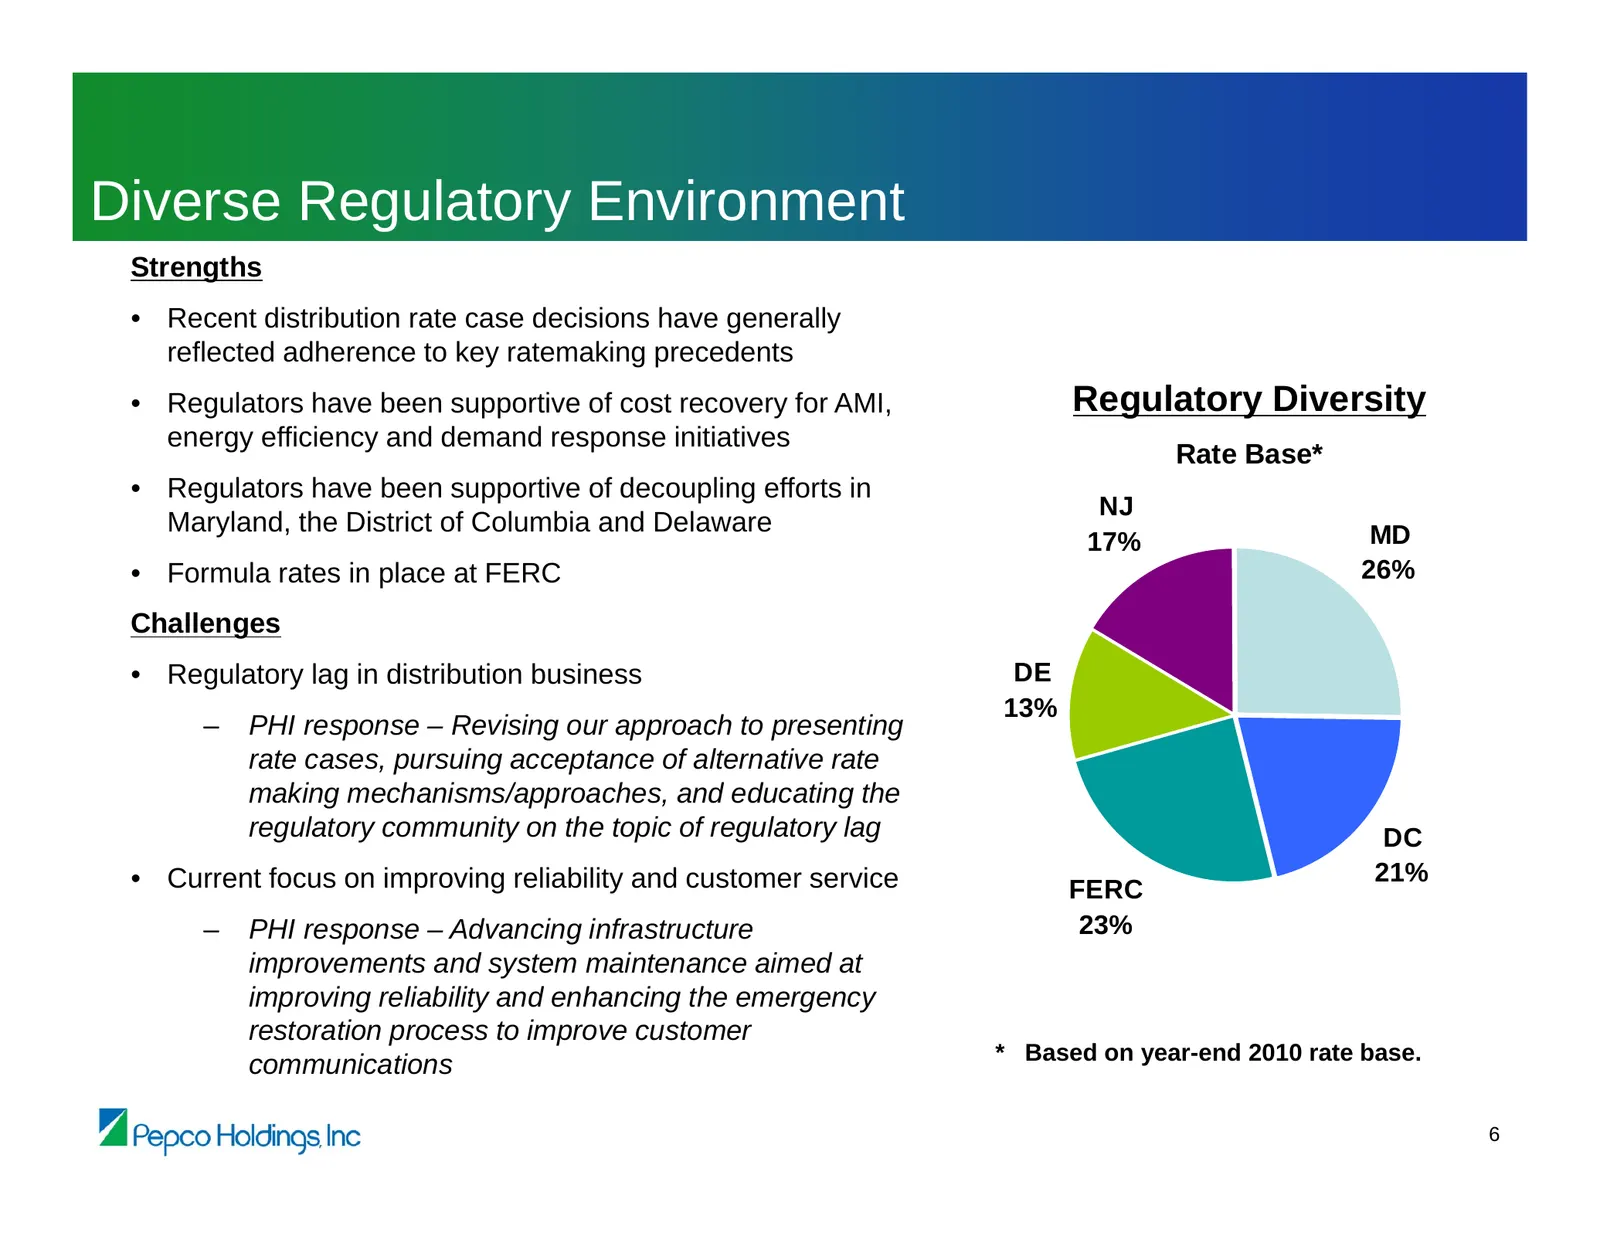
Slide 7: Diverse Regulatory Environment
Diverse Regulatory Environment Strengths • Recent distribution rate case decisions have generally reflected adherence to key ratemaking precedents • Regulators have been supportive of cost recovery for AMI, Regulatory Diversity energy efficiency and demand response initiatives Rate Base* • Regulator
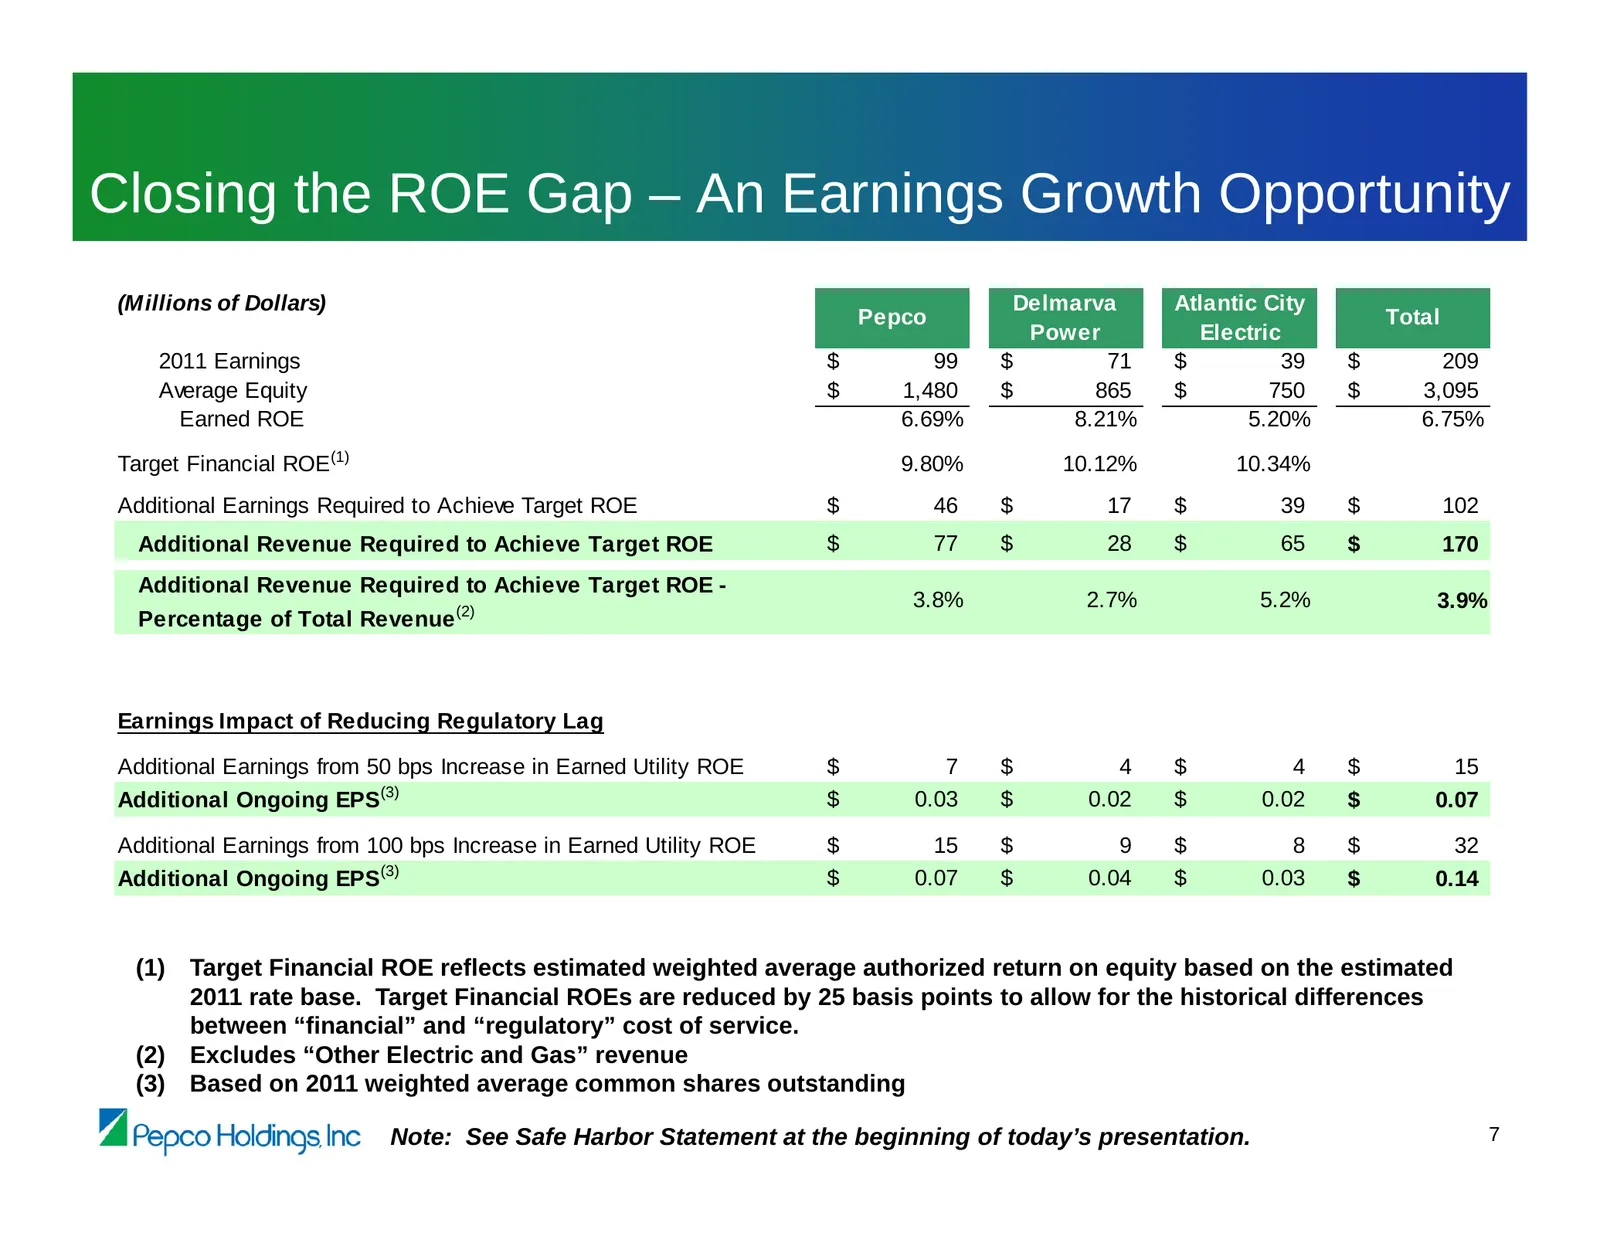
Slide 8: Closing the ROE Gap – An Earnings Growth Opportunity
Closing the ROE Gap – An Earnings Growth Opportunity (Millions of Dollars) Delmarva Atlantic City Pepco Total Power Electric 2011 Earnings $ 99 $ 71 $ 39 $ 209 Average Equity $ 1,480 $ 865 $ 750 $ 3,095 Earned ROE 6.69% 8.21% 5.20% 6.75% Target Financial ROE(1) 9.80% 10.12% 10.34% Additional Earning
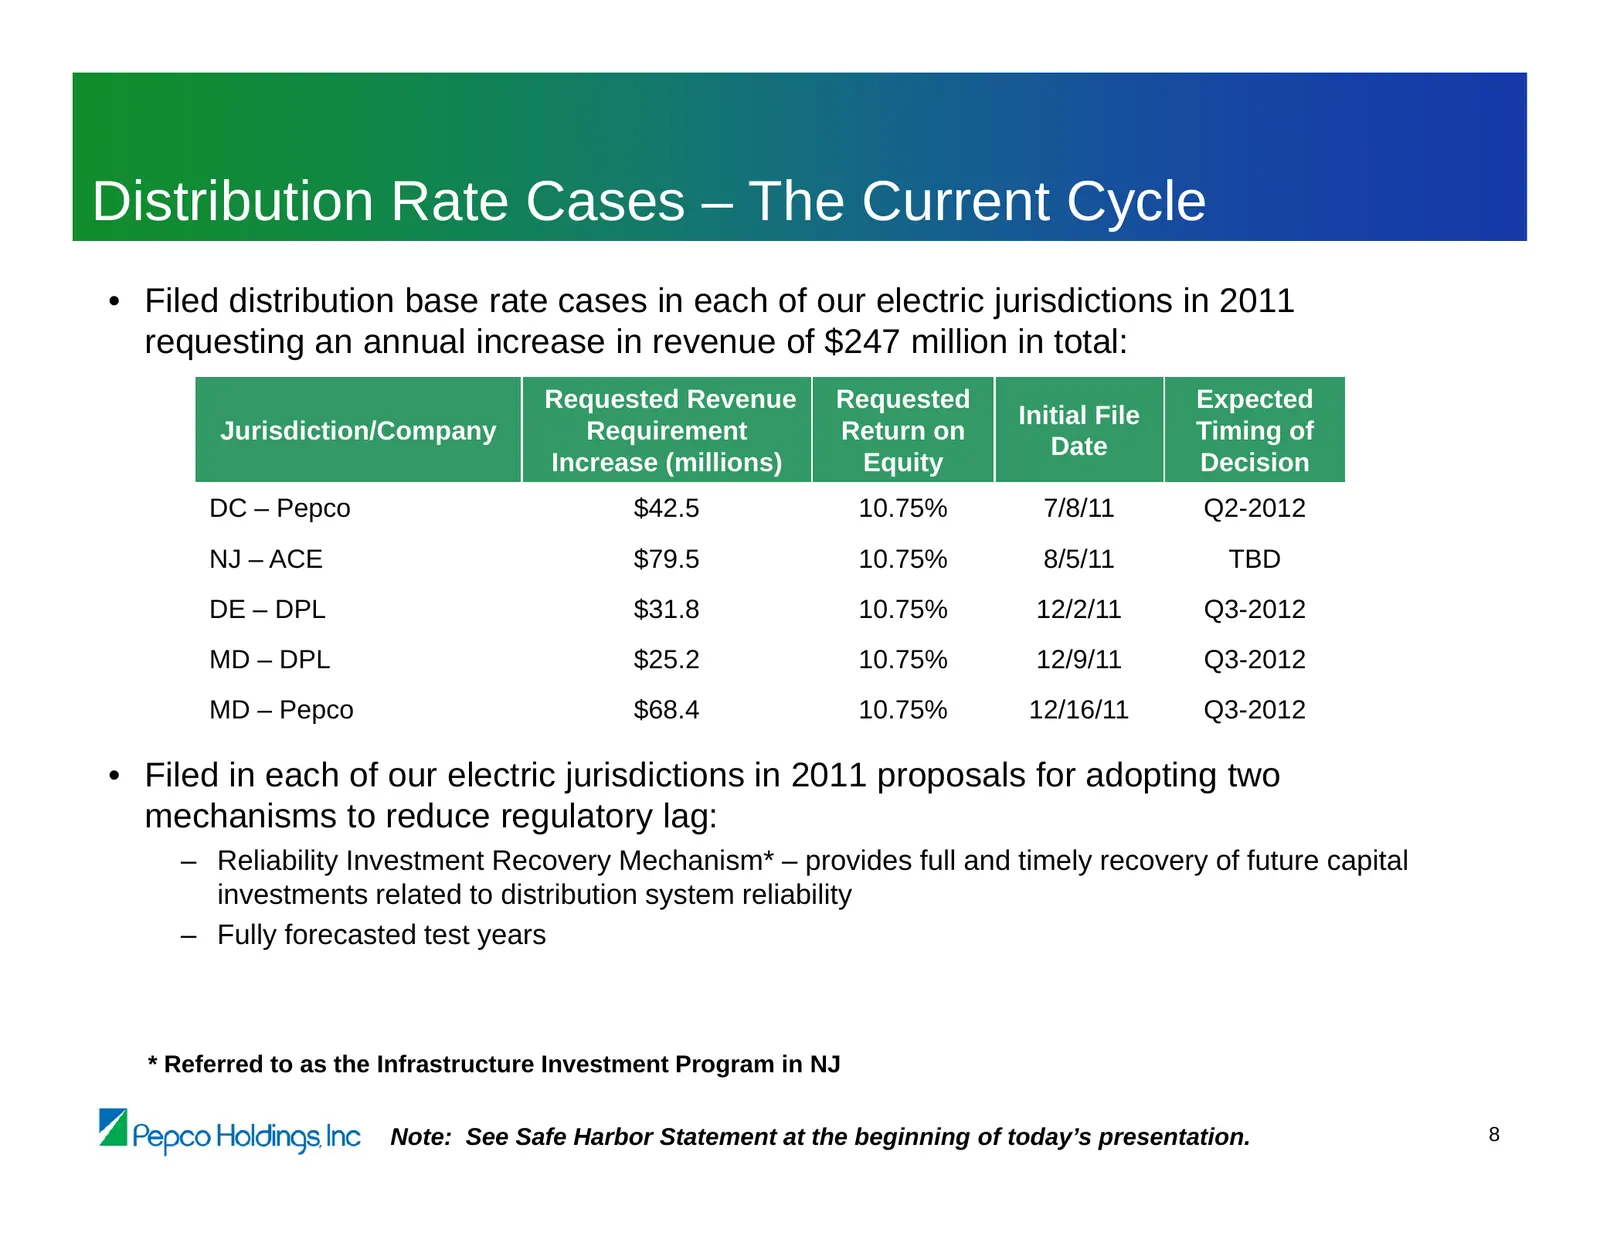
Slide 9: Distribution Rate Cases – The Current Cycle
Distribution Rate Cases – The Current Cycle • Filed distribution base rate cases in each of our electric jurisdictions in 2011 requesting an annual increase in revenue of $247 million in total: Requested Revenue Requested Expected Initial File Jurisdiction/Company Requirement Return on Timing of Dat
Slide 10: Distribution Rate Cases – Pending Pepco – District of Columbia
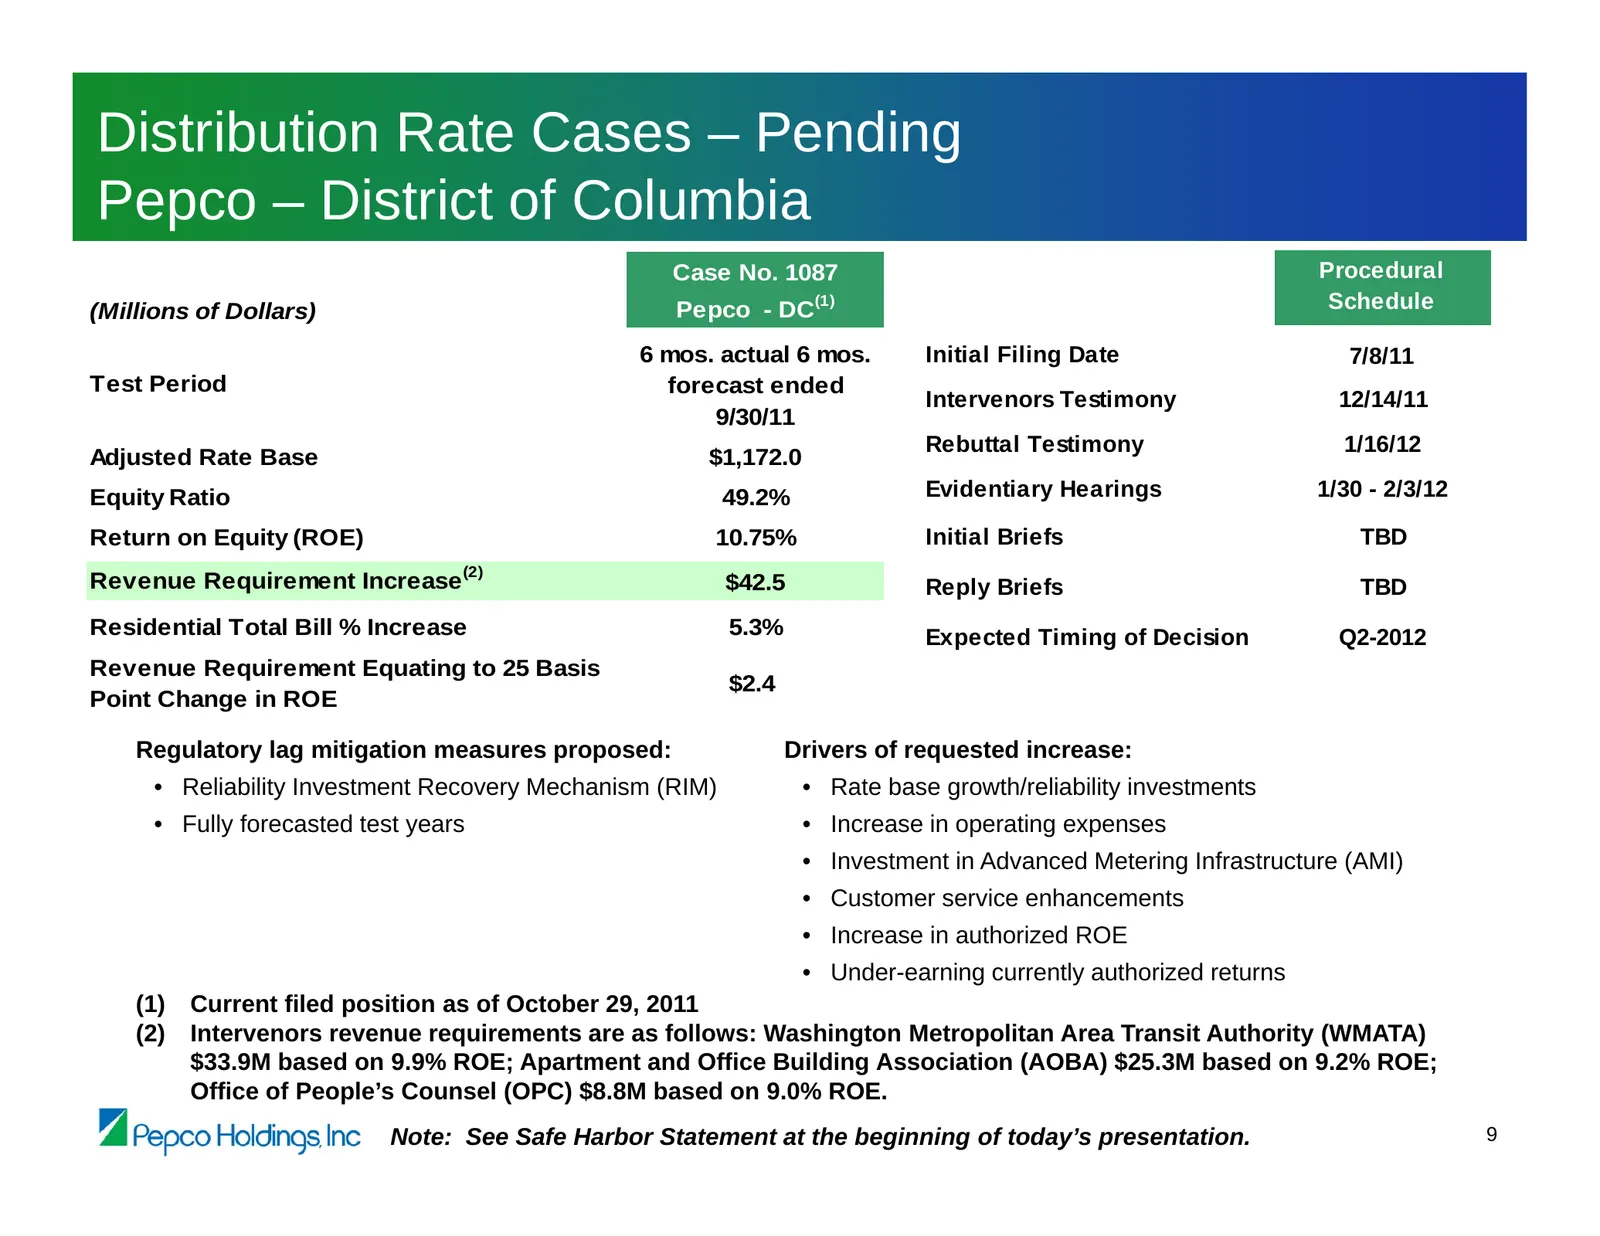
Distribution Rate Cases – Pending Pepco – District of Columbia Case No. 1087 Procedural (Millions of Dollars) Pepco - DC (1) Schedule 6 mos. actual 6 mos. Initial Filing Date 7/8/11 Test Period forecast ended Intervenors Testimony 12/14/11 9/30/11 Rebuttal Testimony 1/16/12 Adjusted Rate Base $1,172
Slide 11: Distribution Rate Cases – Pending Atlantic City Electric – New Jersey
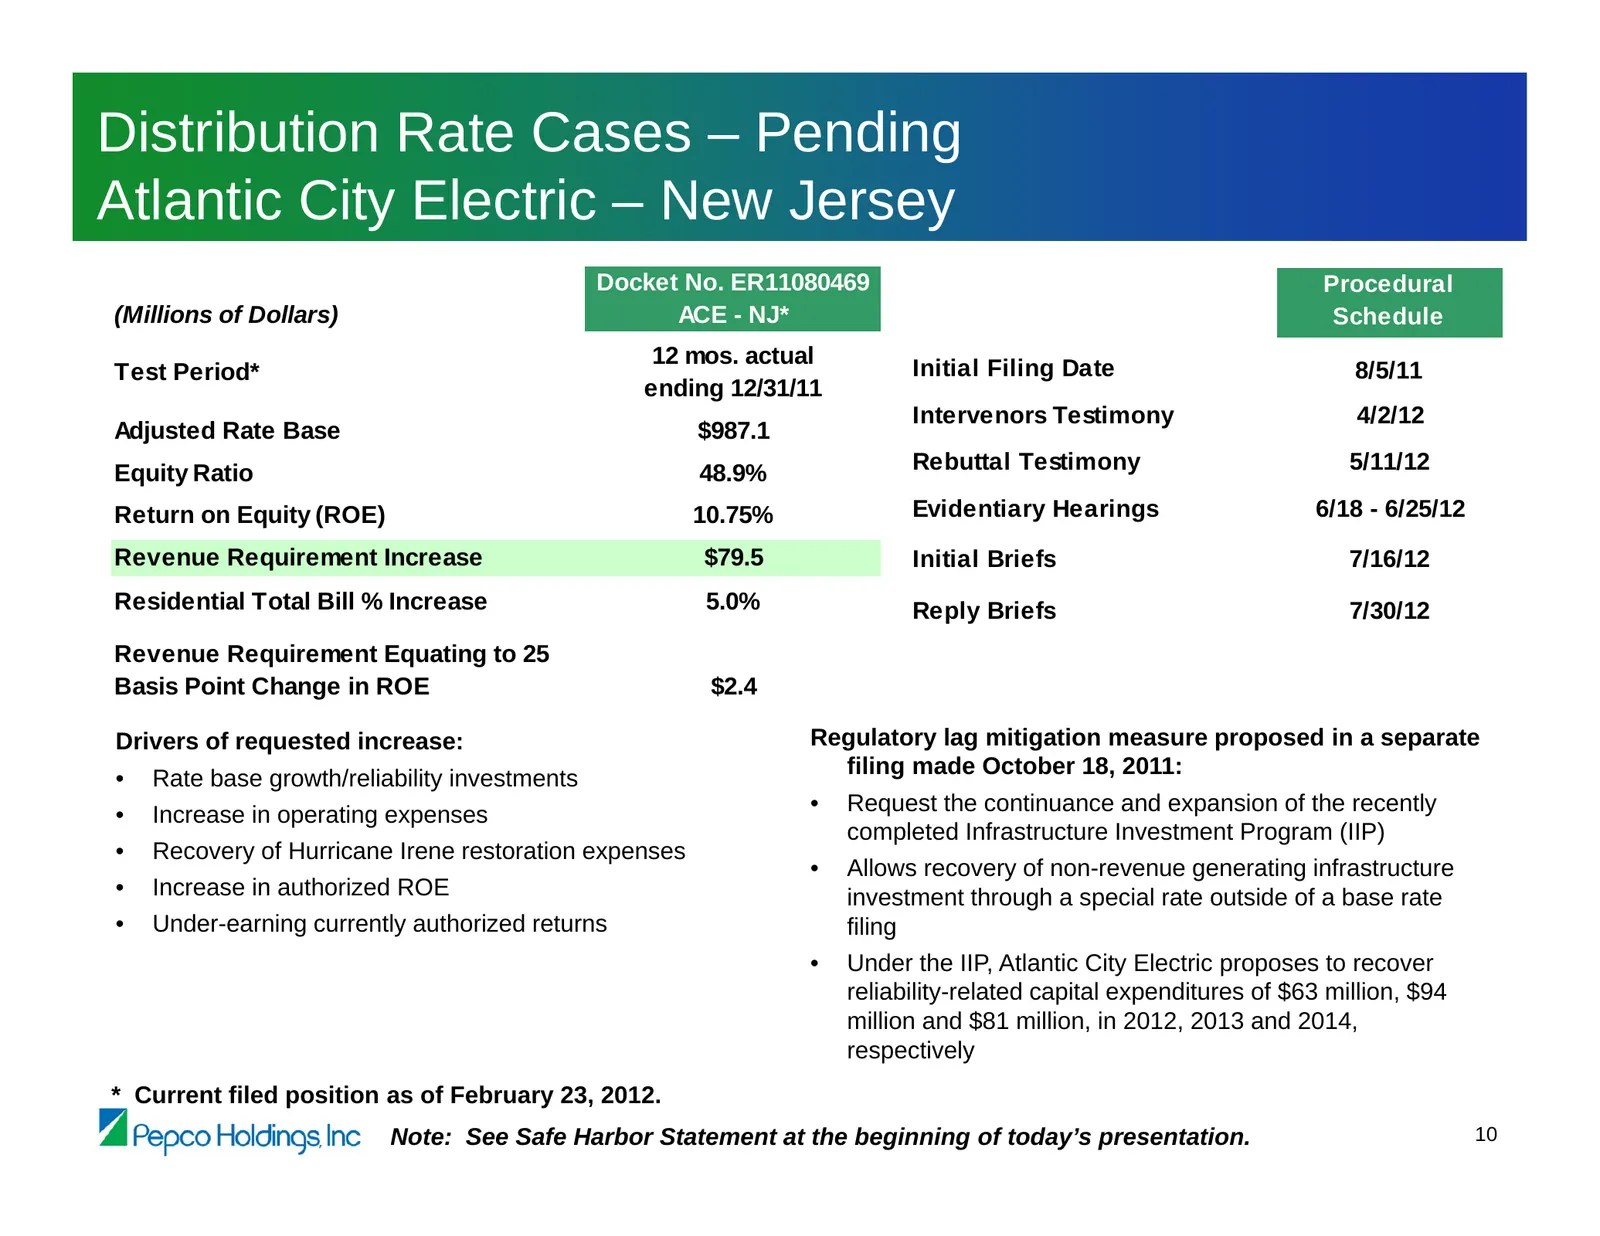
Distribution Rate Cases – Pending Atlantic City Electric – New Jersey Docket No. ER11080469 Procedural (Millions of Dollars) ACE - NJ* Schedule 12 mos. actual Test Period* Initial Filing Date 8/5/11 ending 12/31/11 Intervenors Testimony 4/2/12 Adjusted Rate Base $987.1 Equity Ratio 48.9% Rebuttal Te
Slide 12: Distribution Rate Cases – Pending Delmarva Power – Delaware Electric
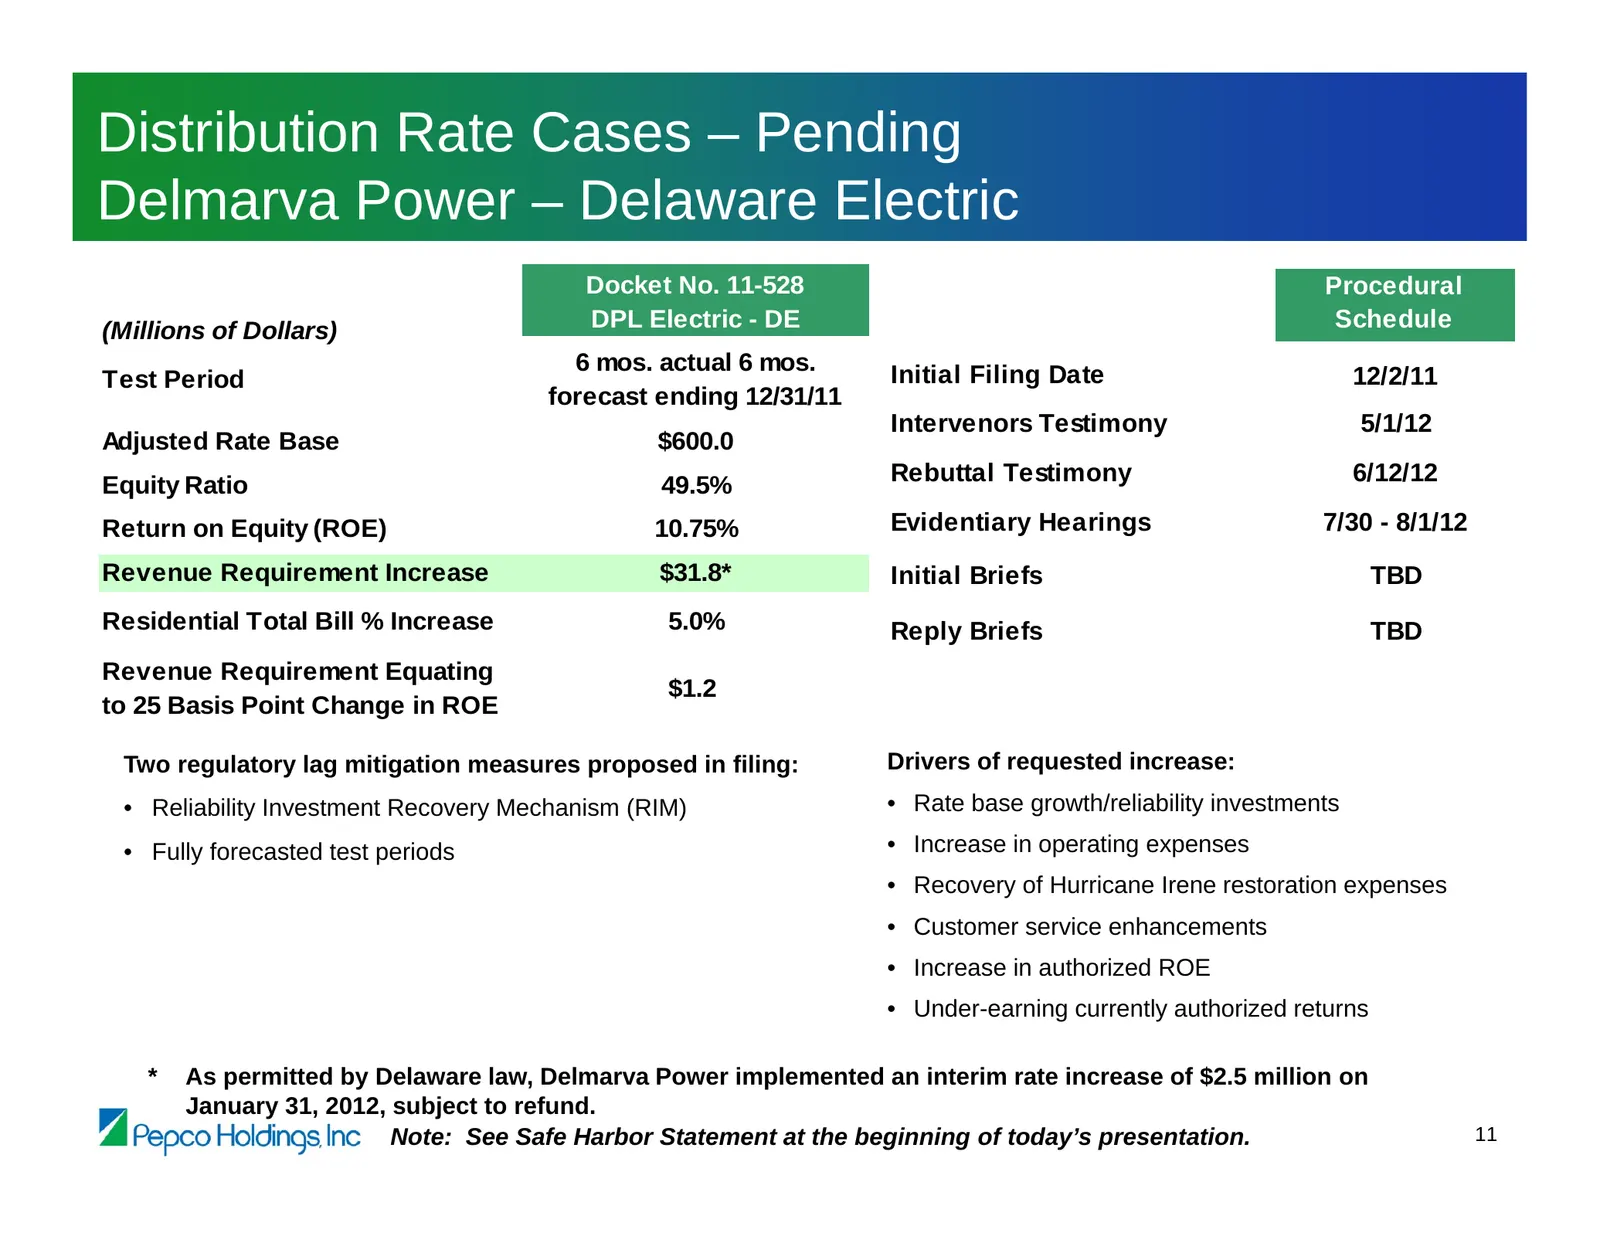
Distribution Rate Cases – Pending Delmarva Power – Delaware Electric Docket No. 11-528 Procedural (Millions of Dollars) DPL Electric - DE Schedule 6 mos. actual 6 mos. Initial Filing Date Test Period 12/2/11 forecast ending 12/31/11 Intervenors Testimony 5/1/12 Adjusted Rate Base $600.0 Equity Ratio
Slide 13: Distribution Rate Cases – Pending Delmarva Power – Maryland
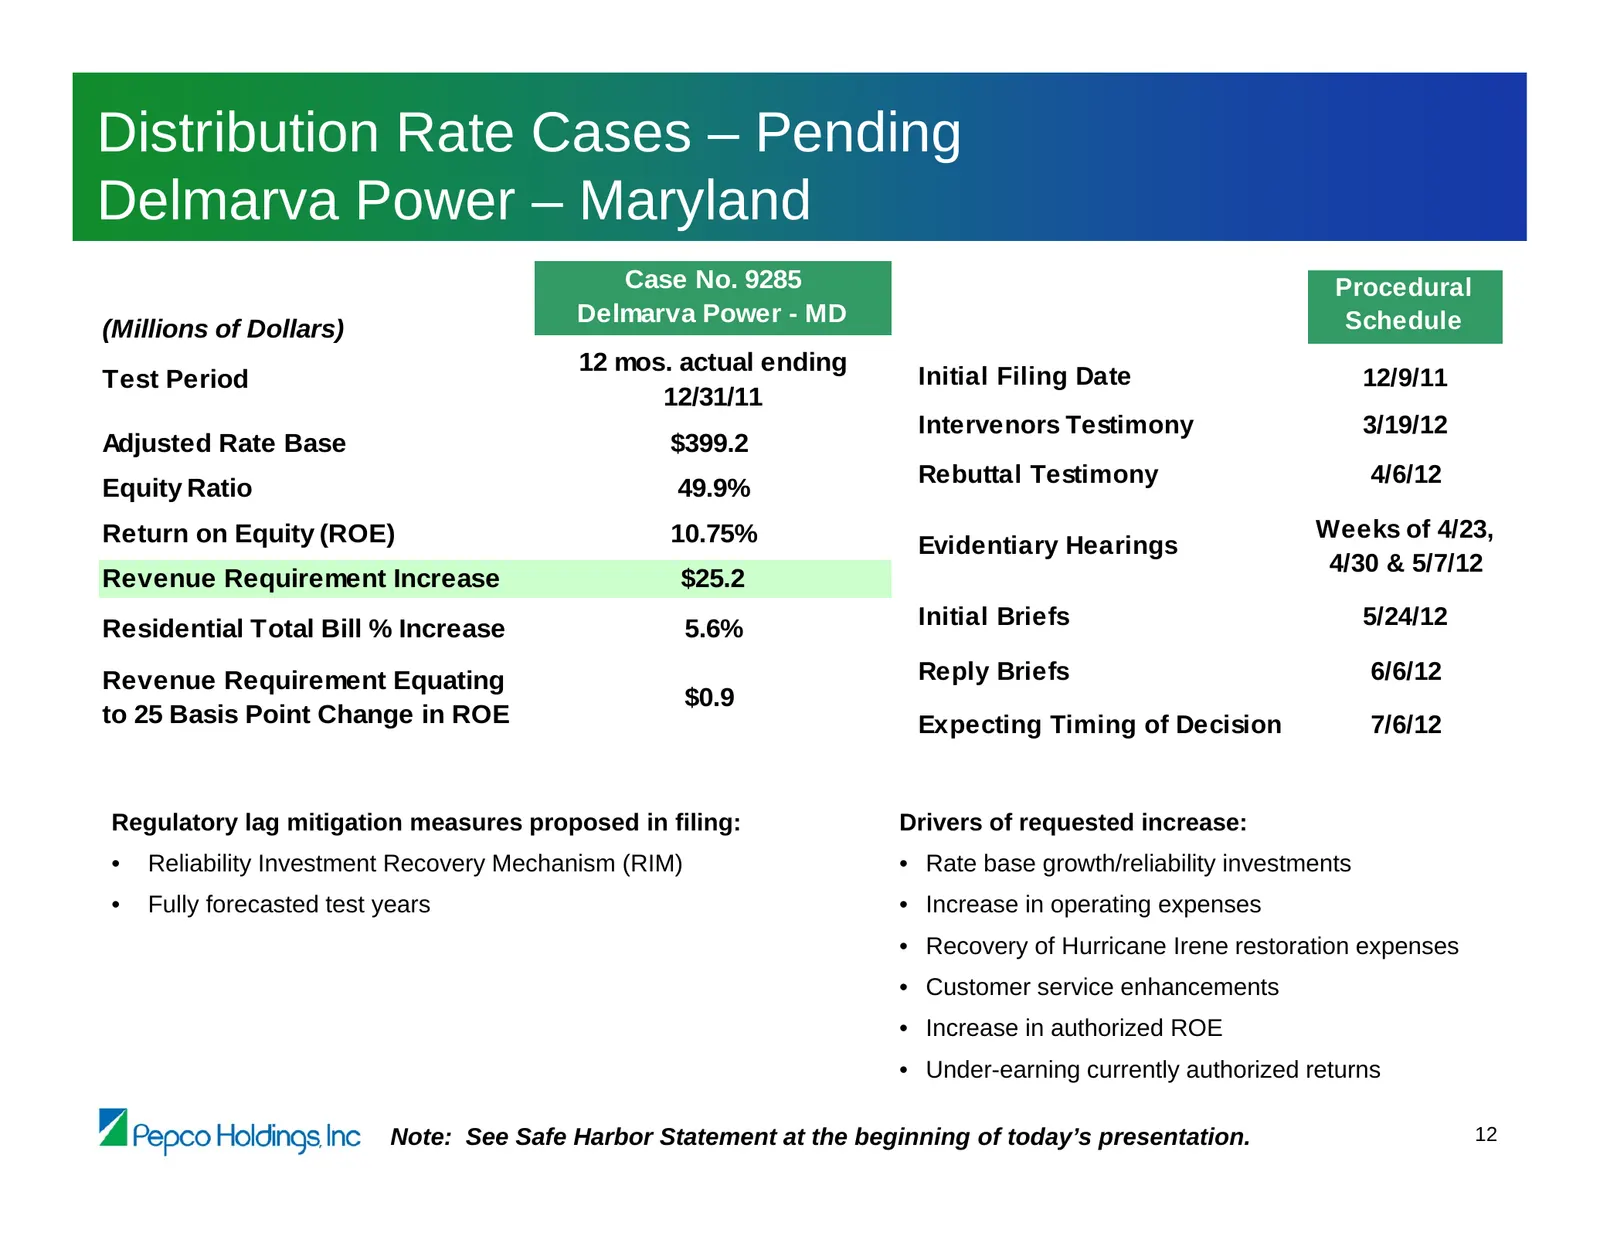
Distribution Rate Cases – Pending Delmarva Power – Maryland Case No. 9285 Procedural Delmarva Power - MD Schedule (Millions of Dollars) 12 mos. actual ending Test Period Initial Filing Date 12/9/11 12/31/11 Intervenors Testimony 3/19/12 Adjusted Rate Base $399.2 Rebuttal Testimony 4/6/12 Equity Rati
Slide 14: Distribution Rate Cases – Pending Pepco – Maryland
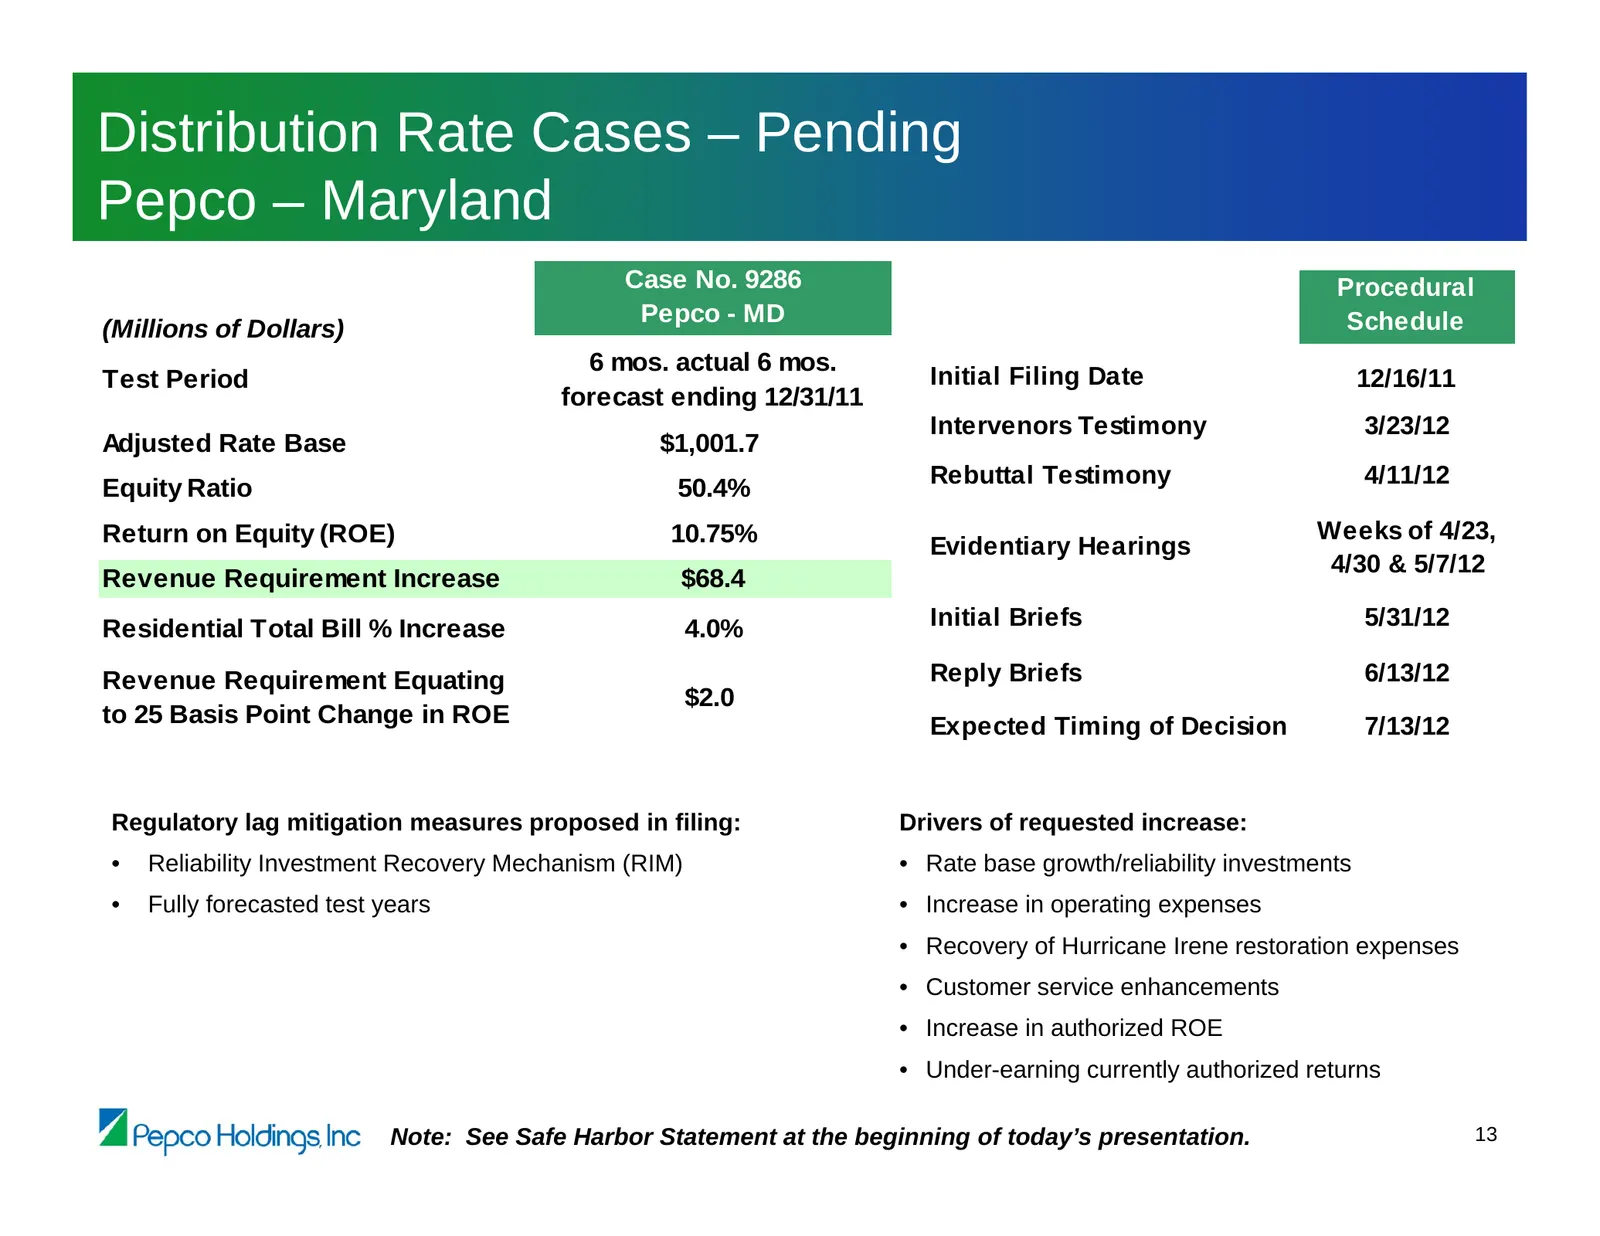
Distribution Rate Cases – Pending Pepco – Maryland Case No. 9286 Procedural Pepco - MD Schedule (Millions of Dollars) 6 mos. actual 6 mos. Test Period Initial Filing Date 12/16/11 forecast ending 12/31/11 Intervenors Testimony 3/23/12 Adjusted Rate Base $1,001.7 Rebuttal Testimony 4/11/12 Equity Rat
Slide 15: Pepco Energy Services
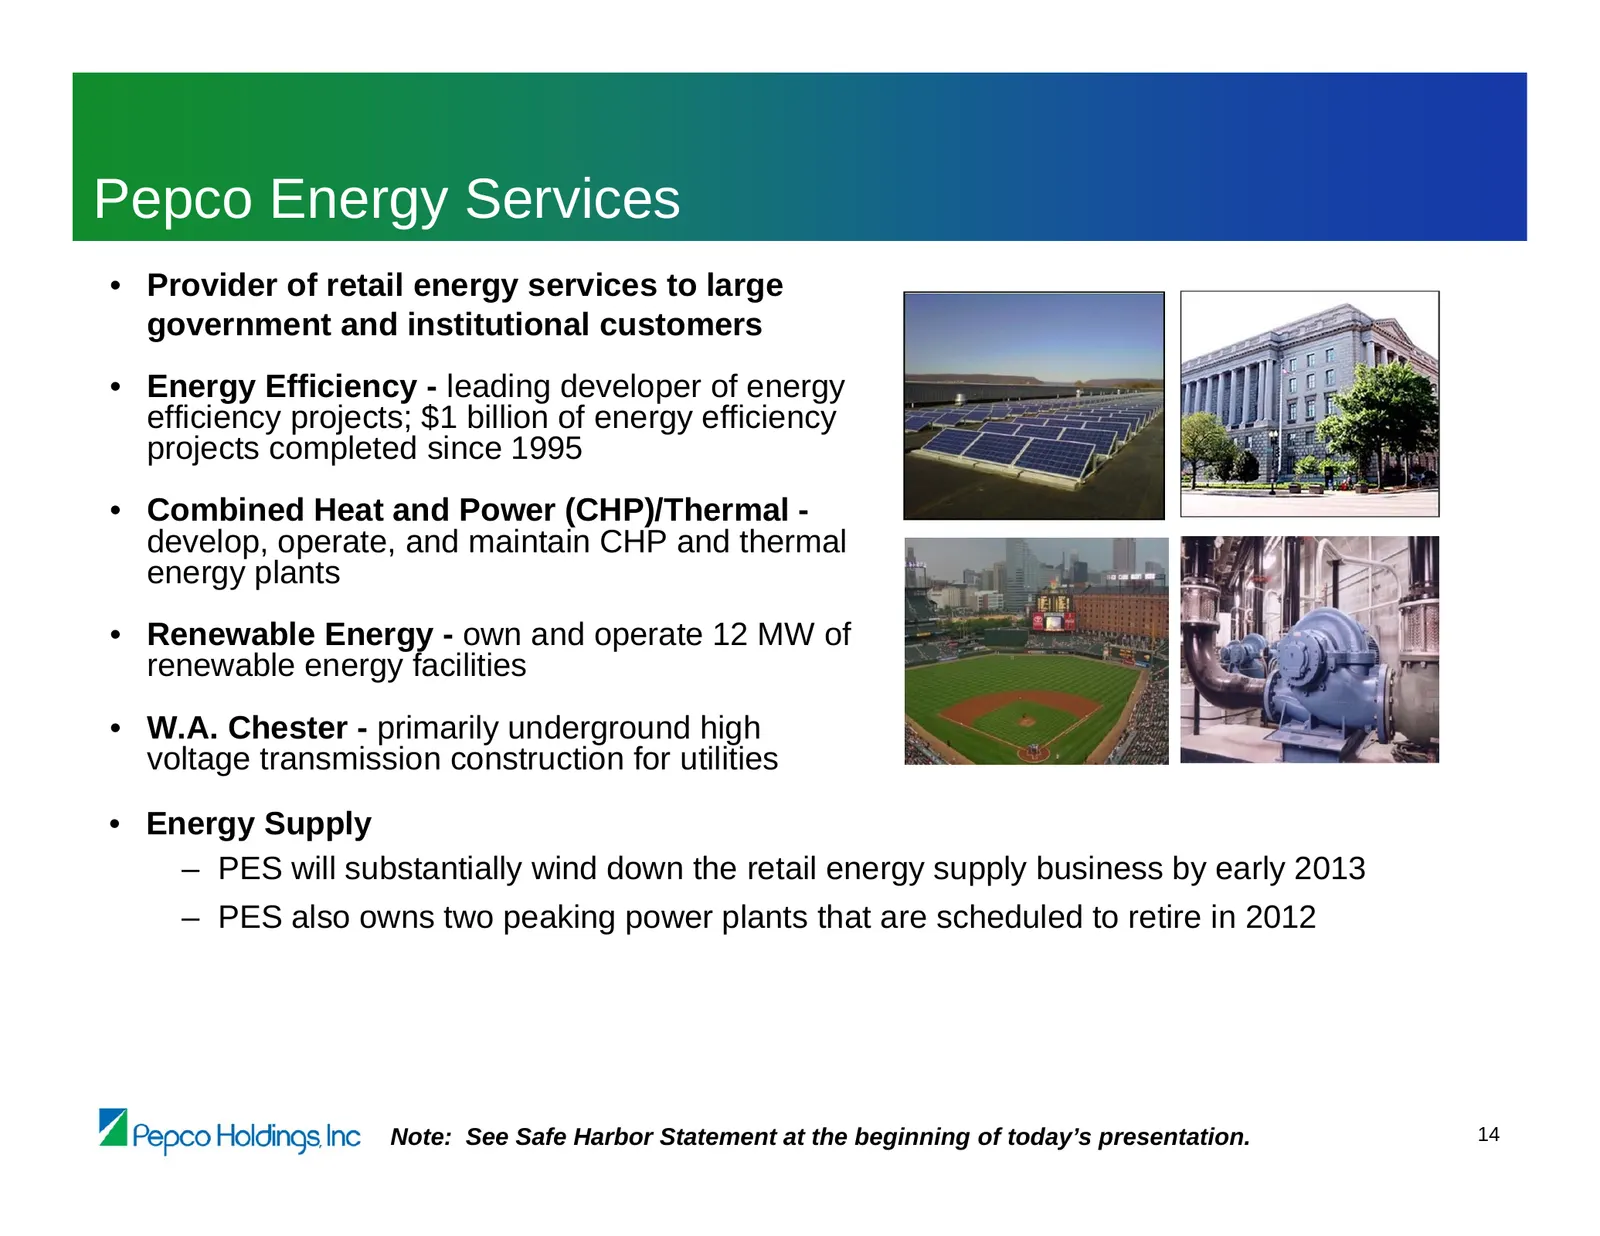
Pepco Energy Services • Provider of retail energy services to large government and institutional customers • Energy Efficiency - leading developer of energy efficiency projects; $1 billion of energy efficiency projects completed since 1995 • Combined Heat and Power (CHP)/Thermal - develop, operate,
Slide 16: Pepco Energy Services – Business Development and Marketing Update
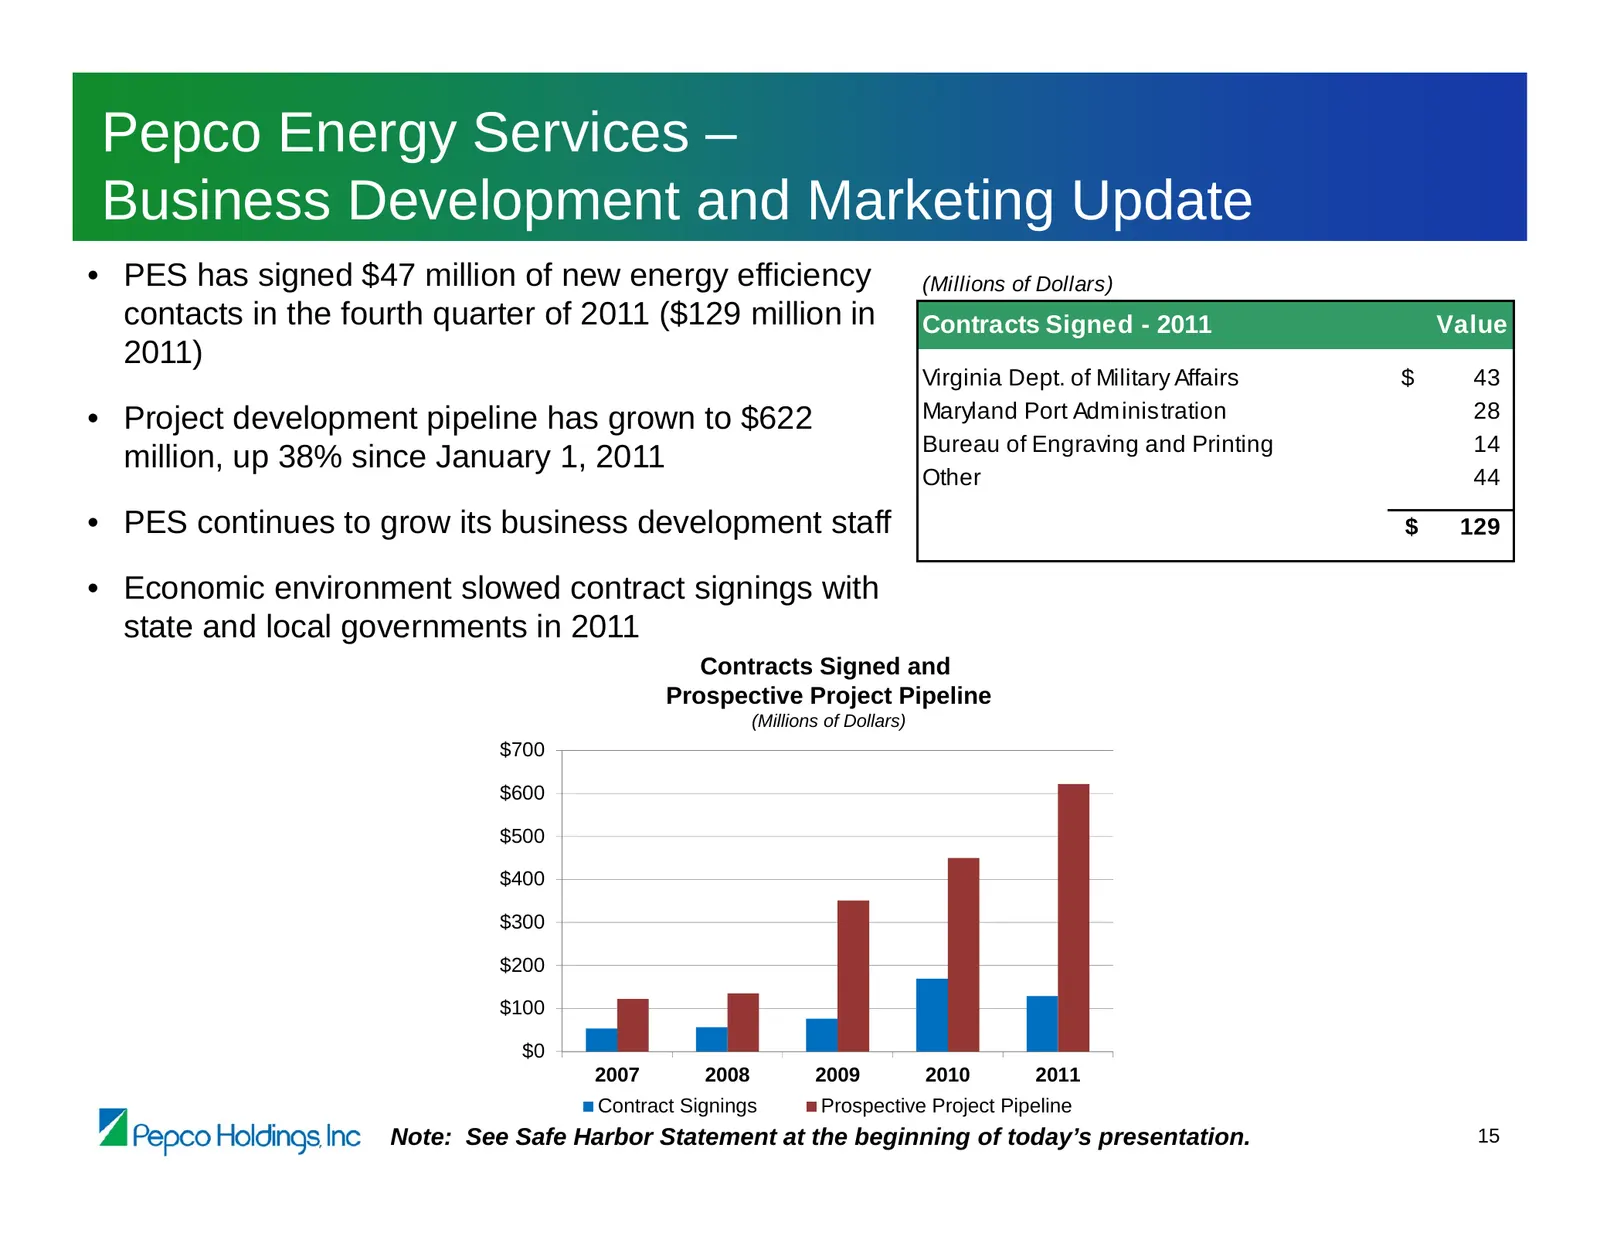
Pepco Energy Services – Business Development and Marketing Update • PES has signed $47 million of new energy efficiency (Millions of Dollars) contacts in the fourth quarter of 2011 ($129 million in Contracts Signed - 2011 Value 2011) Virginia Dept. of Military Affairs $ 43 • Project development pipe
Slide 17: 2012 Earnings Guidance
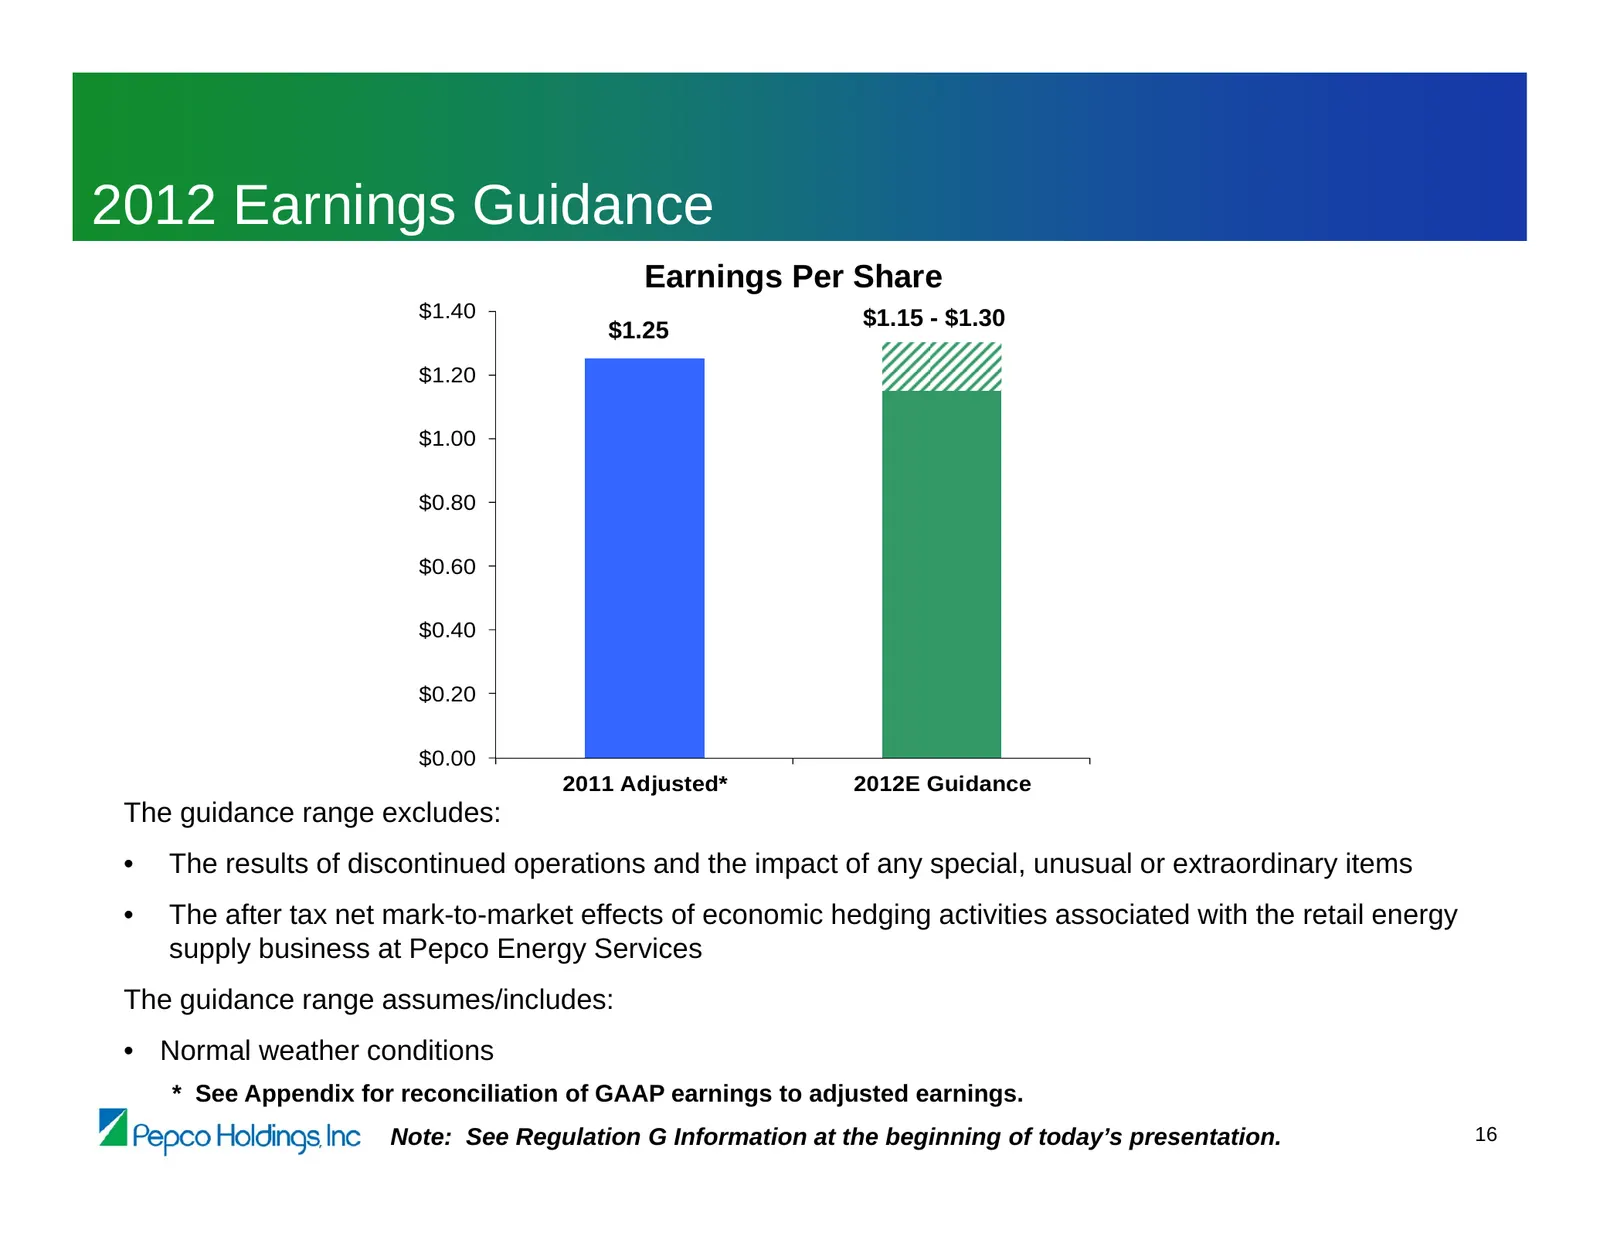
2012 Earnings Guidance Earnings Per Share $1.40 $1.15 - $1.30 $1.25 $1.20 $1.00 $0.80 $0.60 $0.40 $0.20 $0.00 2011 Adjusted* 2012E Guidance The guidance range excludes: • The results of discontinued operations and the impact of any special, unusual or extraordinary items • The after tax net mark-to-
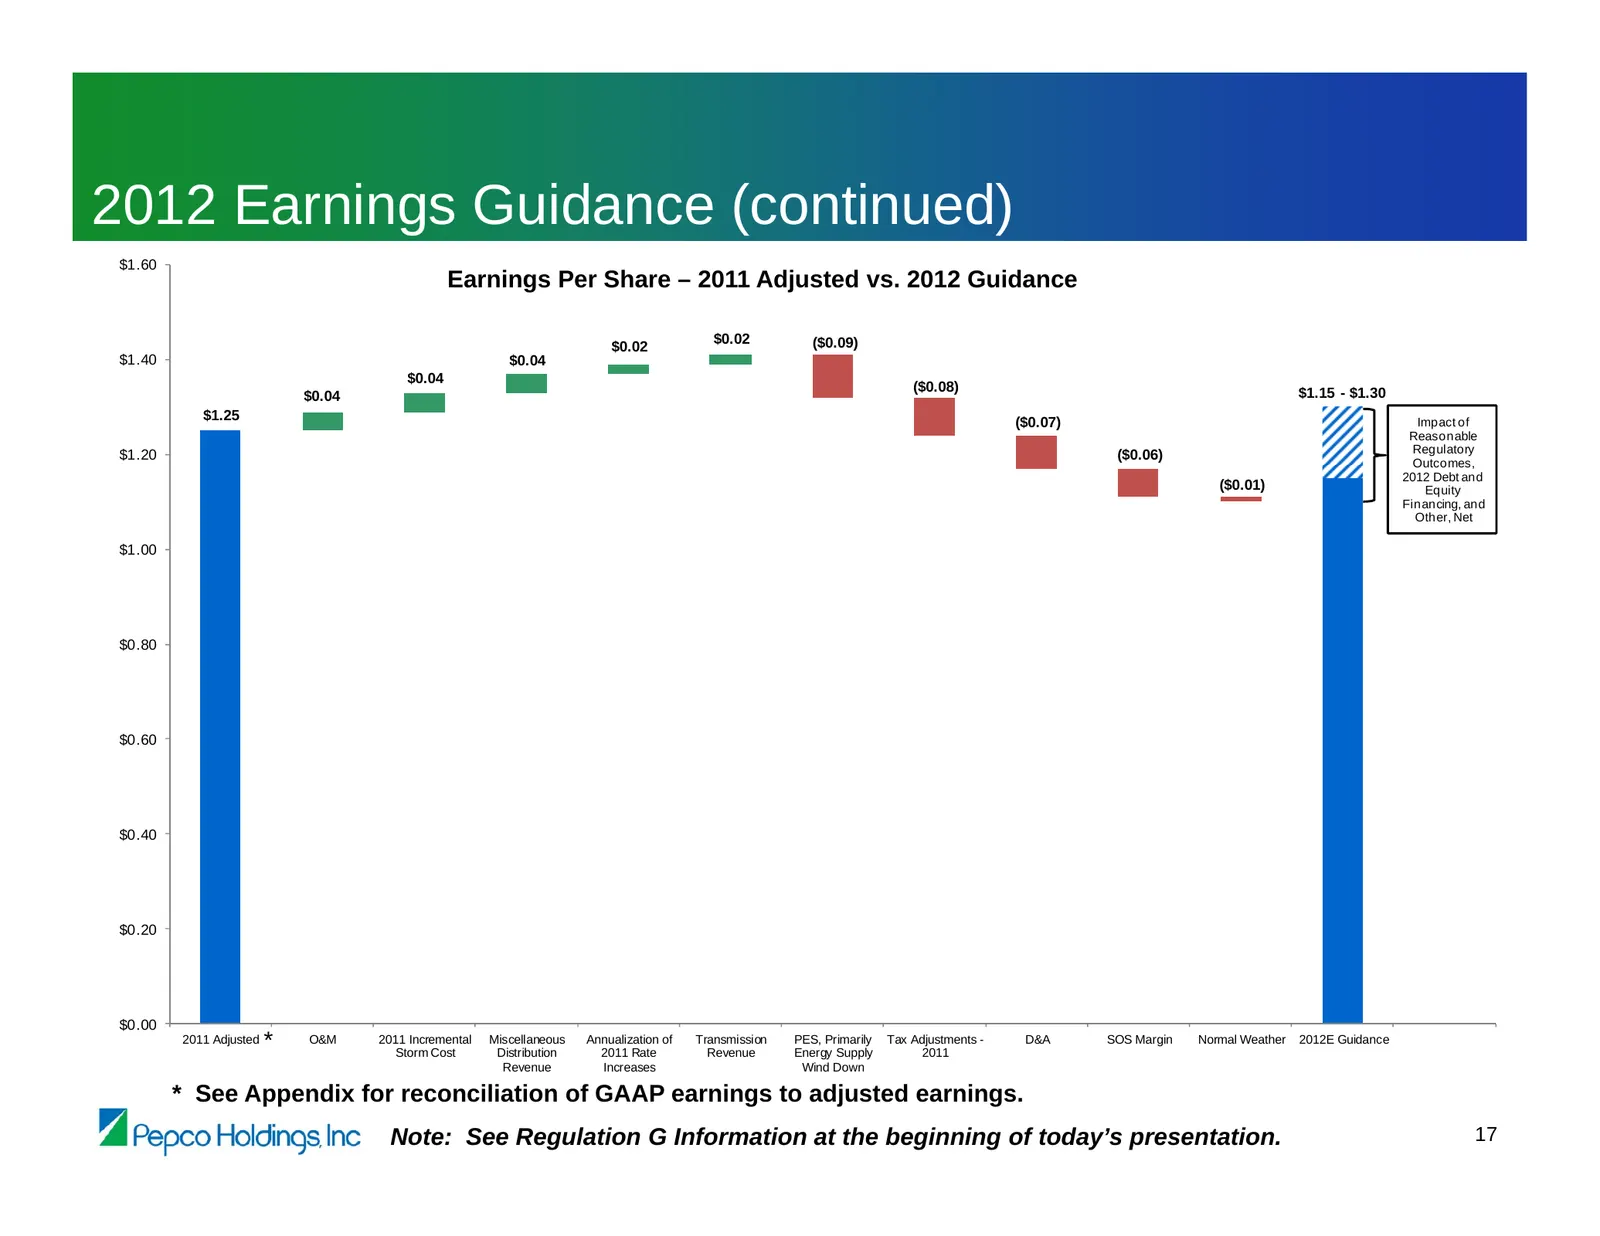
Slide 18: 2012 Earnings Guidance (continued)
2012 Earnings Guidance (continued) $1.60 Earnings Per Share – 2011 Adjusted vs. 2012 Guidance $0.02 ($0.09) $0.02 $1.40 $0.04 $0.04 ($0.08) $1.15 - $1.30 $0.04 $1.25 ($0.07) Impact of Reasonable $1.20 ($0.06) Regulatory Outcomes, 2012 Debt and ($0.01) Equity Financing, and Other, Net $1.00 $0.80 $0.
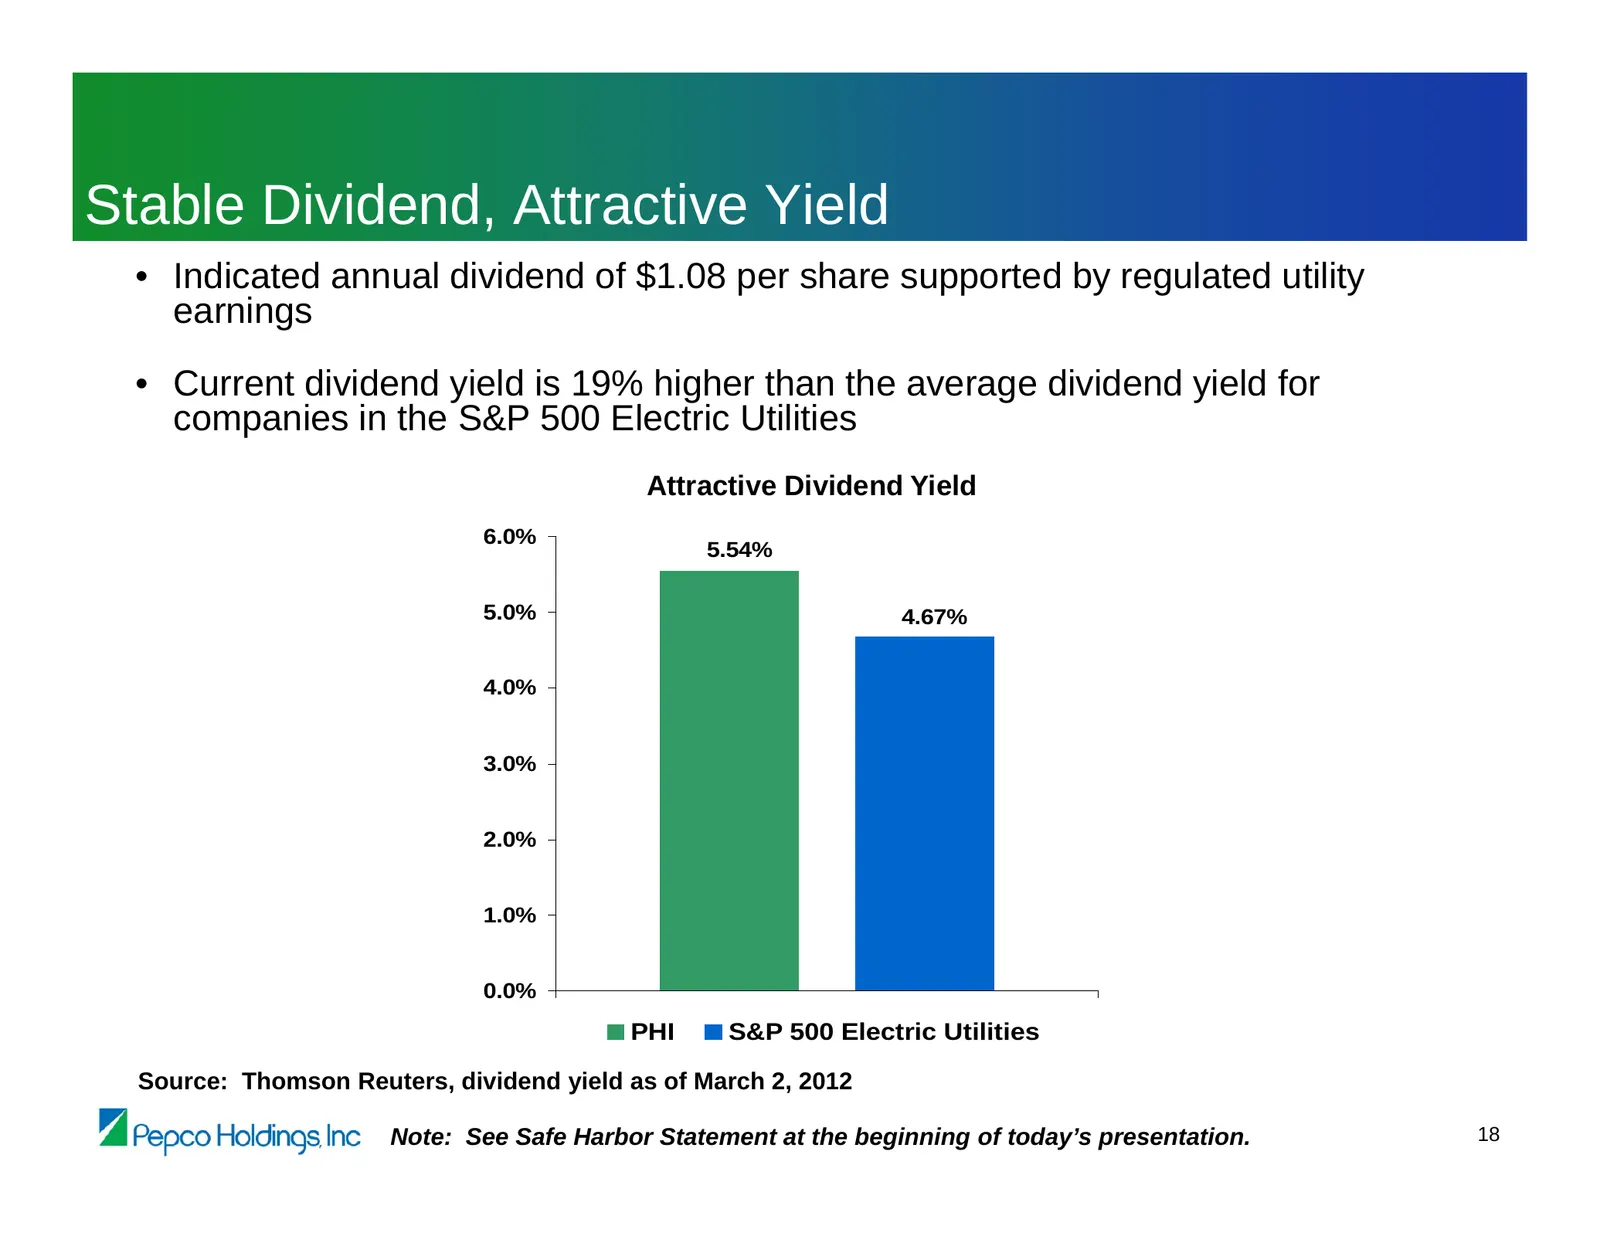
Slide 19: Stable Dividend, Attractive Yield
Stable Dividend, Attractive Yield • Indicated annual dividend of $1.08 per share supported by regulated utility earnings • Current dividend yield is 19% higher than the average dividend yield for companies in the S&P 500 Electric Utilities Attractive Dividend Yield 6.0% 5.54% 5.0% 4.67% 4.0% 3.0% 2.
Slide 20: Investment Highlights
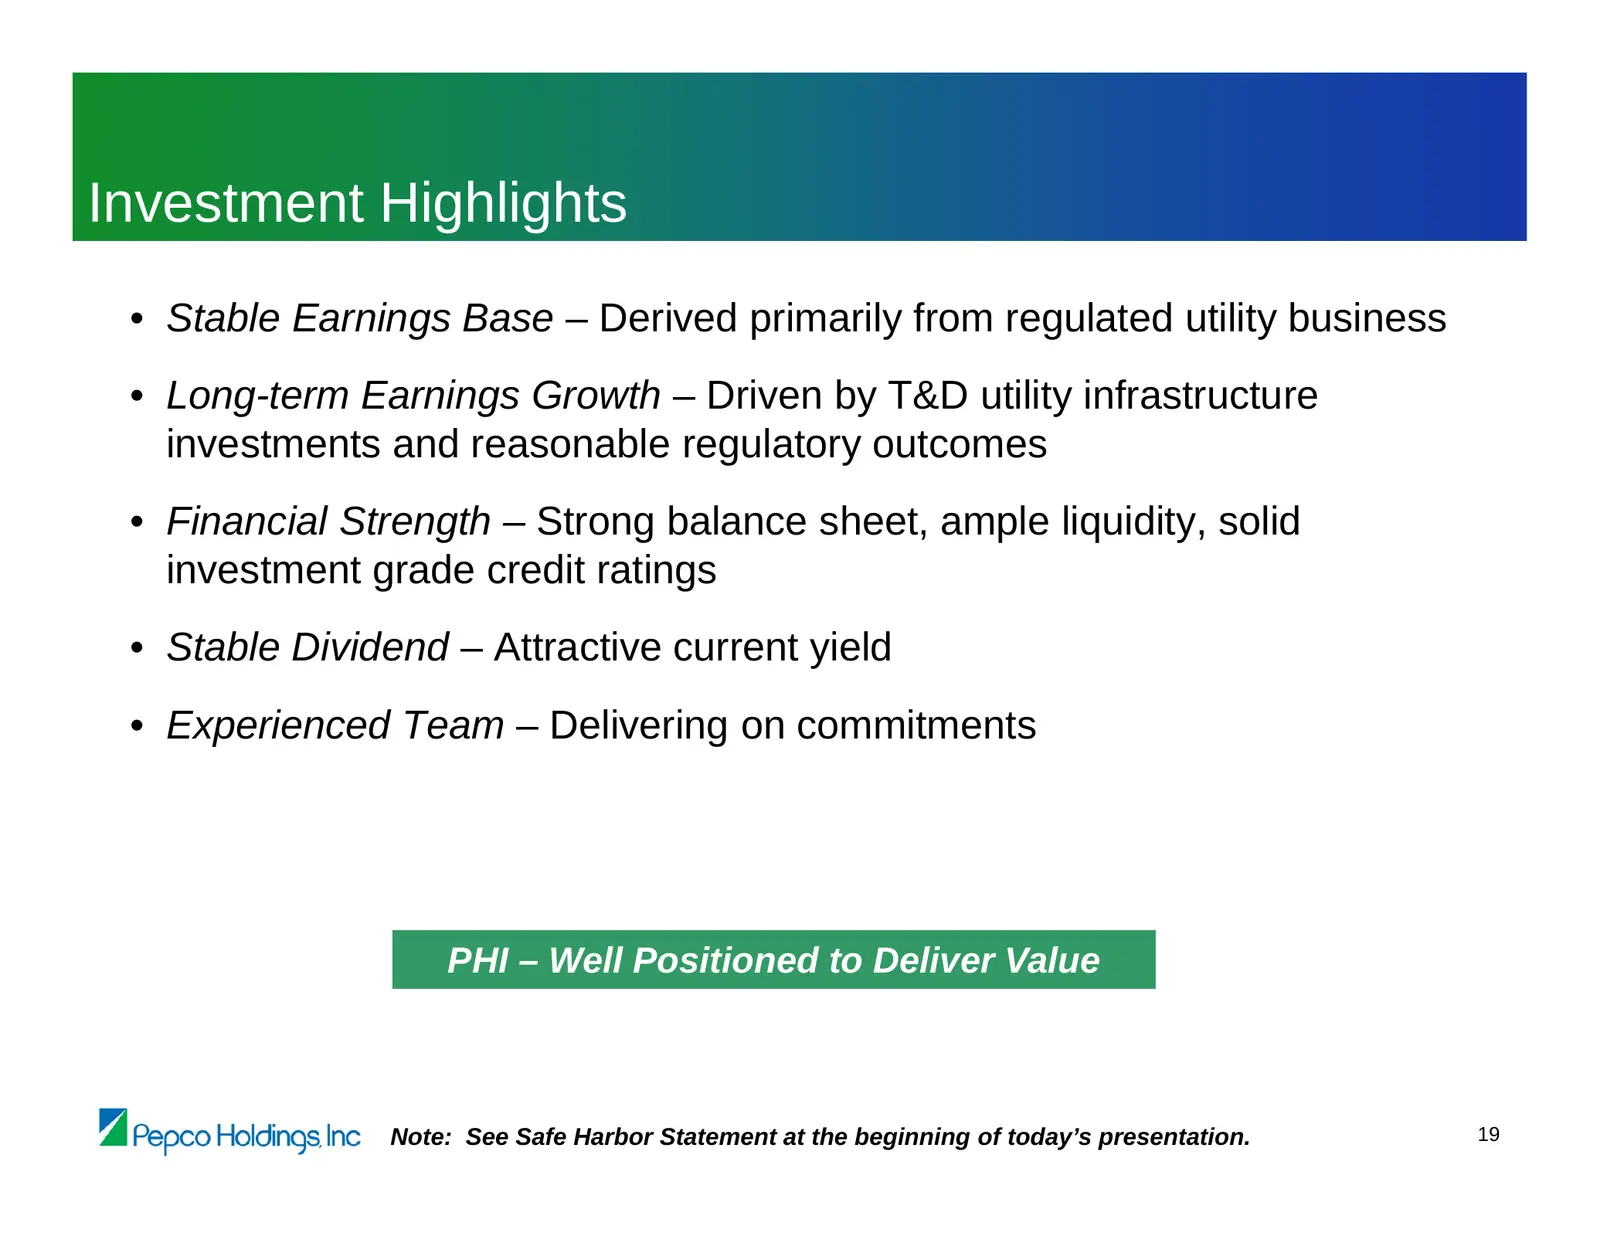
Investment Highlights • Stable Earnings Base – Derived primarily from regulated utility business • Long-term Earnings Growth – Driven by T&D utility infrastructure investments and reasonable regulatory outcomes • Financial Strength – Strong balance sheet, ample liquidity, solid investment grade cred
Slide 21: Appendix
Appendix YA Pepco Holdings Inc
Slide 22: Earnings per Share
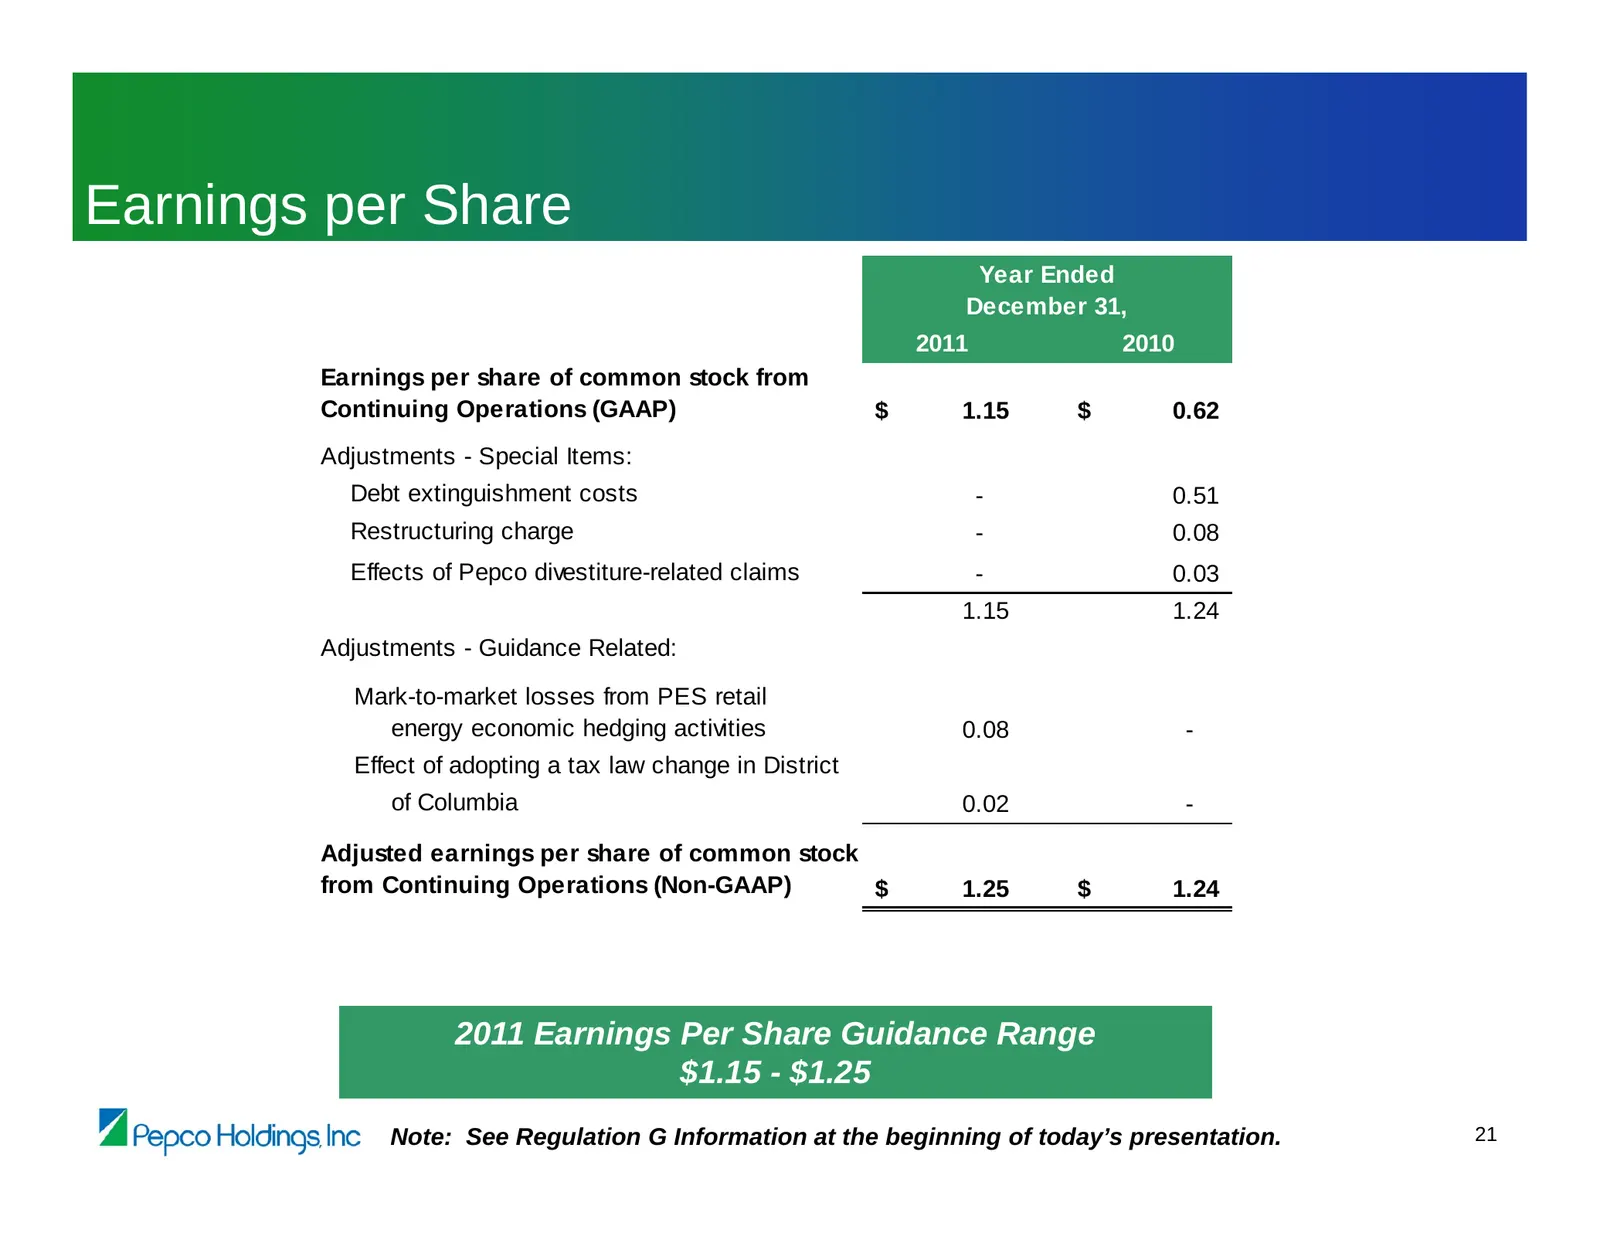
Earnings per Share Year Ended December 31, 2011 2010 Earnings per share of common stock from Continuing Operations (GAAP) $ 1.15 $ 0.62 Adjustments - Special Items: Debt extinguishment costs - 0.51 Restructuring charge - 0.08 Effects of Pepco divestiture-related claims - 0.03 1.15 1.24 Adjustments -
Slide 23: Earnings Per Share Variance – Twelve Months Ended December 31
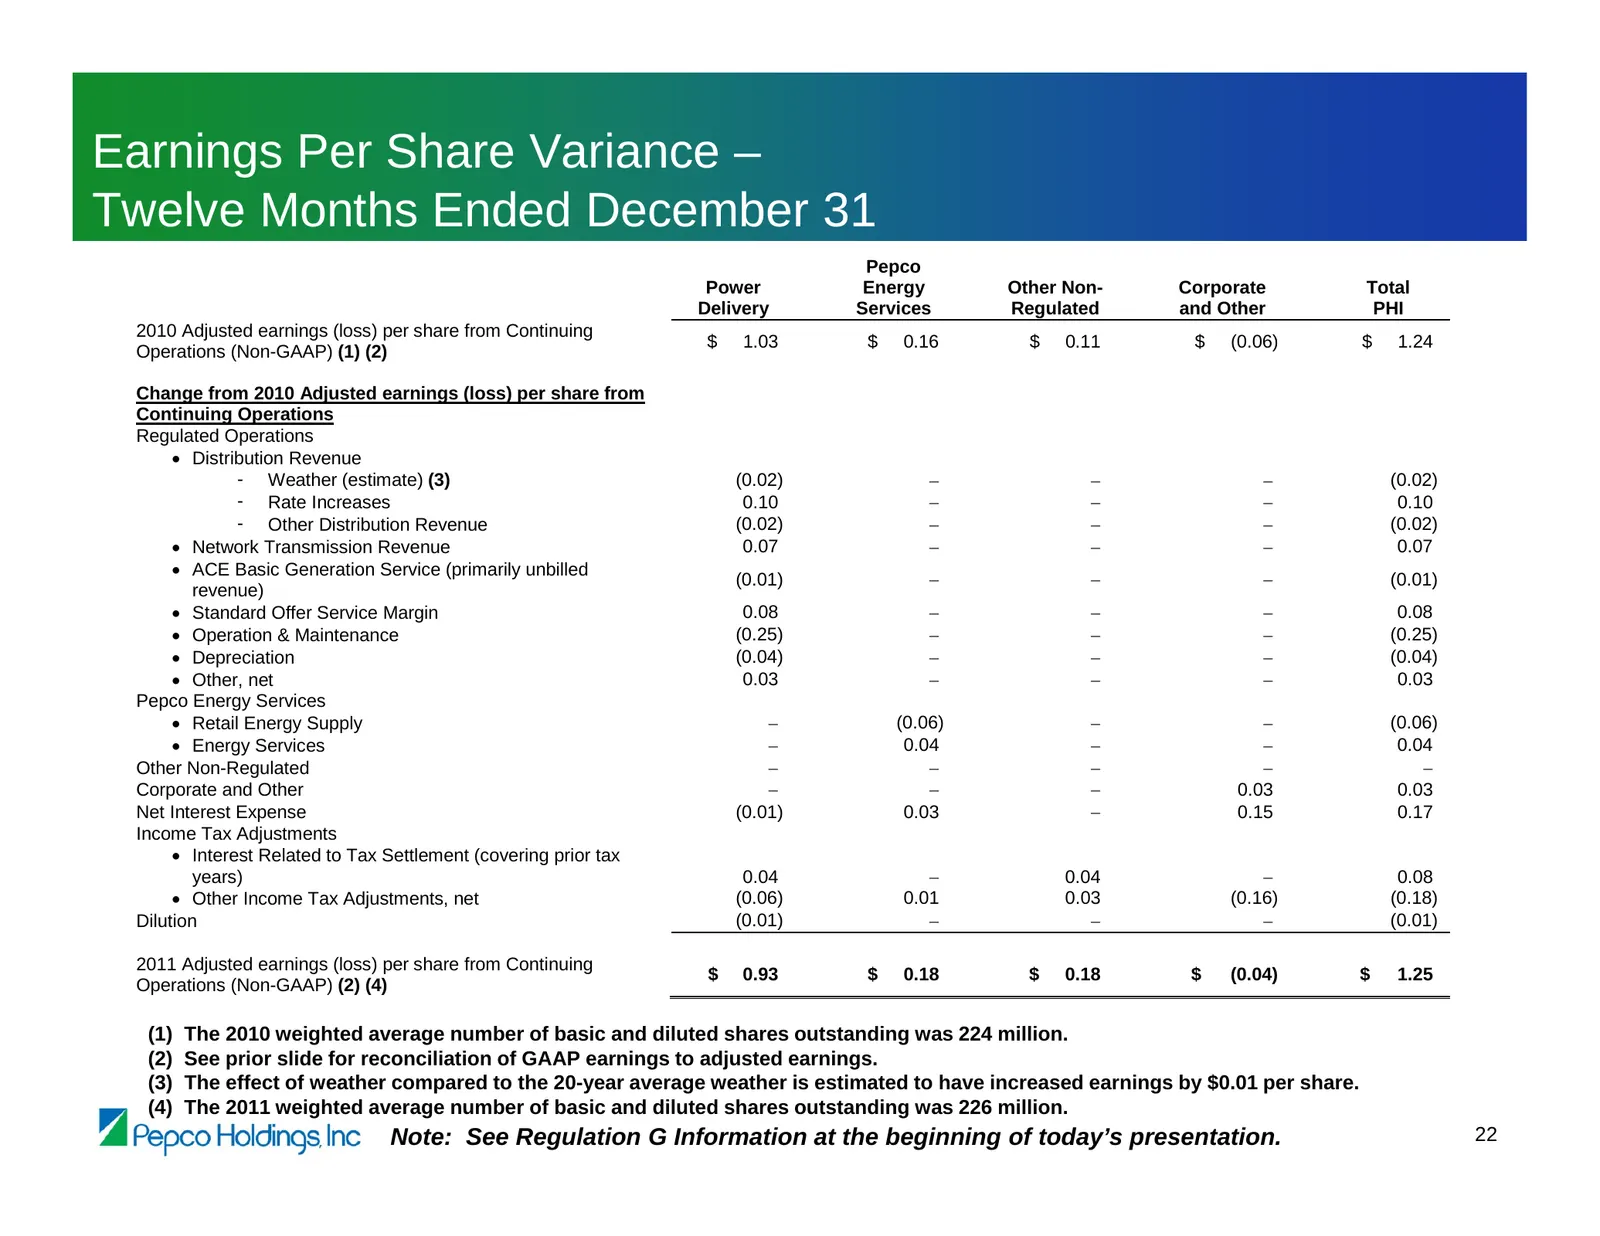
Earnings Per Share Variance – Twelve Months Ended December 31 Pepco Power Energy Other Non- Corporate Total Delivery Services Regulated and Other PHI 2010 Adjusted earnings (loss) per share from Continuing $ 1.03 $ 0.16 $ 0.11 $ (0.06) $ 1.24 Operations (Non-GAAP) (1) (2) Change from 2010 Adjusted e
Slide 24: Capital Expenditures Forecast
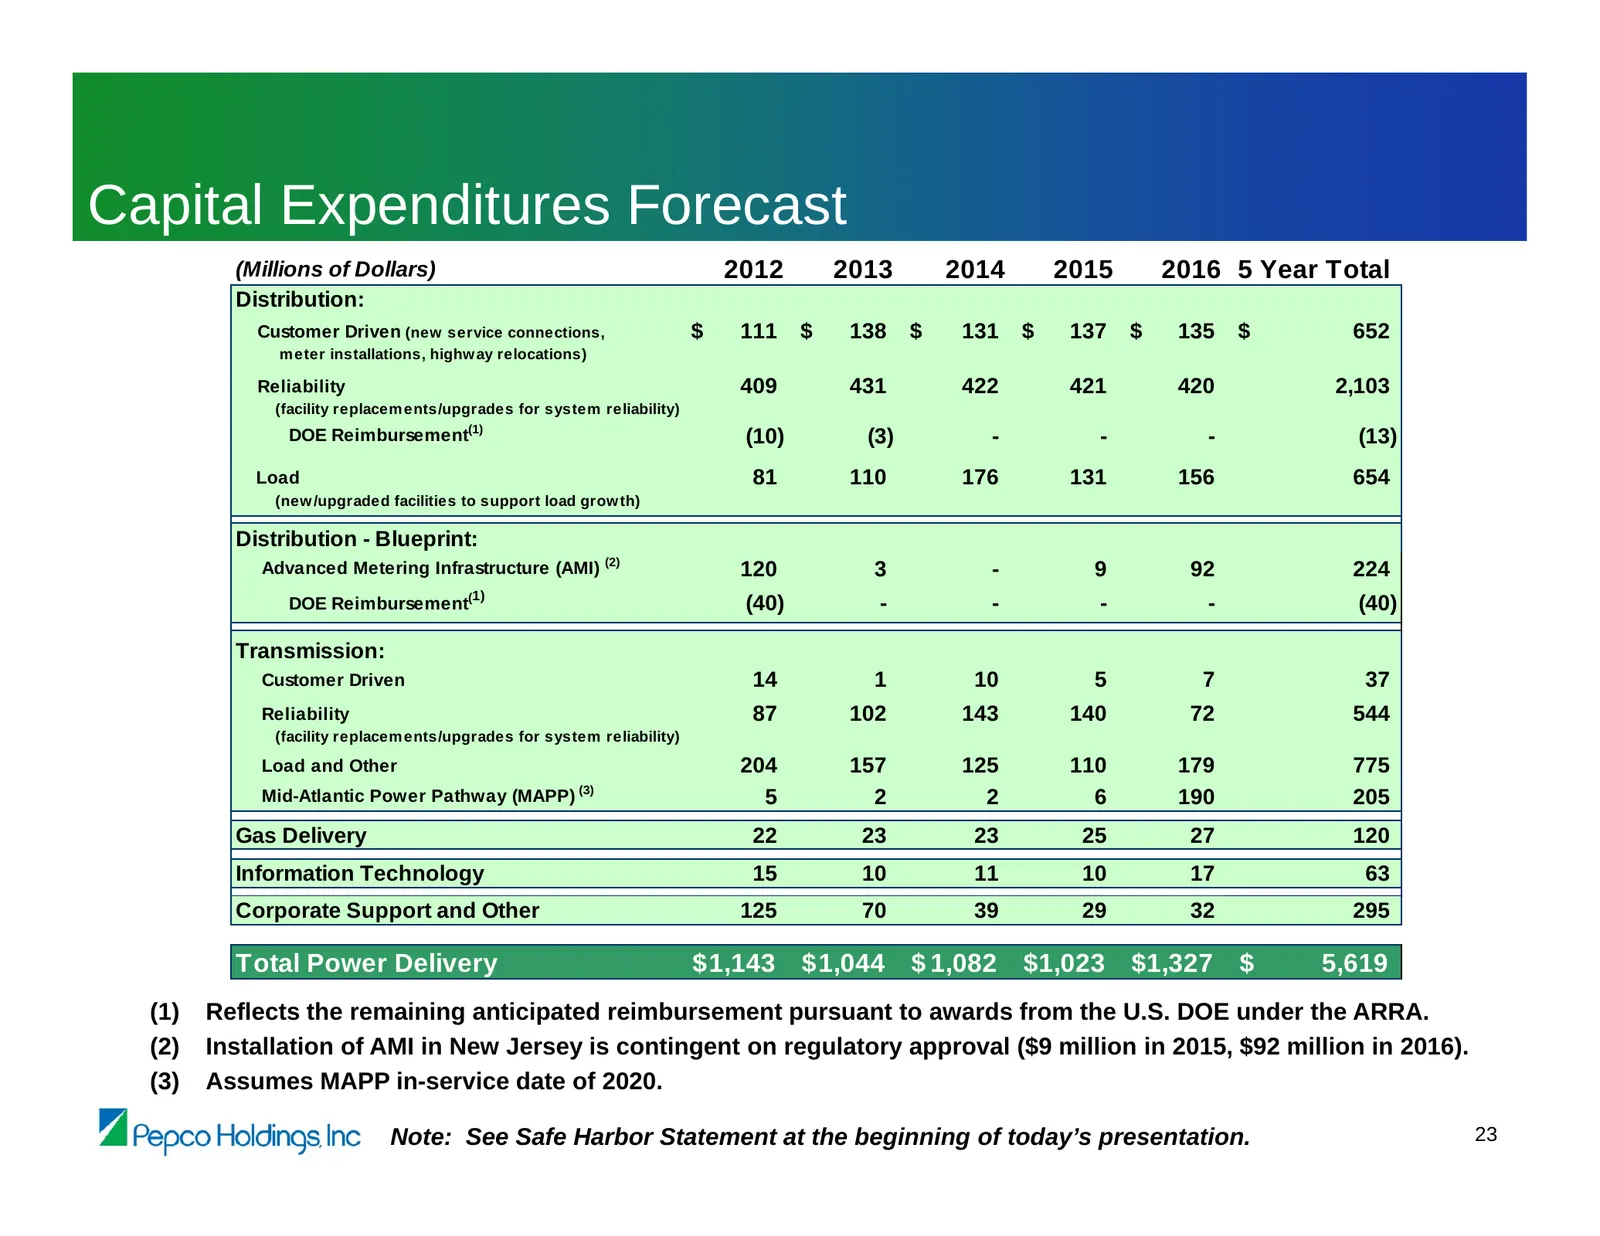
Capital Expenditures Forecast (Millions of Dollars) 2012 2013 2014 2015 2016 5 Year Total Distribution: Customer Driven (new service connections, $ 111 $ 138 $ 131 $ 137 $ 135 $ 652 m eter installations, highw ay relocations) Reliability 409 431 422 421 420 2,103 (facility replacem ents/upgrades for
Slide 25: Pension and OPEB Impacts
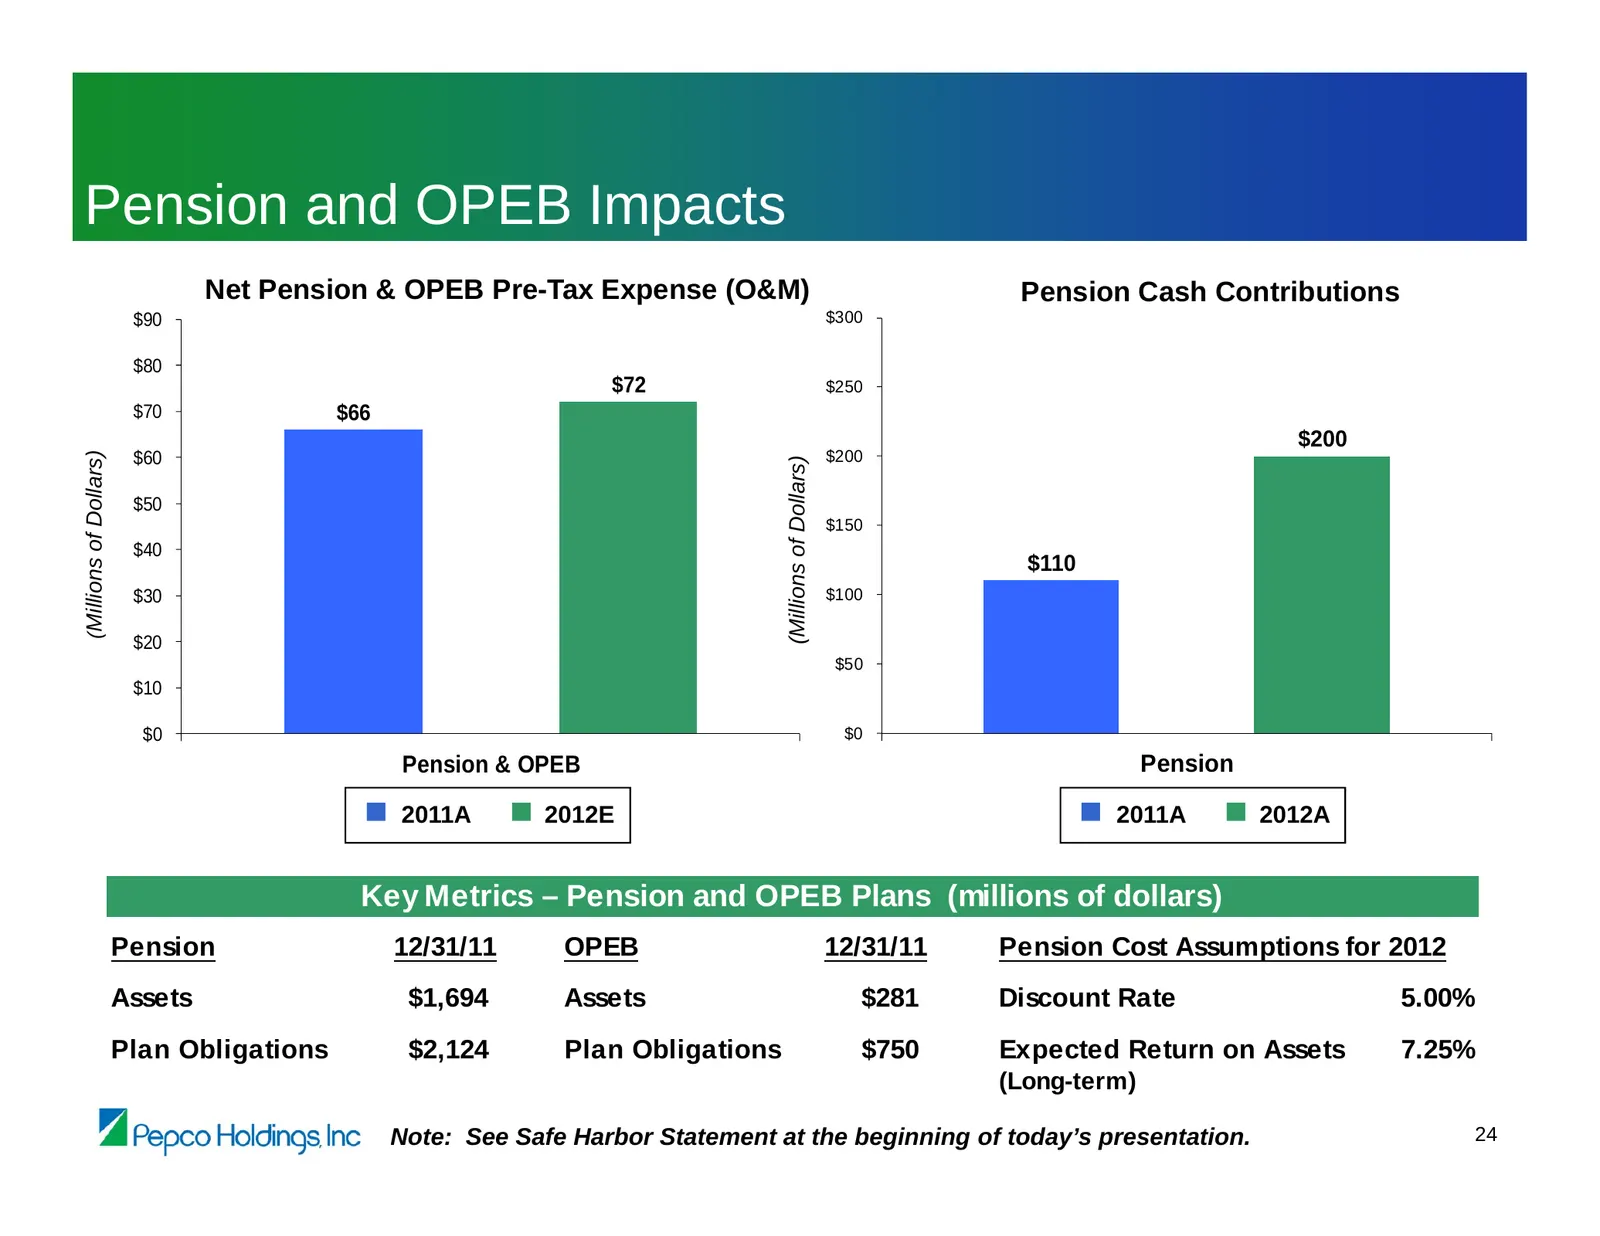
Pension and OPEB Impacts Net Pension & OPEB Pre-Tax Expense (O&M) Pension Cash Contributions $90 $300 $80 $72 $250 $70 $66 $200 $200 (Millions of Dollars) $60 (Millions of Dollars) $50 $150 $40 $110 $30 $100 $20 $50 $10 $0 $0 Pension & OPEB Pension ■ 2011A ■ 2012E ■ 2011A ■ 2012A Key Metrics – Pensi
Slide 26: Reliability Standards – Maryland
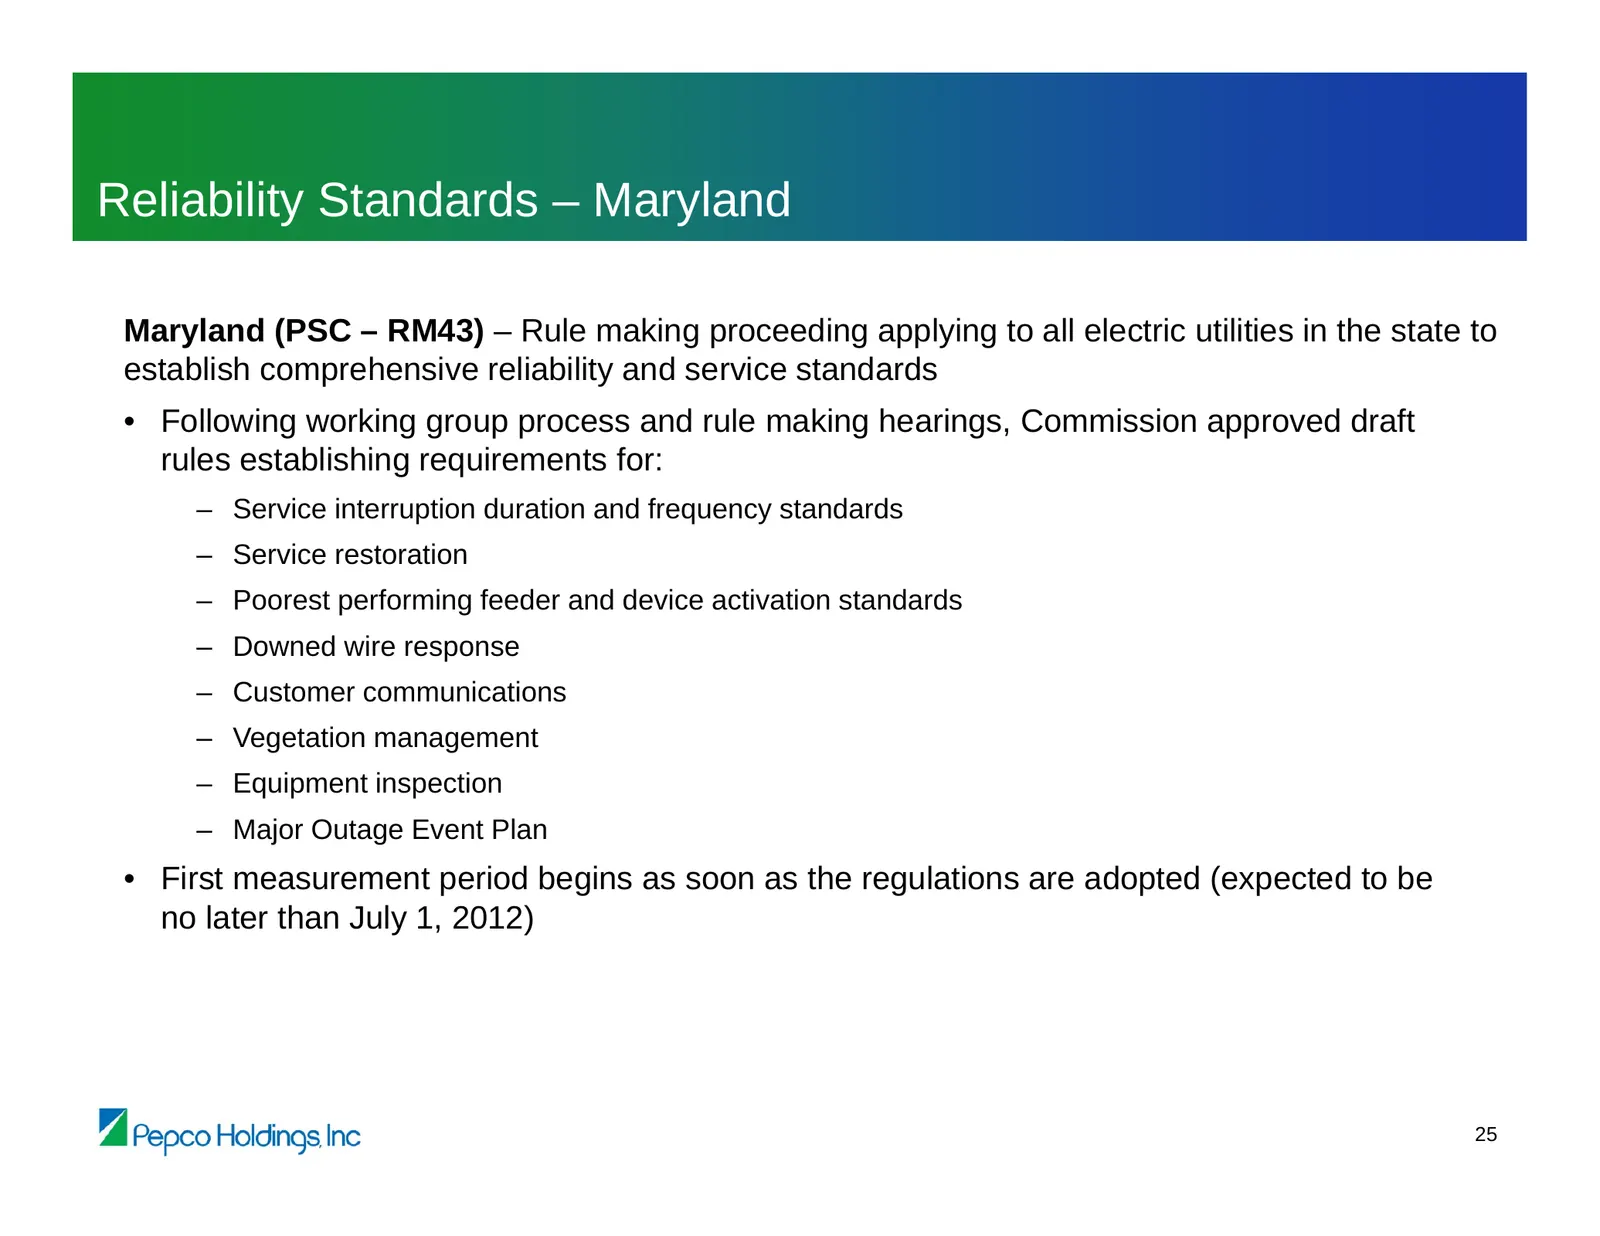
Reliability Standards – Maryland Maryland (PSC – RM43) – Rule making proceeding applying to all electric utilities in the state to establish comprehensive reliability and service standards • Following working group process and rule making hearings, Commission approved draft rules establishing requir
Slide 27: Reliability Standards – District of Columbia
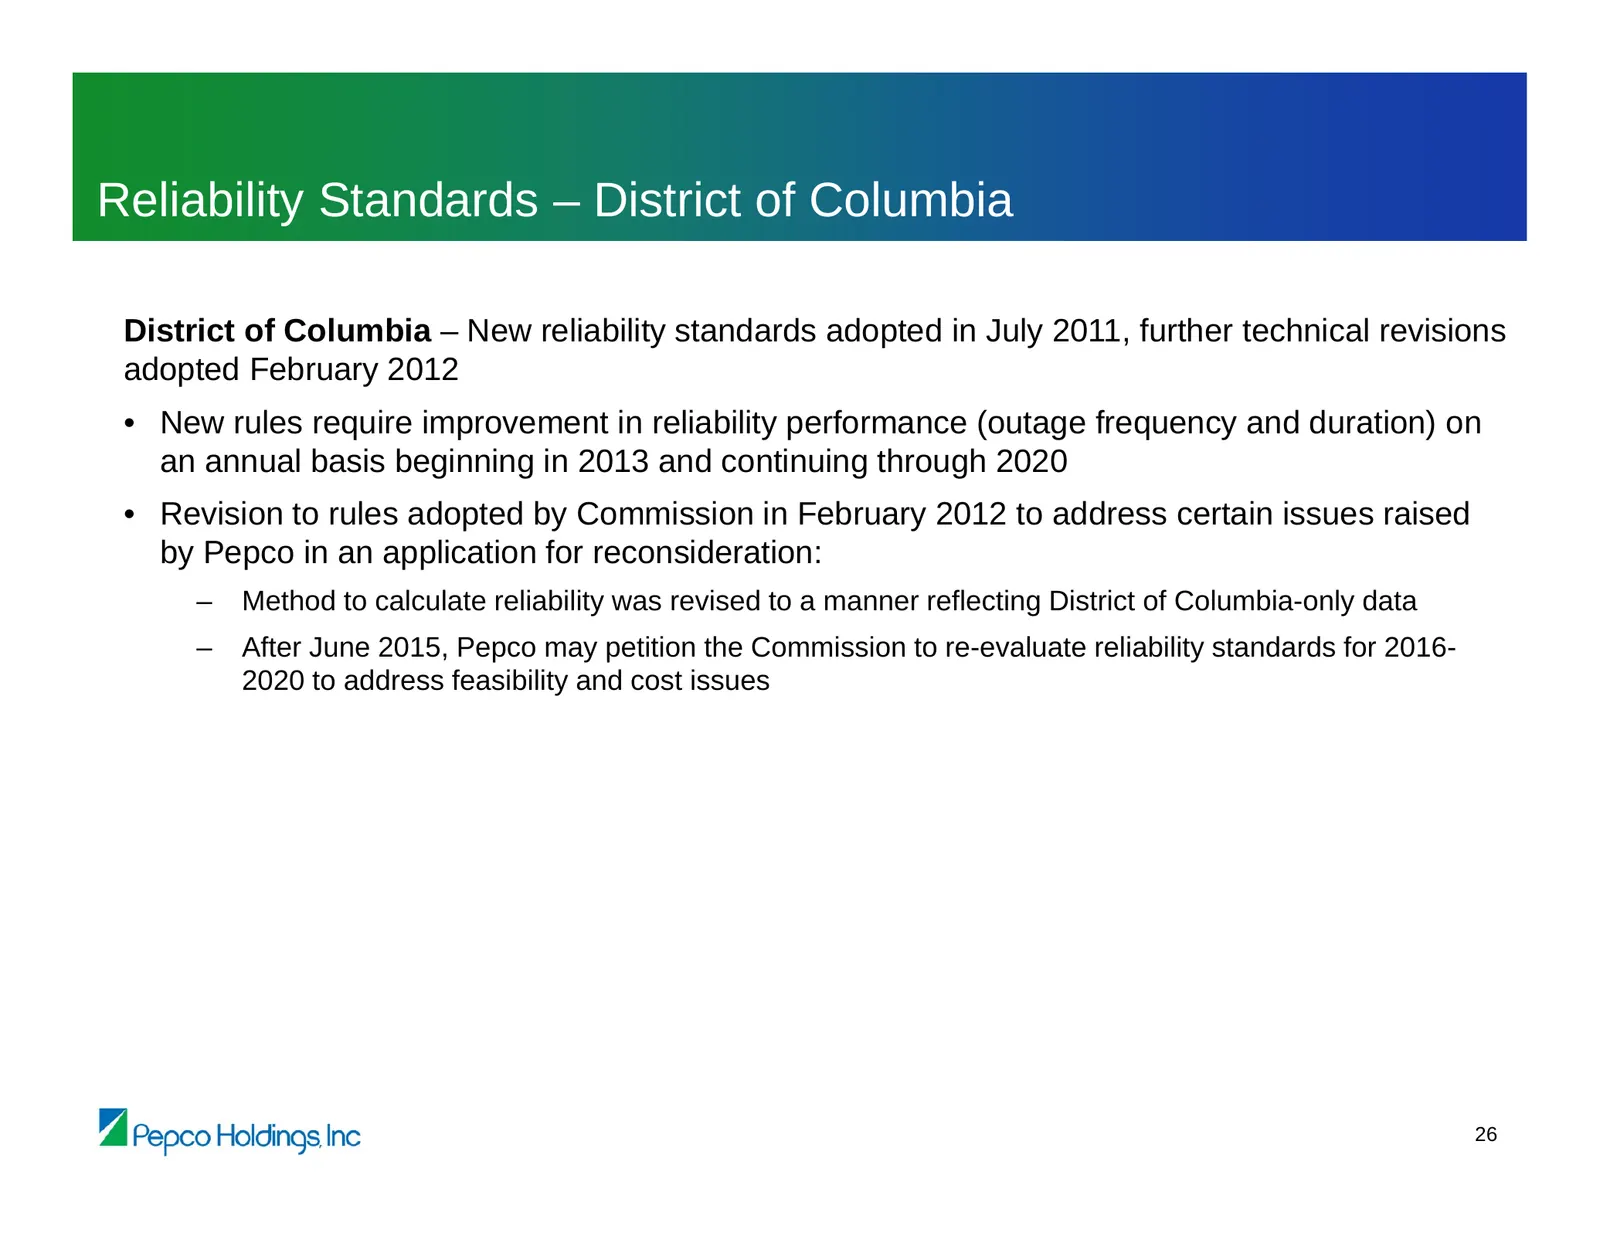
Reliability Standards – District of Columbia District of Columbia – New reliability standards adopted in July 2011, further technical revisions adopted February 2012 • New rules require improvement in reliability performance (outage frequency and duration) on an annual basis beginning in 2013 and co
Slide 28: Cross-Border Energy Lease Status
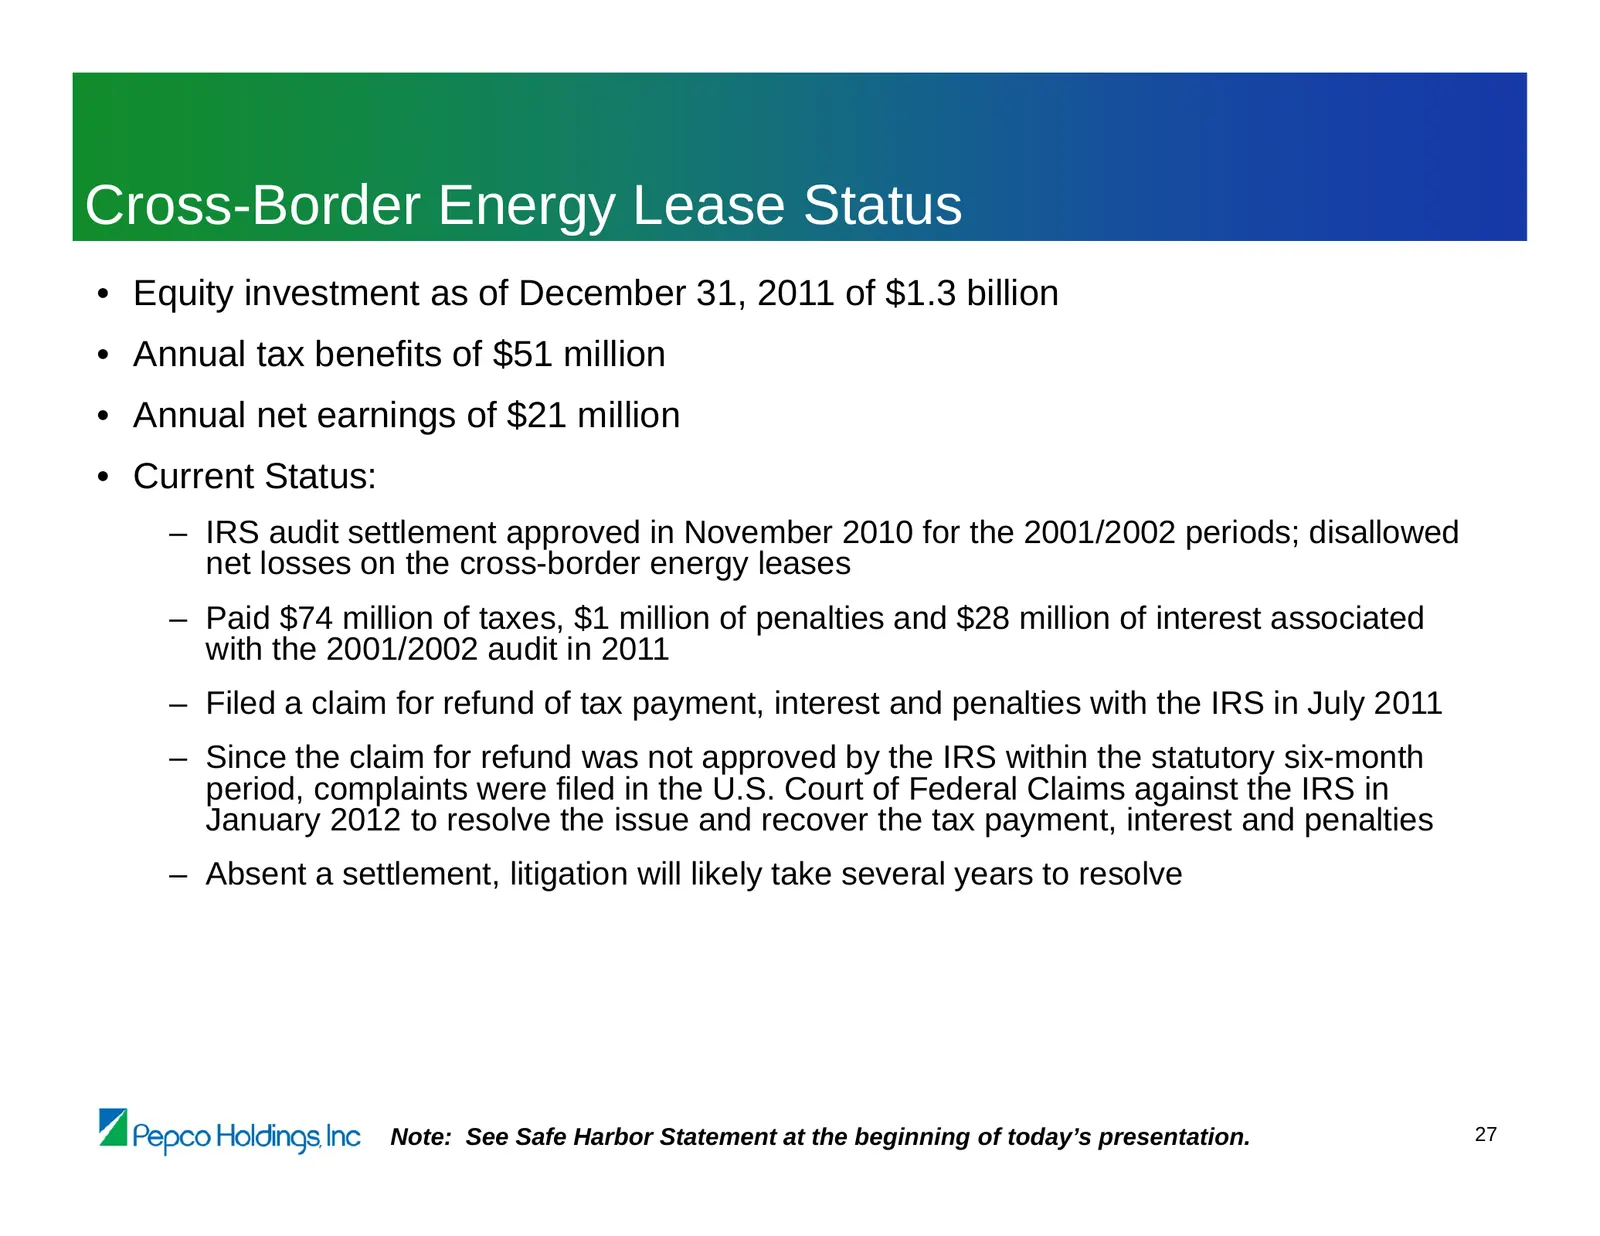
Cross-Border Energy Lease Status • Equity investment as of December 31, 2011 of $1.3 billion • Annual tax benefits of $51 million • Annual net earnings of $21 million • Current Status: – IRS audit settlement approved in November 2010 for the 2001/2002 periods; disallowed net losses on the cross-bord
Source: SEC EDGAR · 8-K filed Mar 7, 2012
More decks from Pepco Holdings Inc
 Merger or Acquisition (August 2014)15 slides · Aug 19, 2014
 Merger or Acquisition (May 2014)44 slides · May 23, 2014
 Q1 2014 Earnings Presentation14 slides · May 7, 2014
 Williams Capital Group Midwest Utilities Seminar (April 2014)35 slides · Apr 9, 2014
 Investor Day (March 2014)109 slides · Mar 21, 2014
 Morgan Stanley Utilities Conference 201439 slides · Feb 28, 2014