NorthStar Realty Finance — Investor Presentation (February 2014)
32 slides from NorthStar Realty Finance's investor presentation, Feb 28, 2014
Slide 1: Investor Presentation February 2014
Investor Presentation February 2014 399 Park Avenue, 18th Floor, New York, NY 10022 | 212.547.2600 | NRFC.com
Slide 2: Safe Harbor
1 Safe Harbor This presentation contains forward-looking statements, within the meaning of the Private Securities Litigation Reform Act of 1995, including statements about future results, projected yields, rates of return and performance, projected cash available for distribution, projected cash fro
Slide 3: Overview of NorthStar Realty Finance
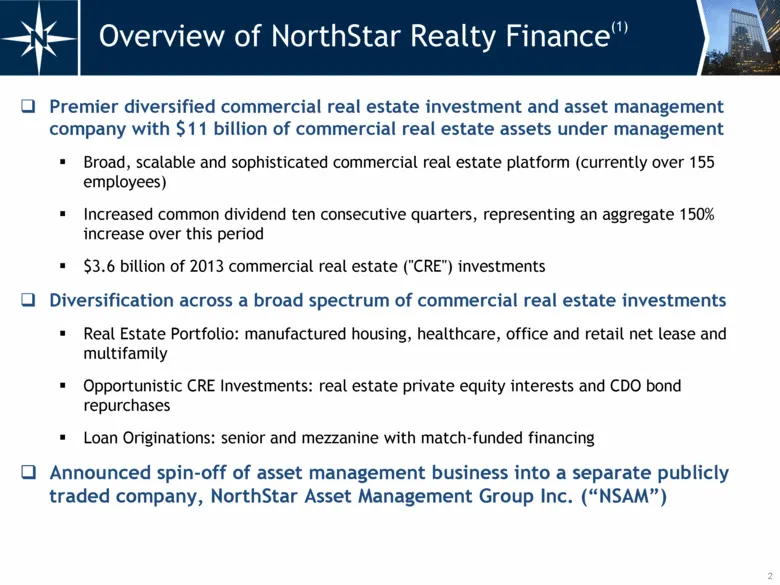
Overview of NorthStar Realty Finance(1) Premier diversified commercial real estate investment and asset management company with $11 billion of commercial real estate assets under management Broad, scalable and sophisticated commercial real estate platform (currently over 155 employees) Increased com
Slide 4: NRF Consistent Outperformance
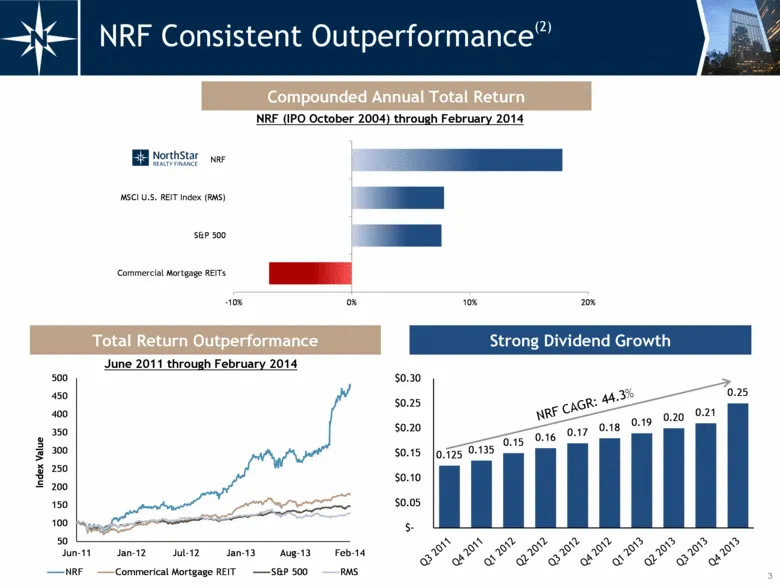
3 NRF Consistent Outperformance(2) NRF CAGR: 44.3% Total Return Outperformance NRF (IPO October 2004) through February 2014 June 2011 through February 2014 Strong Dividend Growth Compounded Annual Total Return 0.125 0.135 0.15 0.16 0.17 0.18 0.19 0.20 0.21 0.25 $- $0.05 $0.10 $0.15 $0.20 $0.25 $0.30
Slide 5: Overview of Asset Management Spin-Off: Pro Forma Structure
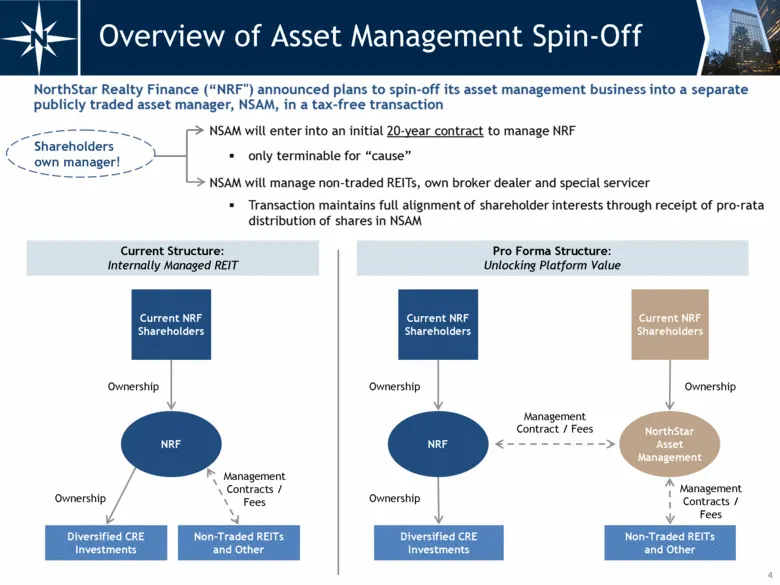
4 Overview of Asset Management Spin-Off Pro Forma Structure: Unlocking Platform Value Contract / Fees Diversified CRE Investments Non-Traded REITs and Other NRF NorthStar Asset Management Current NRF Shareholders Current NRF Shareholders Management Ownership Ownership Ownership Current Structure: In
Slide 6: Overview of Asset Management Spin-Off
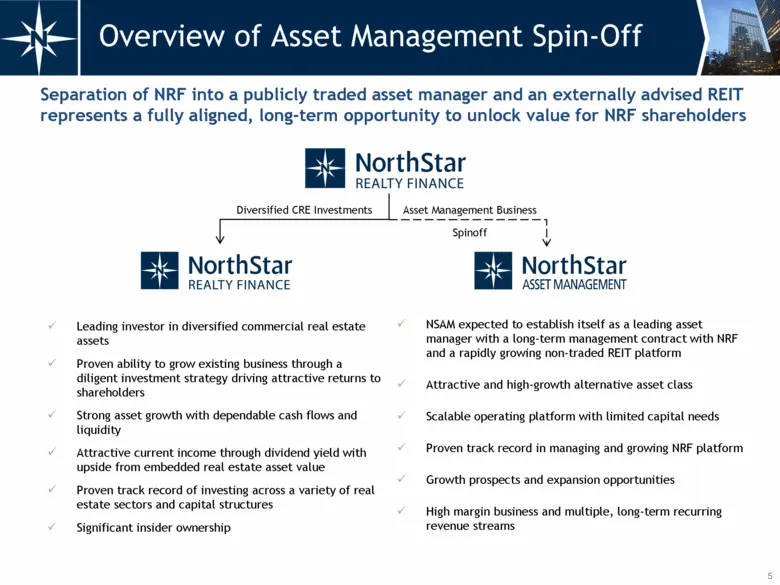
5 Overview of Asset Management Spin-Off Asset Management Business Diversified CRE Investments Spinoff Leading investor in diversified commercial real estate assets Proven ability to grow existing business through a diligent investment strategy driving attractive returns to shareholders Strong asset
Slide 7: NRF Asset Management Contract
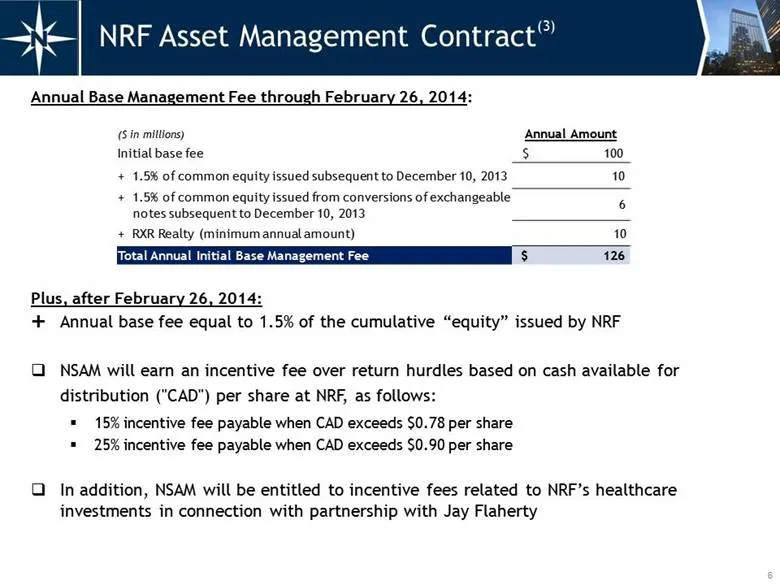
Annual Base Management Fee through February 26, 2014: Plus, after February 26, 2014: Annual base fee equal to 1.5% of the cumulative “equity” issued by NRF NSAM will earn an incentive fee over return hurdles based on cash available for distribution ("CAD") per share at NRF, as follows: 15% incentive
Slide 8: Non-Traded REIT Asset Management Contract
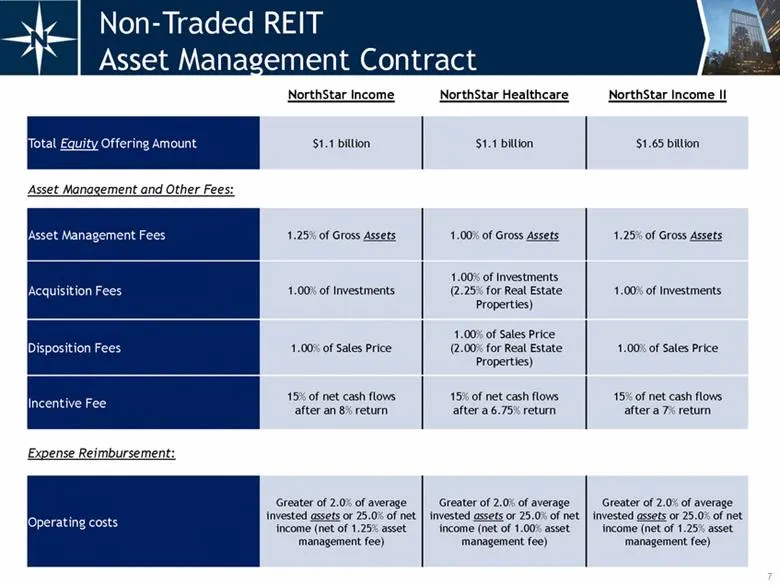
7 Non-Traded REIT Asset Management Contract NorthStar Income NorthStar Healthcare NorthStar Income II Total Equity Offering Amount $1.1 billion $1.1 billion $1.65 billion Asset Management and Other Fees: Asset Management Fees 1.25% of Gross Assets 1.00% of Gross Assets 1.25% of Gross Assets Acquisit
Slide 9: Separation Analysis - Post-Spin 2014 Annualized Projected CAD
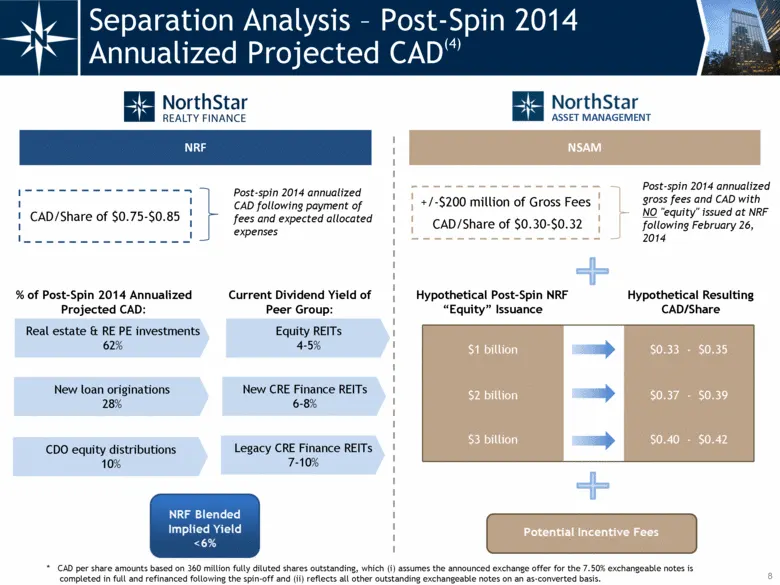
$1 billion $0.33 - $0.35 $2 billion $0.37 - $0.39 $3 billion $0.40 - $0.42 NSAM 8 Separation Analysis - Post-Spin 2014 Annualized Projected CAD(4) NRF CAD/Share of $0.75-$0.85 Post-spin 2014 annualized CAD following payment of fees and expected allocated expenses +/-$200 million of Gross Fees CAD/Sh
Slide 10: NRF Post-Spin 2014 Annualized Projected CAD
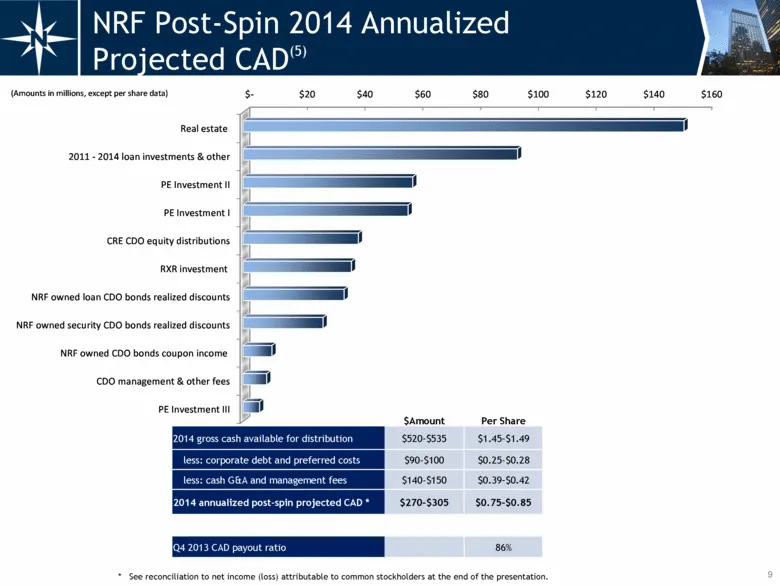
NRF Post-Spin 2014 Annualized Projected CAD(5) $Amount Per Share 2014 gross cash available for distribution $520-$535 $1.45-$1.49 less: corporate debt and preferred costs $90-$100 $0.25-$0.28 less: cash G&A and management fees $140-$150 $0.39-$0.42 2014 annualized post-spin projected CAD * $270-$305
Slide 11: Real Estate Asset Managers
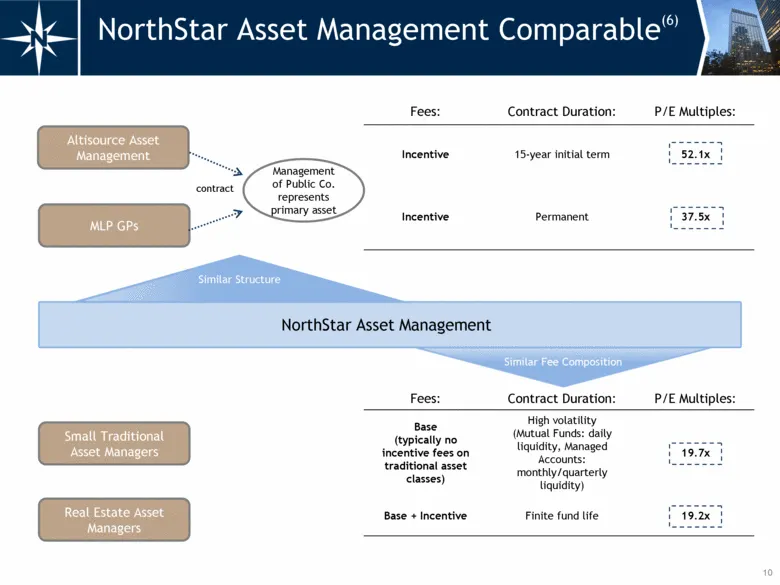
Real Estate Asset Managers Fees: Contract Duration: P/E Multiples: Incentive 15-year initial term 52.1x Incentive Permanent 37.5x Fees: Contract Duration: P/E Multiples: Base (typically no incentive fees on traditional asset classes) High volatility (Mutual Funds: daily liquidity, Managed Accounts:
Slide 12: NRF Value Proposition
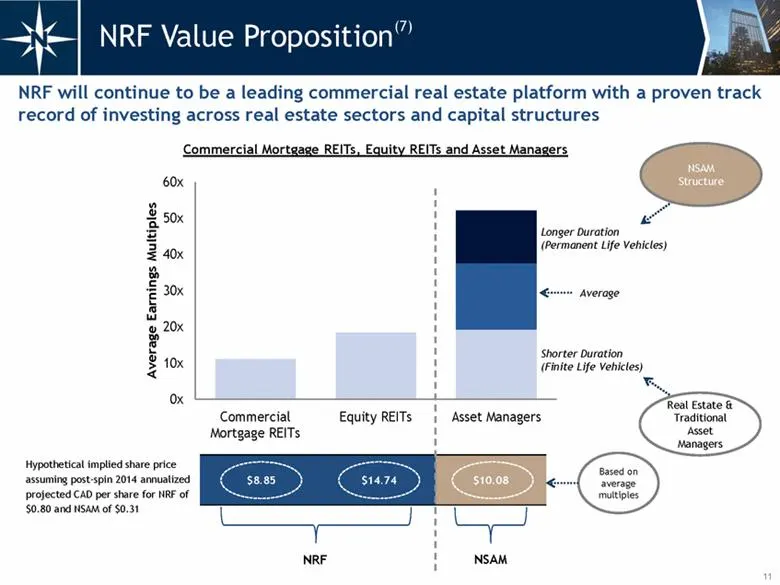
$8.85 $14.74 $10.08 11 NRF Value Proposition(7) Commercial Mortgage REITs, Equity REITs and Asset Managers Hypothetical implied share price assuming post-spin 2014 annualized projected CAD per share for NRF of $0.80 and NSAM of $0.31 NRF will continue to be a leading commercial real estate platform
Slide 13: 2013 NRF Investments
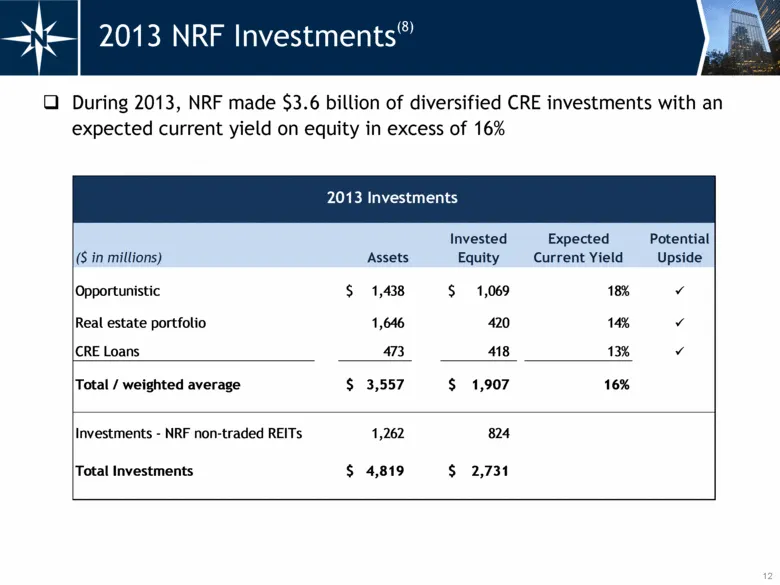
12 2013 NRF Investments(8) During 2013, NRF made $3.6 billion of diversified CRE investments with an expected current yield on equity in excess of 16% 2013 Investments ($ in millions) Assets Invested Equity Expected Current Yield Potential Upside Opportunistic 1,438 $ 1,069 $ 18% ü Real estate portf
Slide 14: NRF Real Estate Portfolio - Healthcare
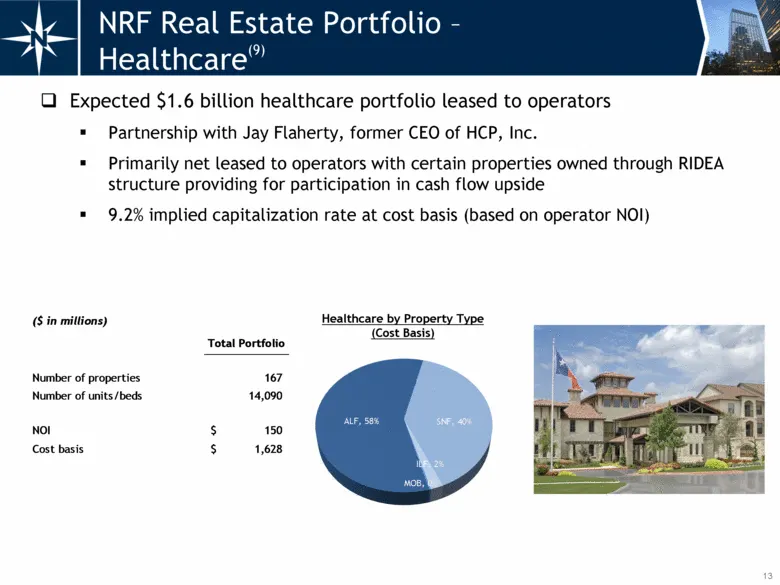
13 Expected $1.6 billion healthcare portfolio leased to operators Partnership with Jay Flaherty, former CEO of HCP, Inc. Primarily net leased to operators with certain properties owned through RIDEA structure providing for participation in cash flow upside 9.2% implied capitalization rate at cost ba
Slide 15: NRF Real Estate Portfolio - Manufactured Housing
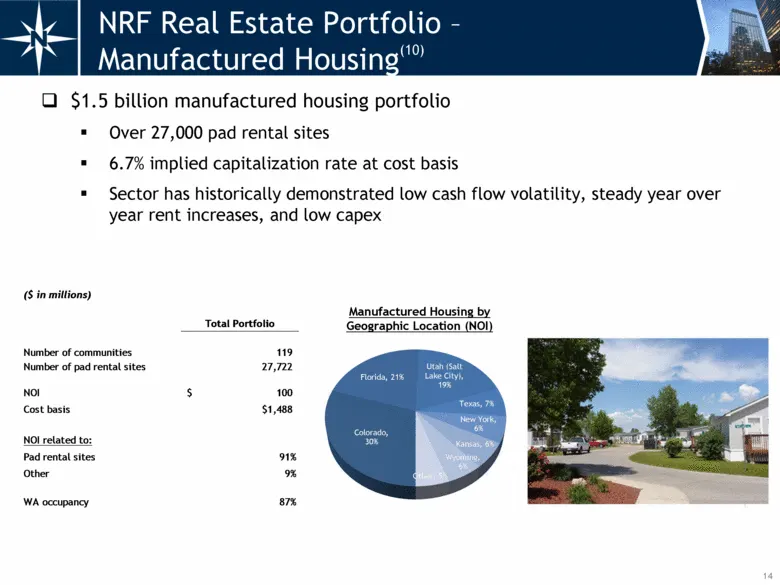
14 $1.5 billion manufactured housing portfolio Over 27,000 pad rental sites 6.7% implied capitalization rate at cost basis Sector has historically demonstrated low cash flow volatility, steady year over year rent increases, and low capex NRF Real Estate Portfolio - Manufactured Housing(10) Manufactu
Slide 16: NRF Real Estate Portfolio - Other
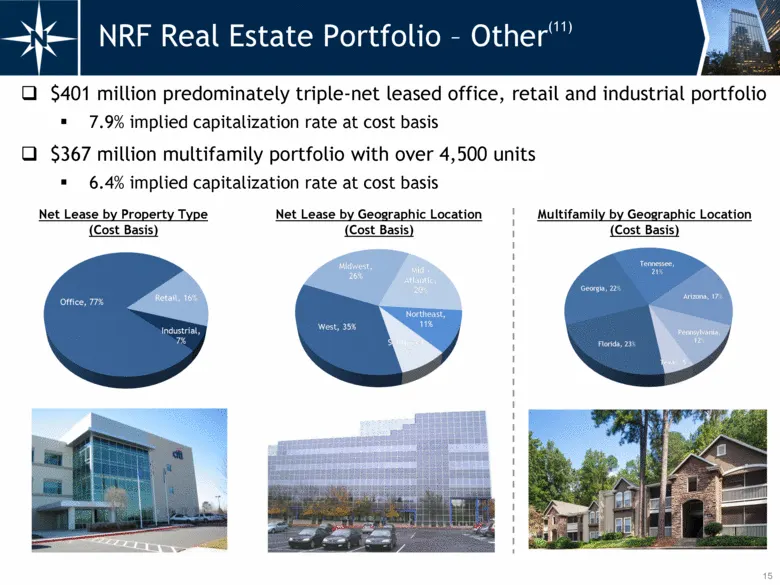
15 NRF Real Estate Portfolio - Other(11) $401 million predominately triple-net leased office, retail and industrial portfolio 7.9% implied capitalization rate at cost basis $367 million multifamily portfolio with over 4,500 units 6.4% implied capitalization rate at cost basis Net Lease by Property T
Slide 17: NRF New Loan Originations
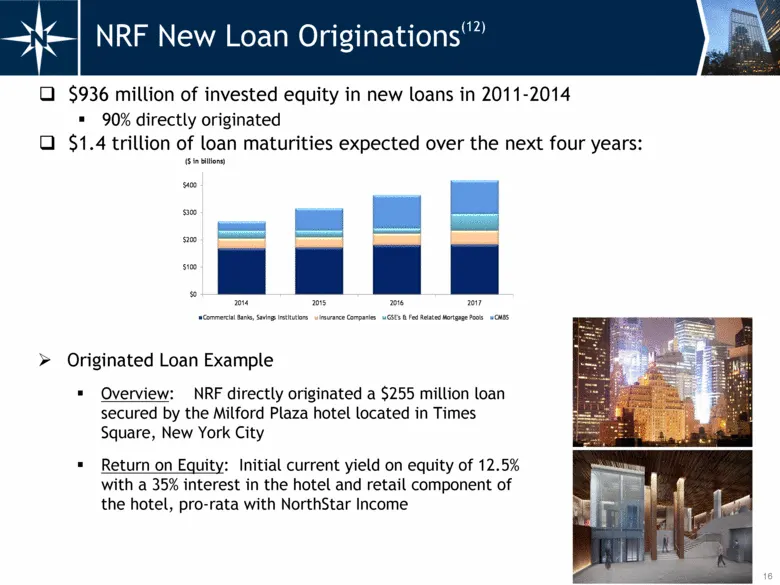
16 NRF New Loan Originations(12) $936 million of invested equity in new loans in 2011-2014 90% directly originated $1.4 trillion of loan maturities expected over the next four years: Originated Loan Example Overview: NRF directly originated a $255 million loan secured by the Milford Plaza hotel loca
Slide 18: NRF PE Investments
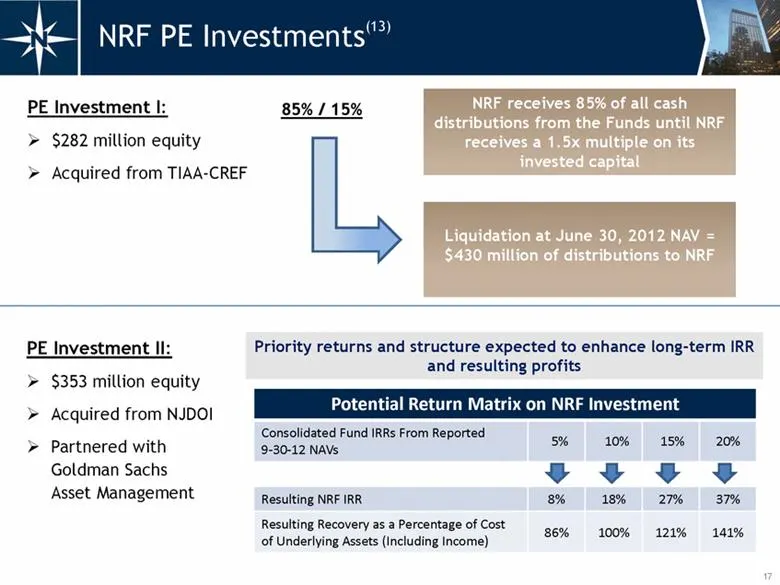
17 NRF PE Investments(13) PE Investment I: $282 million equity Acquired from TIAA-CREF Potential Return Matrix on NRF Investment Consolidated Fund IRRs From Reported 9-30-12 NAVs 5% 10% 15% 20% Resulting NRF IRR 8% 18% 27% 37% Resulting Recovery as a Percentage of Cost of Underlying Assets (Includin
Slide 19: NRF PE Investments
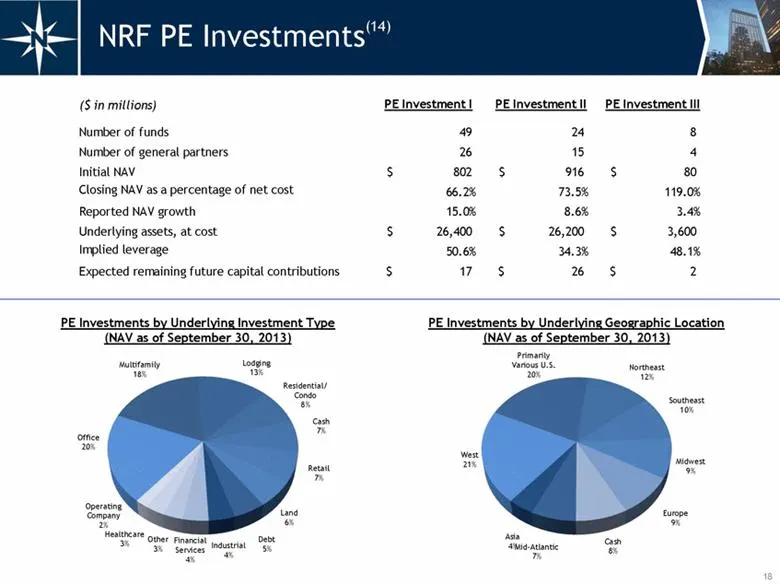
18 NRF PE Investments(14) PE Investments by Underlying Geographic Location (NAV as of September 30, 2013) PE Investments by Underlying Investment Type (NAV as of September 30, 2013) ($ in millions) PE Investment I PE Investment II PE Investment III Number of funds 49 24 8 Number of general partners
Slide 20: NRF CDO Bonds Repurchased
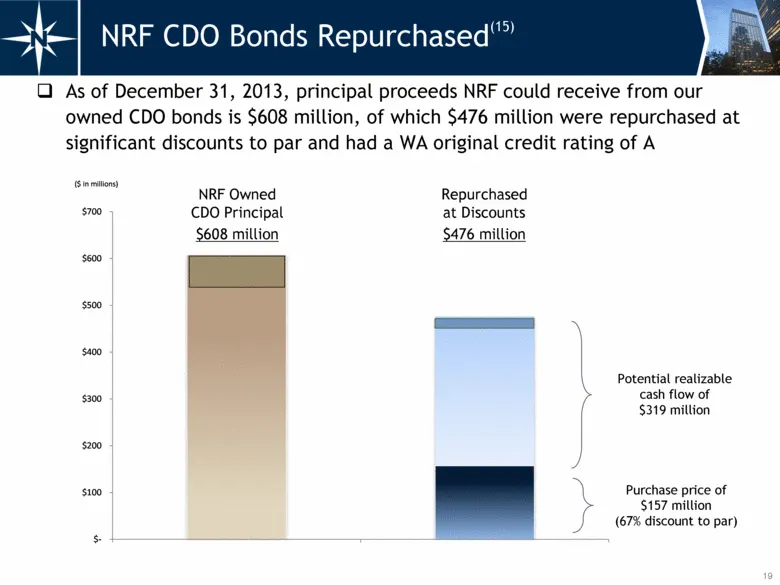
19 As of December 31, 2013, principal proceeds NRF could receive from our owned CDO bonds is $608 million, of which $476 million were repurchased at significant discounts to par and had a WA original credit rating of A Potential realizable cash flow of $319 million Purchase price of $157 million (67
Slide 21: Seasoned Executive Team
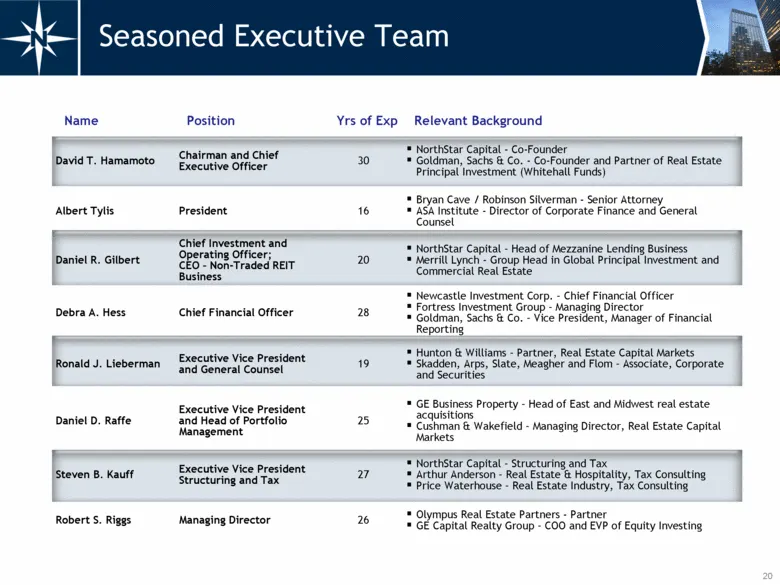
20 Seasoned Executive Team Name Position Yrs of Exp Relevant Background David T. Hamamoto Chairman and Chief Executive Officer 30 NorthStar Capital - Co-Founder Goldman, Sachs & Co. - Co-Founder and Partner of Real Estate Principal Investment (Whitehall Funds) Albert Tylis President 16 Bryan Cave /
Slide 22: Appendix
21 Appendix Non-Traded REIT Industry New Capital Repurchased CDO Bond Example 2013 Financing Transaction Reconciliation of Post-Spin 2014 Annualized Projected Cash Available for Distribution for NRF and NSAM Presentation Endnotes
Slide 23: Non-Traded REIT Industry New Capital
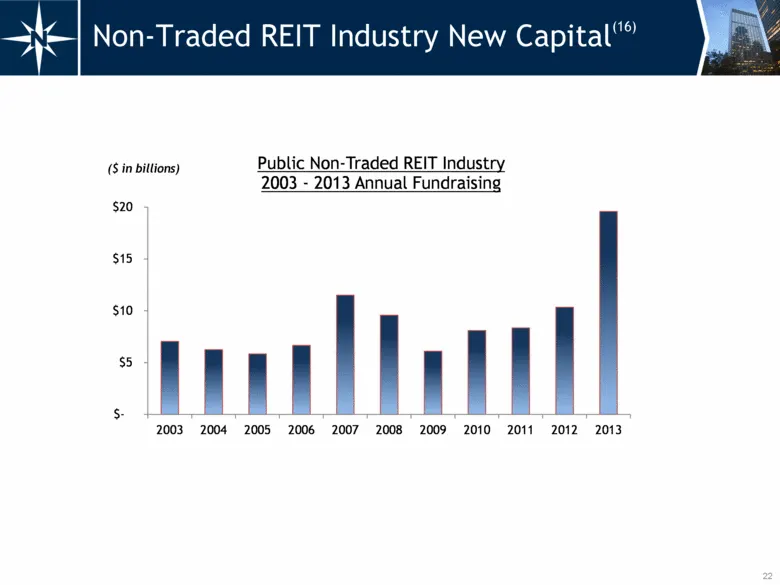
22 Non-Traded REIT Industry New Capital(16) $- $5 $10 $15 $20 2003 2004 2005 2006 2007 2008 2009 2010 2011 2012 2013 Public Non-Traded REIT Industry 2003 - 2013 Annual Fundraising ($ in billions)
Slide 24: Repurchased CDO Bond Example
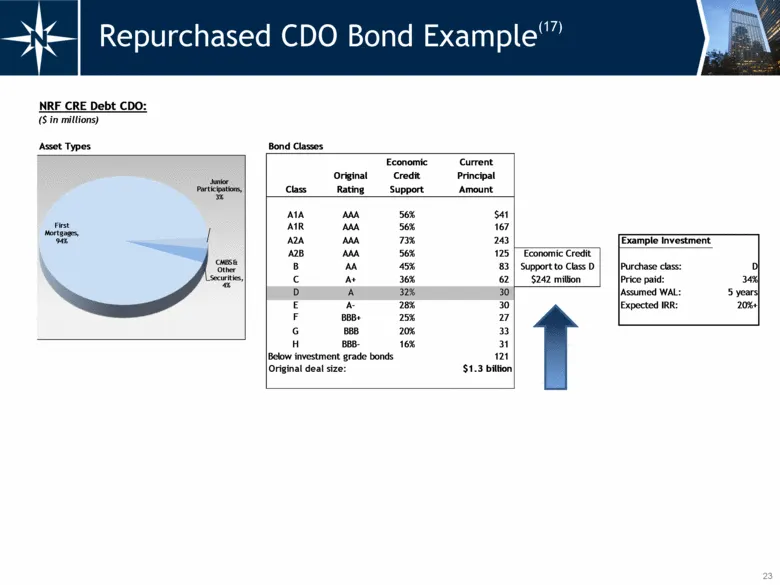
23 Repurchased CDO Bond Example(17) NRF CRE Debt CDO : ($ in millions) Asset Types Bond Classes Class Original Rating Economic Credit Support Current Principal Amount A1A AAA 56% $41 A1R AAA 56% 167 A2A AAA 73% 243 Example Investment A2B AAA 56% 125 Economic Credit B AA 45% 83 Support to Class D Pur
Slide 25: 2013 Financing Transaction
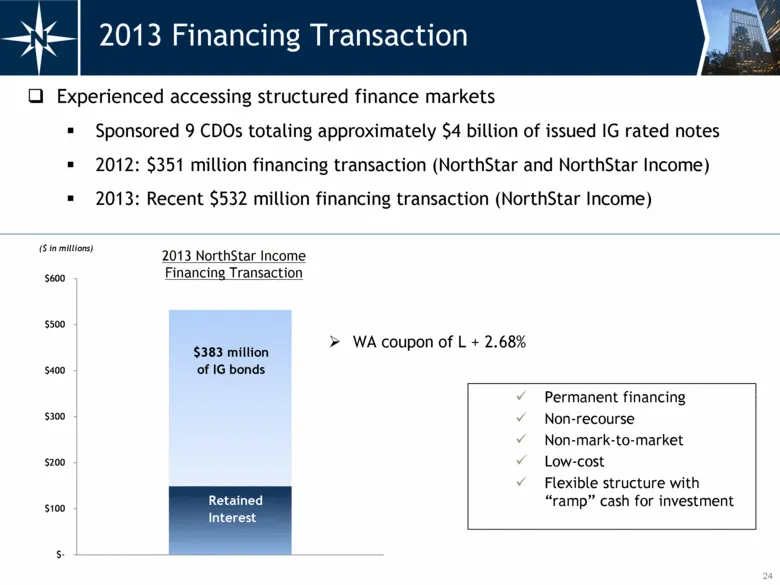
24 2013 Financing Transaction Experienced accessing structured finance markets Sponsored 9 CDOs totaling approximately $4 billion of issued IG rated notes 2012: $351 million financing transaction (NorthStar and NorthStar Income) 2013: Recent $532 million financing transaction (NorthStar Income) $383
Slide 26: Reconciliation of NRF Post-Spin 2014 Annualized Projected CAD
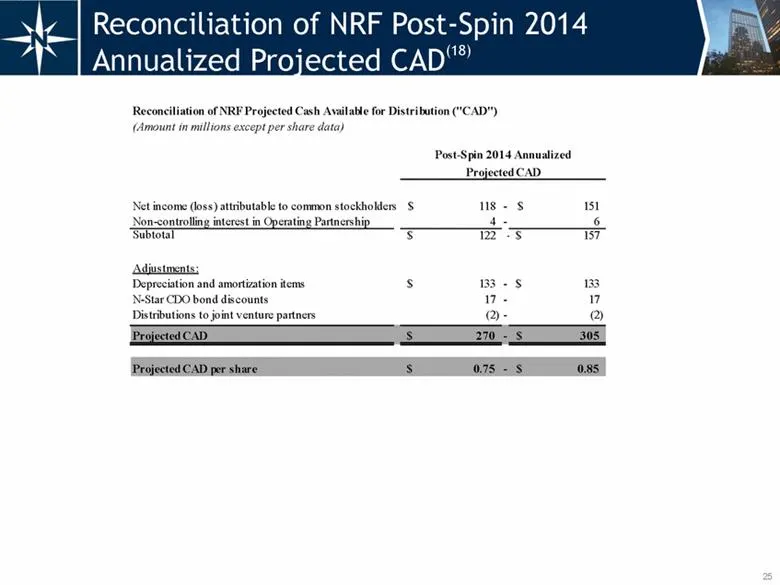
25 Reconciliation of NRF Post-Spin 2014 Annualized Projected CAD(18) Reconciliation of NRF Projected Cash Available for Distribution ("CAD") (Amount in millions except per share data) Post-Spin 2014 Annualized Projected CAD Net income (loss) attributable to common stockholders 118 $ - 151 $ Non-cont
Slide 27: Reconciliation of NSAM Post-Spin 2014 Annualized Projected CAD
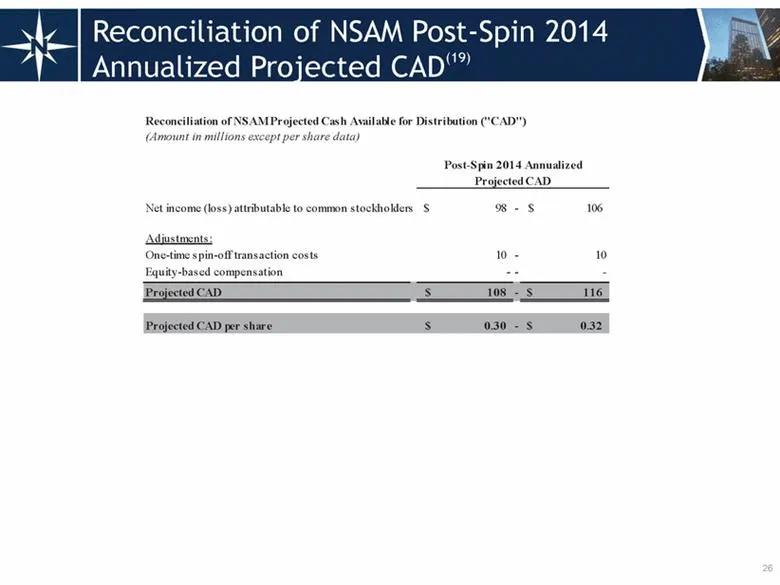
26 Reconciliation of NSAM Post-Spin 2014 Annualized Projected CAD(19) Reconciliation of NSAM Projected Cash Available for Distribution ("CAD") (Amount in millions except per share data) Post-Spin 2014 Annualized Projected CAD Net income (loss) attributable to common stockholders 98 $ - 106 $ Adjustm
Slide 28: Presentation Endnotes
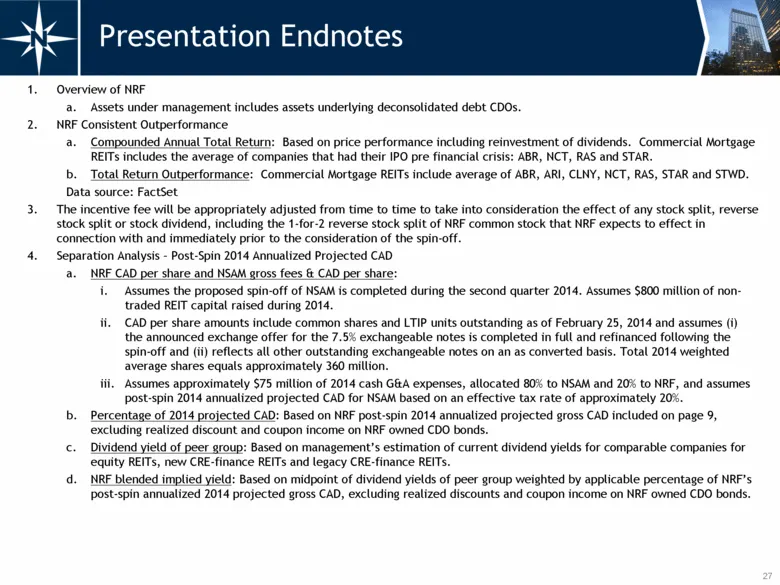
27 Presentation Endnotes Overview of NRF Assets under management includes assets underlying deconsolidated debt CDOs. NRF Consistent Outperformance Compounded Annual Total Return: Based on price performance including reinvestment of dividends. Commercial Mortgage REITs includes the average of compan
Slide 29: Presentation Endnotes (continued)
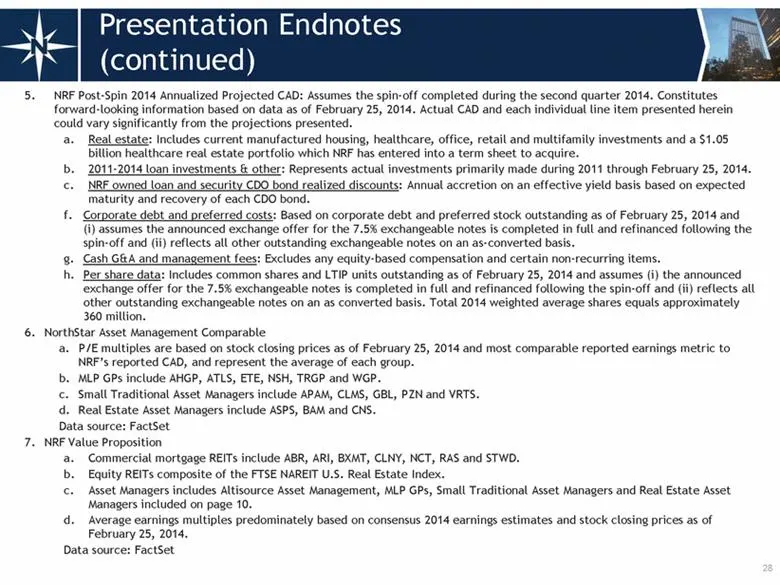
28 Presentation Endnotes (continued) NRF Post-Spin 2014 Annualized Projected CAD: Assumes the spin-off completed during the second quarter 2014. Constitutes forward-looking information based on data as of February 25, 2014. Actual CAD and each individual line item presented herein could vary signifi
Slide 30: Presentation Endnotes (continued)
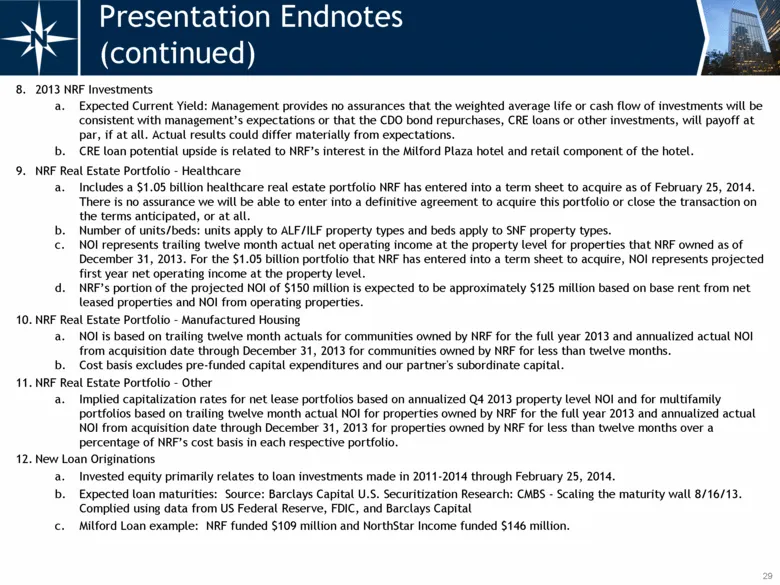
29 2013 NRF Investments Expected Current Yield: Management provides no assurances that the weighted average life or cash flow of investments will be consistent with management’s expectations or that the CDO bond repurchases, CRE loans or other investments, will payoff at par, if at all. Actual resul
Slide 31: Reconciliation of NRF Projected Post-Spin Annualized 2014 Projected CAD
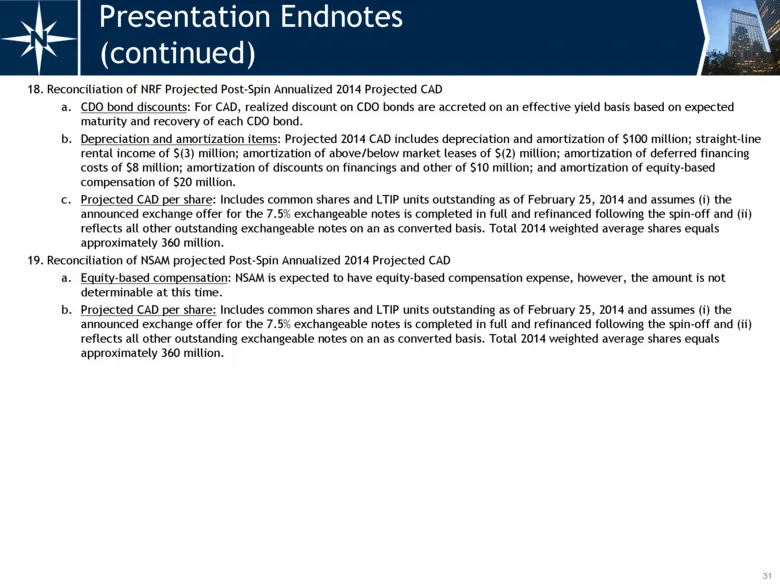
31 Reconciliation of NRF Projected Post-Spin Annualized 2014 Projected CAD CDO bond discounts: For CAD, realized discount on CDO bonds are accreted on an effective yield basis based on expected maturity and recovery of each CDO bond. Depreciation and amortization items: Projected 2014 CAD includes d
Slide 32: Park Avenue, 18th Floor, New York, NY 10022 | 212.547.2600 | NRFC.com
32 399 Park Avenue, 18th Floor, New York, NY 10022 | 212.547.2600 | NRFC.com
Source: SEC EDGAR · 8-K filed Feb 28, 2014
More decks from NorthStar Realty Finance Corp
 Merger or Acquisition (July 2016)5 slides · Jul 29, 2016
 Merger or Acquisition (June 2016)31 slides · Jun 7, 2016
 Merger or Acquisition (June 2016)27 slides · Jun 3, 2016
 Merger or Acquisition (February 2015)23 slides · Feb 26, 2015
 Investor Presentation (January 2015)14 slides · Jan 13, 2015
 Investor Presentation (August 2014)28 slides · Aug 11, 2014