Fisher Scientific International Inc
Fisher Scientific International — Merger or Acquisition (June 2004)
24 slides from Fisher Scientific International's merger presentation, Jun 28, 2004
Slide 1: The World Leader in Serving Science
The World Leader in Serving Science June 2004
Slide 2: Safe Harbor and Regulation G Statement
This presentation contains statements that constitute forward-looking statements within the meaning of the Private Securities Litigation Reform Act of 1995. These statements are based on Fisher's and Apogent's current expectations and beliefs and are subject to a number of risks, uncertainties and a
Slide 3: Fisher at a Glance
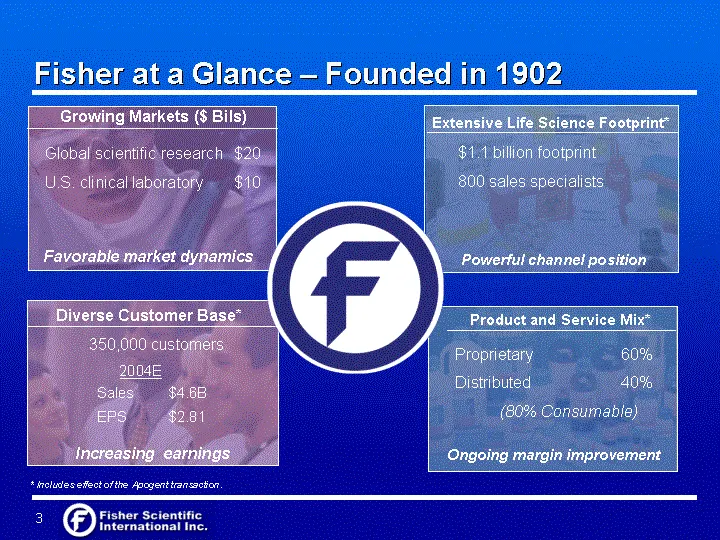
Fisher at a Glance - Founded in 1902 Proprietary 60% Distributed 40% (80% Consumable) * Includes effect of the Apogent transaction. 350,000 customers Global scientific research $20 U.S. clinical laboratory $10 2004E Sales $4.6B EPS $2.81 Growing Markets ($ Bils) Favorable market dynamics Extensive L
Slide 4: Diverse Customer Base
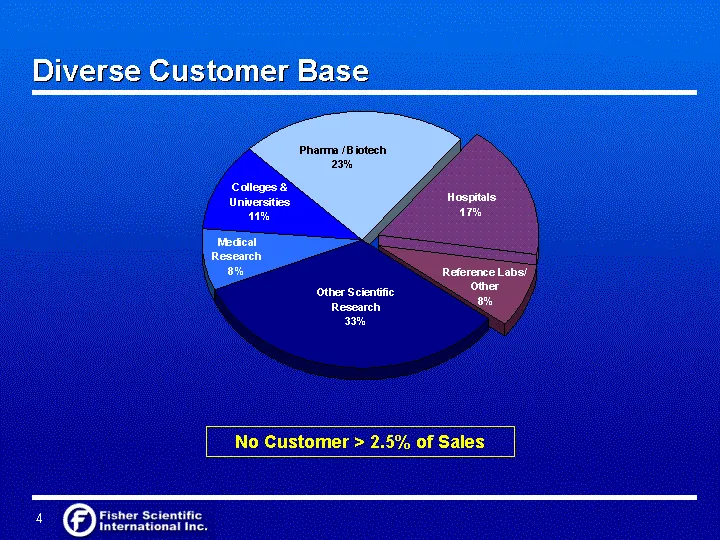
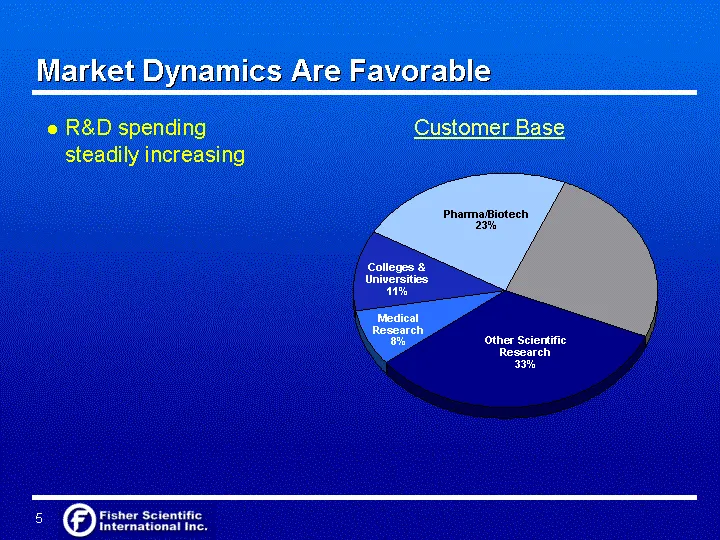
No Customer > 2.5% of Sales Diverse Customer Base Pharma 0.23 Hospitals 0.17 Reference Labs / Other 0.08 Other 0.33 Medical Research 0.08 Colleges and Universities 0.11
Slide 5: Market Dynamics Are Favorable
Pharma 0.23 Hospitals 0.25 Other 0.33 Medical Research 0.08 Colleges and Universities 0.11 R&D spending steadily increasing Market Dynamics Are Favorable Customer Base Pharma/Biotech 23% Colleges & Universities 11% Medical Research 8% Other Scientific Research 33%
Slide 6: Market Dynamics Are Favorable
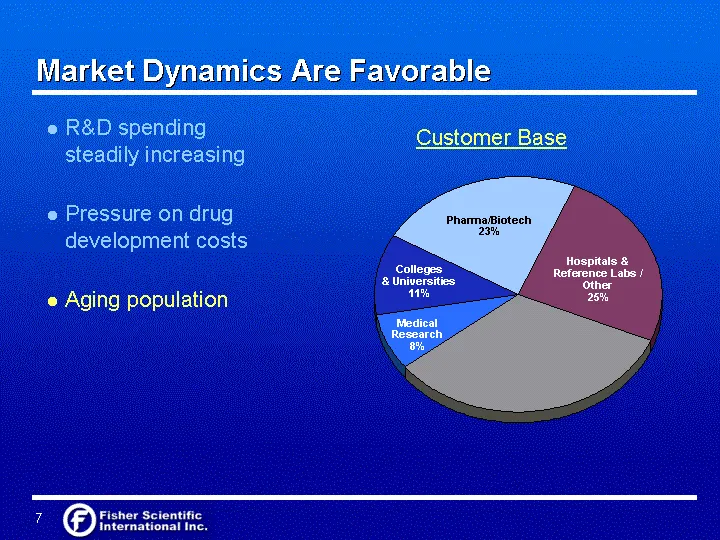
Pressure on drug development costs Aging population R&D spending steadily increasing Market Dynamics Are Favorable Customer Base Pharma 0.23 Hospitals 0.25 Other 0.33 Medical Research 0.08 Colleges and Universities 0.11 Pharma/Biotech 23% Colleges & Universities 11% Medical Research 8% Hospitals & R
Slide 7: Market Dynamics Are Favorable
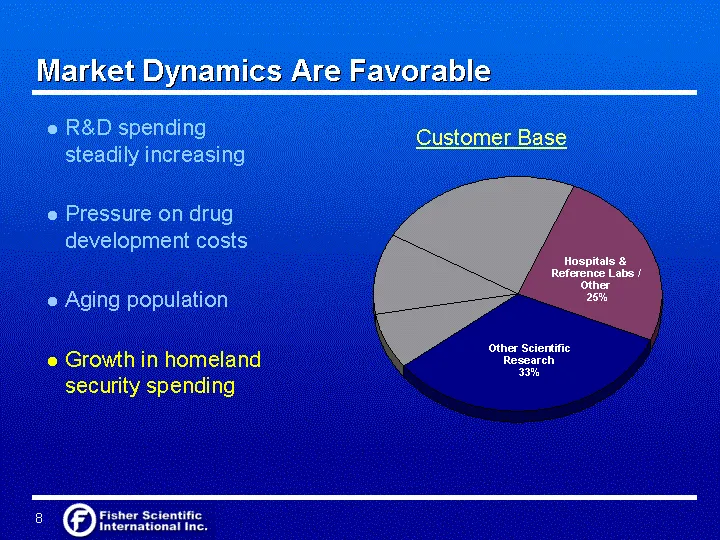
Pressure on drug development costs Aging population R&D spending steadily increasing Growth in homeland security spending Market Dynamics Are Favorable Customer Base Pharma 0.23 Hospitals 0.25 Other 0.33 Medical Research 0.08 Colleges and Universities 0.11 Hospitals & Reference Labs / Other 25% Othe
Slide 8: Scientific Research Market Leadership Position
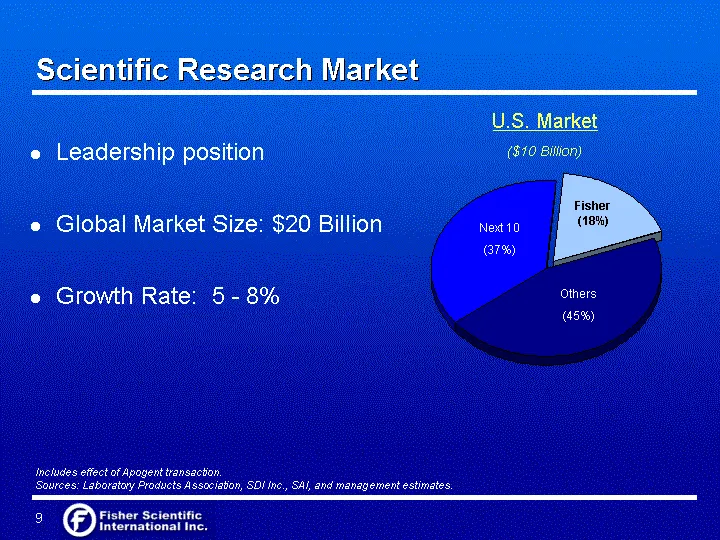
Scientific Research Market Leadership position Global Market Size: $20 Billion Growth Rate: 5 - 8% Includes effect of Apogent transaction. Sources: Laboratory Products Association, SDI Inc., SAI, and management estimates. U.S. Market ($10 Billion) Other 0.45 Next 10 Players 0.37 Fisher 0.18 Next 10
Slide 9: Scientific Products and Services
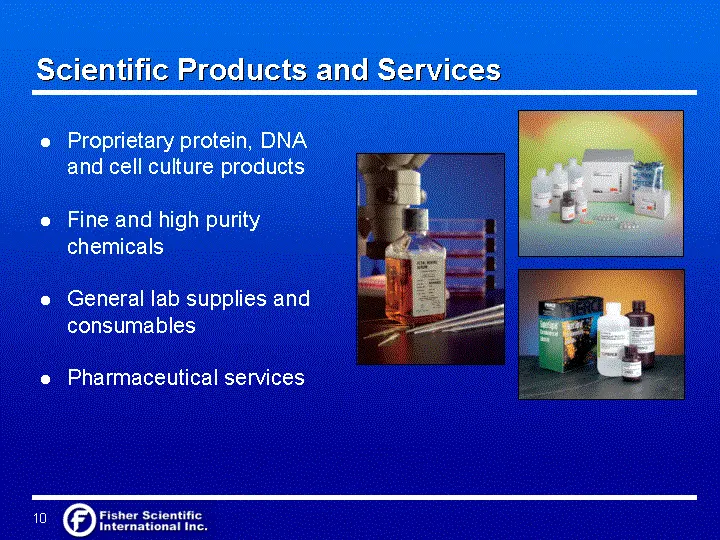
Scientific Products and Services Proprietary protein, DNA and cell culture products Fine and high purity chemicals General lab supplies and consumables Pharmaceutical services
Slide 10: Scientific Products and Services: BioChemicals
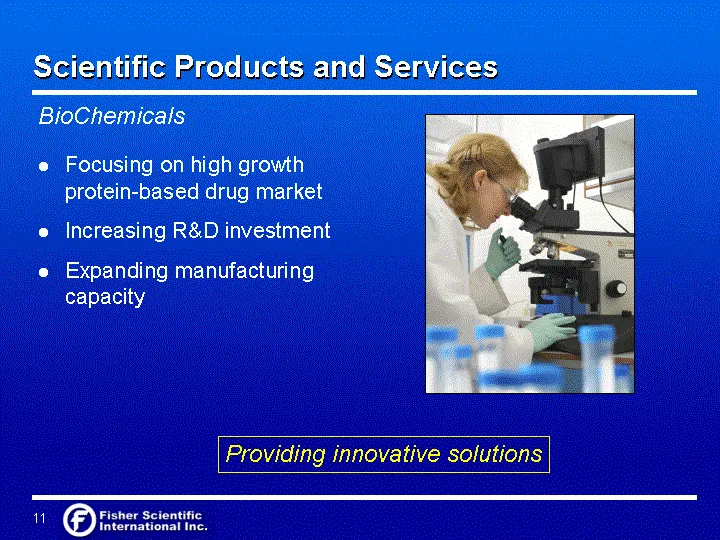
Focusing on high growth protein-based drug market Increasing R&D investment Expanding manufacturing capacity Scientific Products and Services BioChemicals Providing innovative solutions
Slide 11: Clinical Lab Market Leadership Position
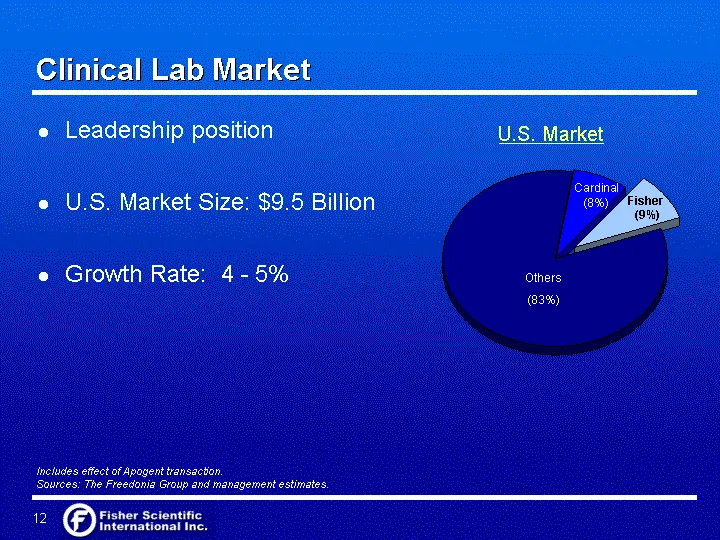
Clinical Lab Market Leadership position U.S. Market Size: $9.5 Billion Growth Rate: 4 - 5% Includes effect of Apogent transaction. Sources: The Freedonia Group and management estimates. U.S. Market Other 0.83 Cardinal 0.08 Fisher (including Columbia) 0.09 Fisher (9%) Cardinal (8%) Others (83%)
Slide 12: Healthcare Products and Services
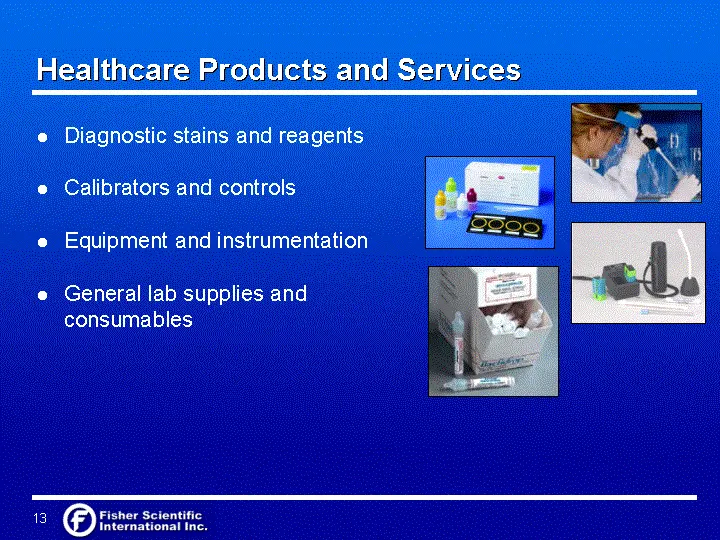
Healthcare Products and Services Diagnostic stains and reagents Calibrators and controls Equipment and instrumentation General lab supplies and consumables
Slide 13: Company Capabilities
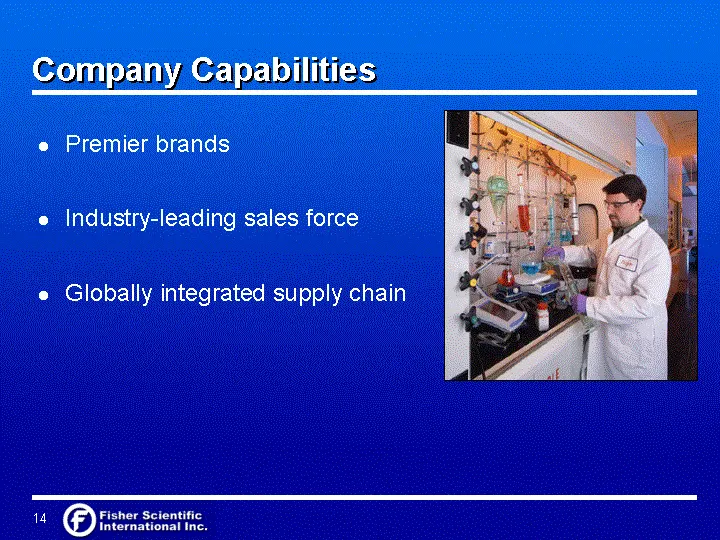
Premier brands Industry-leading sales force Globally integrated supply chain Company Capabilities
Slide 14: Company Capabilities: Premier Brands
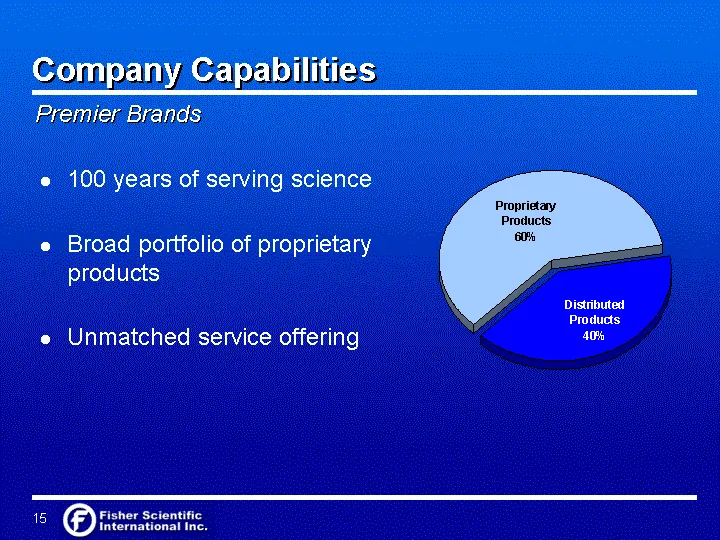
100 years of serving science Broad portfolio of proprietary products Unmatched service offering Company Capabilities Premier Brands Distributed Products 0.4 Self-Manufactured 0.6
Slide 15: Industry-Leading Sales Force
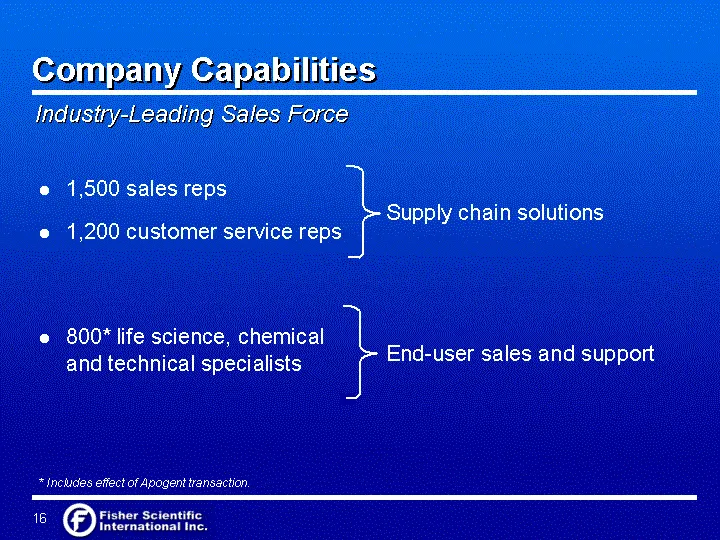
1,500 sales reps 1,200 customer service reps Industry-Leading Sales Force Company Capabilities Supply chain solutions 800* life science, chemical and technical specialists End-user sales and support * Includes effect of Apogent transaction.
Slide 16: Globally Integrated Supply Chain
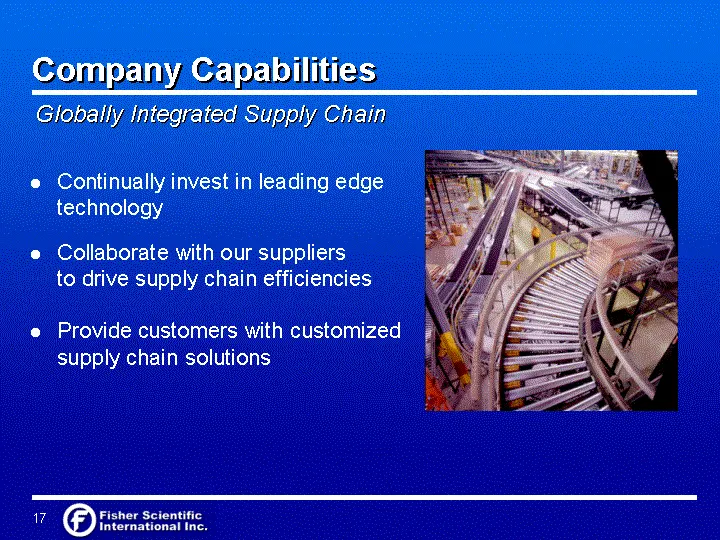
Continually invest in leading edge technology Collaborate with our suppliers to drive supply chain efficiencies Company Capabilities Globally Integrated Supply Chain Provide customers with customized supply chain solutions
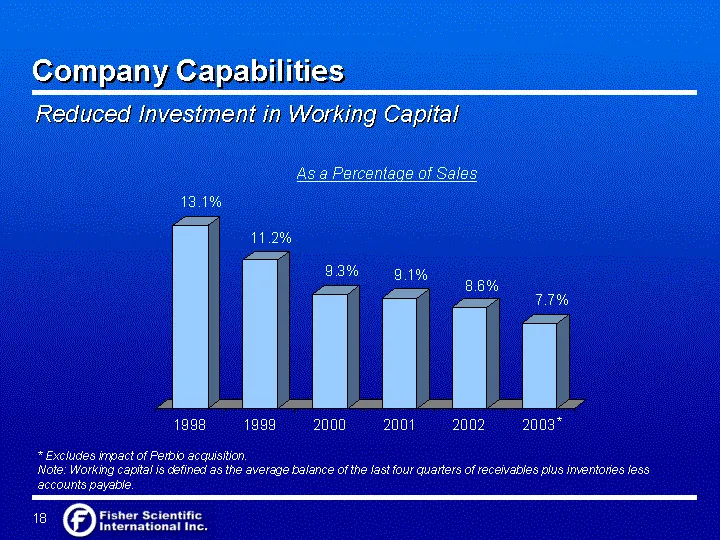
Slide 17: Reduced Investment in Working Capital
1998 1999 2000 2001 2002 2003 East 0.131 0.112 0.093 0.091 0.086 0.077 * Excludes impact of Perbio acquisition. Note: Working capital is defined as the average balance of the last four quarters of receivables plus inventories less accounts payable. As a Percentage of Sales * Company Capabilities Red
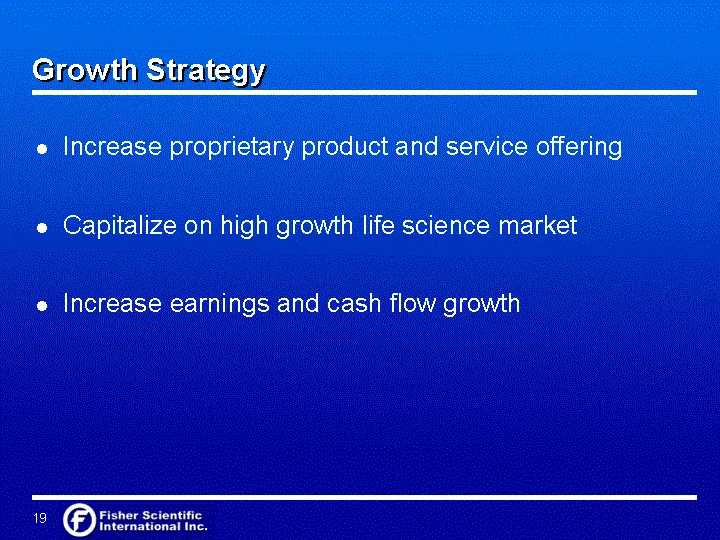
Slide 18: Growth Strategy
Increase proprietary product and service offering Capitalize on high growth life science market Increase earnings and cash flow growth Growth Strategy
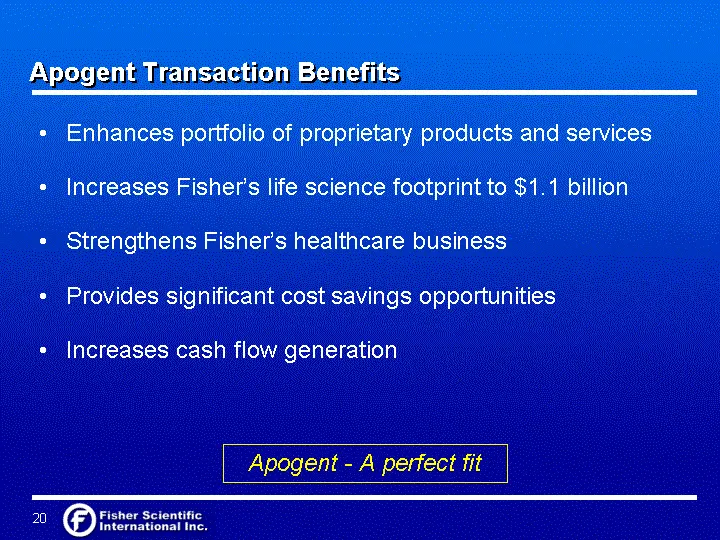
Slide 19: Apogent Transaction Benefits
Apogent Transaction Benefits Enhances portfolio of proprietary products and services Increases Fisher's life science footprint to $1.1 billion Strengthens Fisher's healthcare business Provides significant cost savings opportunities Increases cash flow generation Apogent - A perfect fit
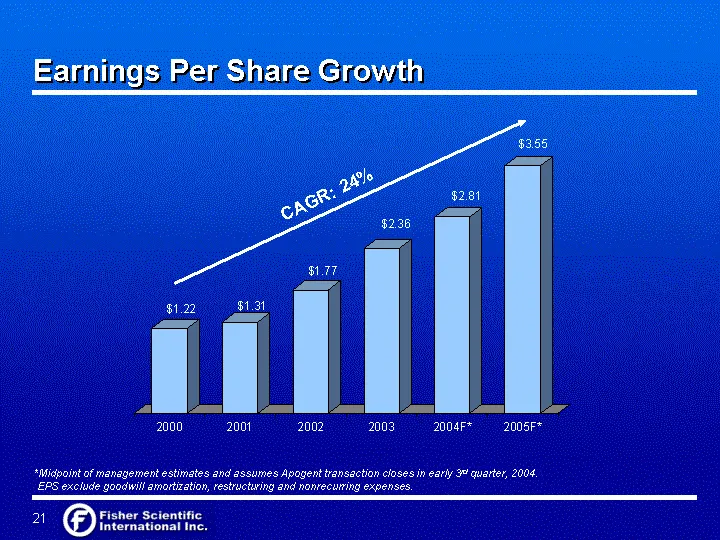
Slide 20: Earnings Per Share Growth
Earnings Per Share Growth *Midpoint of management estimates and assumes Apogent transaction closes in early 3rd quarter, 2004. EPS exclude goodwill amortization, restructuring and nonrecurring expenses. 2000 2001 2002 2003 2004F* 2005F* CAGR: 24%
Slide 21: Investment Highlights
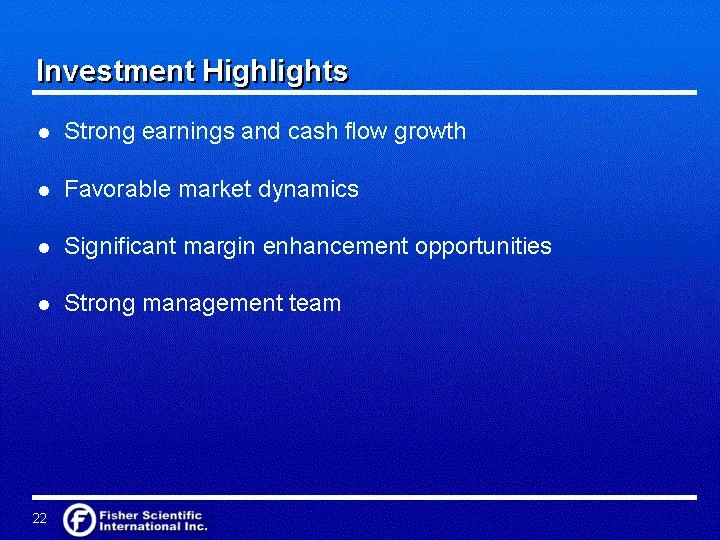
Investment Highlights Strong earnings and cash flow growth Favorable market dynamics Significant margin enhancement opportunities Strong management team
Slide 22: Questions and Answers
Questions and Answers
Slide 23: Supplementary Financial Information
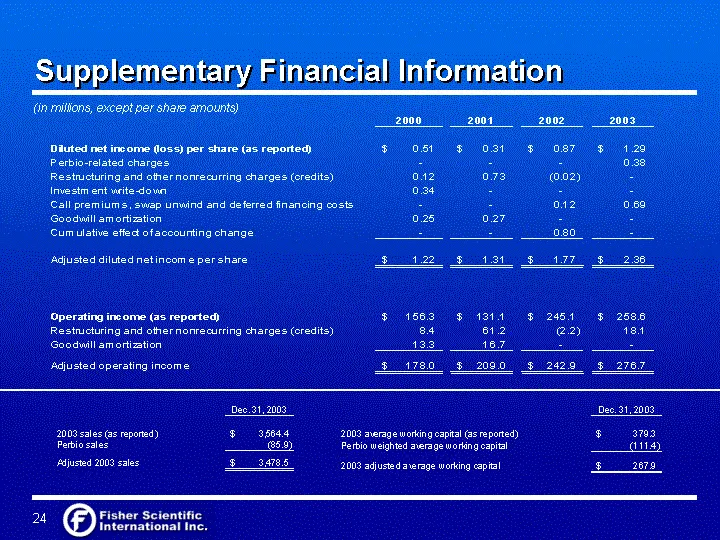
(in millions, except per share amounts) Supplementary Financial Information
Slide 24: Additional Information
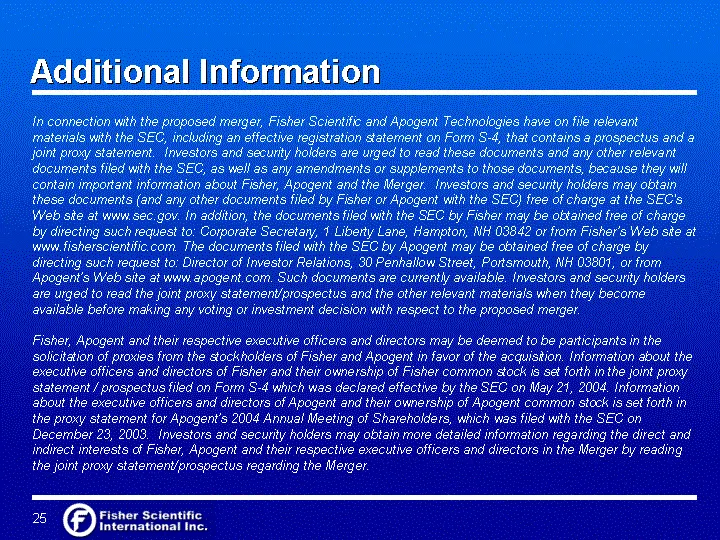
Additional Information In connection with the proposed merger, Fisher Scientific and Apogent Technologies have on file relevant materials with the SEC, including an effective registration statement on Form S-4, that contains a prospectus and a joint proxy statement. Investors and security holders ar
Source: SEC EDGAR · 425 filed Jun 28, 2004
More decks from Fisher Scientific International Inc
 Merger or Acquisition (May 2006)23 slides · May 8, 2006
 Lehman Brothers Ninth Annual Global Healthcare Conference 200619 slides · Mar 8, 2006
 Merrill Lynch Global Pharmaceutical, Biotechnology & Medical Device Conference 200612 slides · Feb 9, 2006
 Goldman Sachs Twenty Sixth Annual Global Healthcare Conference 200511 slides · Jun 15, 2005
 Banc of America Securities Health Care Conference 200511 slides · May 17, 2005
 Baird Growth Stock Conference 200526 slides · May 12, 2005