Sonos, Inc. · NASDAQ:SONO
Sonos — Q4 2026 Earnings Presentation
38 slides from Sonos's earnings presentation, November 2026
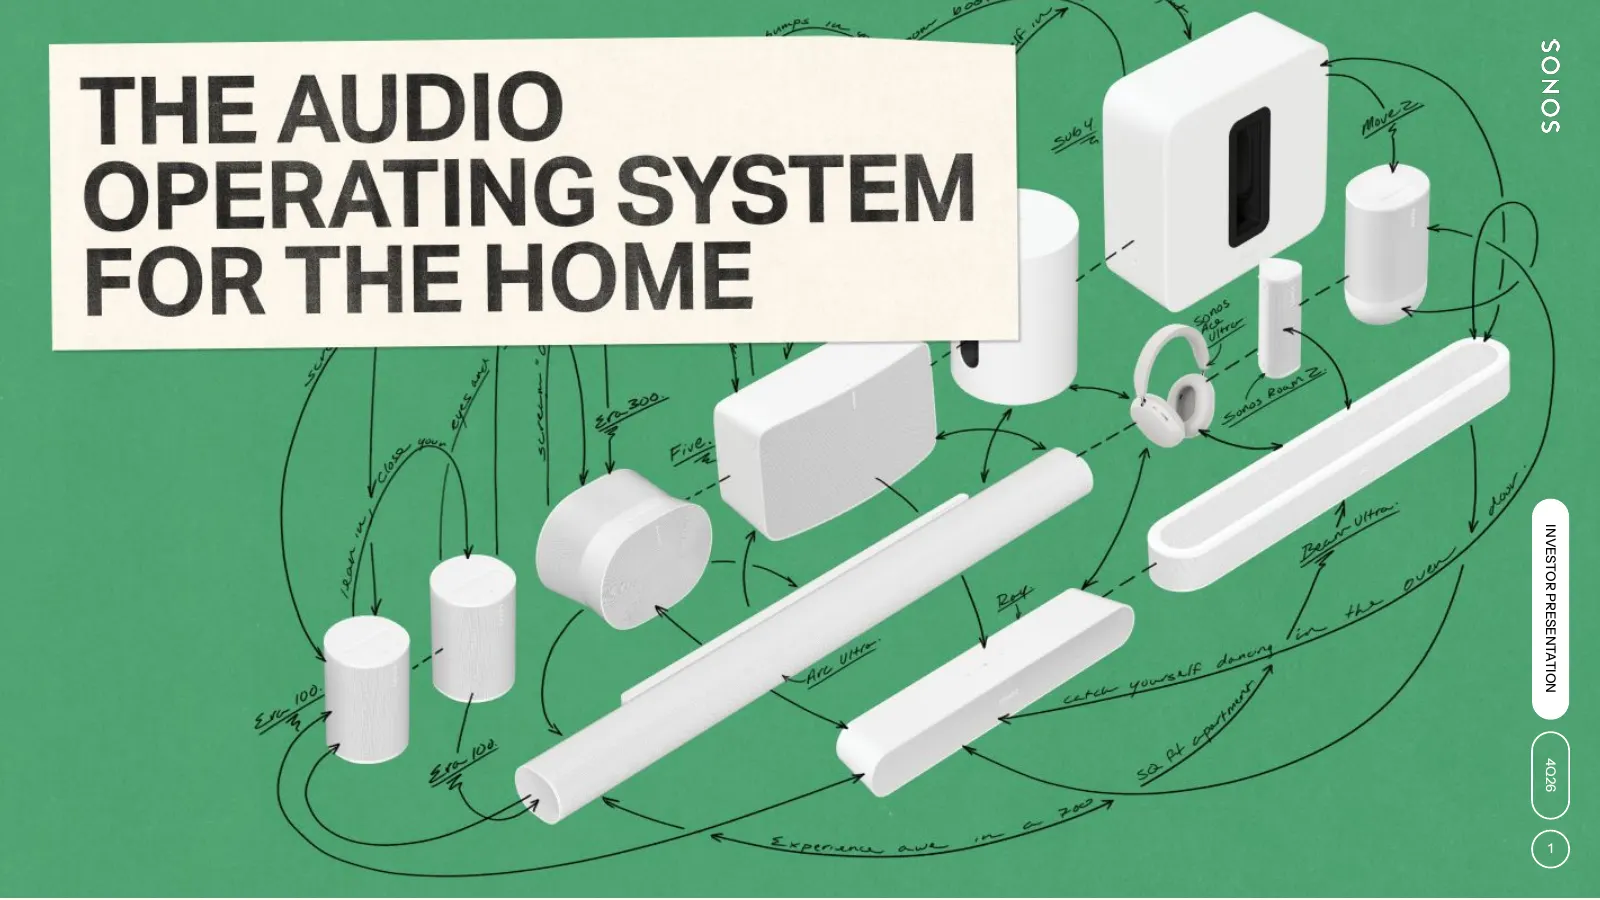
Slide 1: Investor Presentation 4Q26
INVESTOR PRESENTATION 4Q26 1
Slide 2: Forward-looking Statements
Forward-looking Statements This presentation contains forward-looking statements that involve risks and uncertainties. These forward-looking statements include statements regarding our outlook for the fiscal quarter ending January 2, 2027; our long-term focus, financial, growth, and business strateg
Slide 3: Our Purpose: To elevate life through sound
Our Purpose To elevate life through sound. INVESTOR PRESENTATION 4Q26 3
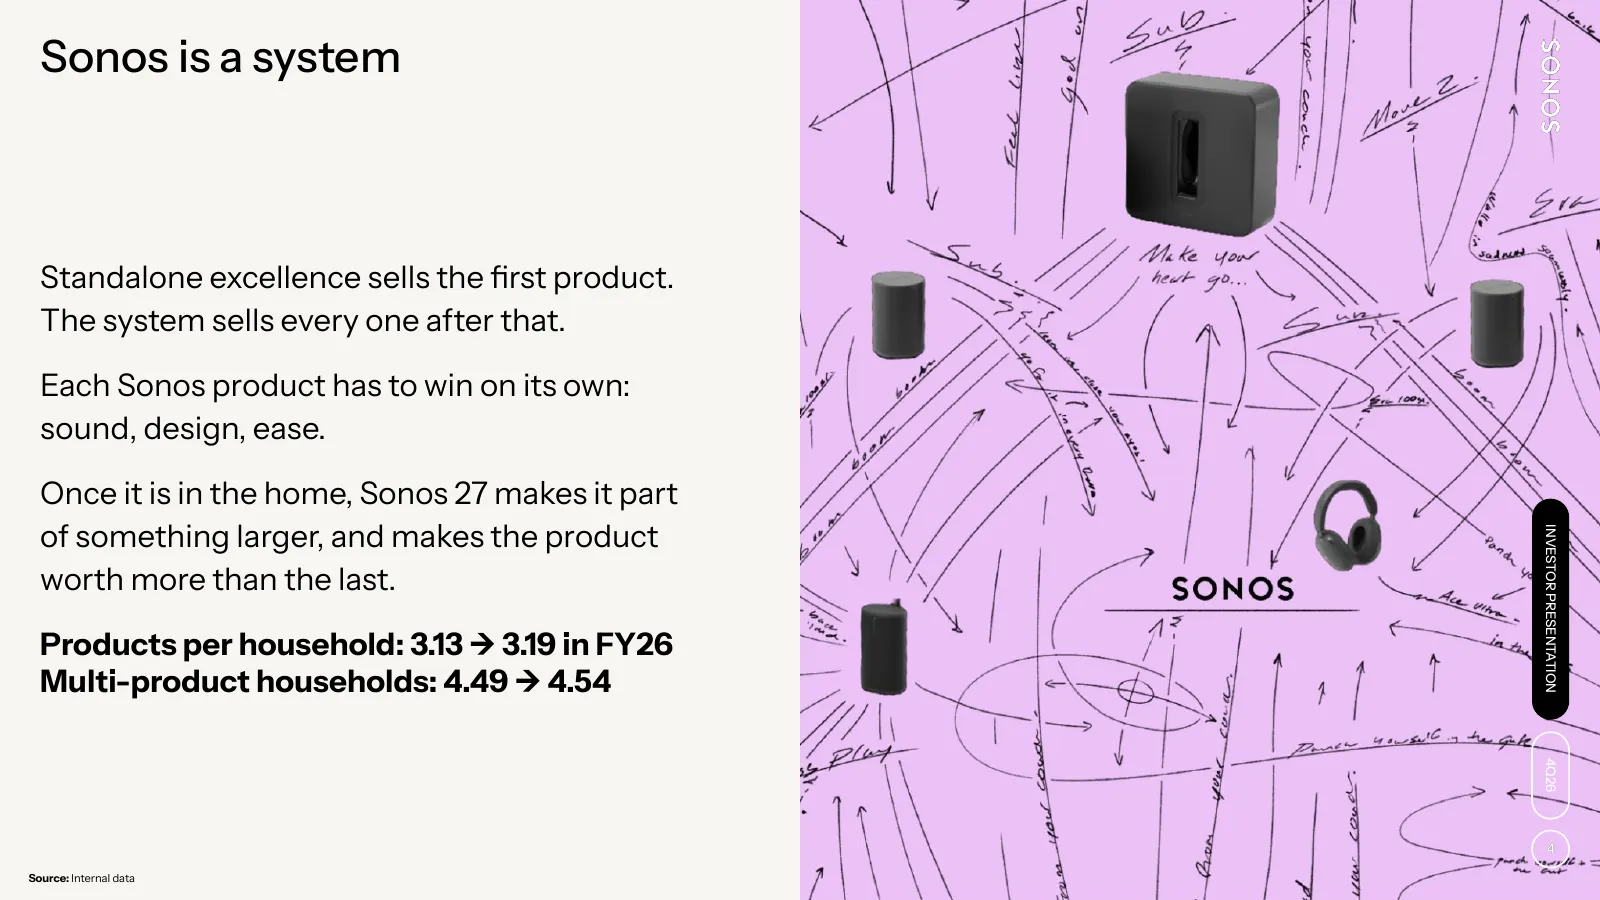
Slide 4: Sonos is a system
Sonos is a system Standalone excellence sells the first product. The system sells every one after that. Each Sonos product has to win on its own: sound, design, ease. Once it is in the home, Sonos 27 makes it part of something larger, and makes the product INVESTOR PRESENTATION worth more than the l
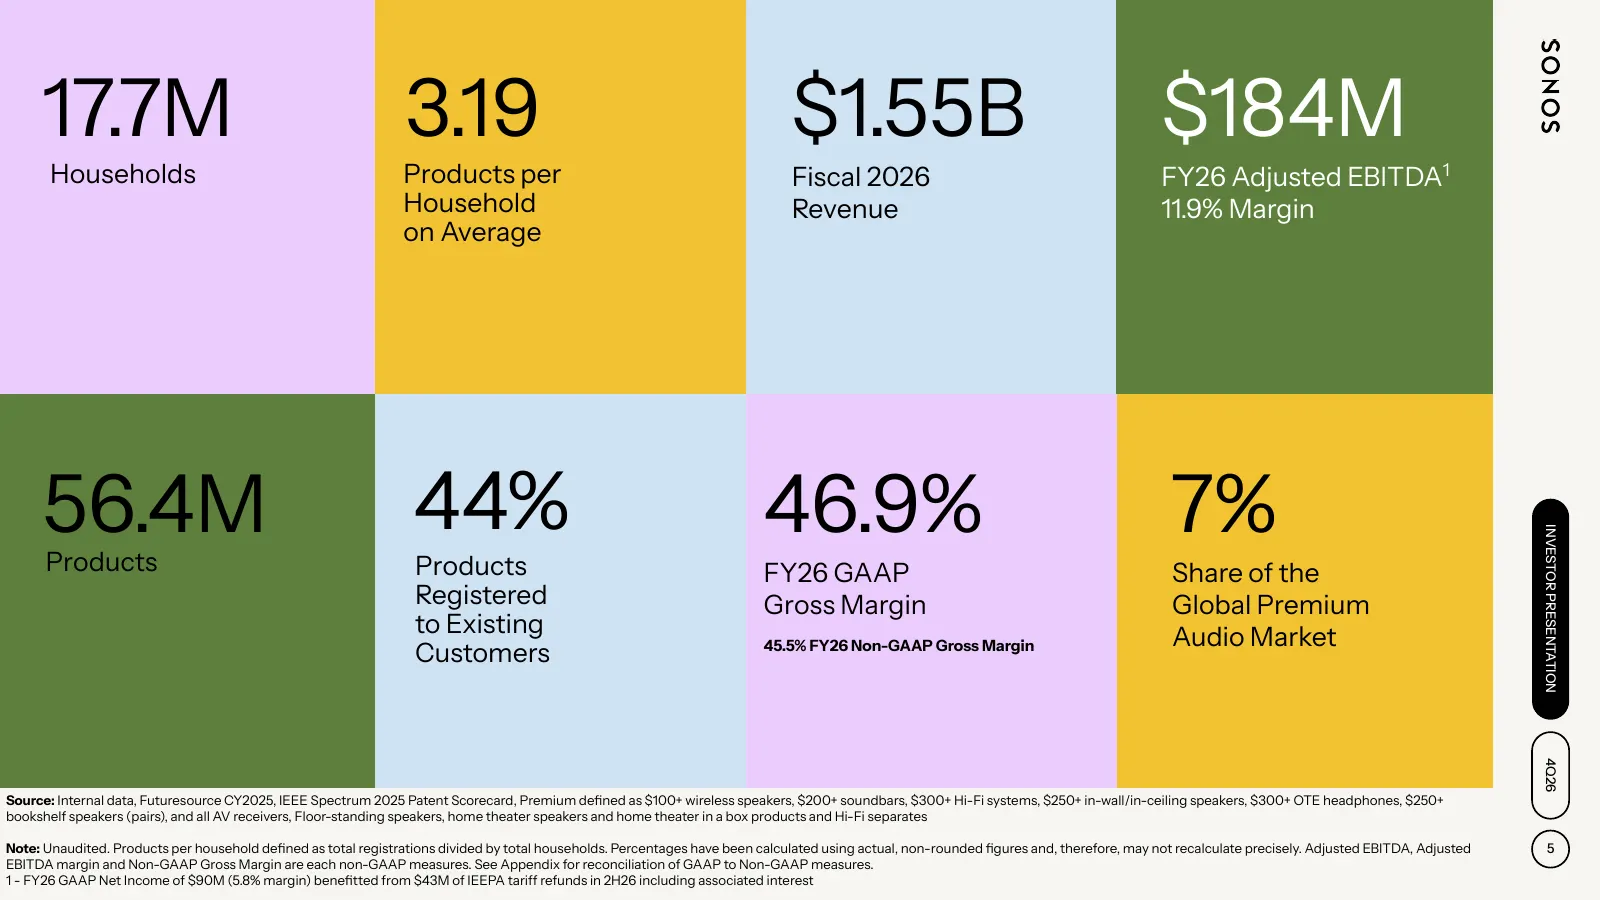
Slide 5: Key metrics: $1.55B revenue, $184M Adjusted EBITDA, 56.4M products
17.7M 3.19 $1.55B $184M Households Products per Fiscal 2026 FY26 Adjusted EBITDA1 Household Revenue 11.9% Margin on Average 56.4M 44% 46.9% 7% INVESTOR PRESENTATION Products Products FY26 GAAP Share of the Registered Gross Margin Global Premium to Existing Audio Market Customers 45.5% FY26 Non-GAAP
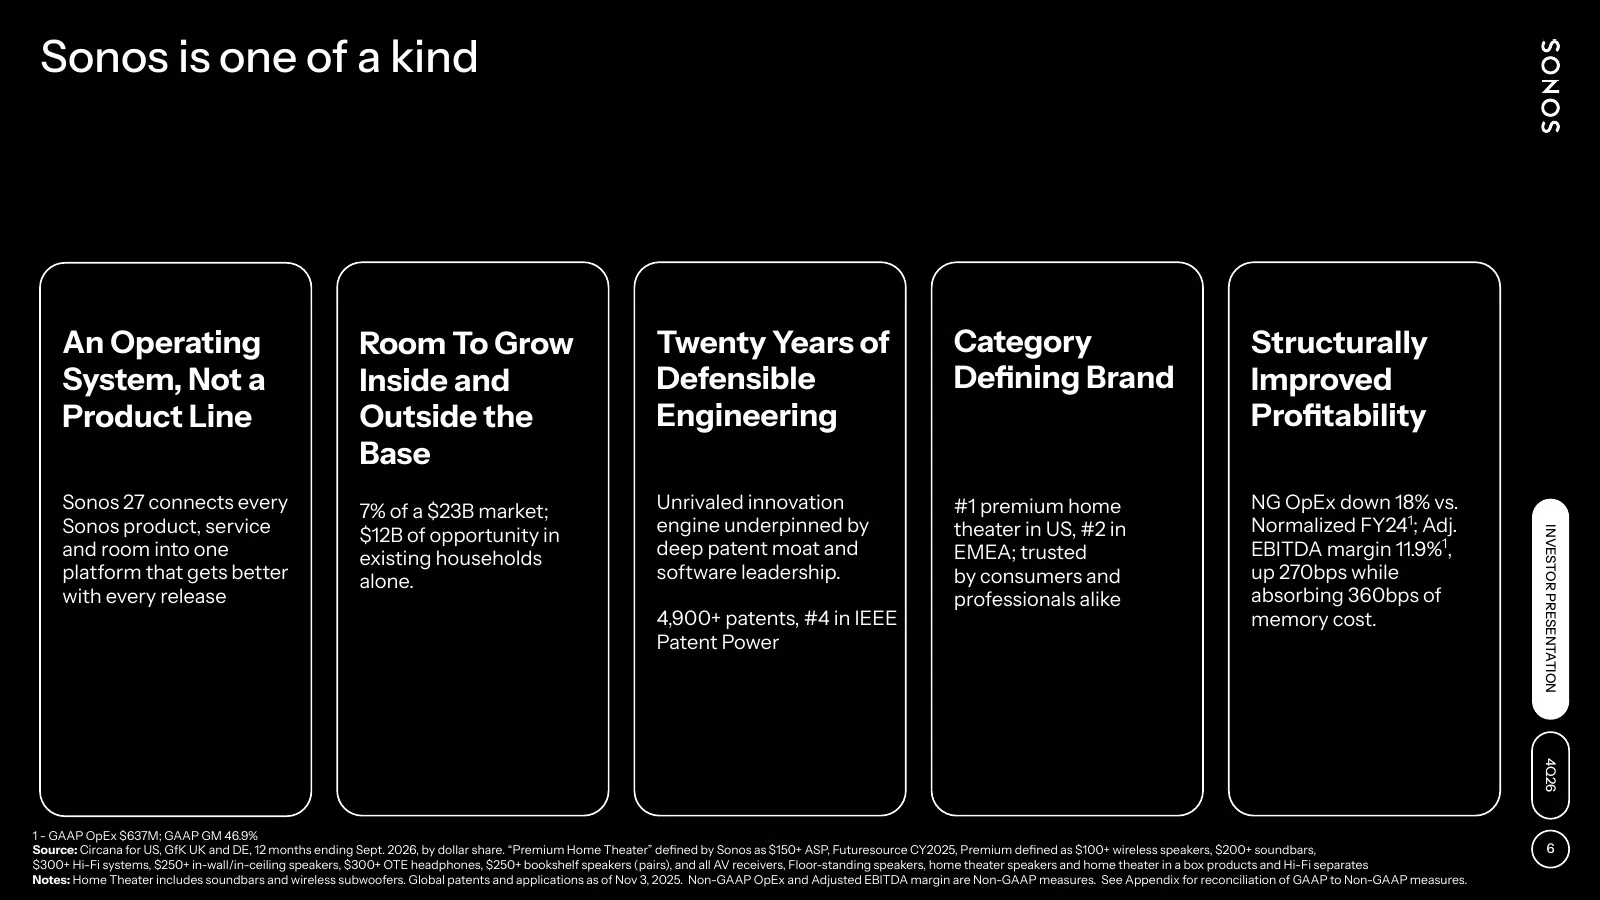
Slide 6: Sonos is one of a kind
Sonos is one of a kind An Operating Room To Grow Twenty Years of Category Structurally System, Not a Inside and Defensible Defining Brand Improved Product Line Outside the Engineering Profitability Base Sonos 27 connects every 7% of a $23B market; Unrivaled innovation #1 premium home NG OpEx down 18
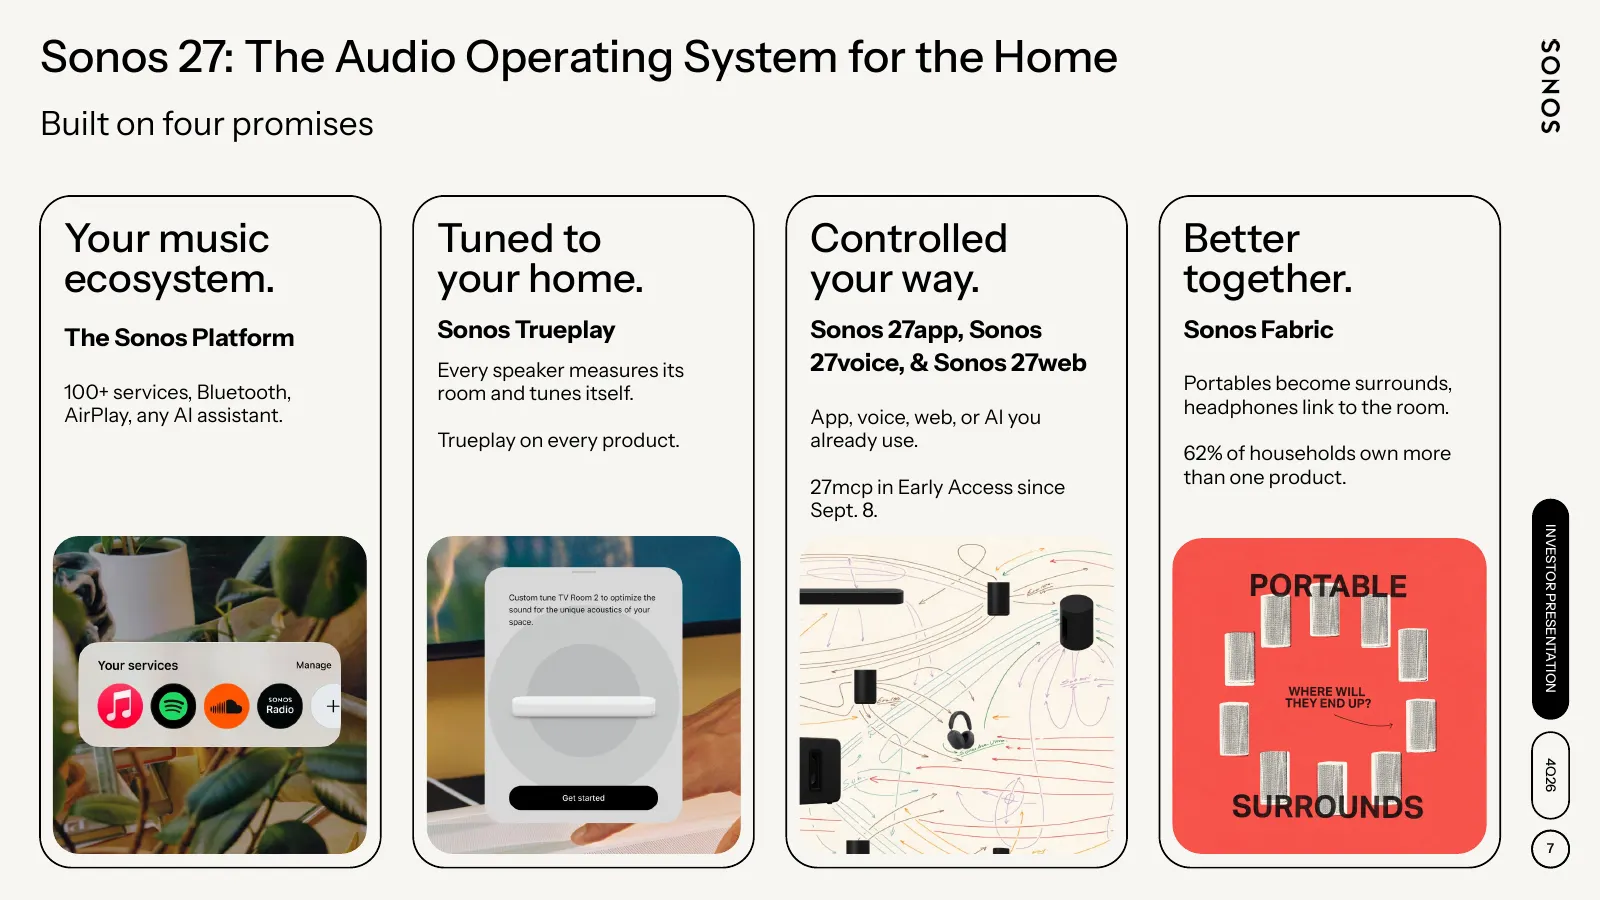
Slide 7: Sonos 27: The Audio Operating System for the Home
Sonos 27: The Audio Operating System for the Home Built on four promises Your music Tuned to Controlled Better ecosystem. your home. your way. together. The Sonos Platform Sonos Trueplay Sonos 27app, Sonos Sonos Fabric Every speaker measures its 27voice, & Sonos 27web 100+ services, Bluetooth, Porta
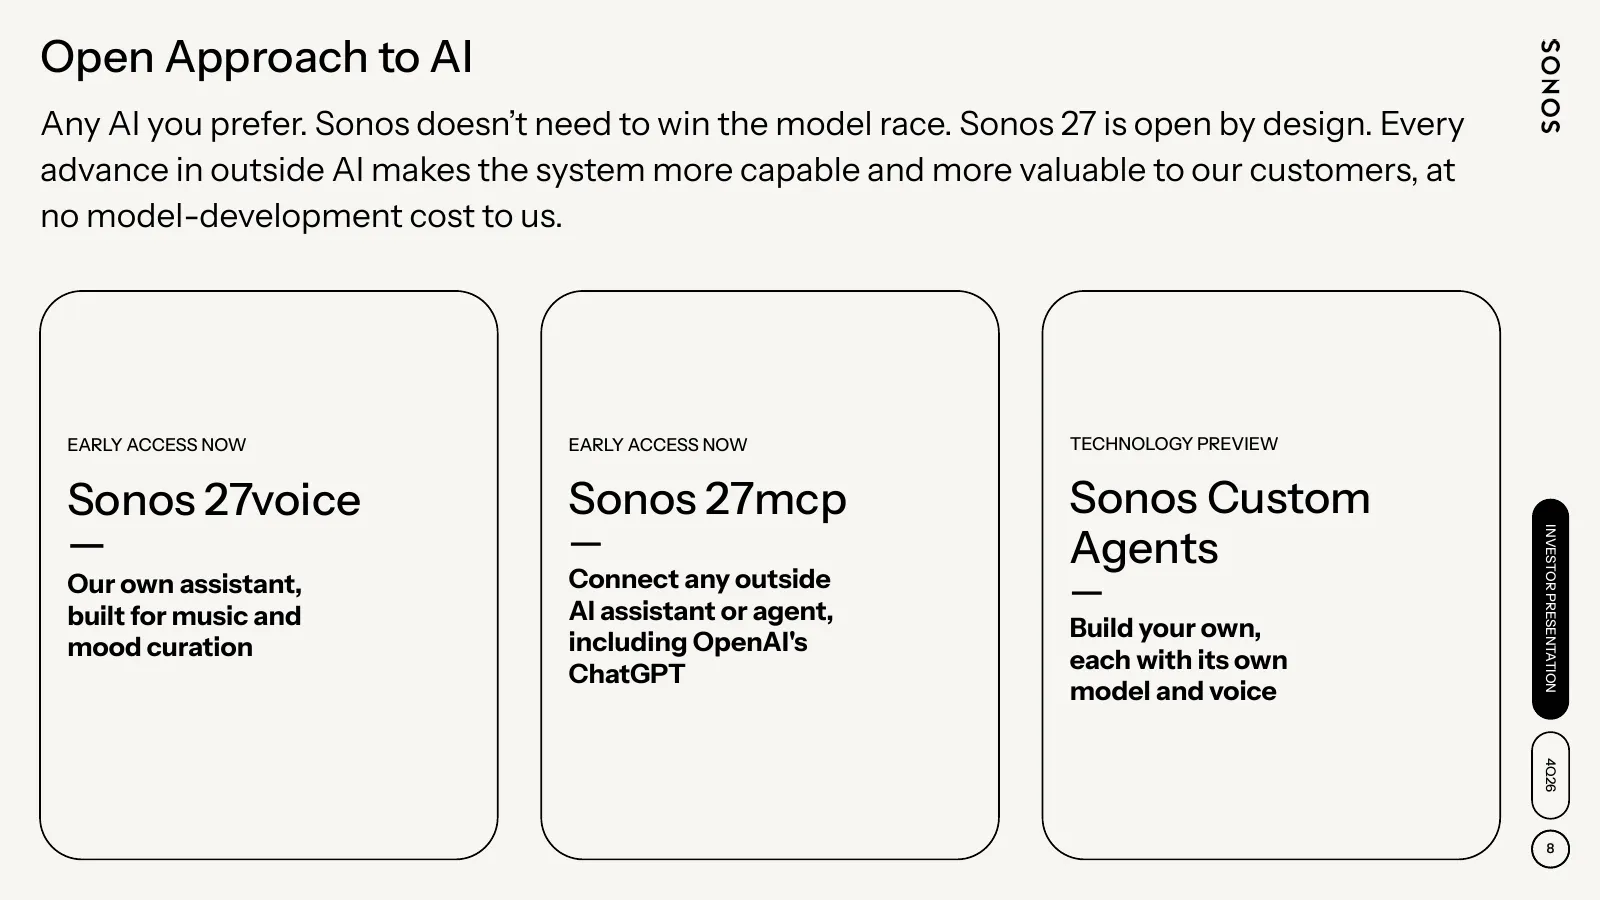
Slide 8: Open Approach to AI
Open Approach to AI Any AI you prefer. Sonos doesn’t need to win the model race. Sonos 27 is open by design. Every advance in outside AI makes the system more capable and more valuable to our customers, at no model-development cost to us. EARLY ACCESS NOW EARLY ACCESS NOW TECHNOLOGY PREVIEW Sonos 27
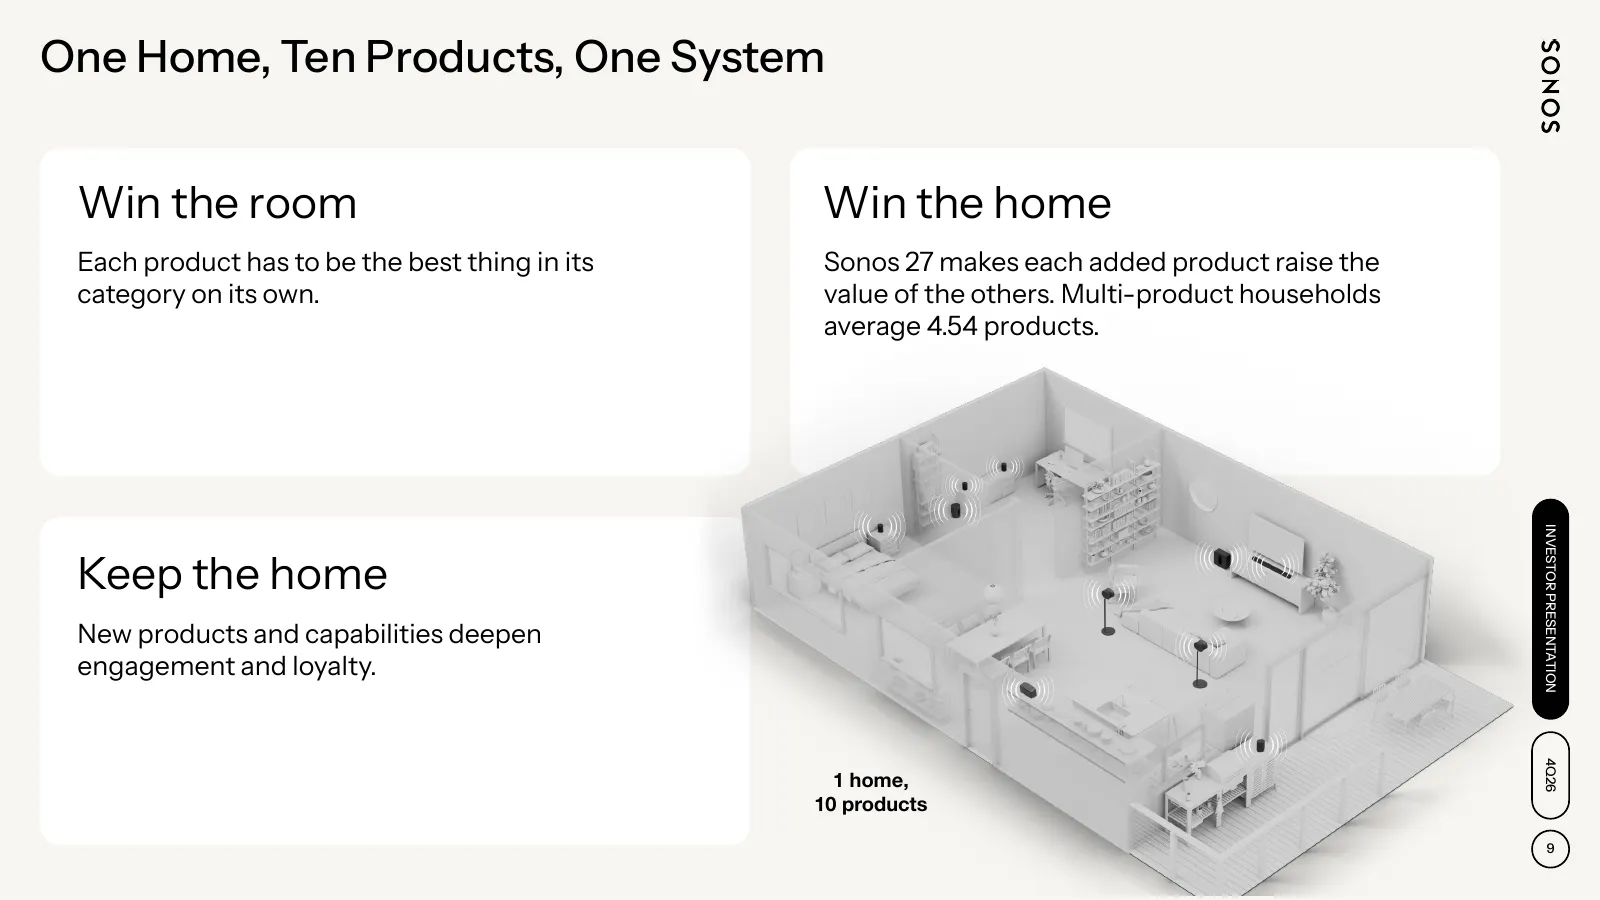
Slide 9: One Home, Ten Products, One System
One Home, Ten Products, One System Win the room Win the home Each product has to be the best thing in its Sonos 27 makes each added product raise the category on its own. value of the others. Multi-product households average 4.54 products. INVESTOR PRESENTATION Keep the home New products and capabil
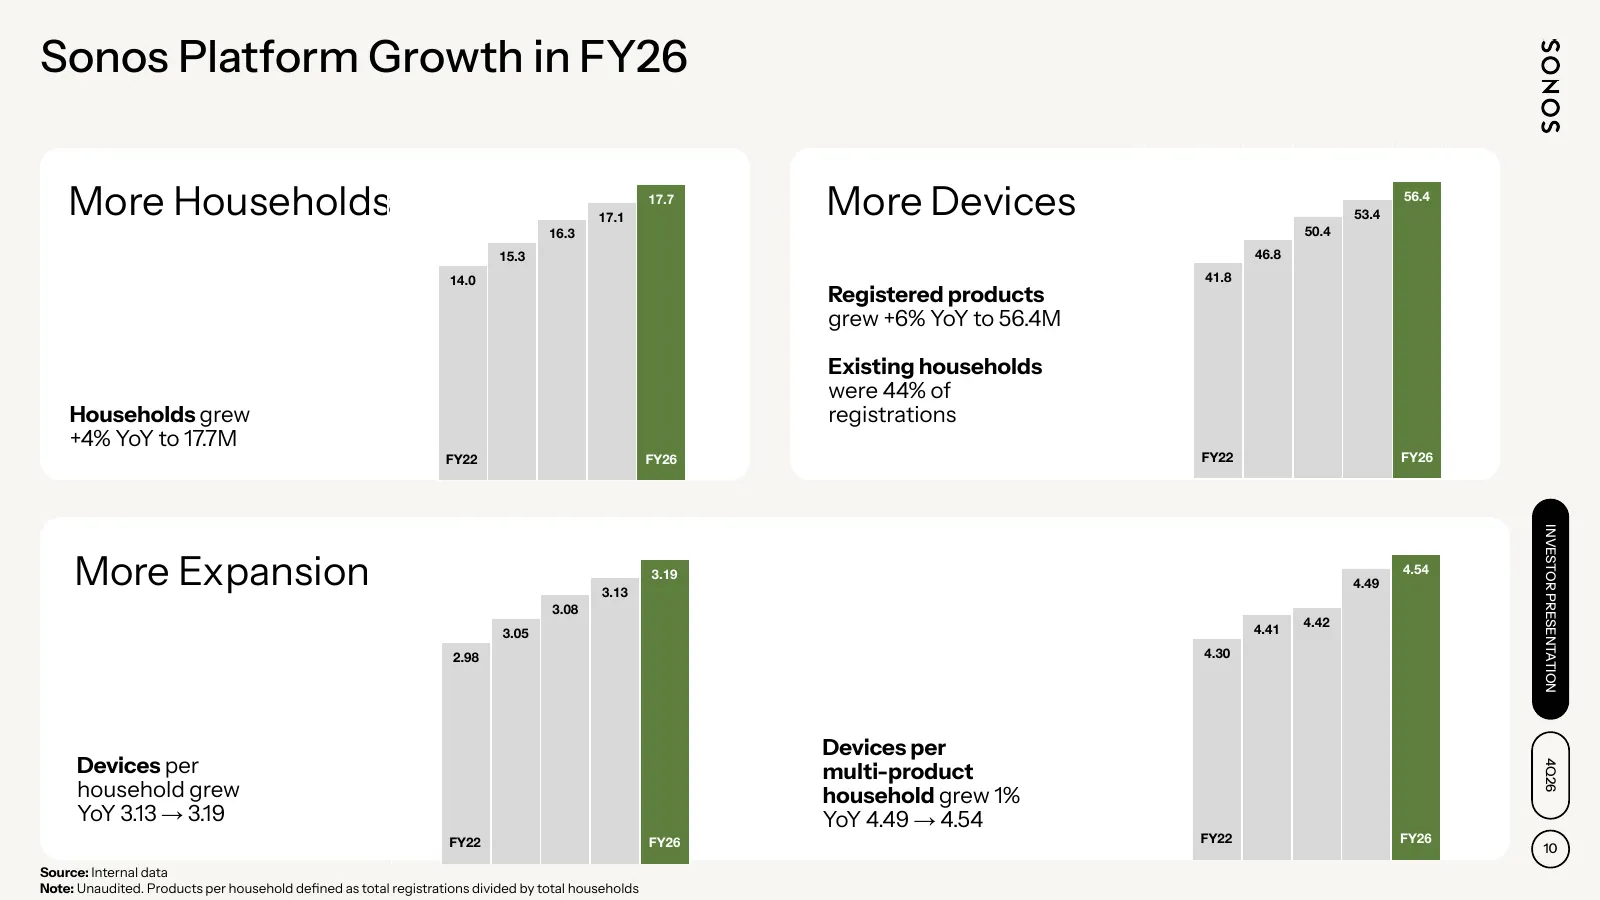
Slide 10: Sonos Platform Growth in FY26
Sonos Platform Growth in FY26 More Households 17.1 17.7 More Devices 53.4 56.4 16.3 50.4 15.3 46.8 14.0 41.8 Registered products grew +6% YoY to 56.4M Existing households were 44% of Households grew registrations +4% YoY to 17.7M FY22 FY26 FY22 FY26 INVESTOR PRESENTATION More Expansion 3.13 3.19 4.4
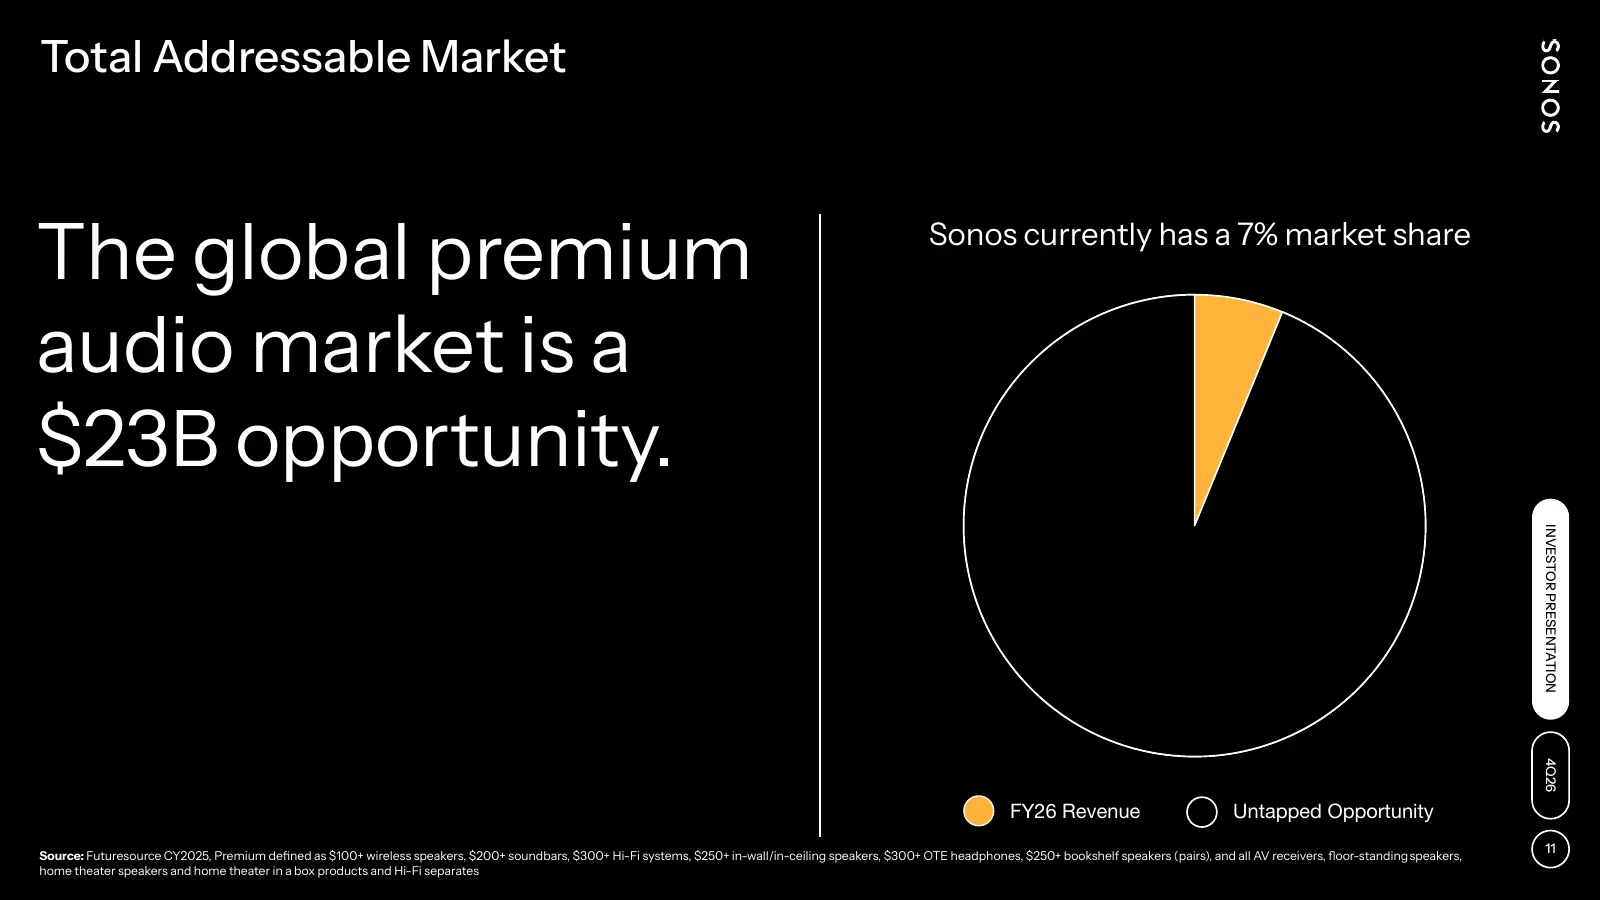
Slide 11: The global premium audio market is a $23B opportunity
Total Addressable Market The global premium Sonos currently has a 7% market share audio market is a $23B opportunity. INVESTOR PRESENTATION 4Q26 FY26 Revenue Untapped Opportunity 11 Source: Futuresource CY2025, Premium defined as $100+ wireless speakers, $200+ soundbars, $300+ Hi-Fi systems, $250+ i
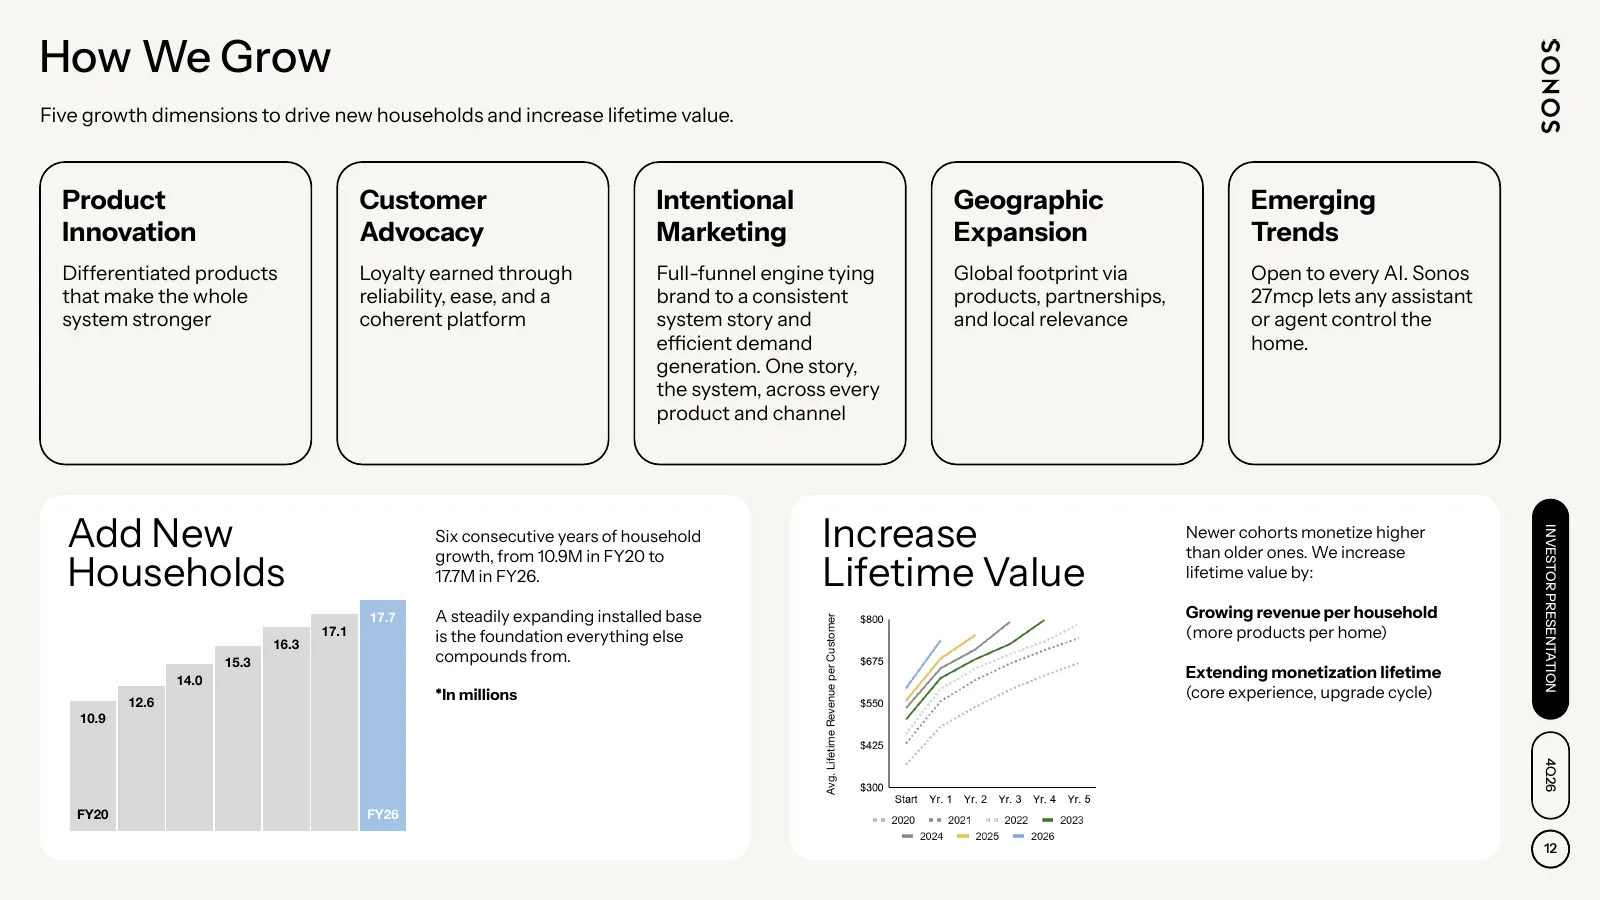
Slide 12: How We Grow
How We Grow Five growth dimensions to drive new households and increase lifetime value. Product Customer Intentional Geographic Emerging Innovation Advocacy Marketing Expansion Trends Differentiated products Loyalty earned through Full-funnel engine tying Global footprint via Open to every AI. Sonos
Slide 13: Large Opportunity Within Existing Households
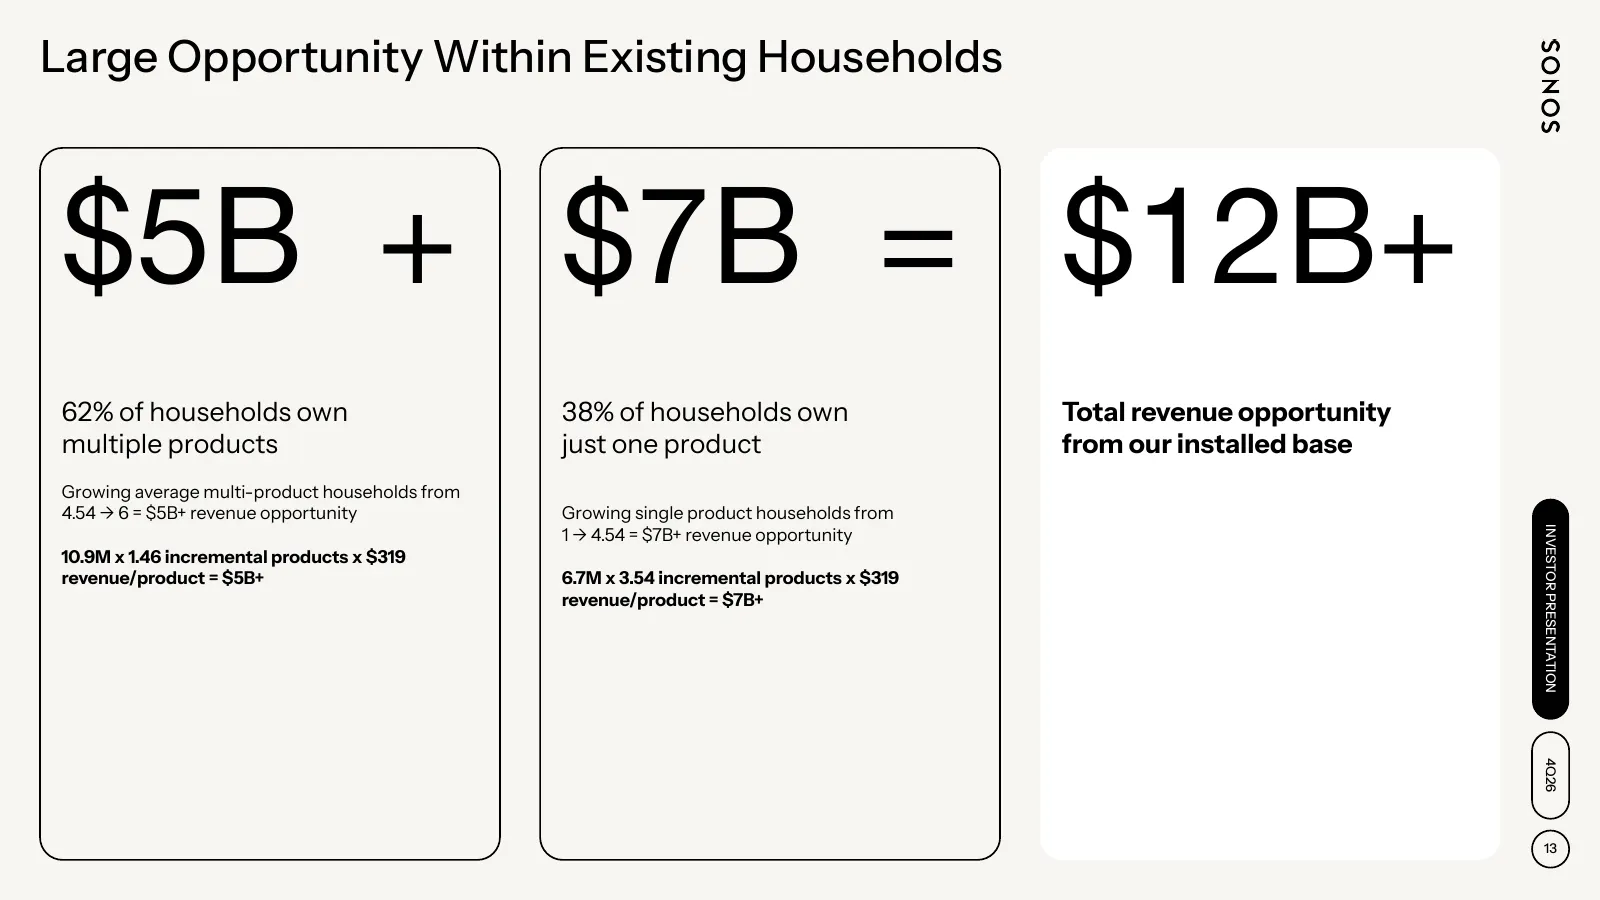
Large Opportunity Within Existing Households $5B + $7B = $12B+ 62% of households own 38% of households own Total revenue opportunity multiple products just one product from our installed base Growing average multi-product households from 4.54 → 6 = $5B+ revenue opportunity Growing single product hou
Slide 14: Global Presence
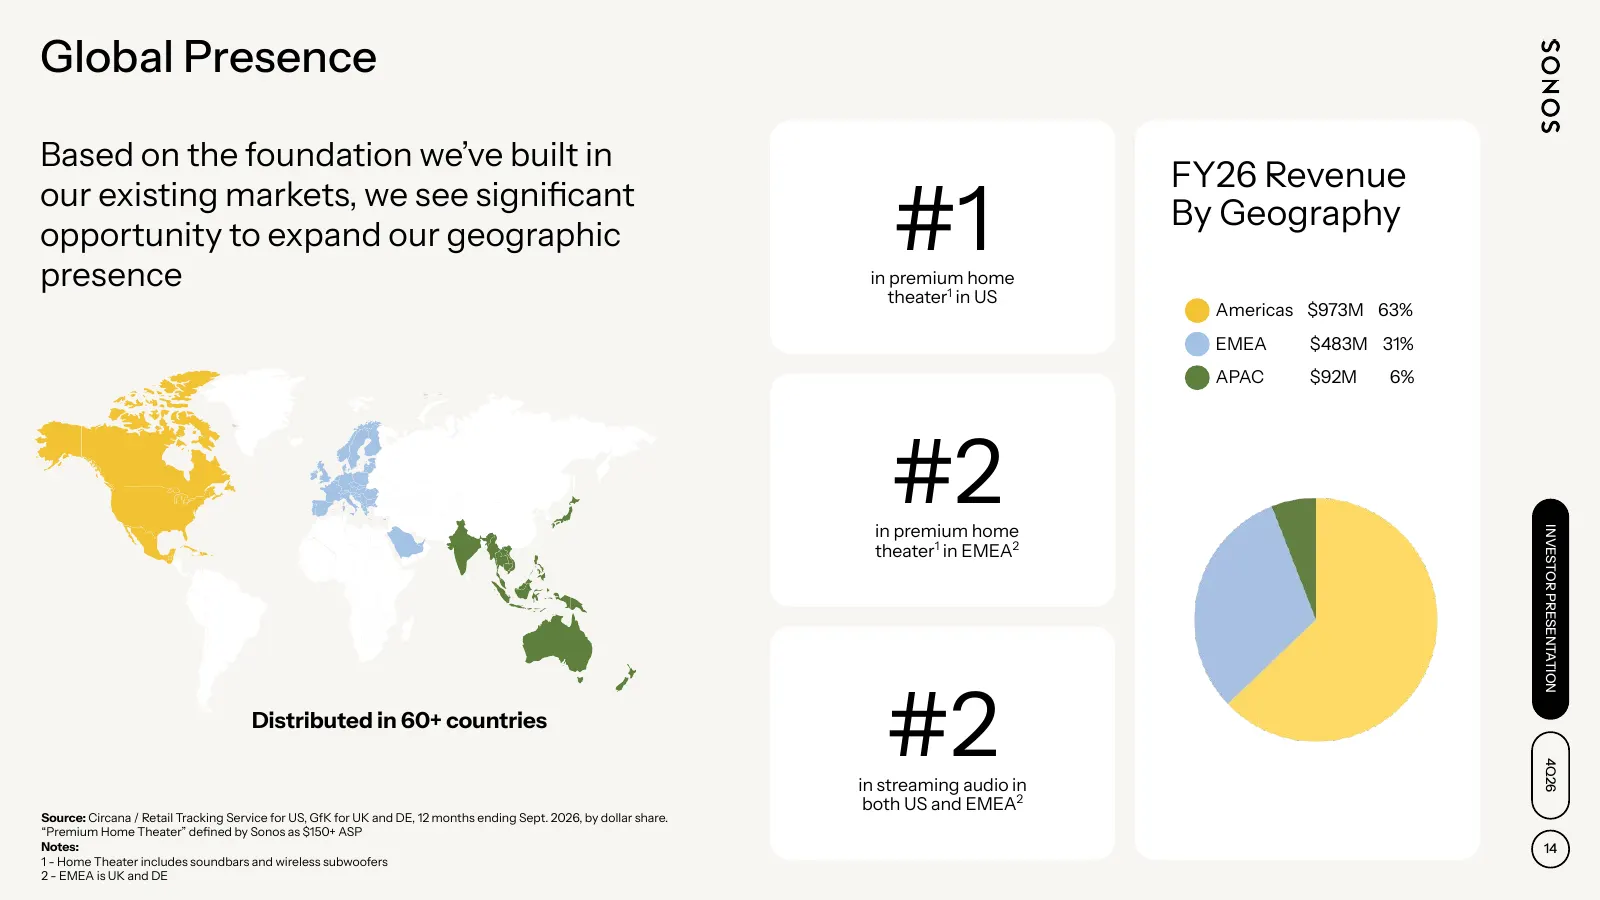
Global Presence Based on the foundation we’ve built in FY26 Revenue our existing markets, we see significant opportunity to expand our geographic presence #1 in premium home By Geography theater1 in US Americas $973M 63% EMEA $483M 31% APAC $92M 6% #2 in premium home INVESTOR PRESENTATION theater1 i
Slide 15: Broad and Valuable IP Portfolio
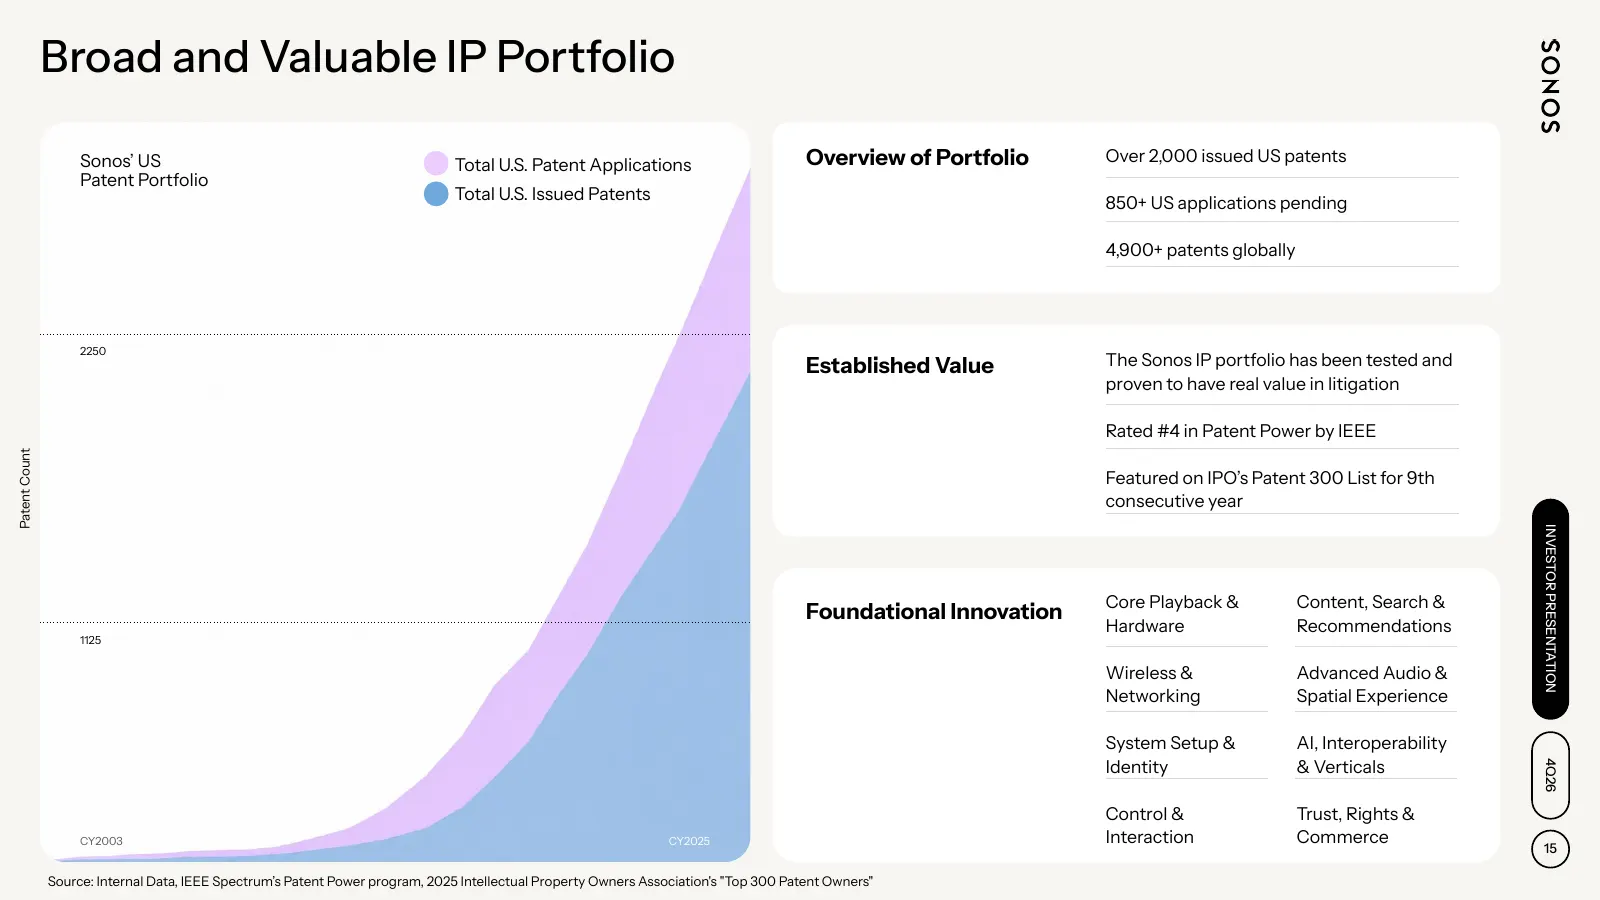
Broad and Valuable IP Portfolio Sonos’ US Total U.S. Patent Applications Overview of Portfolio Over 2,000 issued US patents Patent Portfolio Total U.S. Issued Patents 850+ US applications pending 4,900+ patents globally 2250 Established Value The Sonos IP portfolio has been tested and proven to have
Slide 16: Sonos Fiscal 2026 Results
FISCALPRESENTATION INVESTOR 2026 RESULTS 4Q26 16 Results Sonos Fiscal 2026
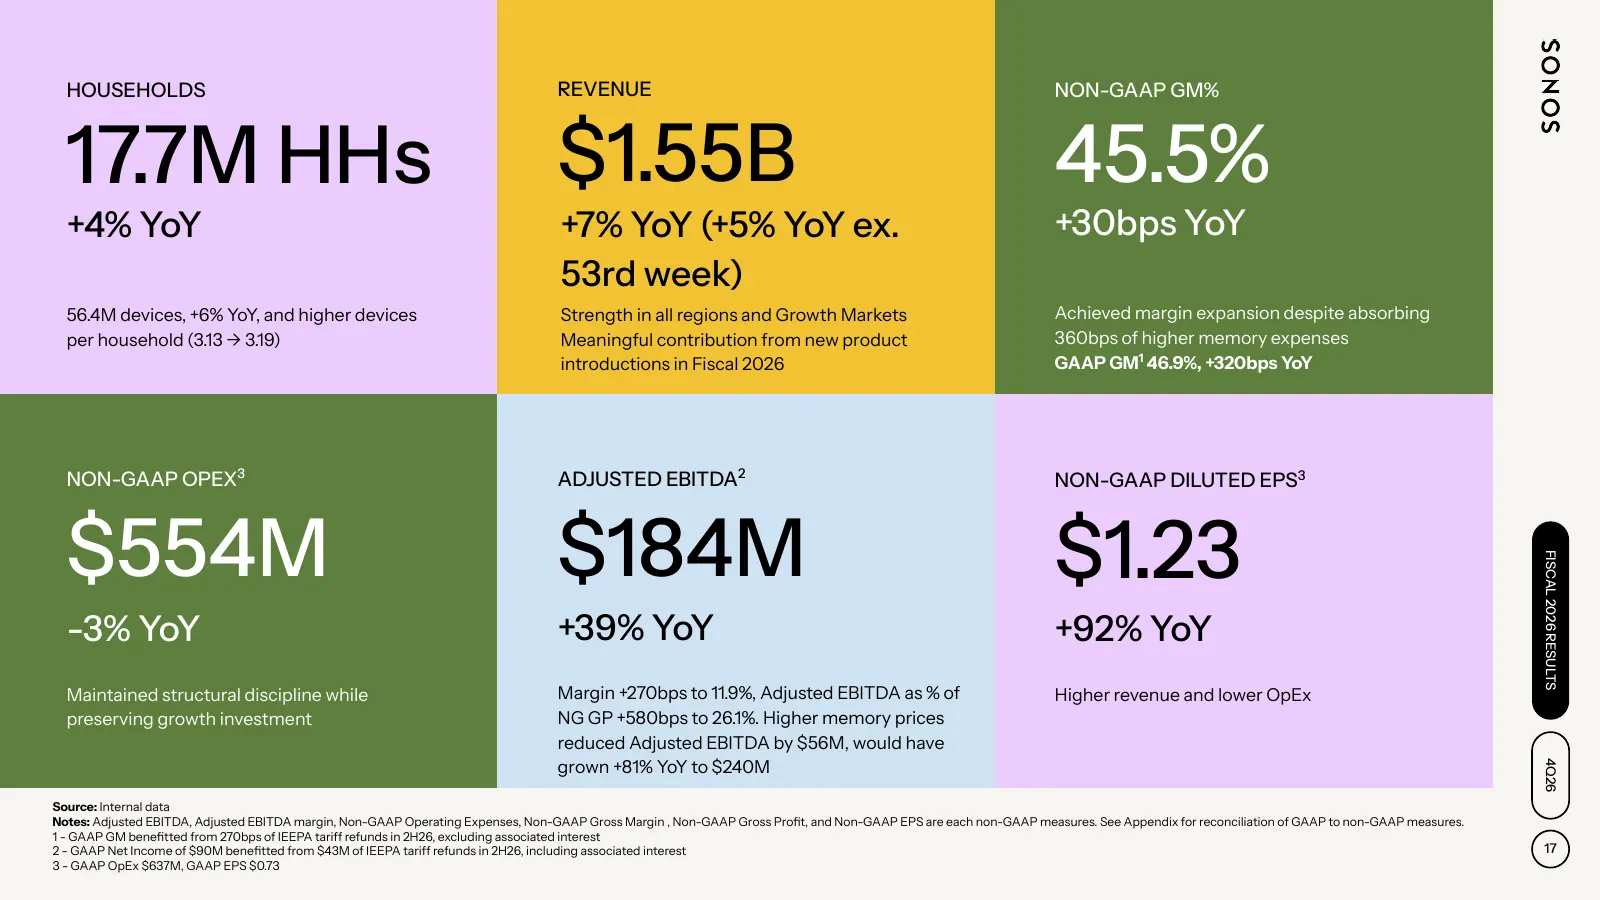
Slide 17: Fiscal 2026 Results Highlights
HOUSEHOLDS REVENUE NON-GAAP GM% 17.7M HHs $1.55B 45.5% +4% YoY +7% YoY (+5% YoY ex. +30bps YoY 53rd week) 56.4M devices, +6% YoY, and higher devices Strength in all regions and Growth Markets Achieved margin expansion despite absorbing per household (3.13 → 3.19) Meaningful contribution from new pro
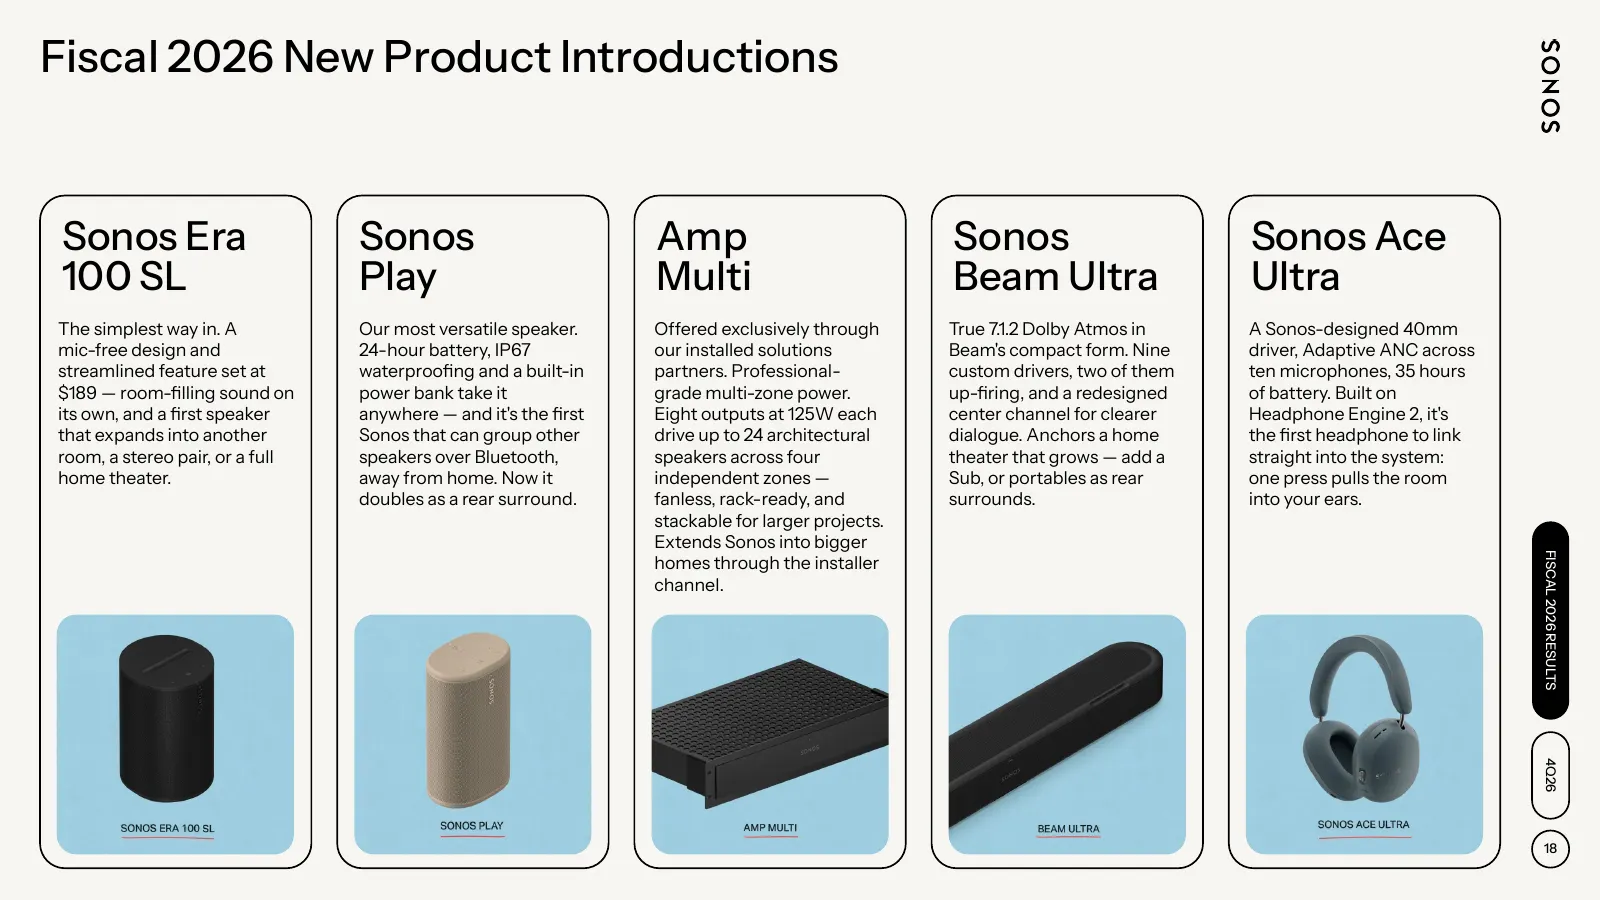
Slide 18: Fiscal 2026 New Product Introductions
Fiscal 2026 New Product Introductions Sonos Era Sonos Amp Sonos Sonos Ace 100 SL Play Multi Beam Ultra Ultra The simplest way in. A Our most versatile speaker. Offered exclusively through True 7.1.2 Dolby Atmos in A Sonos-designed 40mm mic-free design and 24-hour battery, IP67 our installed solution
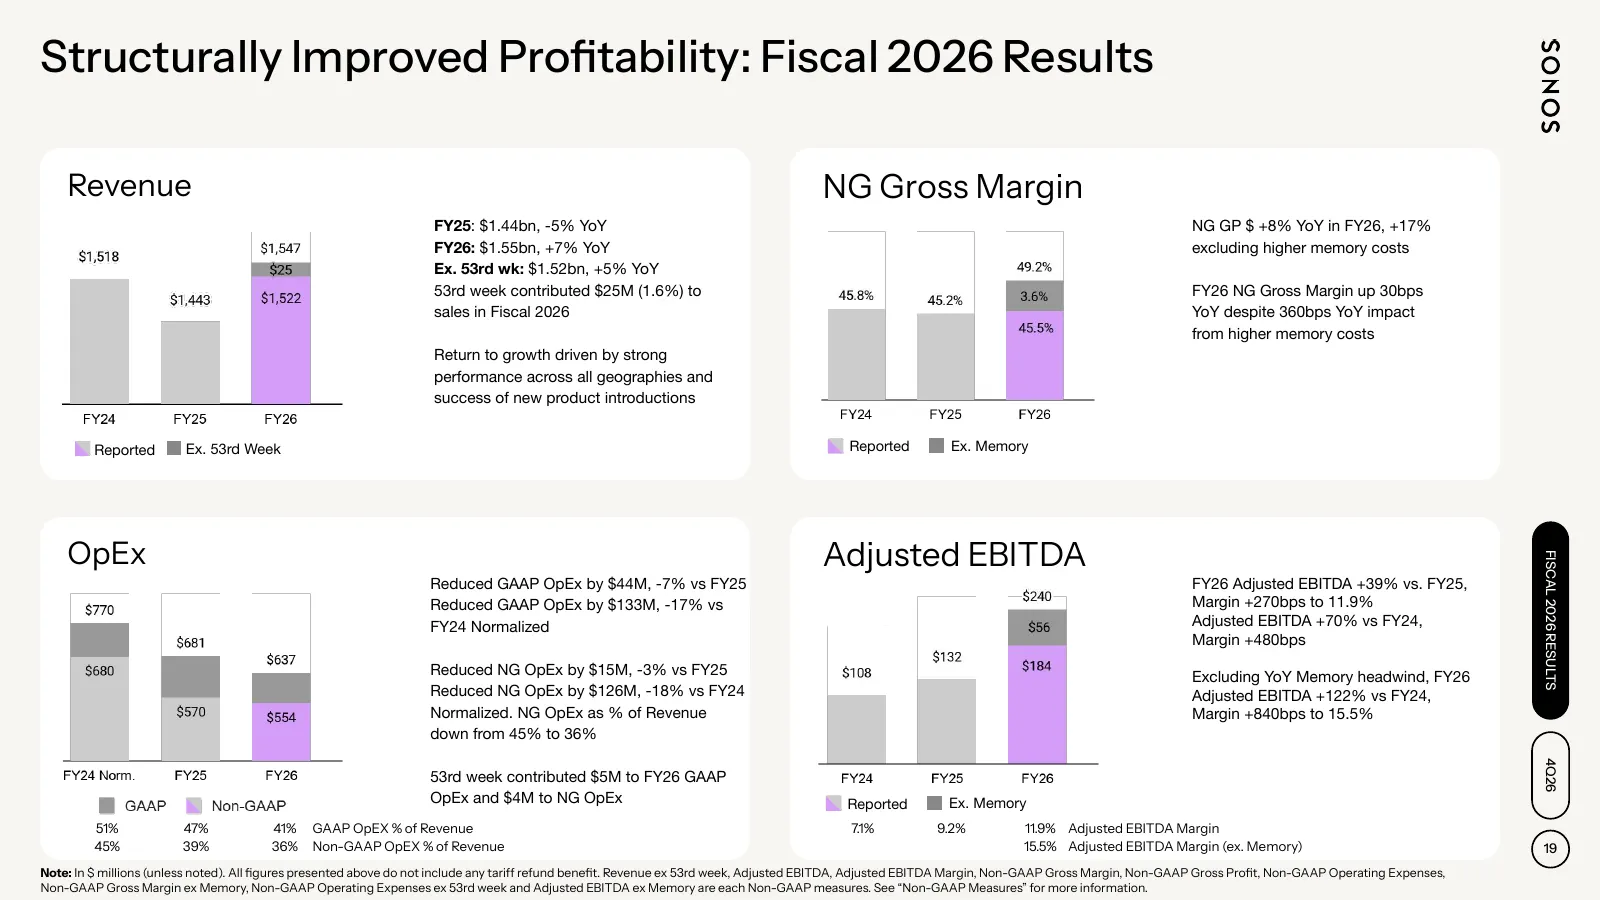
Slide 19: Structurally Improved Profitability: Fiscal 2026 Results
Structurally Improved Profitability: Fiscal 2026 Results Revenue NG Gross Margin FY25: $1.44bn, -5% YoY NG GP $ +8% YoY in FY26, +17% FY26: $1.55bn, +7% YoY excluding higher memory costs Ex. 53rd wk: $1.52bn, +5% YoY 53rd week contributed $25M (1.6%) to FY26 NG Gross Margin up 30bps sales in Fiscal
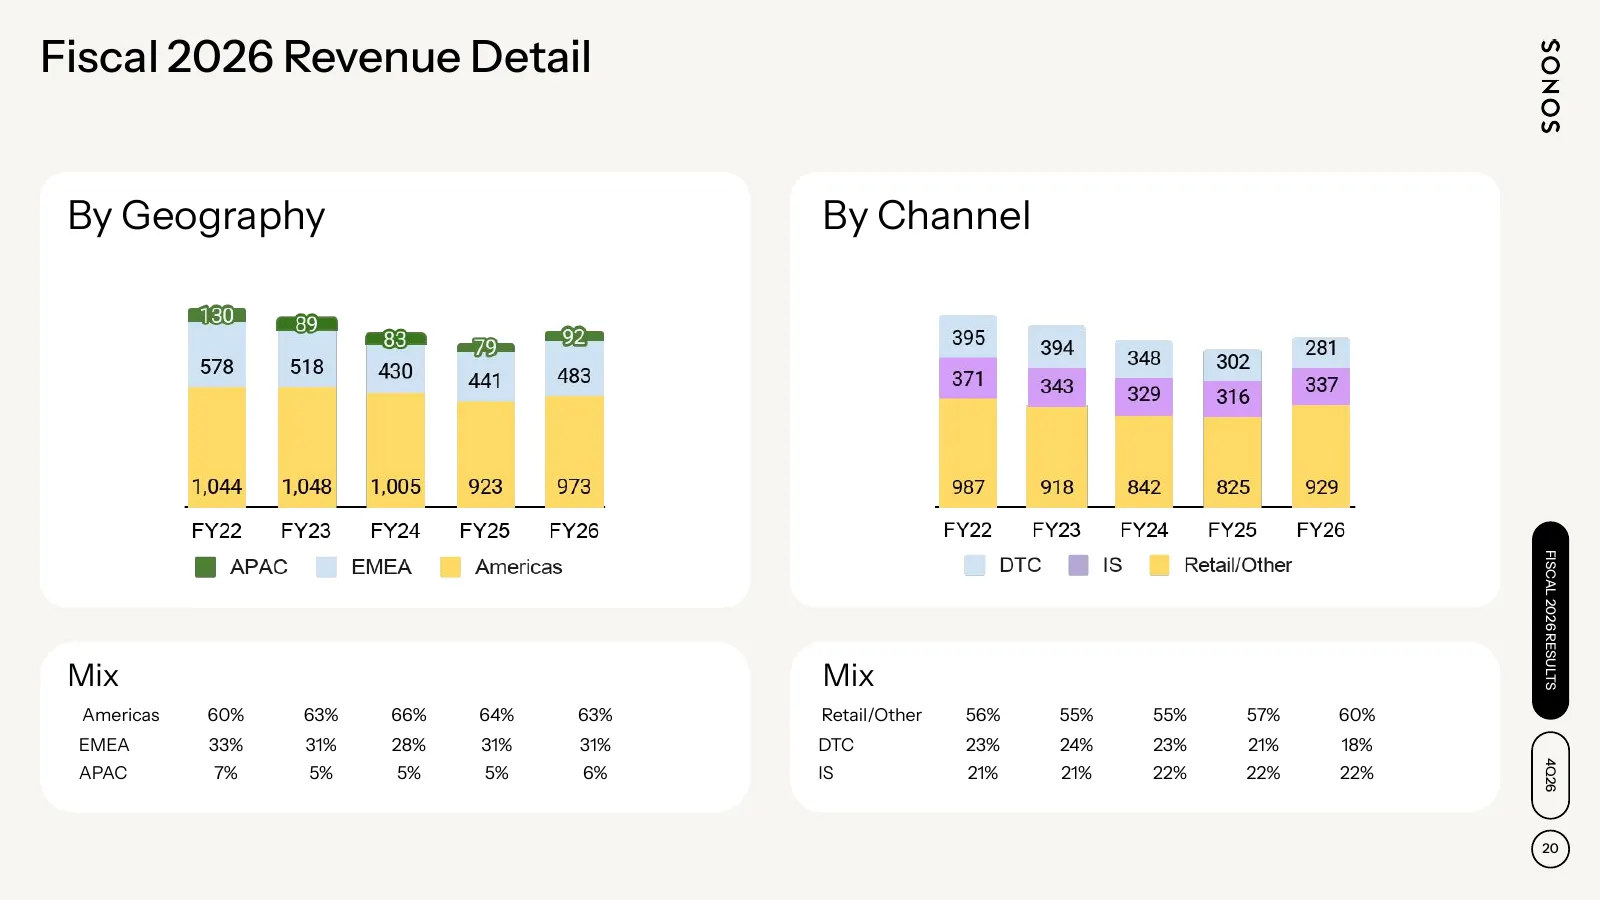
Slide 20: Fiscal 2026 Revenue Detail
Fiscal 2026 Revenue Detail By Geography By Channel FISCAL 2026 RESULTS Mix Mix Americas 60% 63% 66% 64% 63% Retail/Other 56% 55% 55% 57% 60% EMEA 33% 31% 28% 31% 31% DTC 23% 24% 23% 21% 18% 4Q26 APAC 7% 5% 5% 5% 6% IS 21% 21% 22% 22% 22% 20
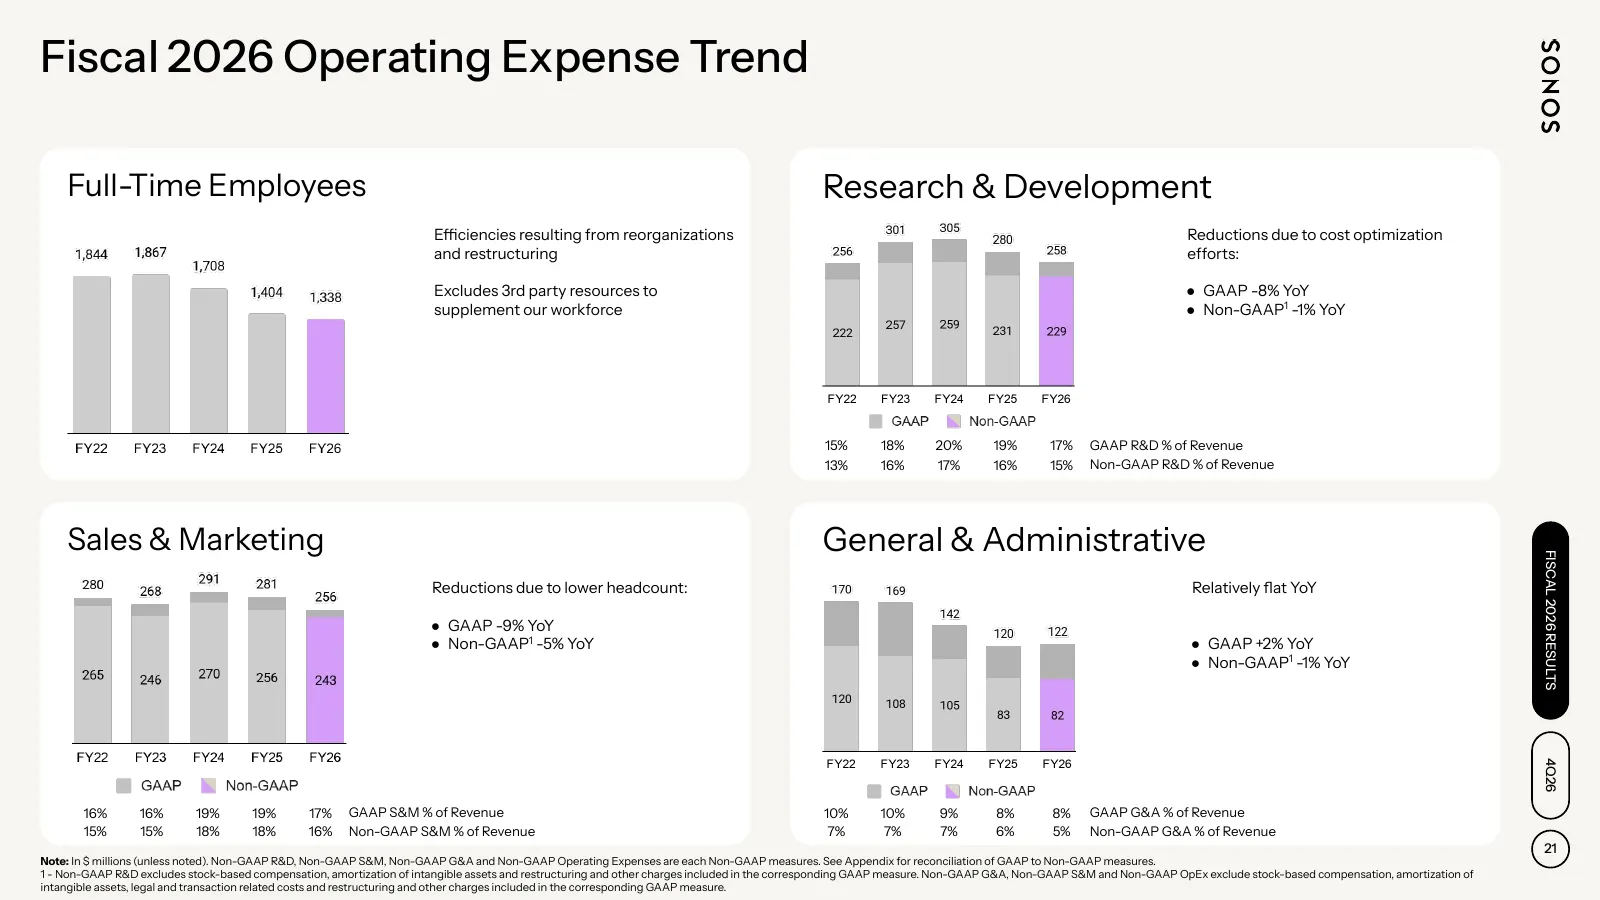
Slide 21: Fiscal 2026 Operating Expense Trend
Fiscal 2026 Operating Expense Trend Full-Time Employees Research & Development Efficiencies resulting from reorganizations Reductions due to cost optimization and restructuring efforts: Excludes 3rd party resources to ● GAAP -8% YoY supplement our workforce ● Non-GAAP1 -1% YoY 15% 18% 20% 19% 17% GA
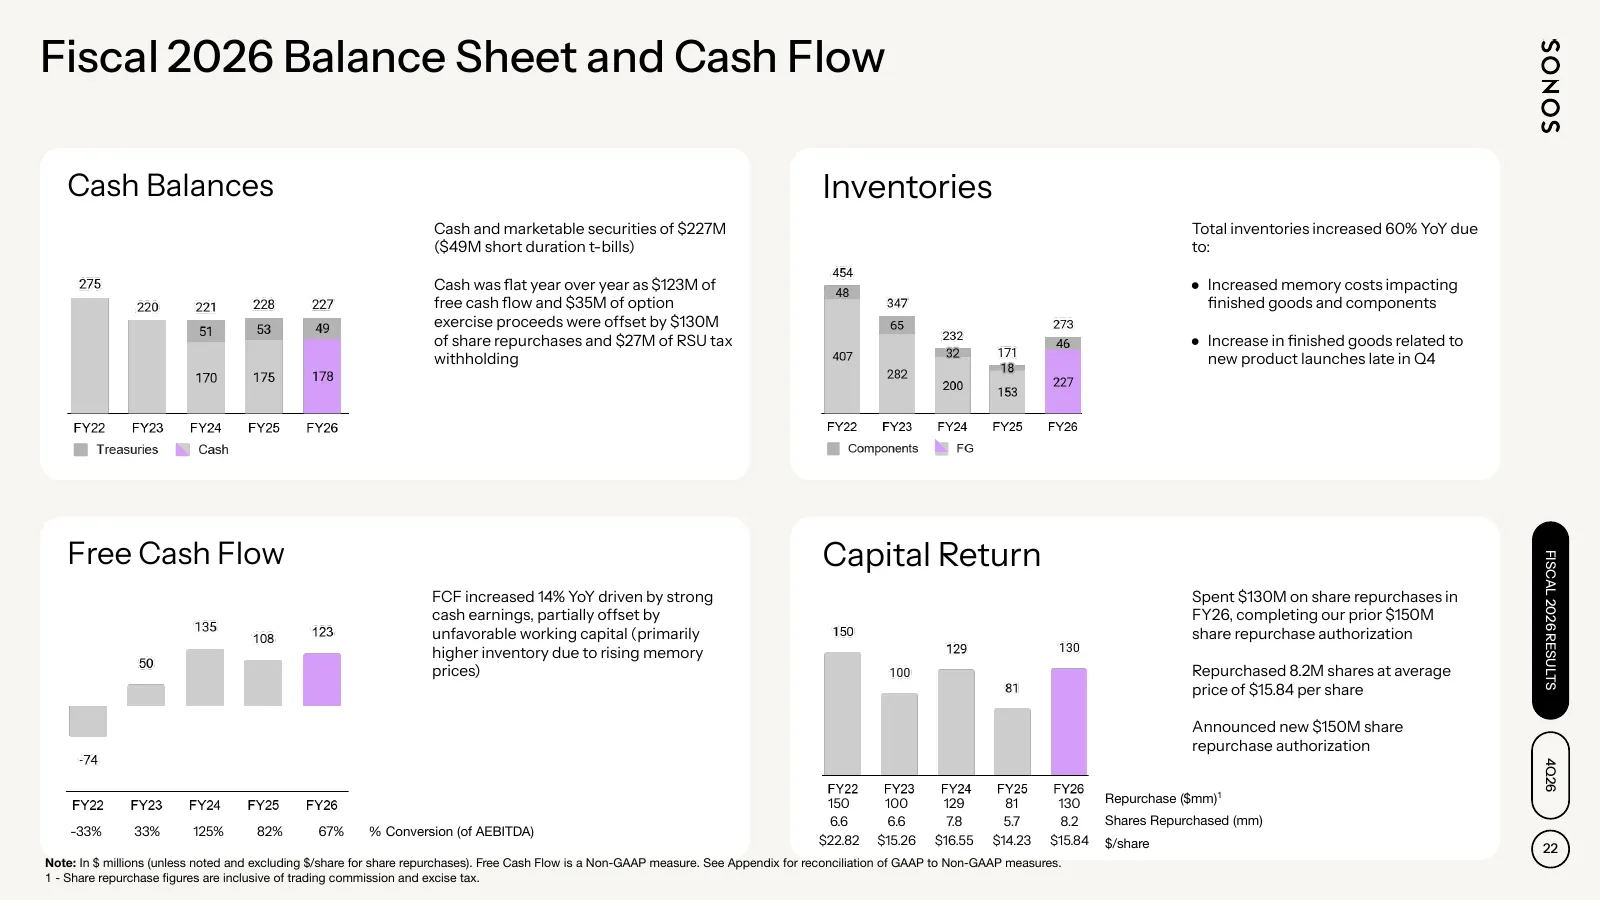
Slide 22: Fiscal 2026 Balance Sheet and Cash Flow
Fiscal 2026 Balance Sheet and Cash Flow Cash Balances Inventories Cash and marketable securities of $227M Total inventories increased 60% YoY due ($49M short duration t-bills) to: Cash was flat year over year as $123M of ● Increased memory costs impacting free cash flow and $35M of option finished g
Slide 23: Sonos Fourth Quarter Fiscal 2026 Results
QUARTERLY INVESTOR RESULTS PRESENTATION 4Q26 23 Quarter Results Fourth Sonos 2026
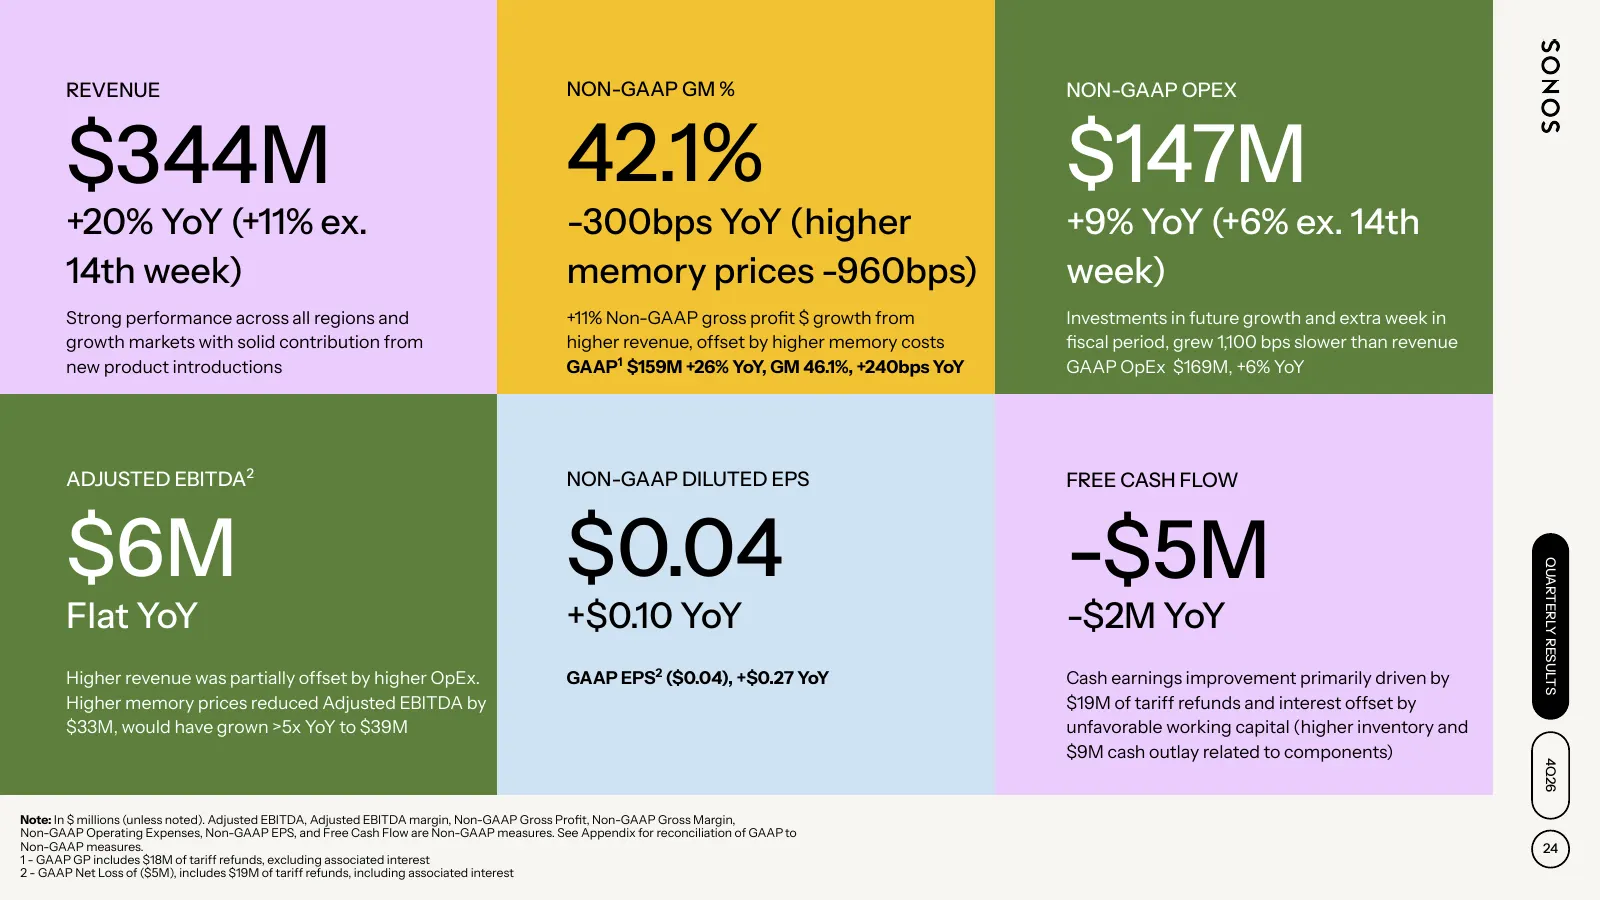
Slide 24: Fourth Quarter Results Highlights
REVENUE NON-GAAP GM % NON-GAAP OPEX $344M 42.1% $147M +20% YoY (+11% ex. -300bps YoY (higher +9% YoY (+6% ex. 14th 14th week) memory prices -960bps) week) Strong performance across all regions and +11% Non-GAAP gross profit $ growth from Investments in future growth and extra week in growth markets
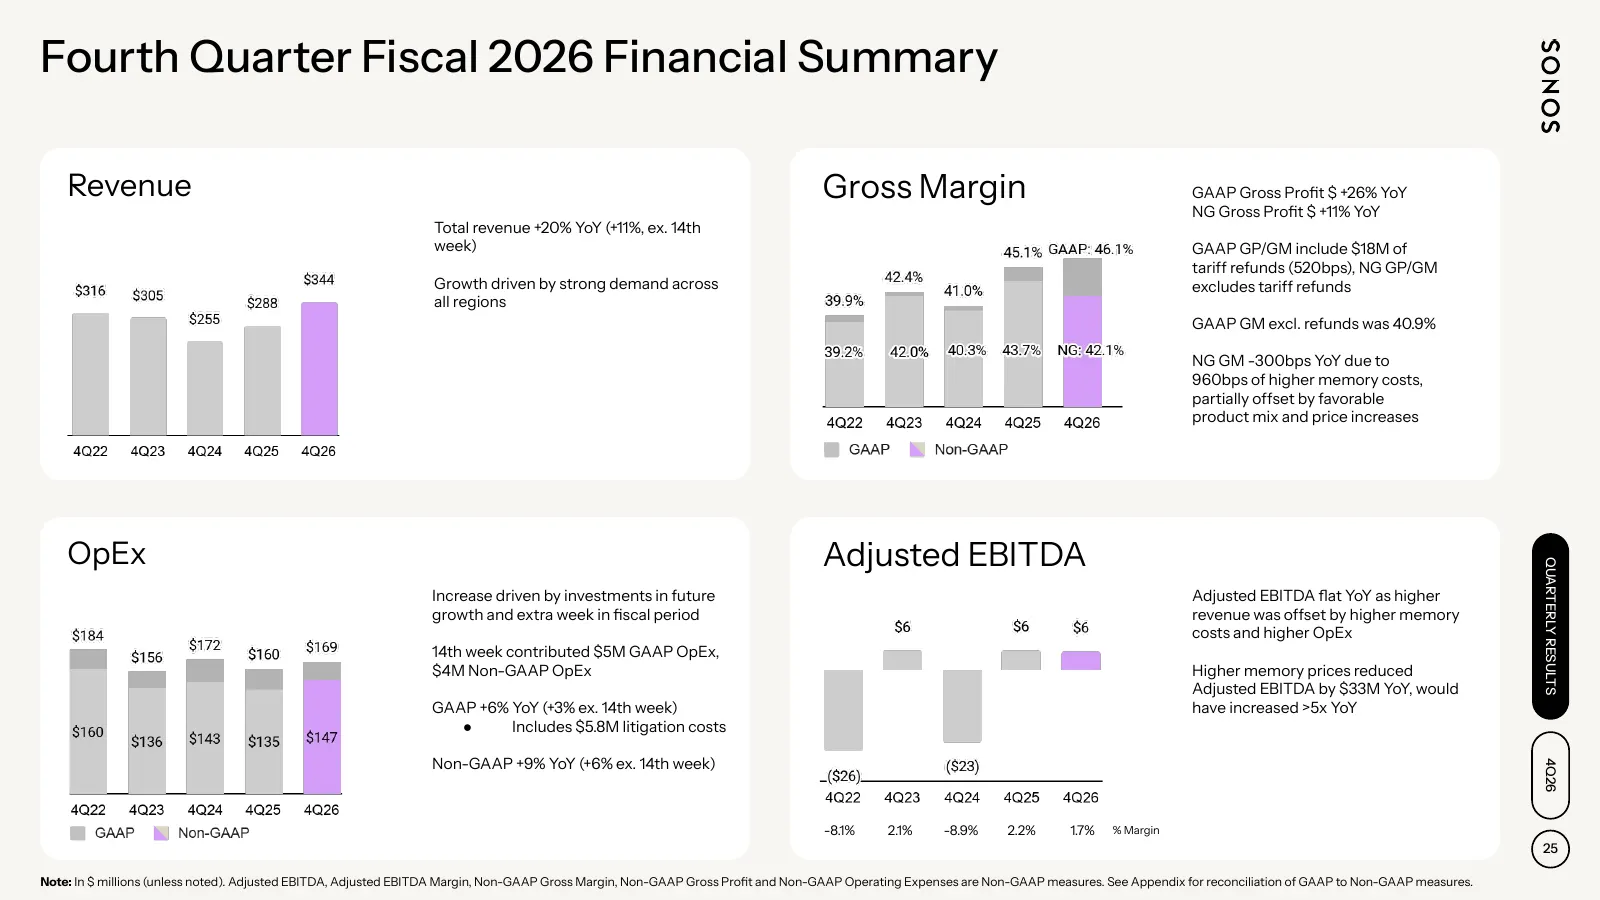
Slide 25: Fourth Quarter Fiscal 2026 Financial Summary
Fourth Quarter Fiscal 2026 Financial Summary Revenue Gross Margin GAAP Gross Profit $ +26% YoY NG Gross Profit $ +11% YoY Total revenue +20% YoY (+11%, ex. 14th week) GAAP GP/GM include $18M of tariff refunds (520bps), NG GP/GM Growth driven by strong demand across excludes tariff refunds all region
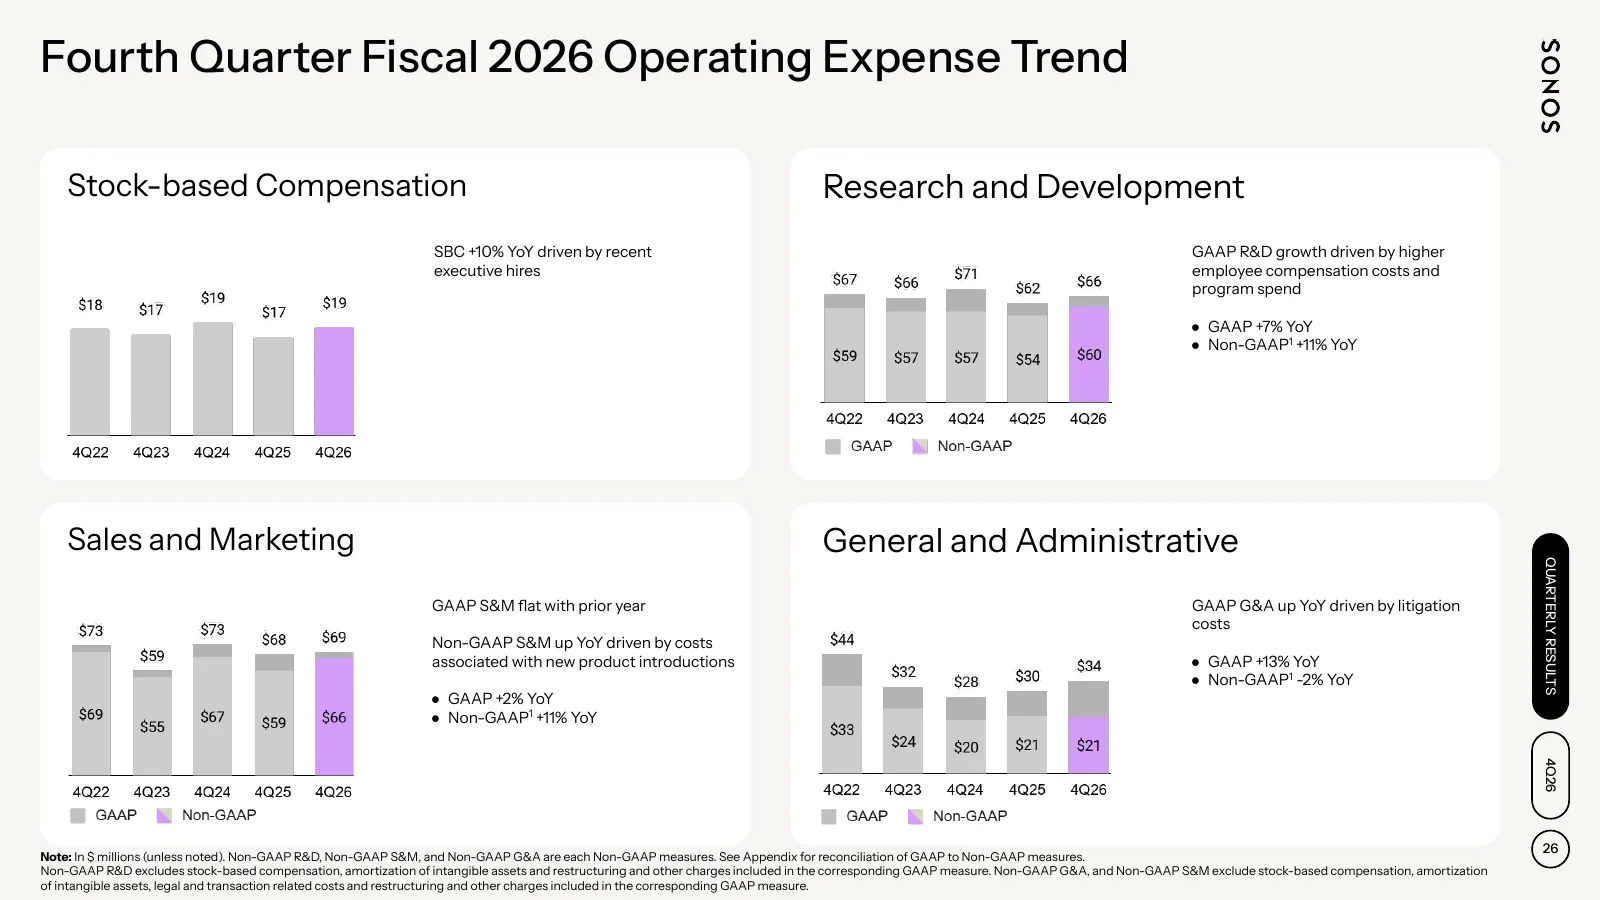
Slide 26: Fourth Quarter Fiscal 2026 Operating Expense Trend
Fourth Quarter Fiscal 2026 Operating Expense Trend Stock-based Compensation Research and Development SBC +10% YoY driven by recent GAAP R&D growth driven by higher executive hires employee compensation costs and program spend ● GAAP +7% YoY ● Non-GAAP1 +11% YoY Sales and Marketing General and Admini
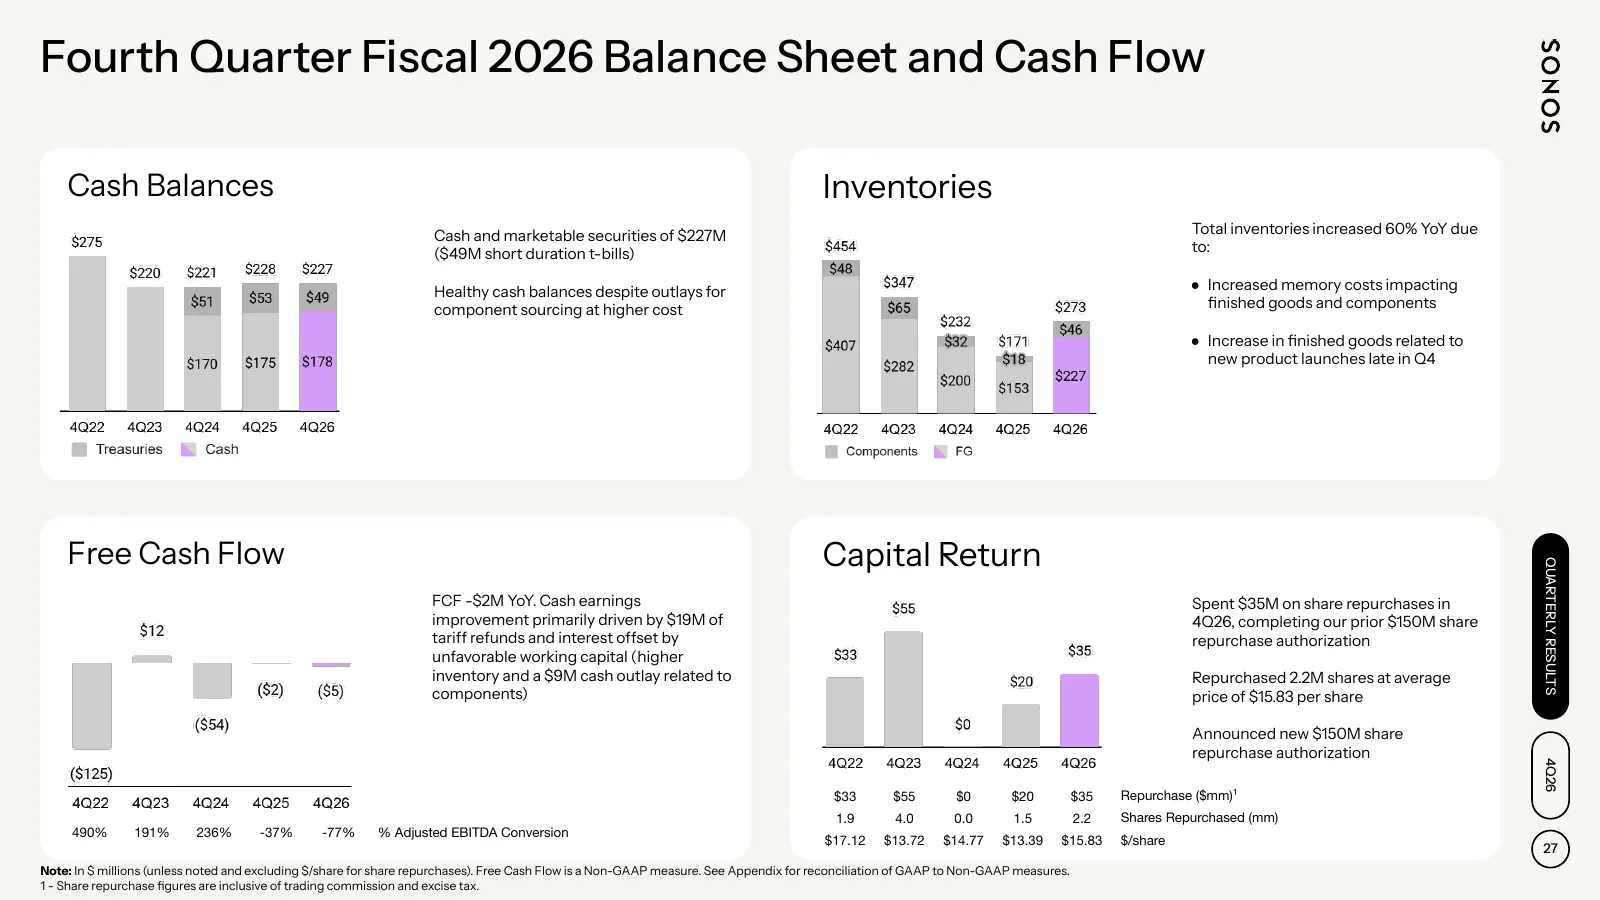
Slide 27: Fourth Quarter Fiscal 2026 Balance Sheet and Cash Flow
Fourth Quarter Fiscal 2026 Balance Sheet and Cash Flow Cash Balances Inventories Cash and marketable securities of $227M Total inventories increased 60% YoY due ($49M short duration t-bills) to: Healthy cash balances despite outlays for ● Increased memory costs impacting component sourcing at higher

Slide 28: Outlook
OUTLOOK INVESTOR PRESENTATION 4Q26 28 Outlook
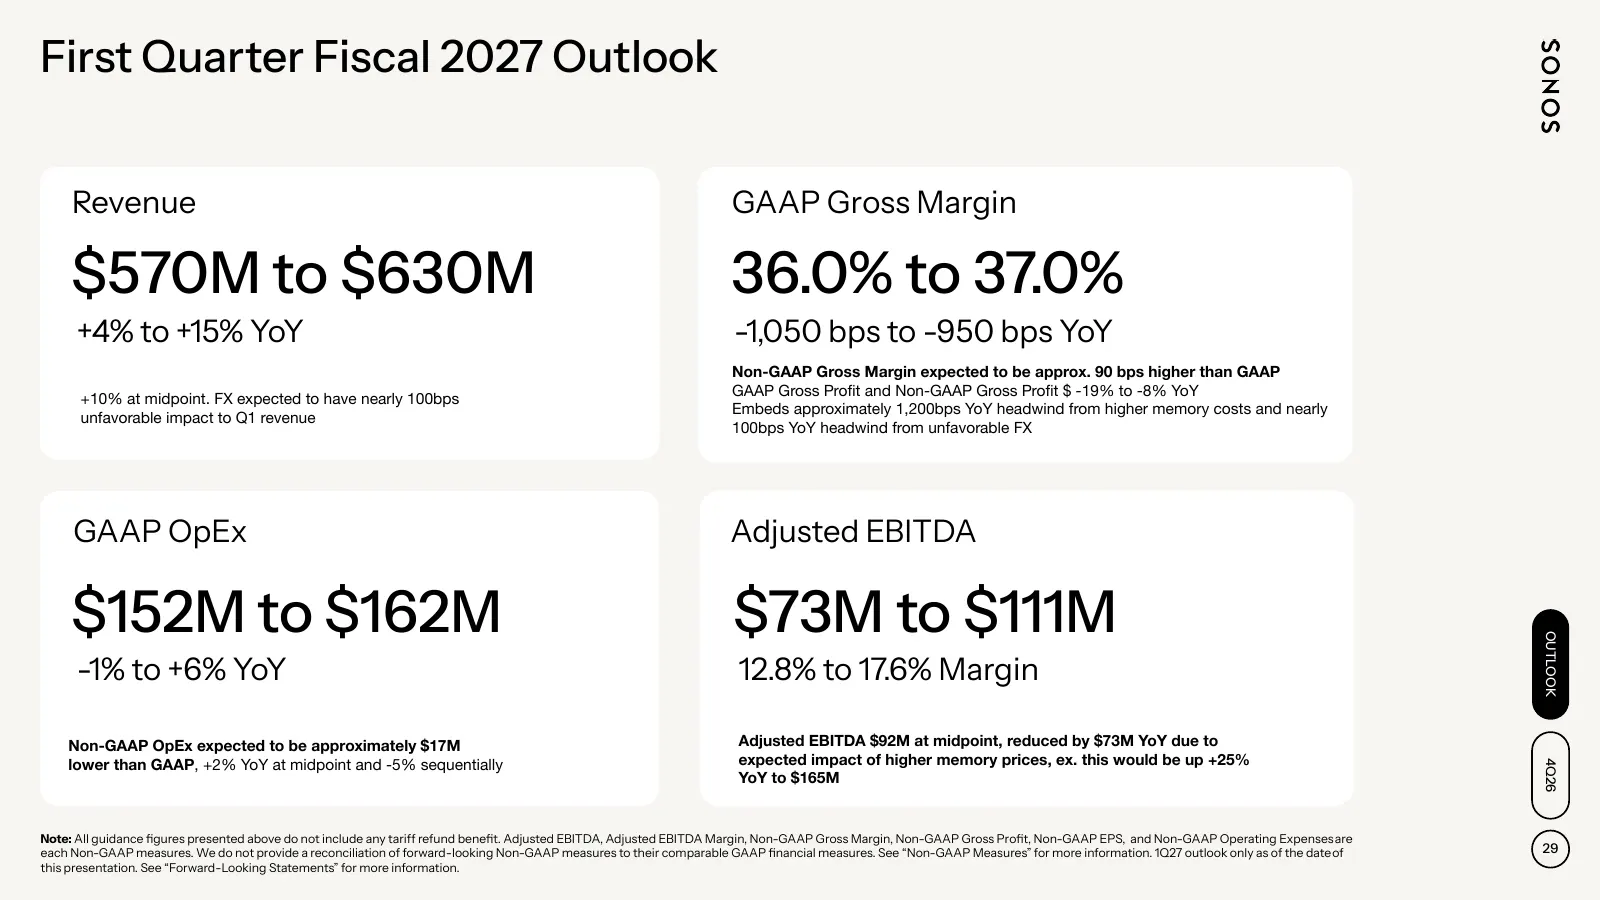
Slide 29: First Quarter Fiscal 2027 Outlook
First Quarter Fiscal 2027 Outlook Revenue GAAP Gross Margin $570M to $630M 36.0% to 37.0% +4% to +15% YoY -1,050 bps to -950 bps YoY Non-GAAP Gross Margin expected to be approx. 90 bps higher than GAAP GAAP Gross Profit and Non-GAAP Gross Profit $ -19% to -8% YoY +10% at midpoint. FX expected to have
Slide 30: Appendix
APPENDIX INVESTOR PRESENTATION 4Q26 30 Appendix
Slide 31: Non-GAAP Measures
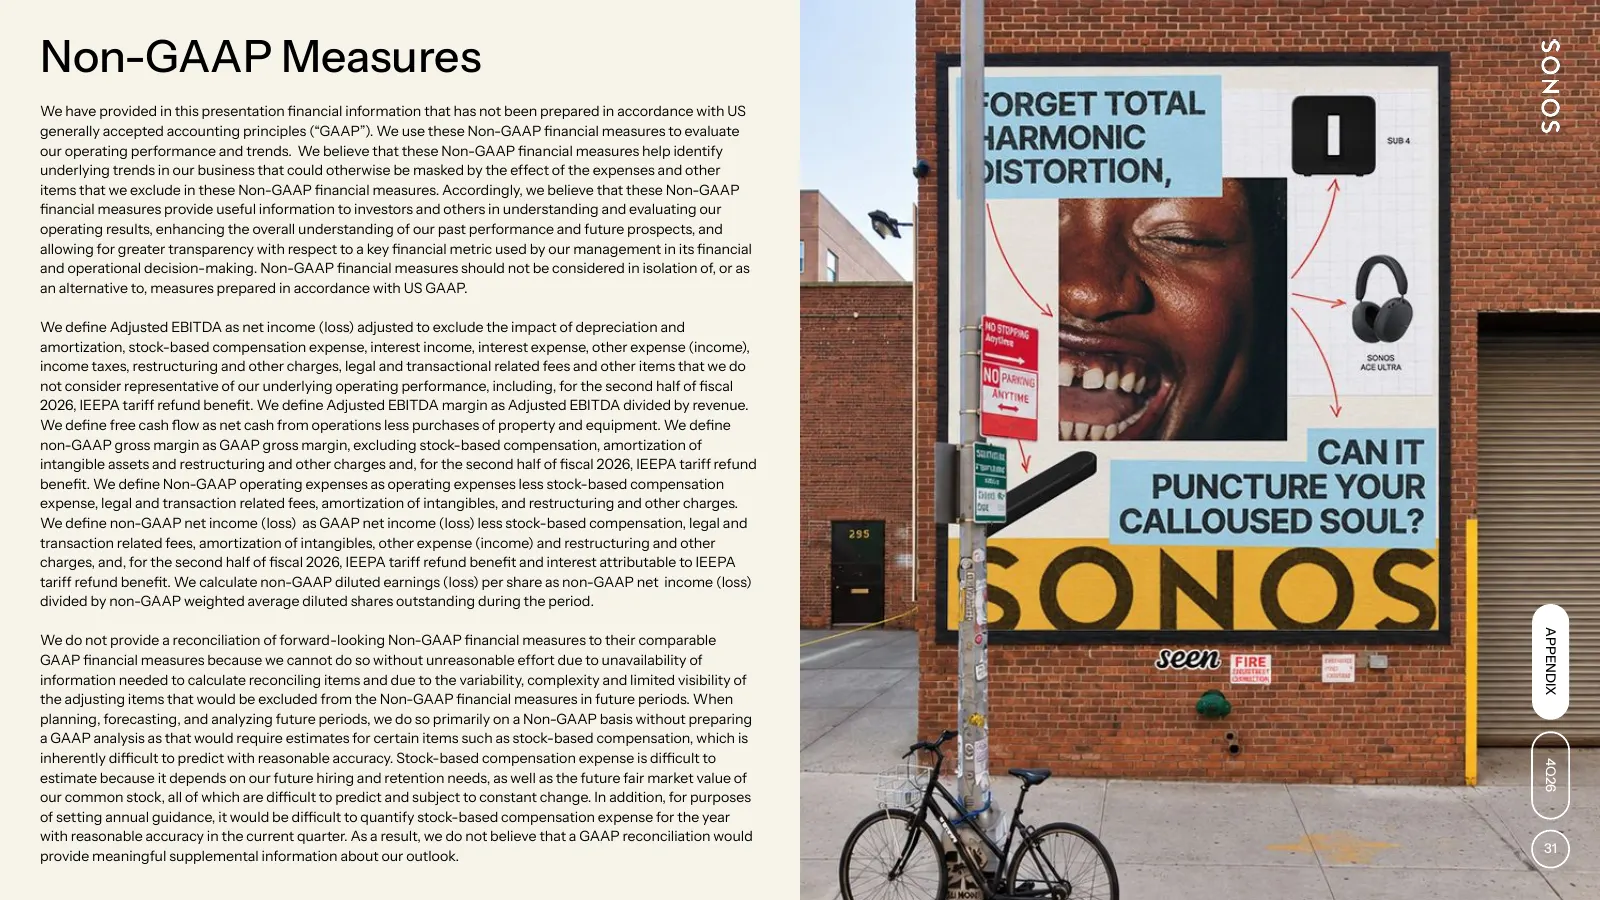
Non-GAAP Measures We have provided in this presentation financial information that has not been prepared in accordance with US generally accepted accounting principles (“GAAP”). We use these Non-GAAP financial measures to evaluate our operating performance and trends. We believe that these Non-GAAP
Slide 32: Reconciliation of GAAP to Non-GAAP Gross Margin
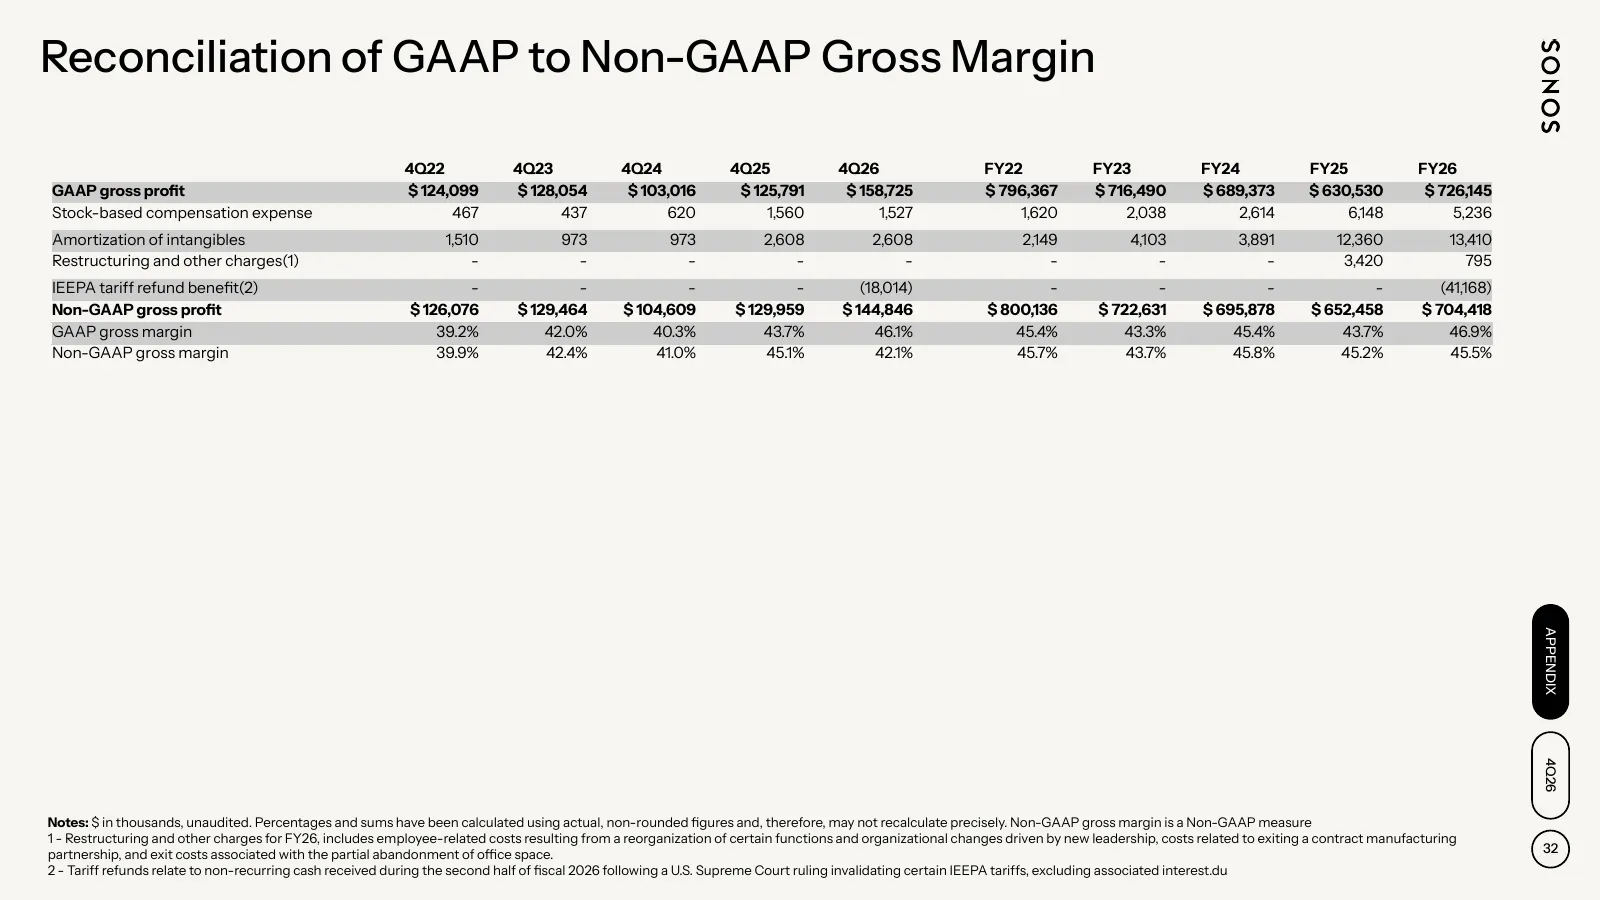
Reconciliation of GAAP to Non-GAAP Gross Margin 4Q22 4Q23 4Q24 4Q25 4Q26 FY22 FY23 FY24 FY25 FY26 GAAP gross profit $ 124,099 $ 128,054 $ 103,016 $ 125,791 $ 158,725 $ 796,367 $ 716,490 $ 689,373 $ 630,530 $ 726,145 Stock-based compensation expense 467 437 620 1,560 1,527 1,620 2,038 2,614 6,148 5,2
Slide 33: Reconciliation of Certain GAAP to Non-GAAP Operating Expenses
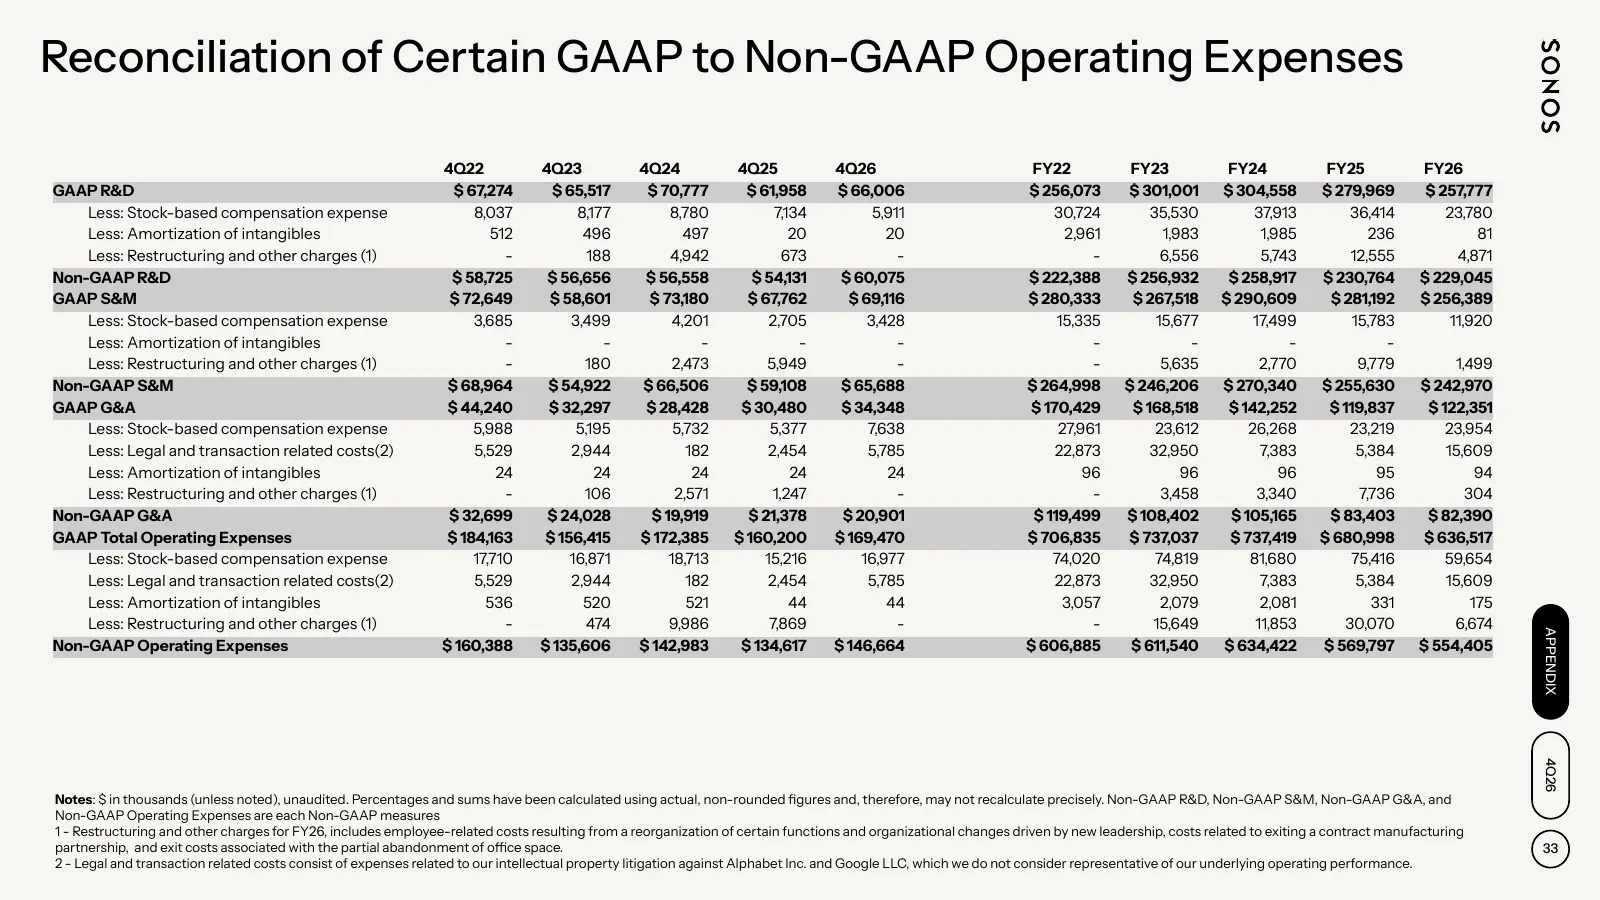
Reconciliation of Certain GAAP to Non-GAAP Operating Expenses 4Q22 4Q23 4Q24 4Q25 4Q26 FY22 FY23 FY24 FY25 FY26 GAAP R&D $ 67,274 $ 65,517 $ 70,777 $ 61,958 $ 66,006 $ 256,073 $ 301,001 $ 304,558 $ 279,969 $ 257,777 Less: Stock-based compensation expense 8,037 8,177 8,780 7,134 5,911 30,724 35,530 3
Slide 34: Reconciliation of Operating (Loss) Income to Adjusted EBITDA
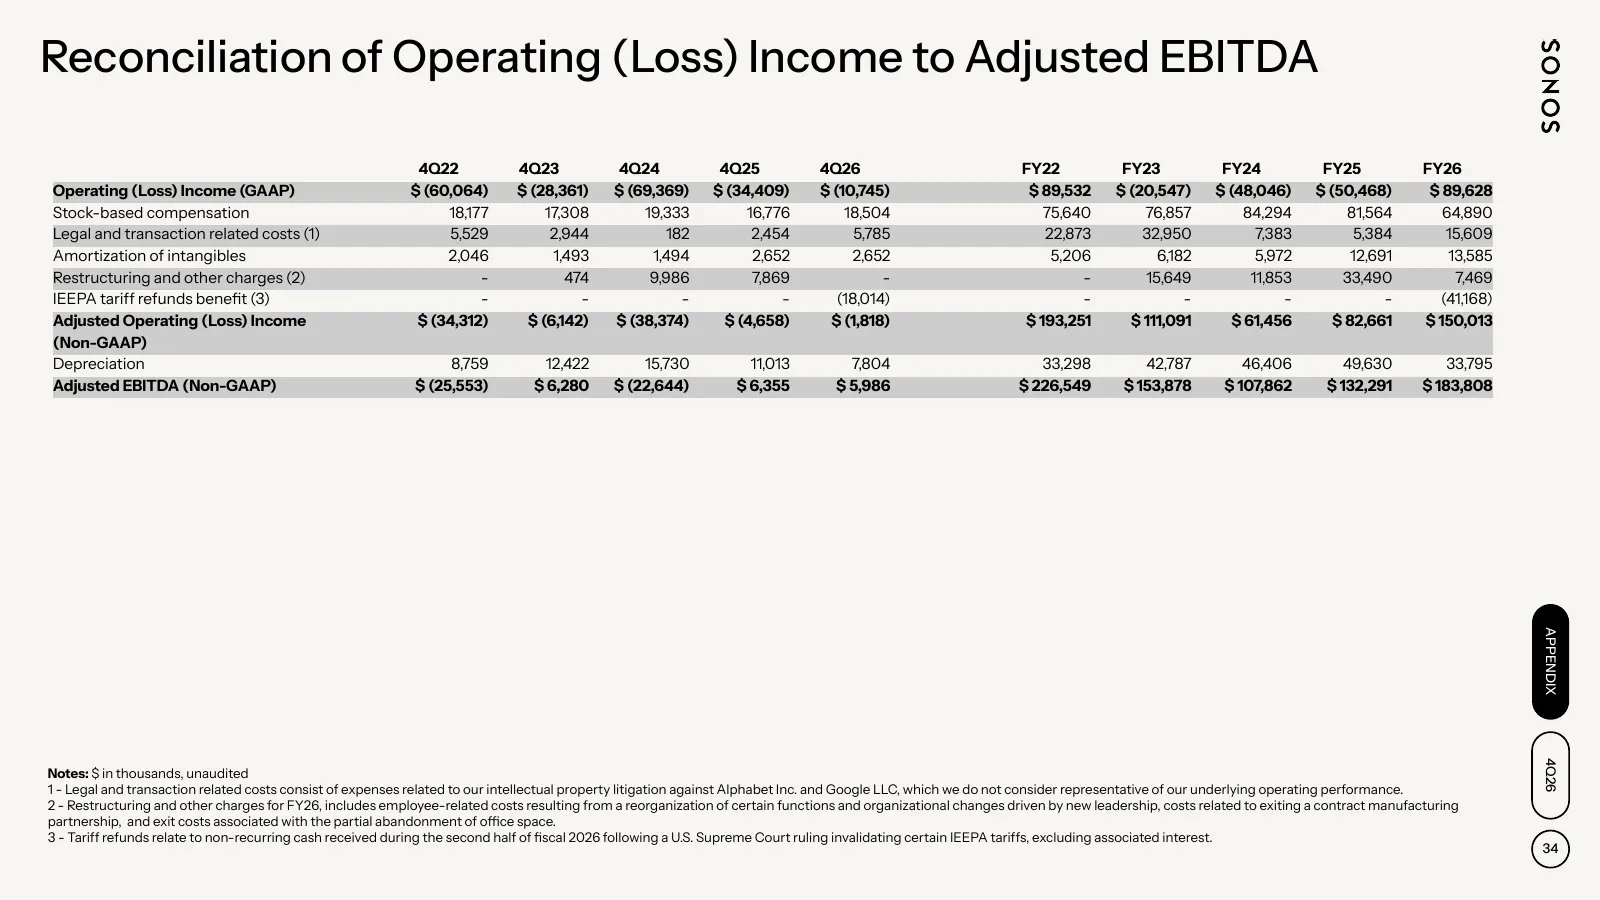
Reconciliation of Operating (Loss) Income to Adjusted EBITDA 4Q22 4Q23 4Q24 4Q25 4Q26 FY22 FY23 FY24 FY25 FY26 Operating (Loss) Income (GAAP) $ (60,064) $ (28,361) $ (69,369) $ (34,409) $ (10,745) $ 89,532 $ (20,547) $ (48,046) $ (50,468) $ 89,628 Stock-based compensation 18,177 17,308 19,333 16,776
Slide 35: Reconciliation of Net (Loss) Income to Adjusted EBITDA
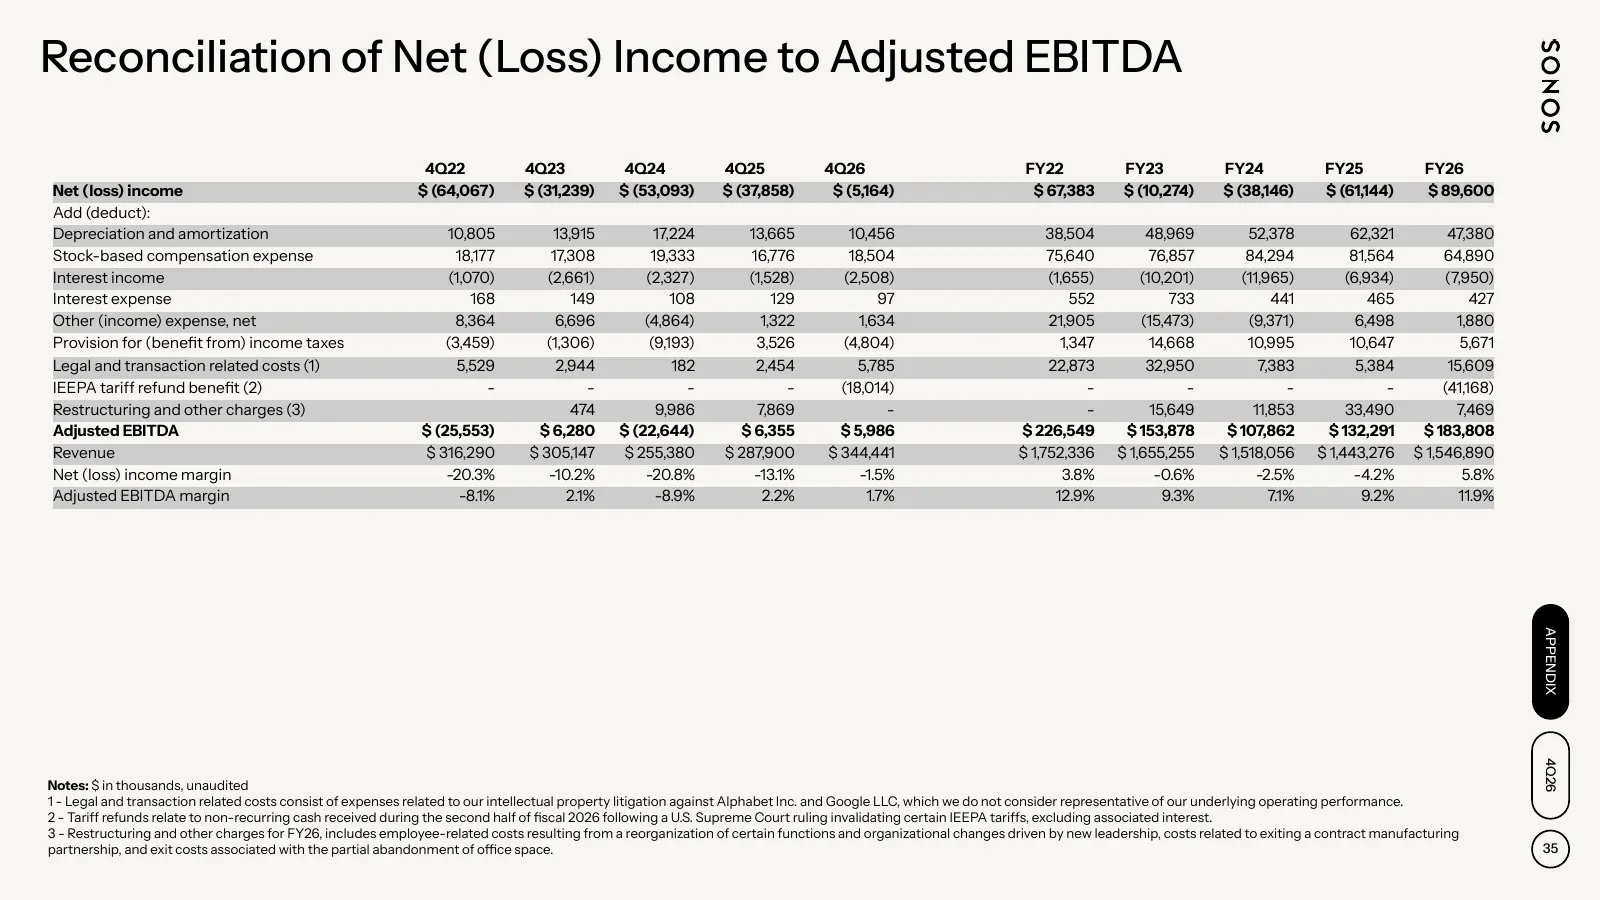
Reconciliation of Net (Loss) Income to Adjusted EBITDA 4Q22 4Q23 4Q24 4Q25 4Q26 FY22 FY23 FY24 FY25 FY26 Net (loss) income $ (64,067) $ (31,239) $ (53,093) $ (37,858) $ (5,164) $ 67,383 $ (10,274) $ (38,146) $ (61,144) $ 89,600 Add (deduct): Depreciation and amortization 10,805 13,915 17,224 13,665
Slide 36: Reconciliation of GAAP Net Income to Non-GAAP Net Income
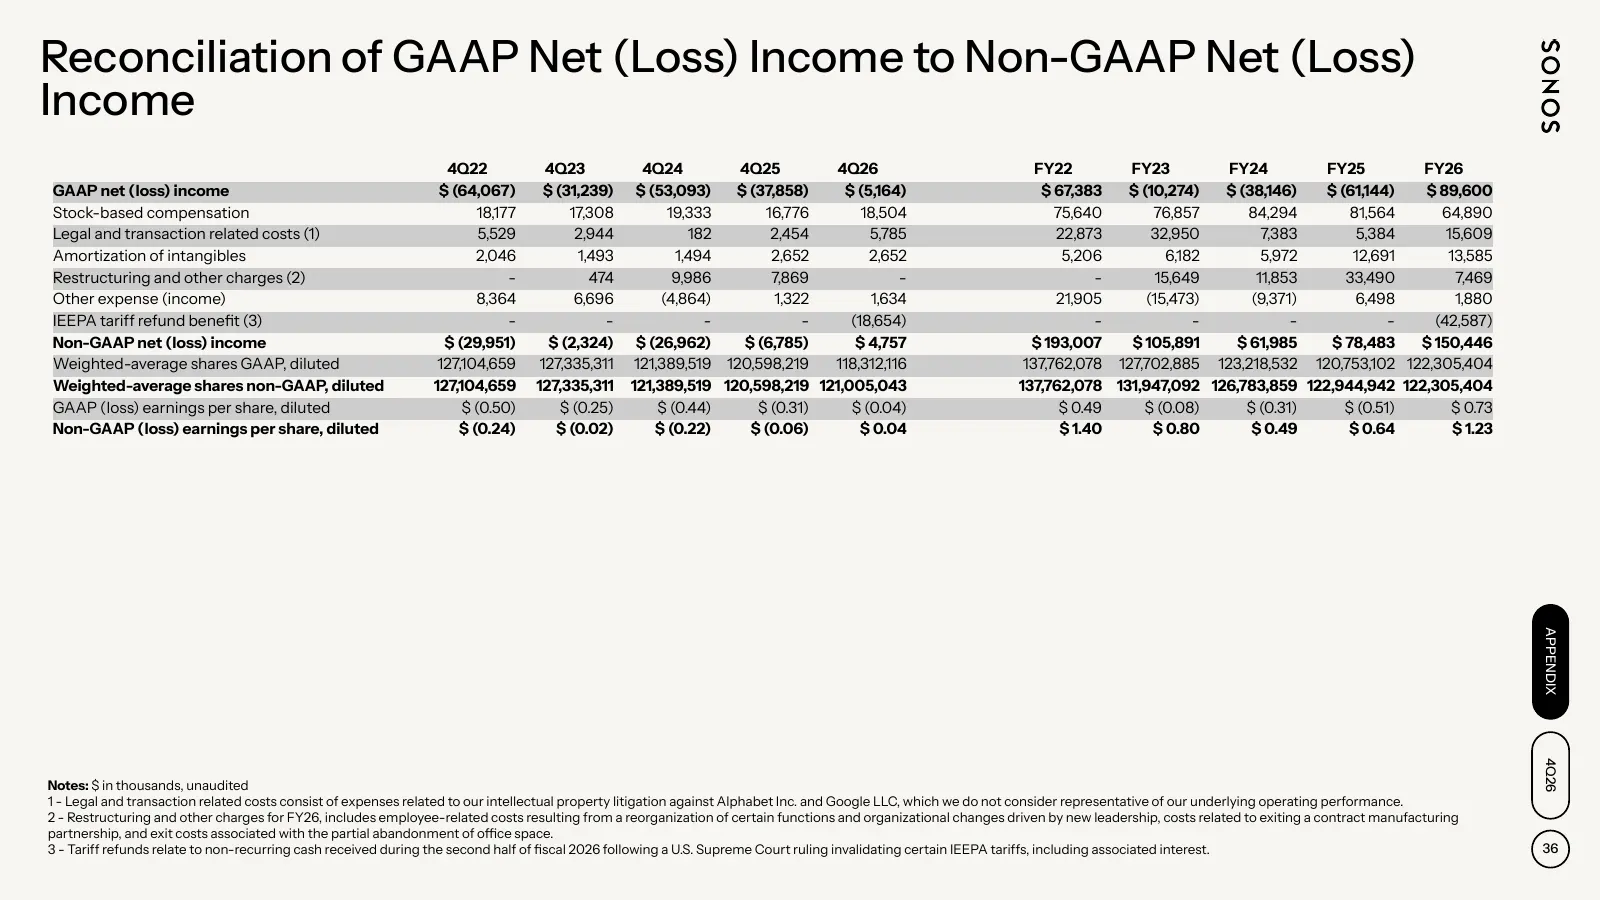
Reconciliation of GAAP Net (Loss) Income to Non-GAAP Net (Loss) Income 4Q22 4Q23 4Q24 4Q25 4Q26 FY22 FY23 FY24 FY25 FY26 GAAP net (loss) income $ (64,067) $ (31,239) $ (53,093) $ (37,858) $ (5,164) $ 67,383 $ (10,274) $ (38,146) $ (61,144) $ 89,600 Stock-based compensation 18,177 17,308 19,333 16,77
Slide 37: Reconciliation of Operating Cash Flow to Free Cash Flow
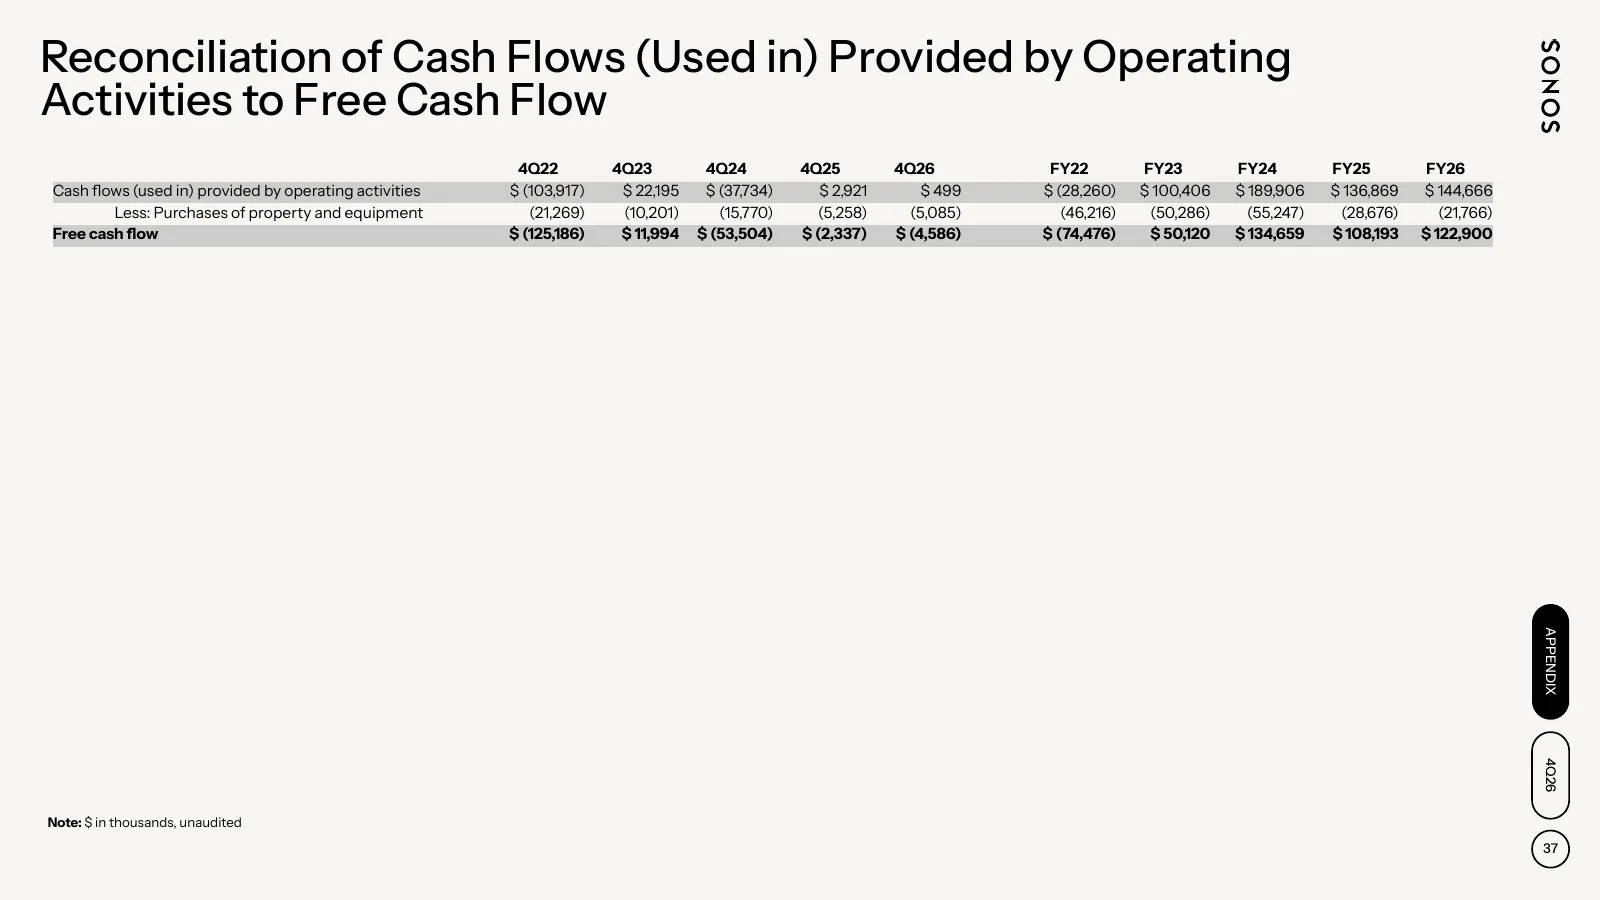
Reconciliation of Cash Flows (Used in) Provided by Operating Activities to Free Cash Flow 4Q22 4Q23 4Q24 4Q25 4Q26 FY22 FY23 FY24 FY25 FY26 Cash flows (used in) provided by operating activities $ (103,917) $ 22,195 $ (37,734) $ 2,921 $ 499 $ (28,260) $ 100,406 $ 189,906 $ 136,869 $ 144,666 Less: Pur

Slide 38: Investor Presentation 4Q26
INVESTOR PRESENTATION 4Q26 38
Source: company website
More decks from Sonos, Inc.
 Q3 FY2026 Earnings Presentation33 slides · July 2026
 Q4 2025 Earnings Presentation41 slides · Nov 5, 2025
 Q3 FY2025 Earnings Presentation35 slides · Aug 6, 2025
 Q2 FY2025 Earnings Presentation35 slides · May 7, 2025
 Q2 2025 Earnings Presentation32 slides · May 7, 2025
 Q1 2025 Earnings Presentation33 slides · Feb 6, 2025