Anchor BanCorp Wisconsin — Merger or Acquisition (January 2016)
25 slides from Anchor BanCorp Wisconsin's merger presentation, Jan 12, 2016
Slide 1: Old National Bancorp Expands into Wisconsin – Partners with Anchor BanCorp Wisconsin Inc.
Old National Bancorp Expands into Wisconsin – Partners with Anchor BanCorp Wisconsin Inc. January 12, 2016 Filed by Old National Bancorp Pursuant to Rule 425 under the Securities Act of 1933 Subject Company: Anchor BanCorp Wisconsin Inc. Commission File No.: 001-34955
Slide 2: Additional Information for Shareholders of Anchor BanCorp Wisconsin Inc.
Additional Information for Shareholders of Anchor BanCorp Wisconsin Inc. Communications in this document do not constitute an offer to sell or the solicitation of an offer to buy any securities or a solicitation of any vote or approval. In connection with the proposed merger, Old National Bancorp (“
Slide 3: Forward-Looking Statements
Forward-Looking Statements This presentation contains certain forward-looking statements within the meaning of the Private Securities Litigation Reform Act of 1995. These statements include, but are not limited to, statements about the expected timing, completion, financial benefits and other effect
Slide 4: Non-GAAP Financial Measures
Non-GAAP Financial Measures These slides contain non-GAAP financial measures. For purposes of Regulation G, a non-GAAP financial measure is a numerical measure of the registrant's historical or future financial performance, financial position or cash flows that excludes amounts, or is subject to adj
Slide 5: Transaction Highlights
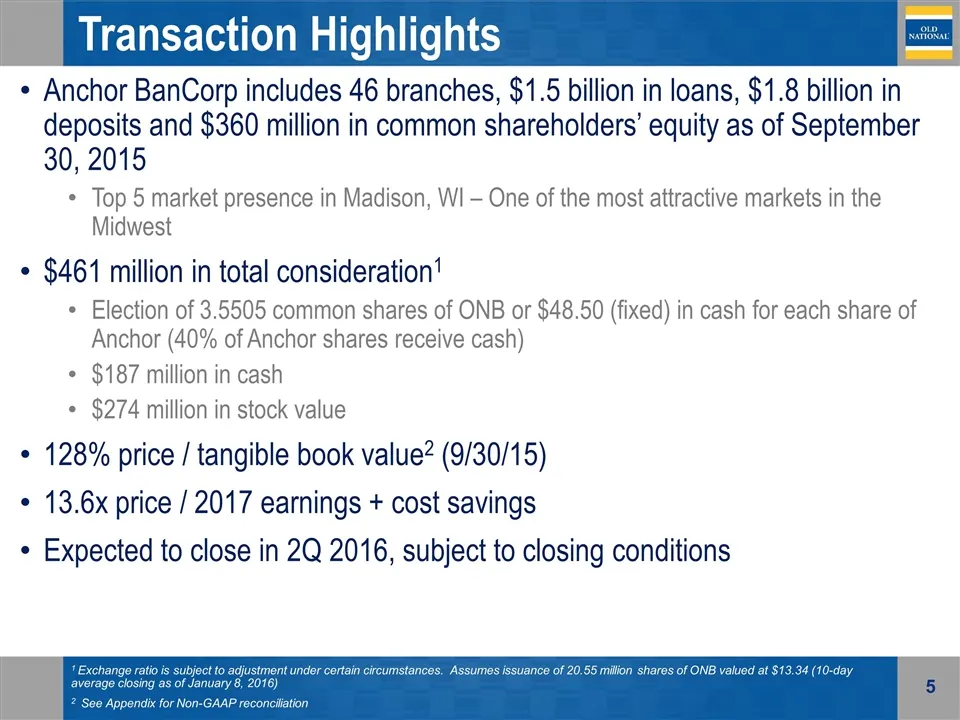
Transaction Highlights Anchor BanCorp includes 46 branches, $1.5 billion in loans, $1.8 billion in deposits and $360 million in common shareholders’ equity as of September 30, 2015 Top 5 market presence in Madison, WI – One of the most attractive markets in the Midwest $461 million in total consider
Slide 6: Compelling Financial Returns / Strategic Fit
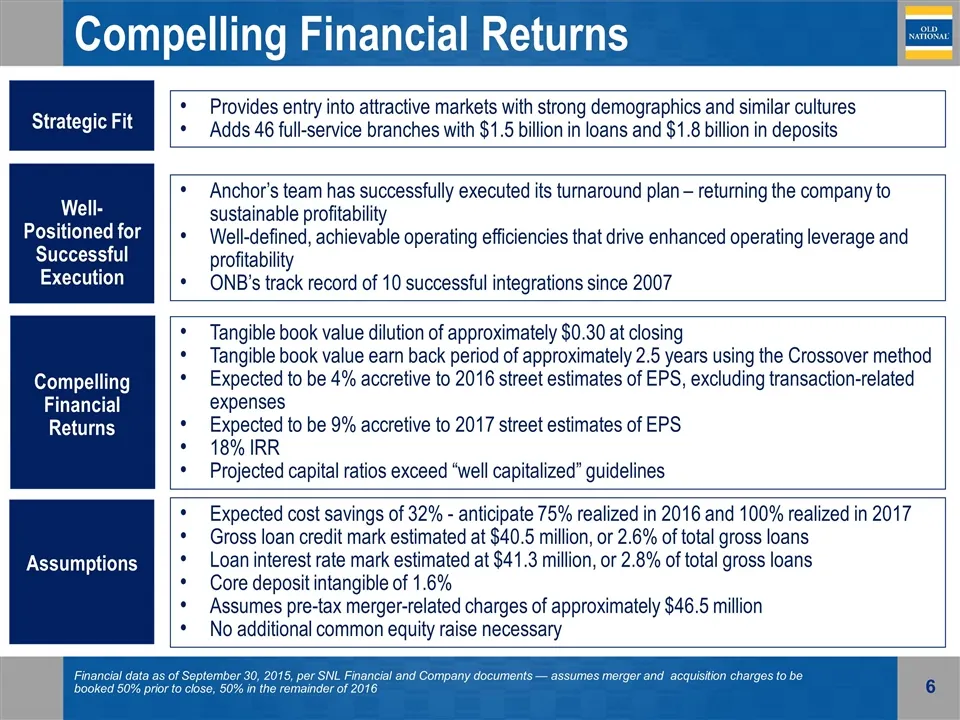
Compelling Financial Returns Strategic Fit Financial data as of September 30, 2015, per SNL Financial and Company documents — assumes merger and acquisition charges to be booked 50% prior to close, 50% in the remainder of 2016 Well-Positioned for Successful Execution Anchor’s team has successfully e
Slide 7: Why Wisconsin?
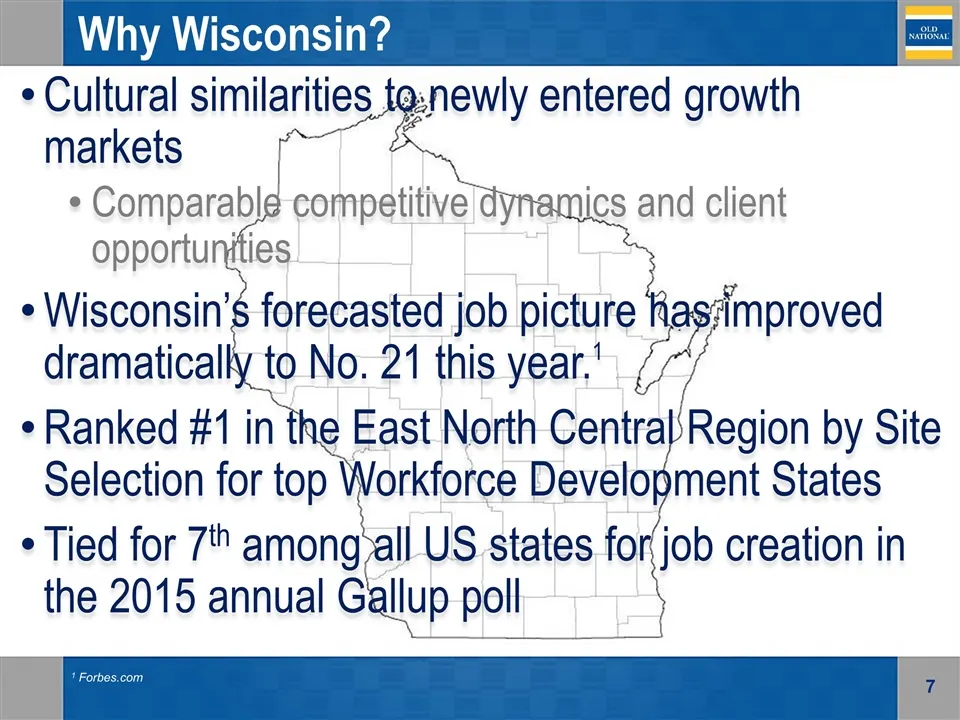
Why Wisconsin? Cultural similarities to newly entered growth markets Comparable competitive dynamics and client opportunities Wisconsin’s forecasted job picture has improved dramatically to No. 21 this year.1 Ranked #1 in the East North Central Region by Site Selection for top Workforce Development
Slide 8: Franchise Provides Superior Demographics
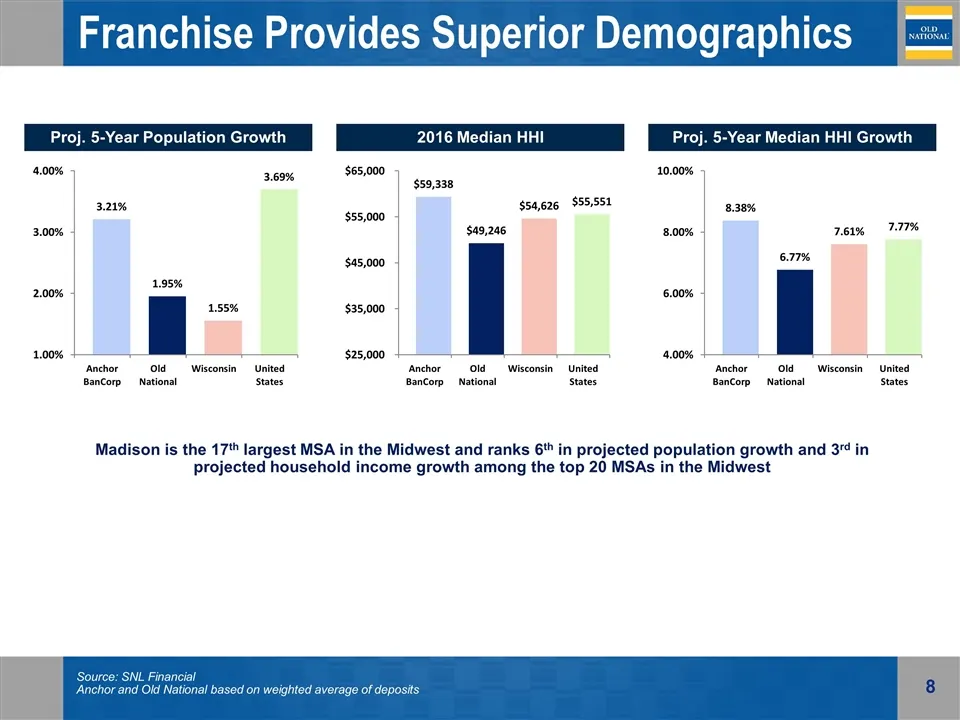
Franchise Provides Superior Demographics Proj. 5-Year Population Growth 2016 Median HHI Proj. 5-Year Median HHI Growth Source: SNL Financial Anchor and Old National based on weighted average of deposits Madison is the 17th largest MSA in the Midwest and ranks 6th in projected population growth and 3
Slide 9: Strategic Rationale
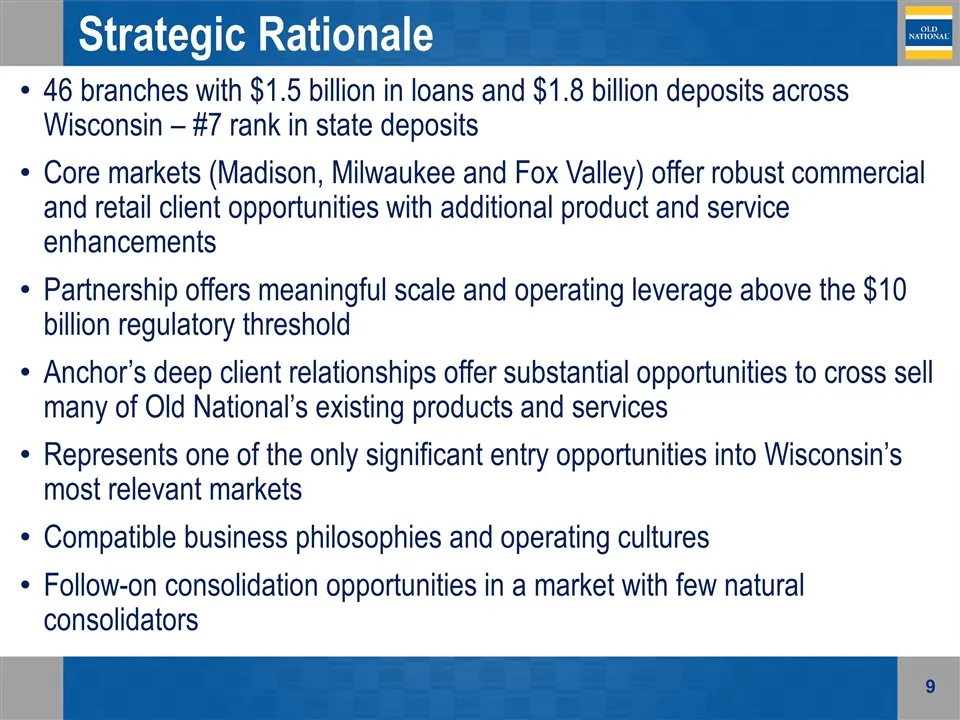
Strategic Rationale 46 branches with $1.5 billion in loans and $1.8 billion deposits across Wisconsin – #7 rank in state deposits Core markets (Madison, Milwaukee and Fox Valley) offer robust commercial and retail client opportunities with additional product and service enhancements Partnership offe
Slide 10: Products & Services Enhancements
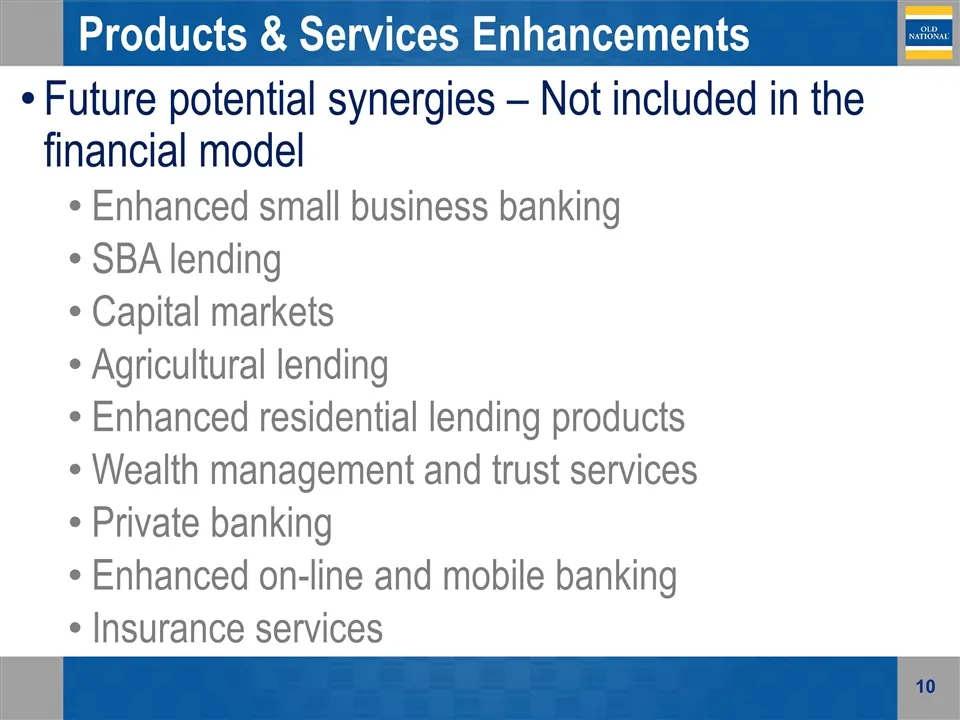
Products & Services Enhancements Likely Synergies / Enhancements Future potential synergies – Not included in the financial model Enhanced small business banking SBA lending Capital markets Agricultural lending Enhanced residential lending products Wealth management and trust services Private bankin
Slide 11: Anchor BanCorp Wisconsin Inc. Overview
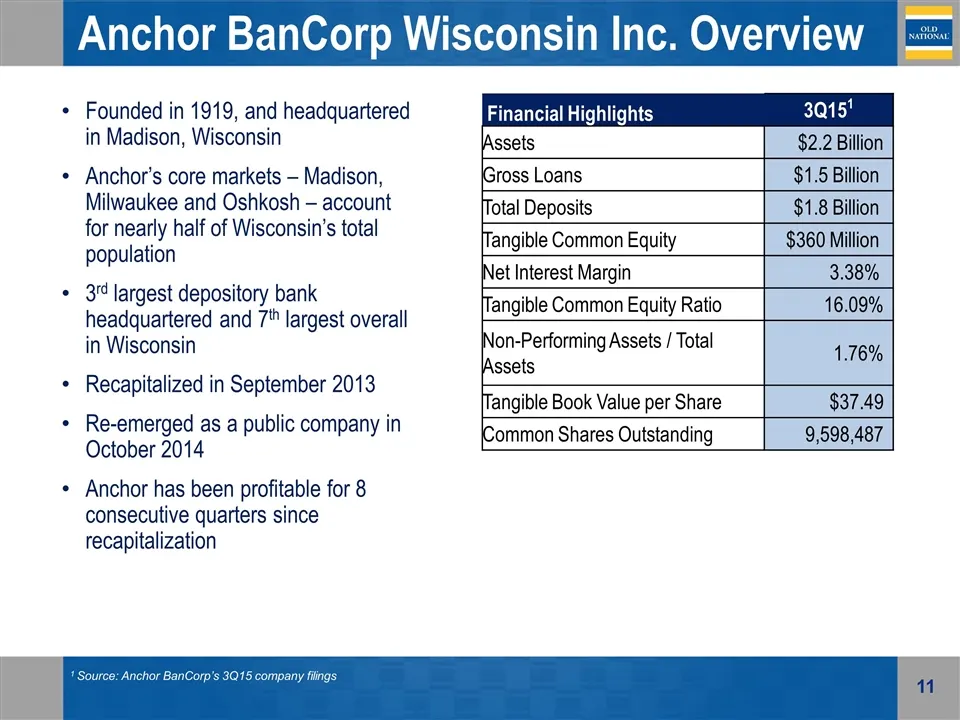
Anchor BanCorp Wisconsin Inc. Overview Founded in 1919, and headquartered in Madison, Wisconsin Anchor’s core markets – Madison, Milwaukee and Oshkosh – account for nearly half of Wisconsin’s total population 3rd largest depository bank headquartered and 7th largest overall in Wisconsin Recapitalize
Slide 12: Anchor's Core Franchise – "The Triangle"
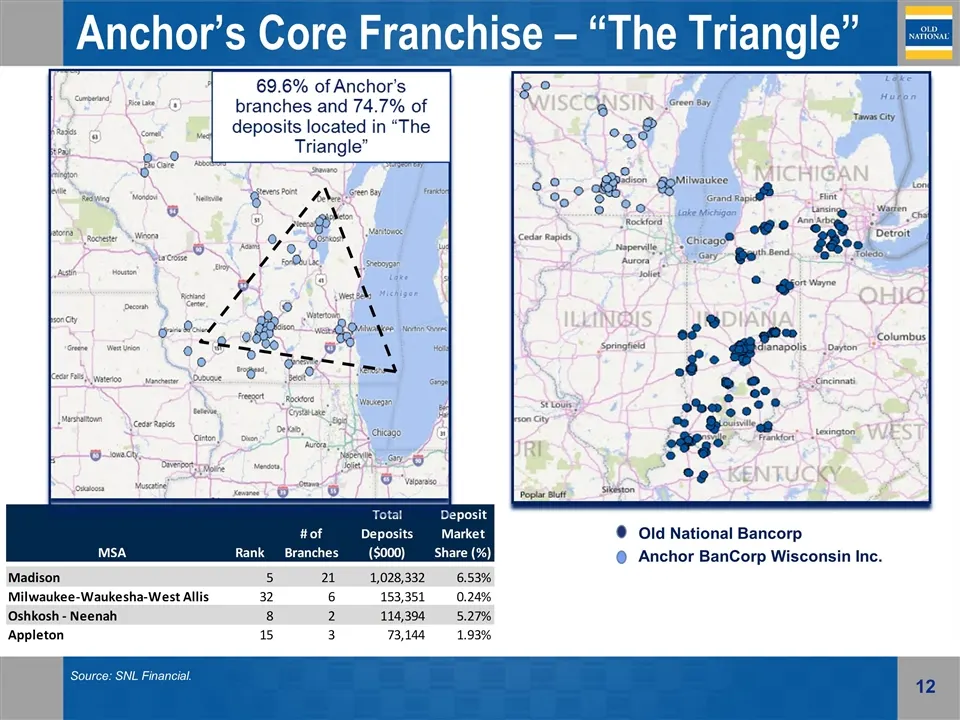
Source: SNL Financial. Anchor’s Core Franchise – “The Triangle” Old National Bancorp Anchor BanCorp Wisconsin Inc.
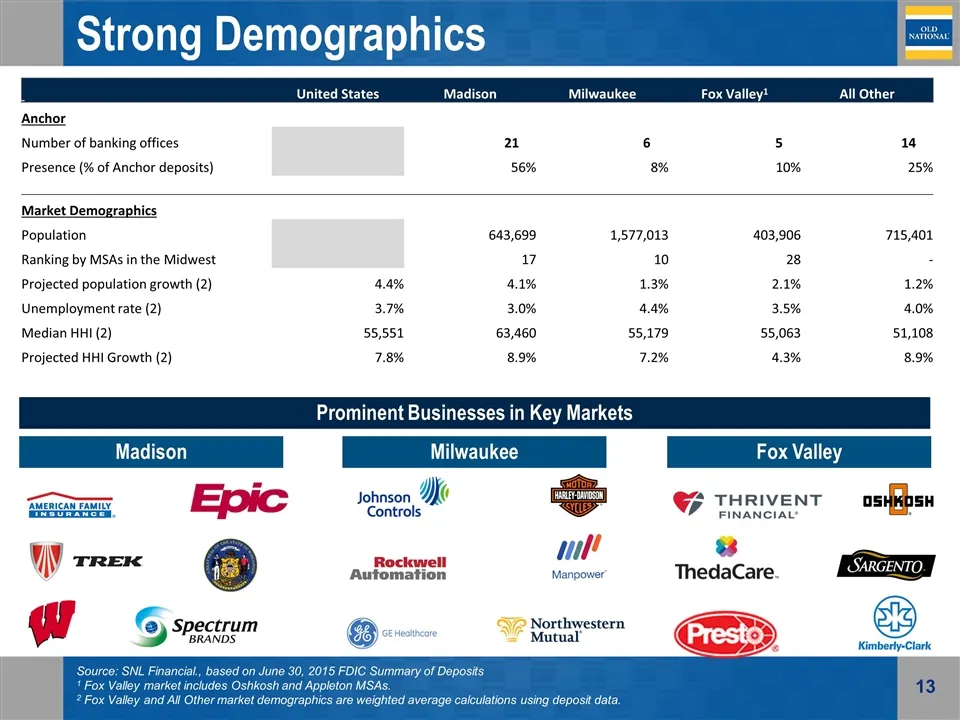
Slide 13: Prominent Businesses in Key Markets / Strong Demographics
Madison Milwaukee Fox Valley Prominent Businesses in Key Markets Strong Demographics Source: SNL Financial., based on June 30, 2015 FDIC Summary of Deposits 1 Fox Valley market includes Oshkosh and Appleton MSAs. 2 Fox Valley and All Other market demographics are weighted average calculations using
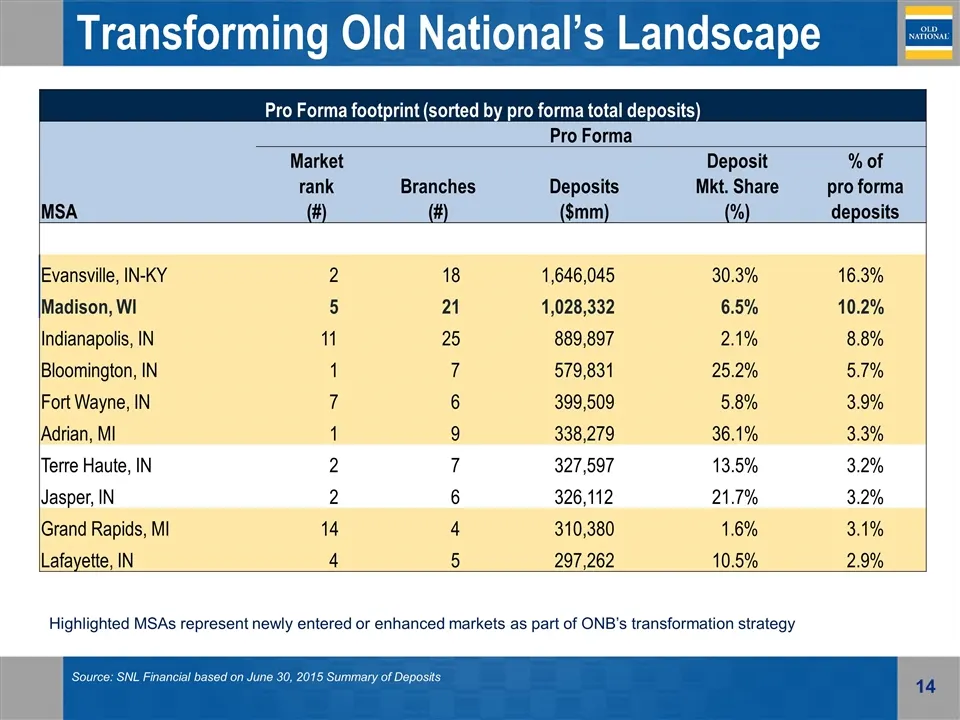
Slide 14: Transforming Old National's Landscape
Source: SNL Financial based on June 30, 2015 Summary of Deposits Transforming Old National’s Landscape Pro Forma footprint (sorted by pro forma total deposits) Pro Forma Market Deposit % of rank Branches Deposits Mkt. Share pro forma MSA (#) (#) ($mm) (%) deposits Evansville, IN-KY 2 18 1,646,045 30
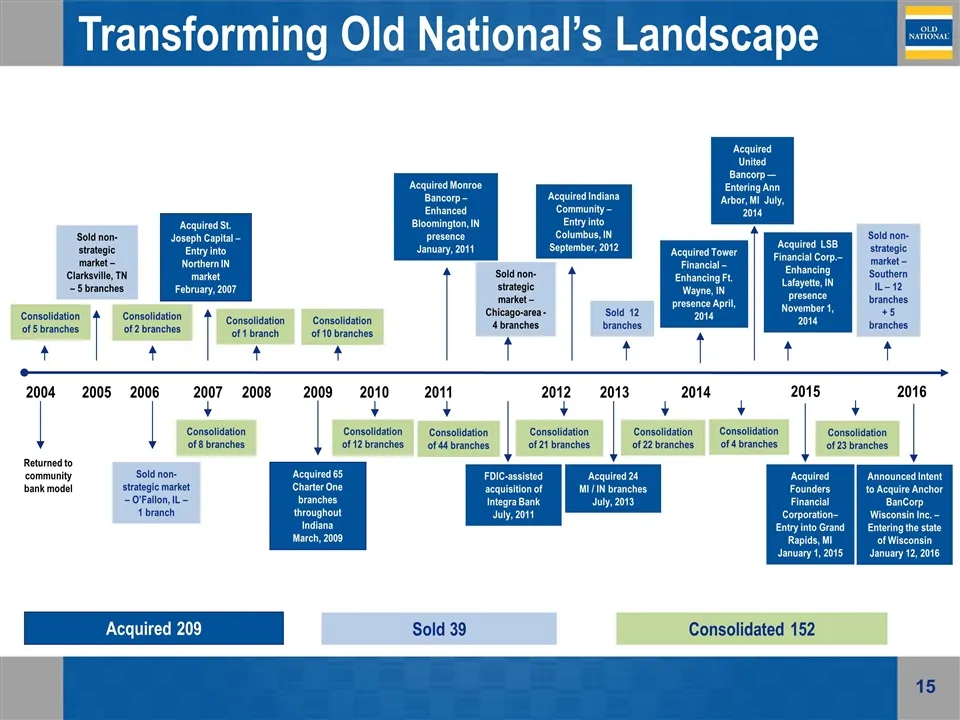
Slide 15: Old National acquisition and transformation history
Returned to community bank model 2004 2005 Sold non-strategic market – Clarksville, TN – 5 branches 2006 Sold non-strategic market – O’Fallon, IL – 1 branch 2007 2008 2009 2010 2011 2012 2013 Acquired St. Joseph Capital – Entry into Northern IN market February, 2007 Acquired 65 Charter One branches
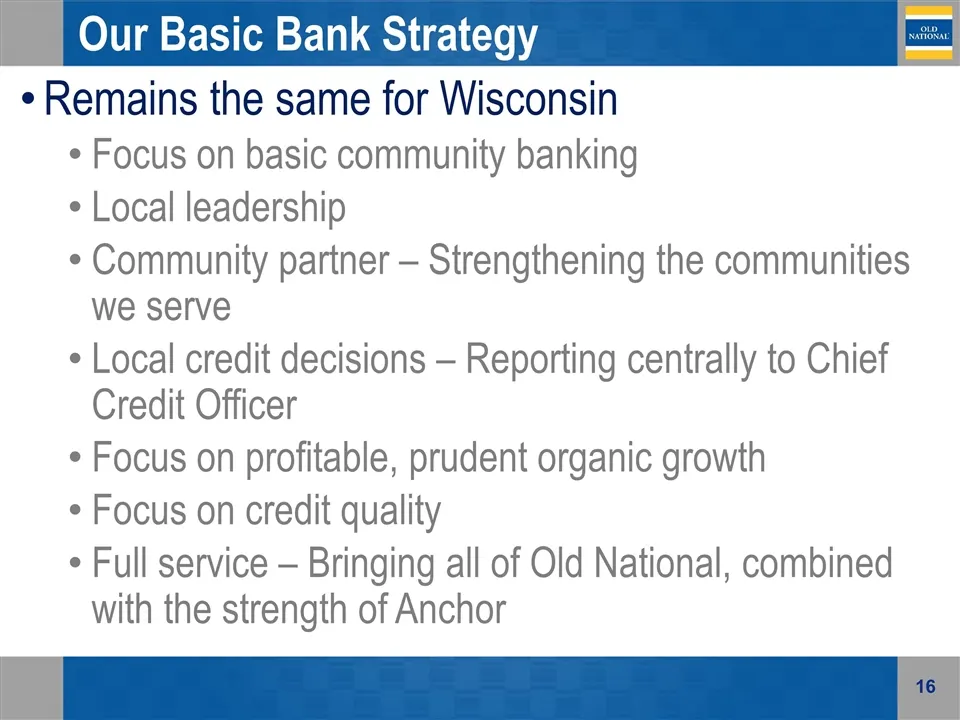
Slide 16: Our Basic Bank Strategy Remains the Same for Wisconsin
Our Basic Bank Strategy Remains the same for Wisconsin Focus on basic community banking Local leadership Community partner – Strengthening the communities we serve Local credit decisions – Reporting centrally to Chief Credit Officer Focus on profitable, prudent organic growth Focus on credit quality
Slide 17: Appendix
Appendix Ml OLD NATIONAL BANCORP
Slide 18: Financial Metrics
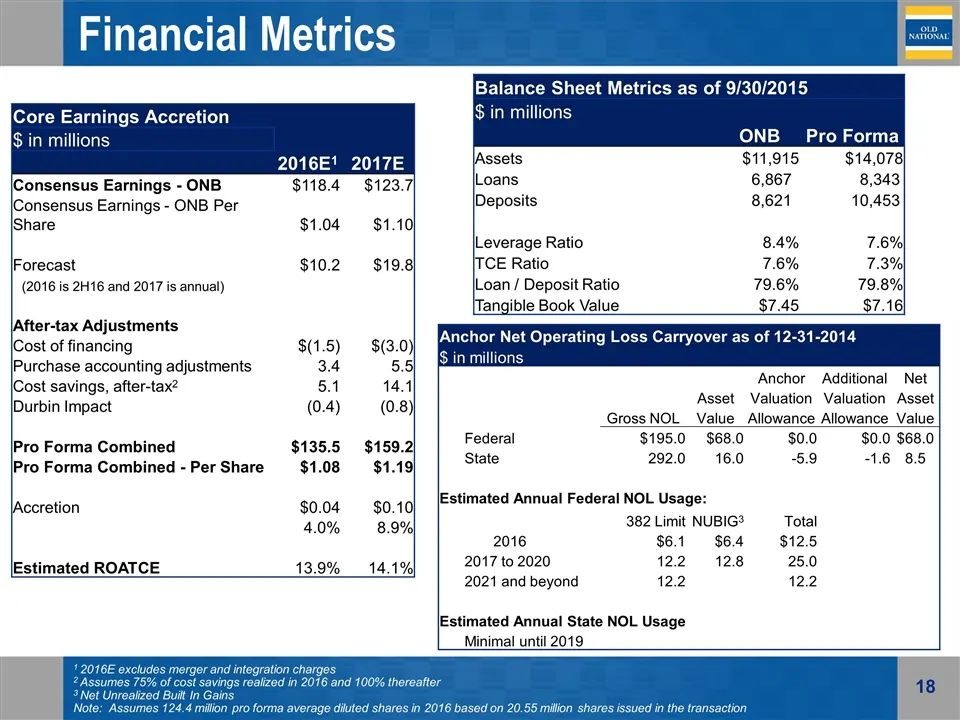
Financial Metrics 1 2016E excludes merger and integration charges 2 Assumes 75% of cost savings realized in 2016 and 100% thereafter 3 Net Unrealized Built In Gains Note: Assumes 124.4 million pro forma average diluted shares in 2016 based on 20.55 million shares issued in the transaction Core Earni
Slide 19: Deferred Tax Asset
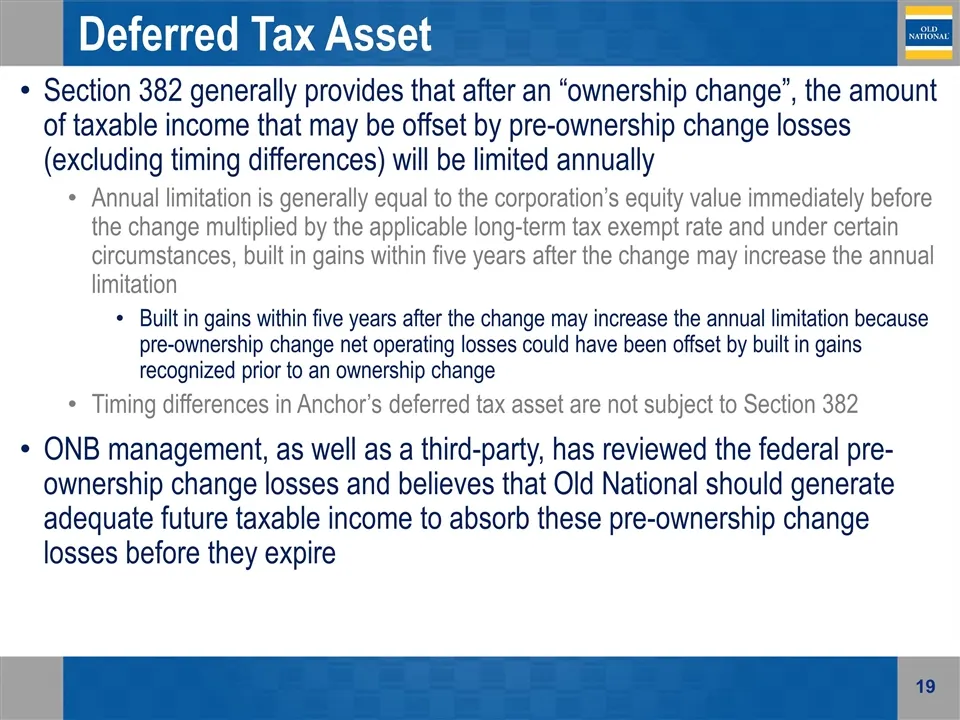
Deferred Tax Asset Section 382 generally provides that after an “ownership change”, the amount of taxable income that may be offset by pre-ownership change losses (excluding timing differences) will be limited annually Annual limitation is generally equal to the corporation’s equity value immediatel
Slide 20: Pro Forma Loan Composition
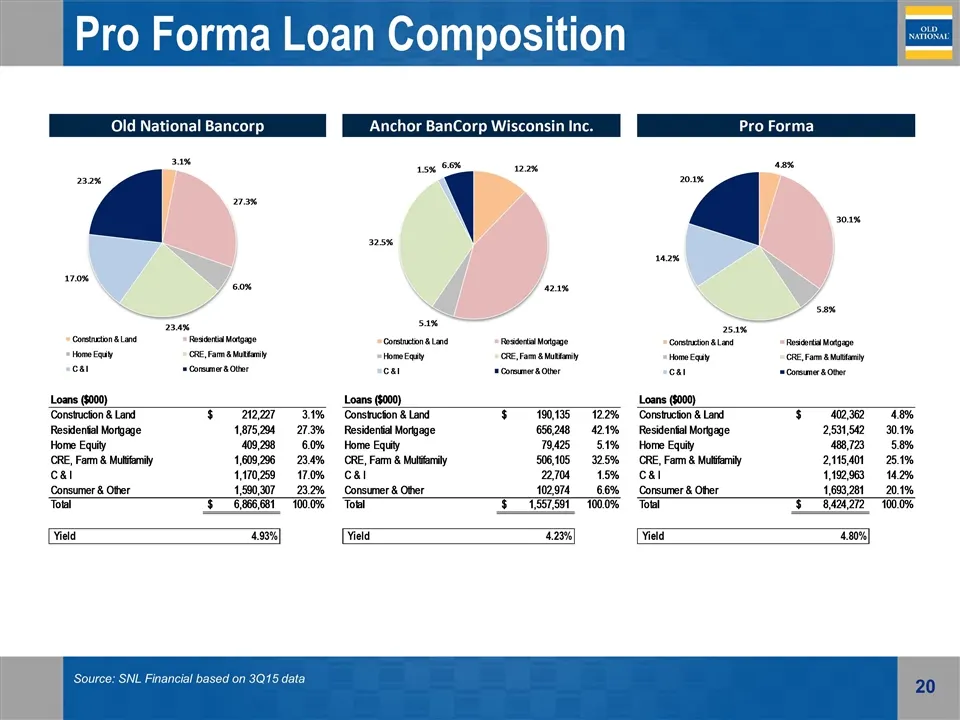
Source: SNL Financial based on 3Q15 data Pro Forma Loan Composition GAAP GAAP Loan Comp #VALUE! #VALUE! #VALUE! 1-4 Family Home Equity #VALUE! CRE & Multi Family C&I #VALUE! Total Loans and Leases 1-4 Family Home Equity Construction & Development CRE & Multifamily C&I Consumer & Other Consumer Plug
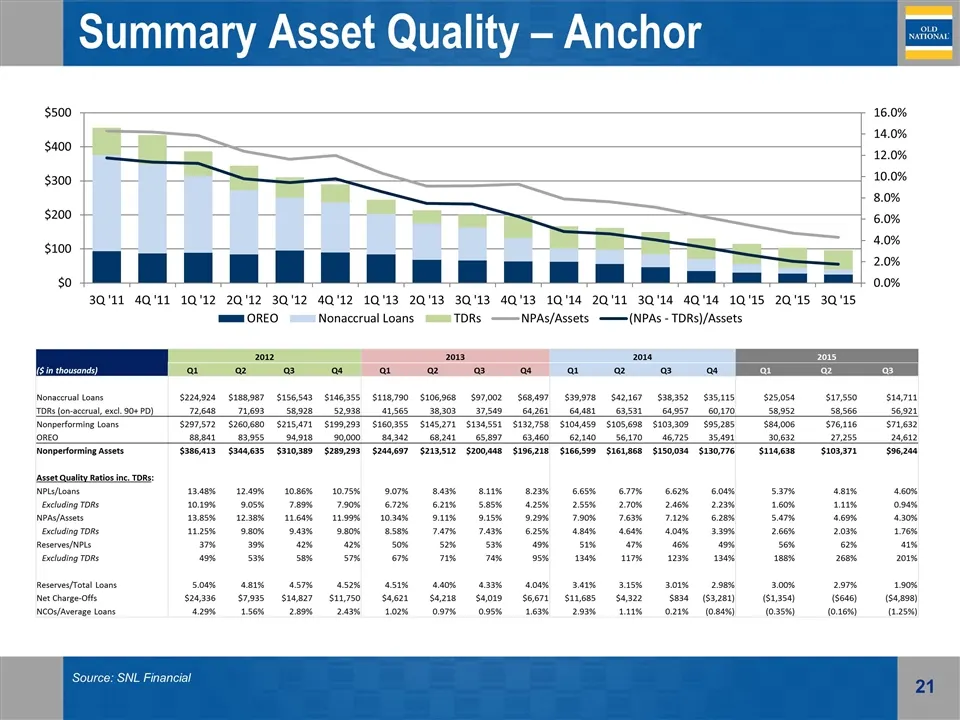
Slide 21: Summary Asset Quality – Anchor
Source: SNL Financial Summary Asset Quality – Anchor 2012 2013 2014 2015 ($ in thousands) Q1 Q2 Q3 Q4 Q1 Q2 Q3 Q4 Q1 Q2 Q3 Q4 Q1 Q2 Q3 Nonaccrual Loans $224,924 $188,987 $156,543 $146,355 $118,790 $106,968 $97,002 $68,497 $39,978 $42,167 $38,352 $35,115 $25,054 $17,550 $14,711 TDRs (on-accrual, excl
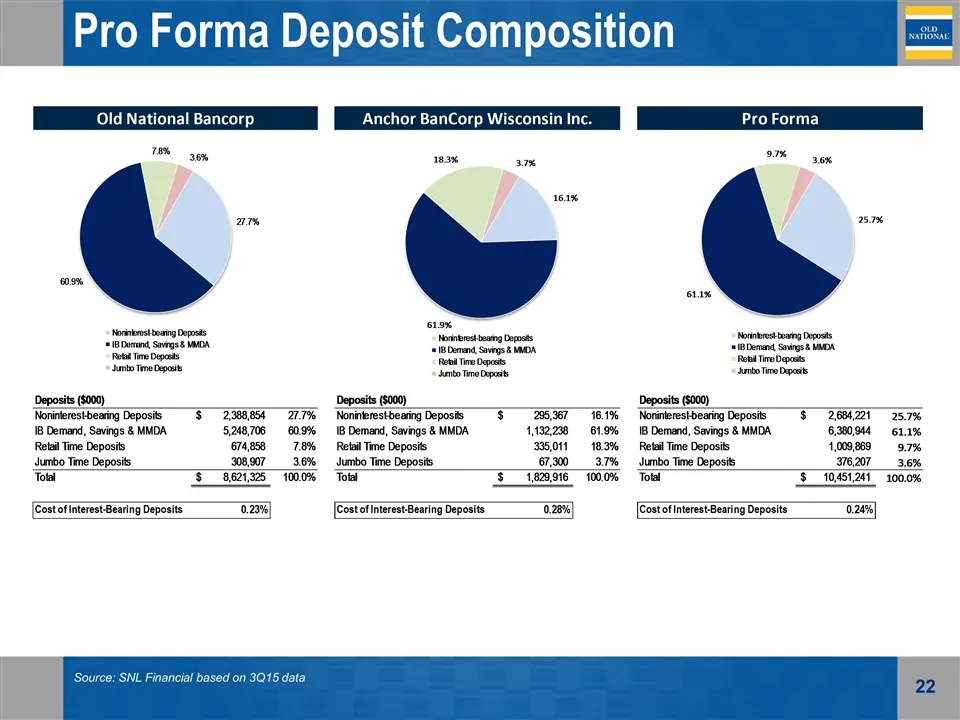
Slide 22: Pro Forma Deposit Composition
Pro Forma Deposit Composition Source: SNL Financial based on 3Q15 data GAAP GAAP Loan Comp #VALUE! #VALUE! #VALUE! 1-4 Family Home Equity #VALUE! CRE & Multi Family C&I #VALUE! Total Loans and Leases 1-4 Family Home Equity Construction & Development CRE & Multifamily C&I Consumer & Other Consumer Pl
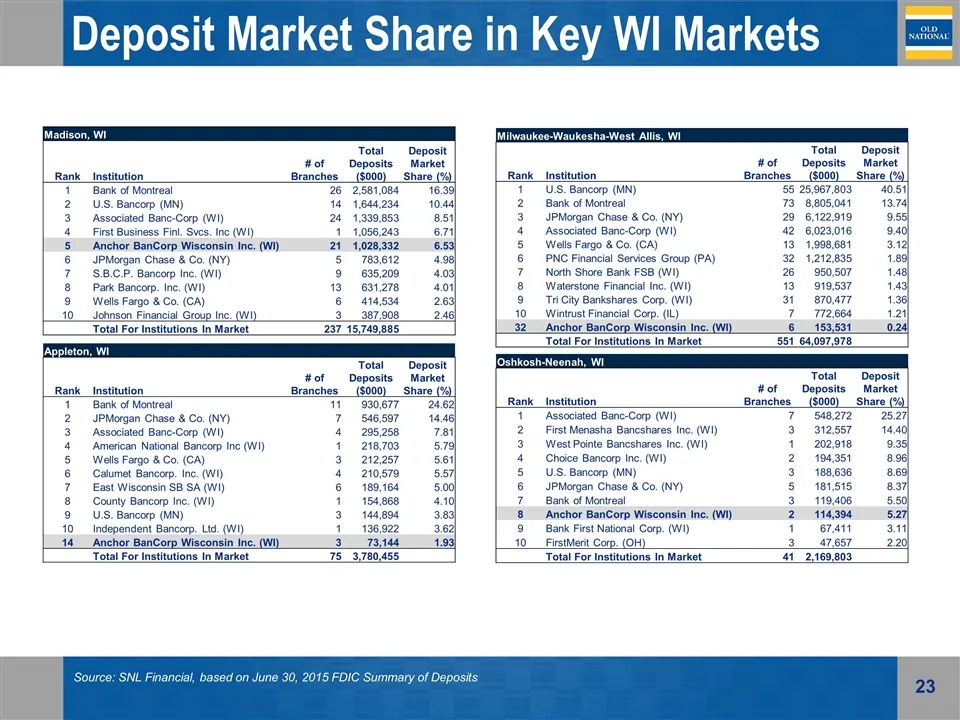
Slide 23: Deposit Market Share in Key WI Markets
Source: SNL Financial, based on June 30, 2015 FDIC Summary of Deposits Deposit Market Share in Key WI Markets Madison, WI Rank Institution # of Branches Total Deposits ($000) Deposit Market Share (%) 1 Bank of Montreal 26 2,581,084 16.39 2 U.S. Bancorp (MN) 14 1,644,234 10.44 3 Associated Banc-Corp
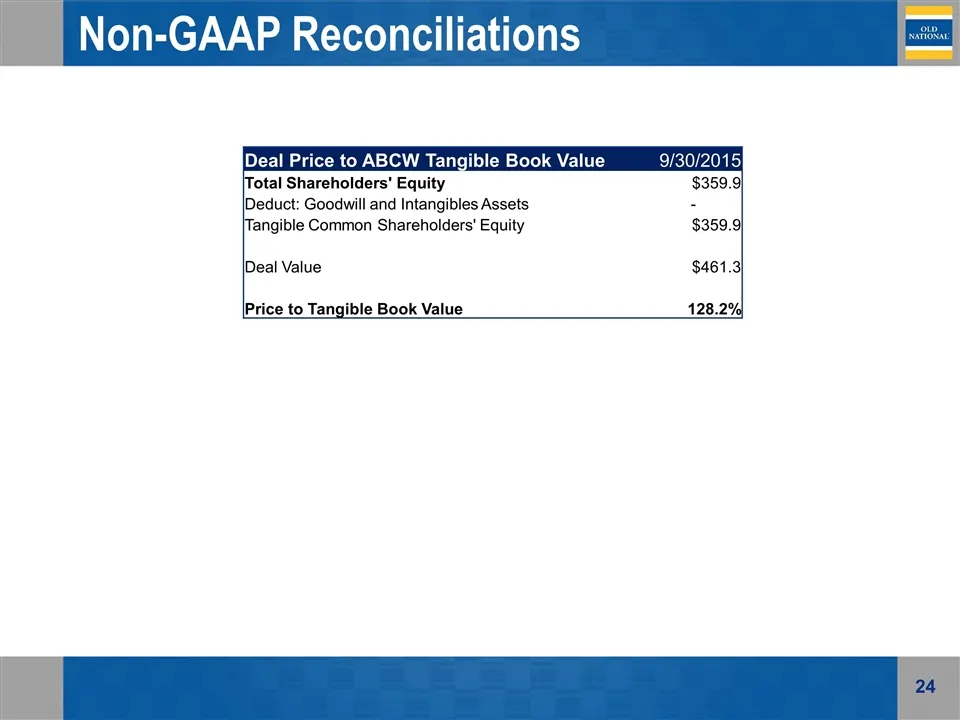
Slide 24: Non-GAAP Reconciliations
Non-GAAP Reconciliations Deal Price to ABCW Tangible Book Value 9/30/2015 Total Shareholders' Equity $359.9 Deduct: Goodwill and Intangibles Assets - Tangible Common Shareholders' Equity $359.9 Deal Value $461.3 Price to Tangible Book Value 128.2%

Slide 25: Investor Contact
Investor Contact Additional information can be found on the Investor Relations web pages at www.oldnational.com Investor Inquiries: Lynell J. Walton, CPA SVP – Director of Investor Relations 812-464-1366 lynell.walton@oldnational.com
Source: SEC EDGAR · 425 filed Jan 12, 2016
More decks from Anchor BanCorp Wisconsin Inc
 Merger or Acquisition (February 2016)13 slides · Feb 9, 2016
 Merger or Acquisition (February 2016)5 slides · Feb 1, 2016
 Q4 2015 Earnings Presentation14 slides · Jan 29, 2016
 Q3 2015 Earnings Presentation17 slides · Oct 29, 2015
 Q2 2015 Earnings Presentation17 slides · Jul 31, 2015
 Q1 2015 Earnings Presentation12 slides · Apr 30, 2015