Inovalon — Q4 and FY2015 Earnings Presentation
27 slides from Inovalon's earnings presentation, Feb 25, 2016
Slide 1: Note Regarding Forward-Looking Statements
Note Regarding Forward-Looking Statements This presentation contains forward-looking statements. All statements other than statements of historical facts contained in this presentation, including, but not limited to, statements regarding future results of the operations and financial position of Ino
Slide 2: Our Balance: Innovation, Growth, Profitability
Our Balance Innovation Growth Profitability 3 INOV Q4 & FY 2015 Supplement (2.25.16) v1.0.0 © 2016 by Inovalon. All rights reserved.
Slide 3: Our 5-Year View
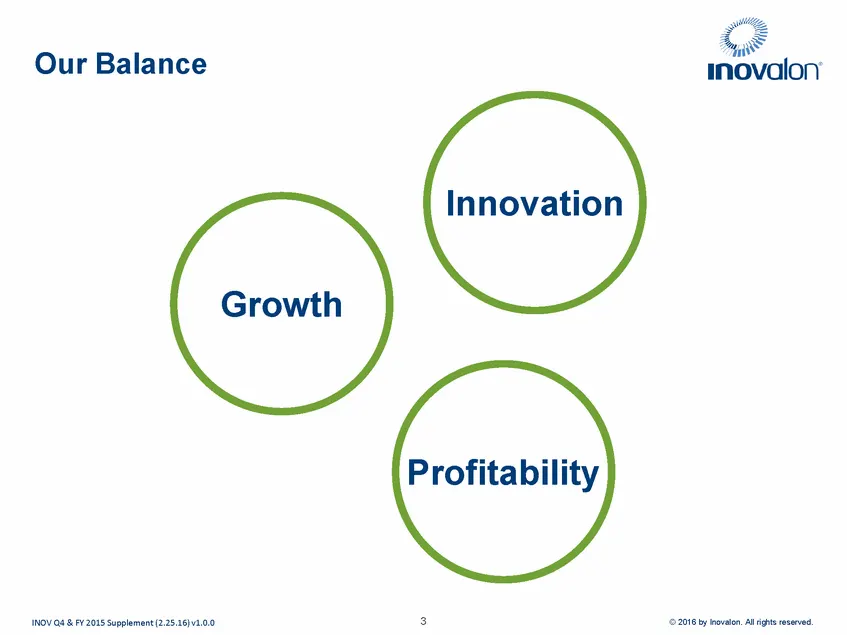
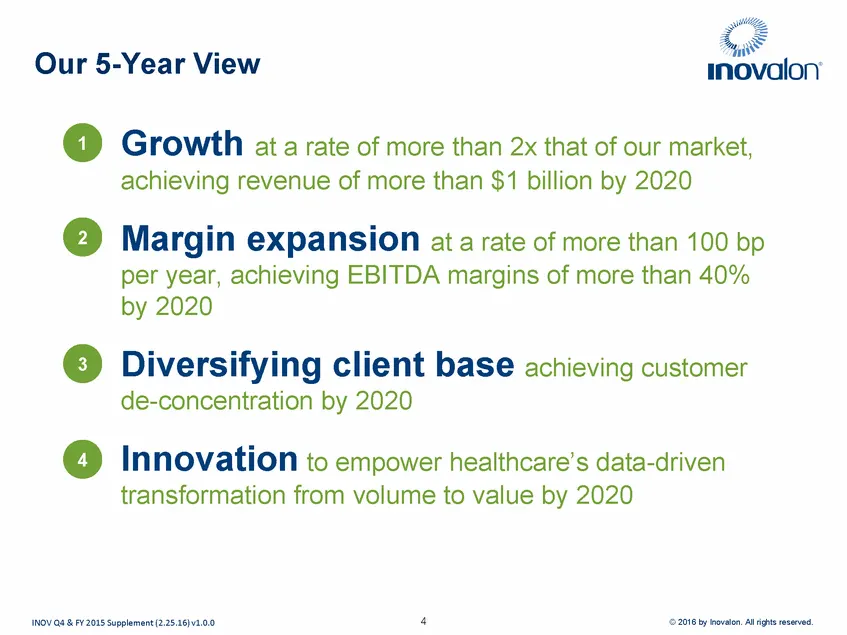
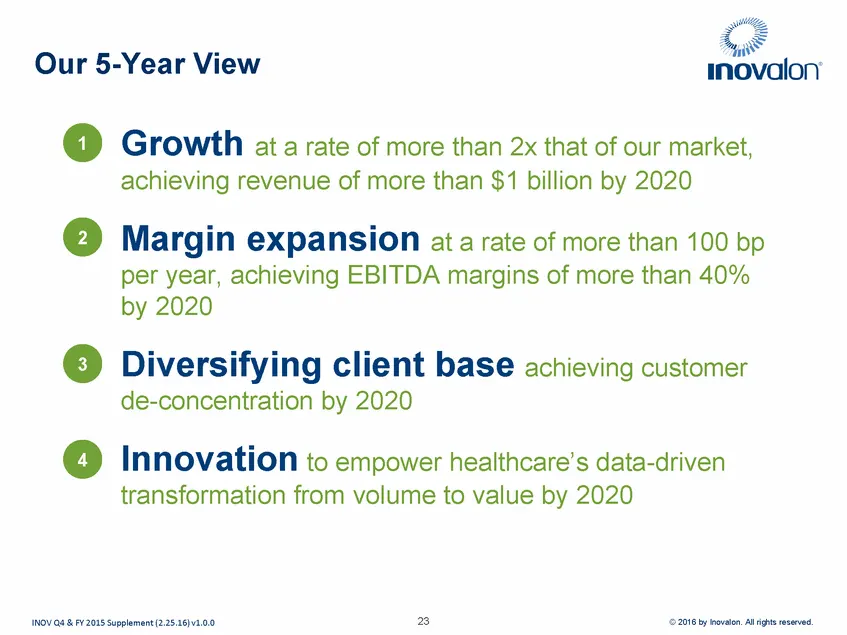
Our 5-Year View •1 Growth at a rate of more than 2x that of our market, achieving revenue of more than $1 billion by 2020 •2 Margin expansion at a rate of more than 100 bp per year, achieving EBITDA margins of more than 40% by 2020 •3 Diversifying client base achieving customer de-concentration by 2
Slide 4: Expanding Proprietary Datasets
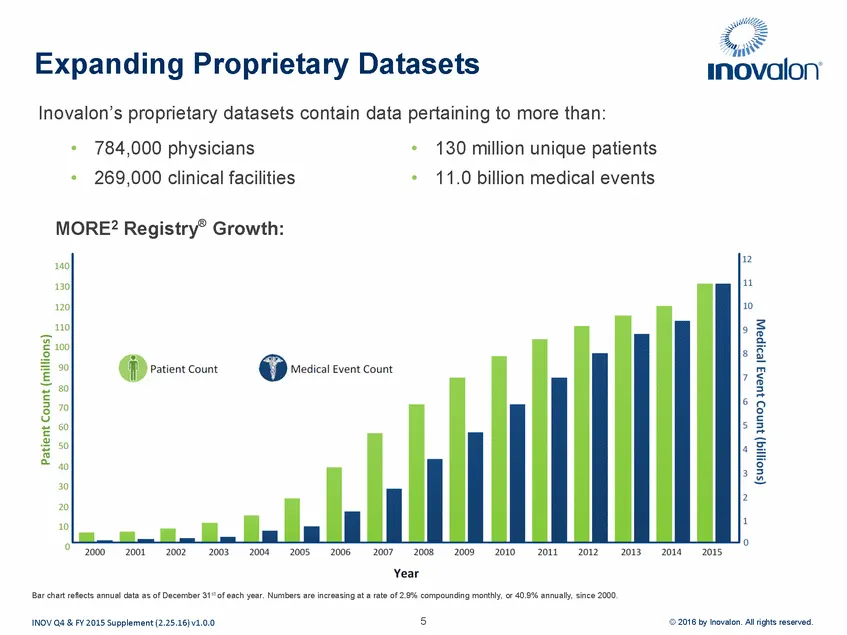
Expanding Proprietary Datasets Inovalon’s proprietary datasets contain data pertaining to more than: • • 784,000 physicians 269,000 clinical facilities • • 130 million unique patients 11.0 billion medical events MORE2 Registry® Growth: Bar chart reflects annual data as of December 31st of each year.
Slide 5: Revenue Growth
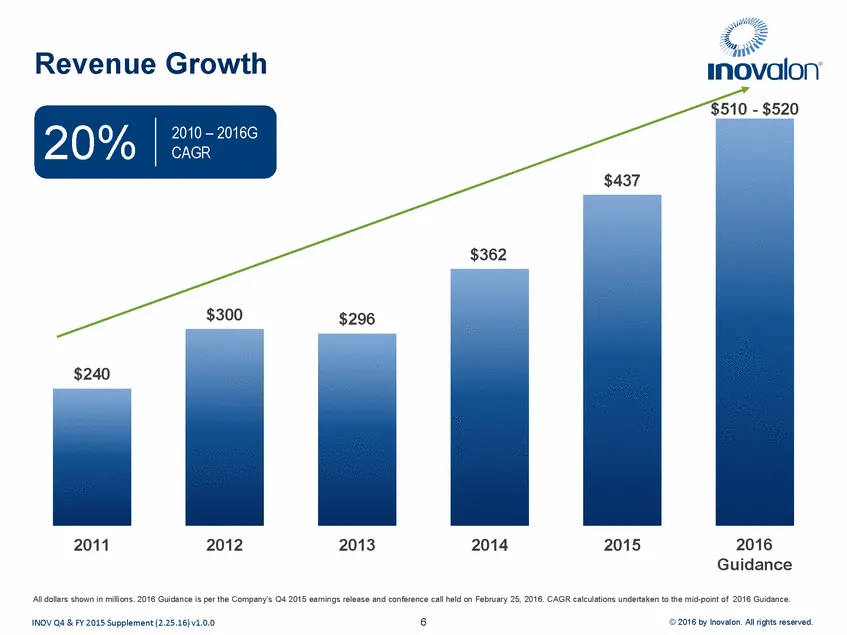
Revenue Growth $510 - $520 20% 2010 – 2016G CAGR $437 $362 $300 $296 $240 2011 2012 2013 2014 2015 2016 Guidance All dollars shown in millions. 2016 Guidance is per the Company’s Q4 2015 earnings release and conference call held on February 25, 2016. CAGR calculations undertaken to the mid-point of
Slide 6: Adjusted EBITDA Growth
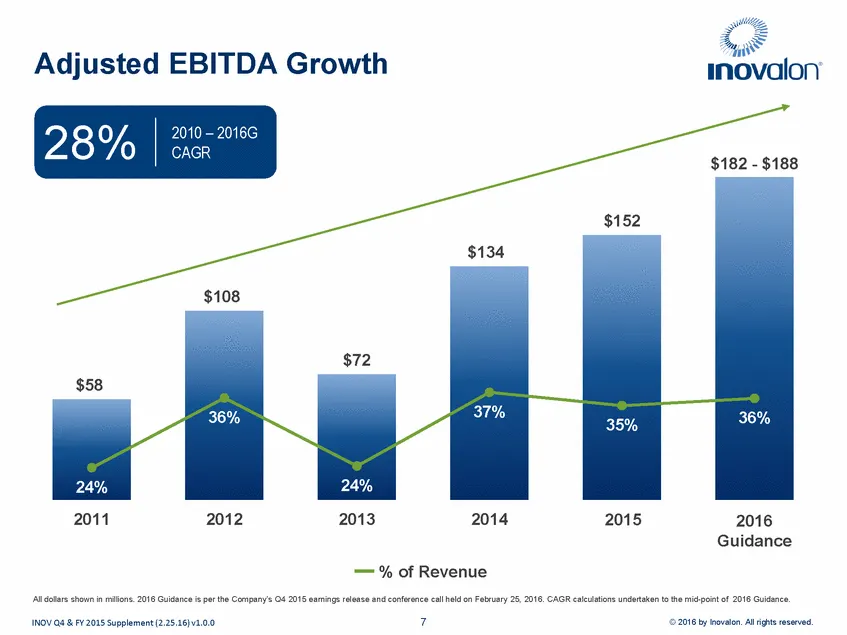
Adjusted EBITDA Growth 28% 2010 – 2016G CAGR $182 - $188 $152 $134 $108 $72 $58 37% 36% 36% 35% 24% 24% 2011 2012 2013 2014 2015 2016 Guidance % of Revenue All dollars shown in millions. 2016 Guidance is per the Company’s Q4 2015 earnings release and conference call held on February 25, 2016. CAGR c
Slide 7: Non-GAAP Net Income Growth
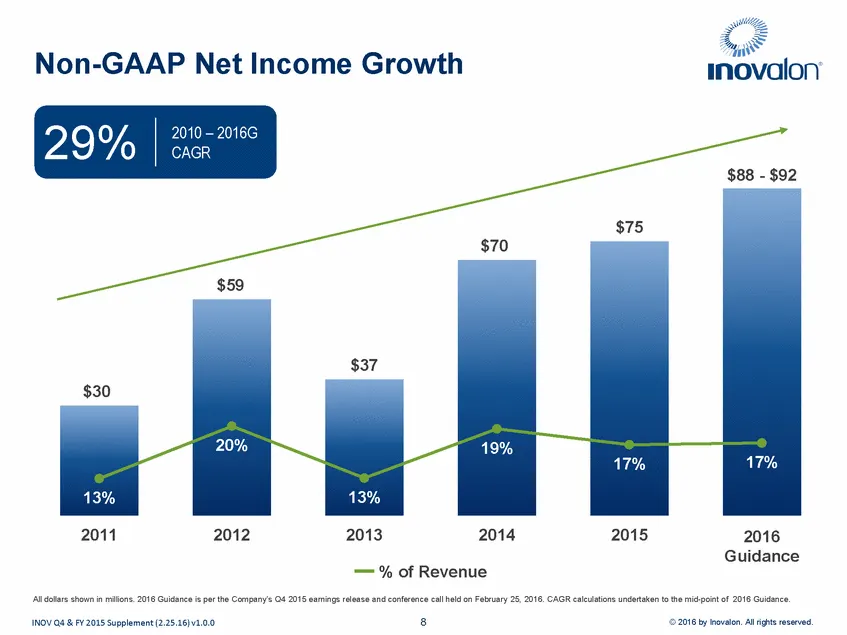
Non-GAAP Net Income Growth 29% 2010 – 2016G CAGR $88 - $92 $75 $70 $59 $37 $30 20% 19% 17% 17% 13% 13% 2011 2012 2013 2014 2015 2016 Guidance % of Revenue All dollars shown in millions. 2016 Guidance is per the Company’s Q4 2015 earnings release and conference call held on February 25, 2016. CAGR ca
Slide 8: Cash Flow From Operations
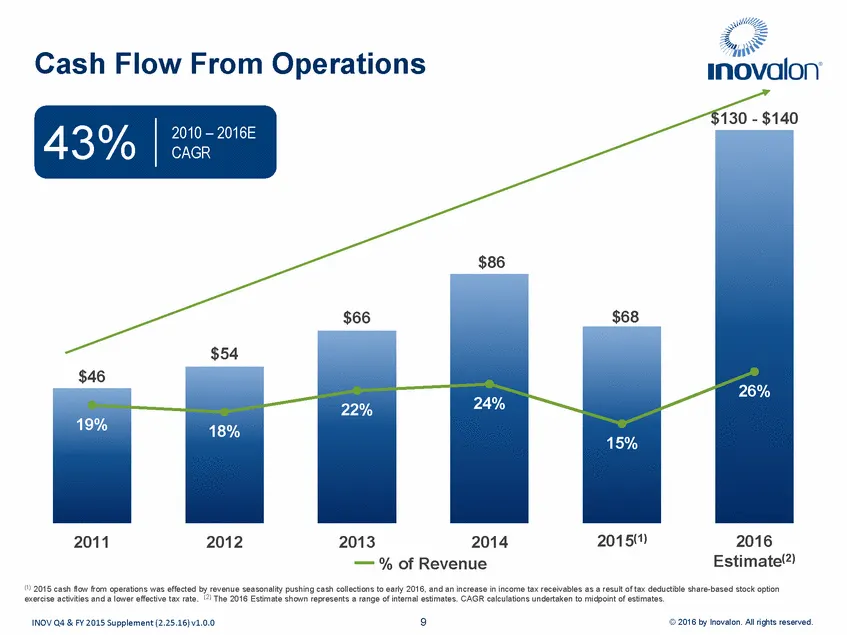
Cash Flow From Operations $130 - $140 43% 2010 – 2016E CAGR $86 $68 $66 $54 $46 26% 24% 22% 19% 18% 15% 2015(1) 20162E0s1t6imate Estimate(2) 2011 2012 2013 2014 % of Revenue (1) 2015 cash flow from operations was effected by revenue seasonality pushing cash collections to early 2016, and an increase
Slide 9: Investment in Innovation
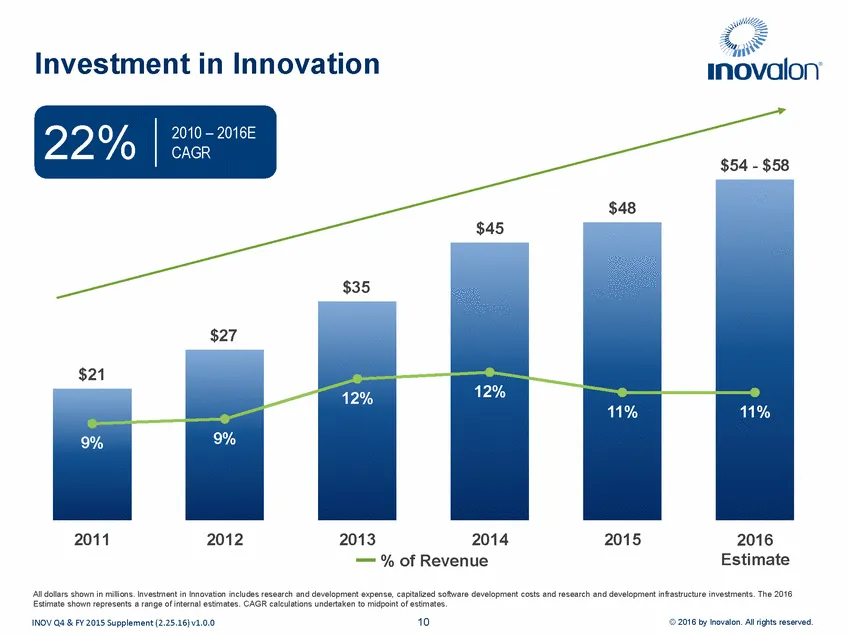
Investment in Innovation 22% 2010 – 2016E CAGR $54 - $58 $48 $45 $35 $27 $21 12% 12% 11% 11% 9% 9% 2011 2012 2013 2014 % of Revenue 2015 2016 Estimate All dollars shown in millions. Investment in Innovation includes research and development expense, capitalized software development costs and researc
Slide 10: Seasonality
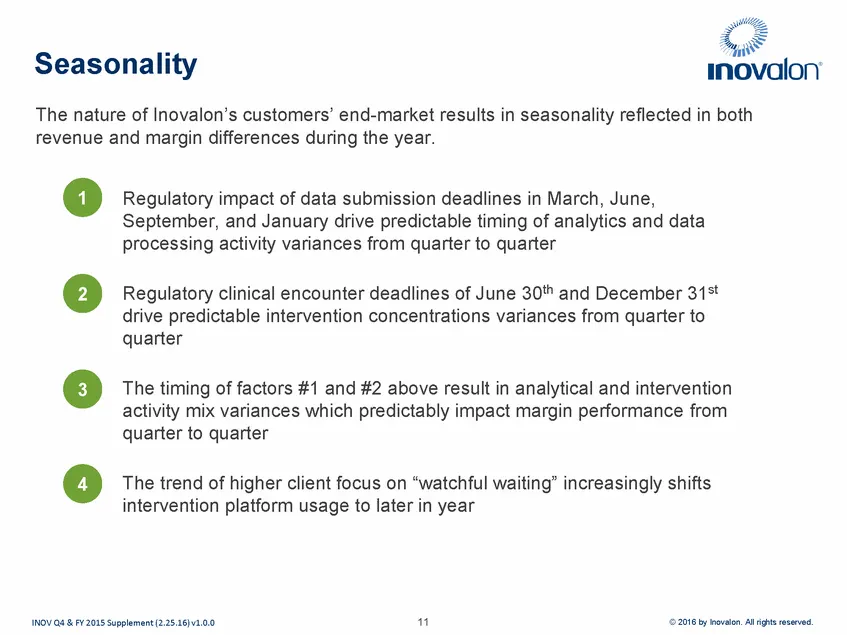
Seasonality The nature of Inovalon’s customers’ end-market results in seasonality reflected in both revenue and margin differences during the year. 1 Regulatory impact of data submission deadlines in March, June, September, and January drive predictable timing of analytics and data processing activi
Slide 11: Seasonality Trends – Revenue
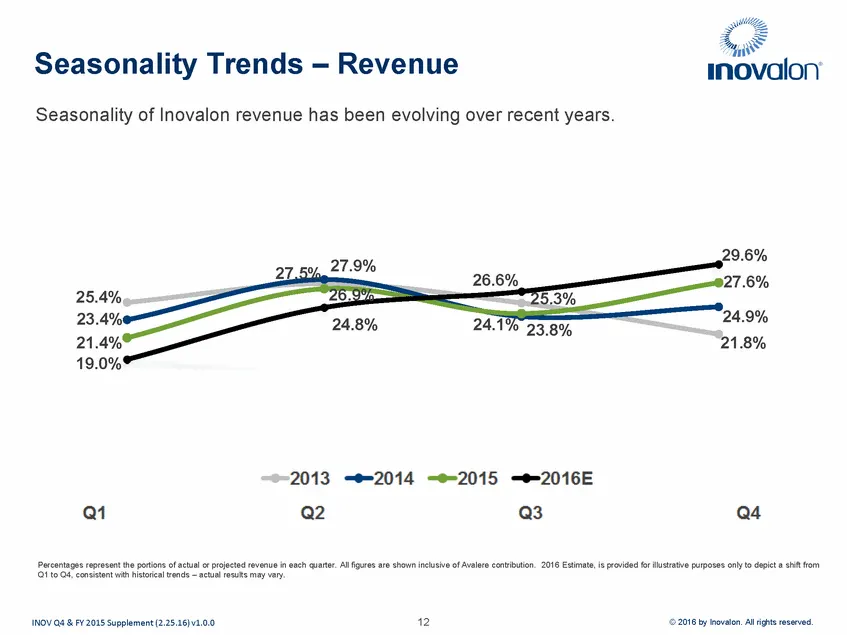
Seasonality Trends – Revenue Seasonality of Inovalon revenue has been evolving over recent years. 29.6% 27.6% 27.9% 26.9% 24.8% 27.5% 26.6% 25.4% 23.4% 21.4% 19.0% 25.3% 23.8% 24.9% 21.8% 24.1% Percentages represent the portions of actual or projected revenue in each quarter. All figures are shown i
Slide 12: Revenue Components
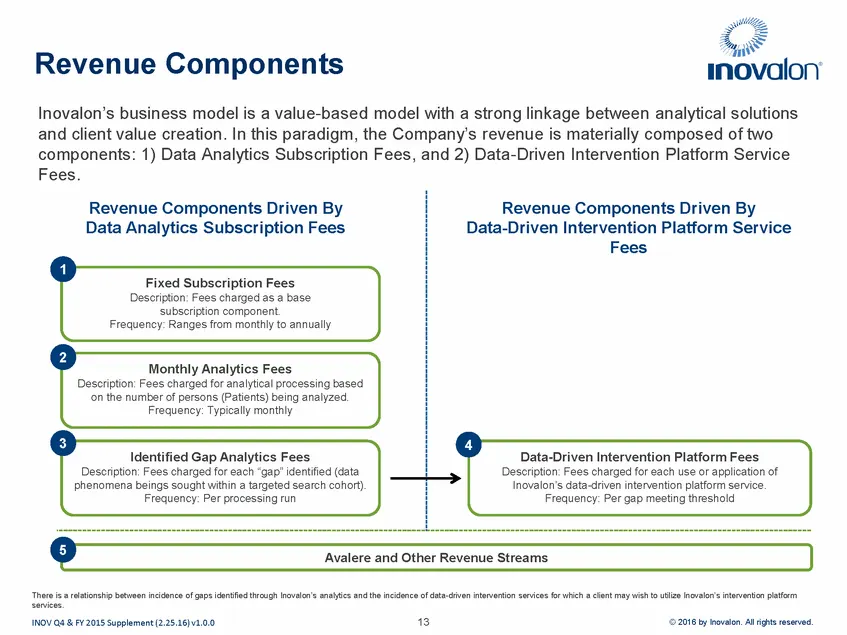
Revenue Components Inovalon’s business model is a value-based model with a strong linkage between analytical solutions and client value creation. In this paradigm, the Company’s revenue is materially composed of two components: 1) Data Analytics Subscription Fees, and 2) Data-Driven Intervention Pla
Slide 13: Financial Modeling
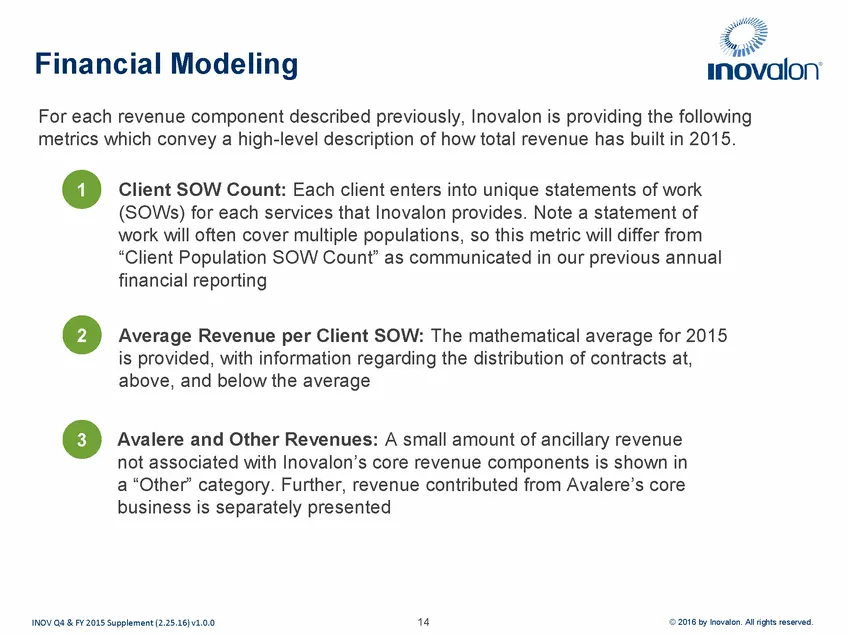
Financial Modeling For each revenue component described previously, Inovalon is providing the following metrics which convey a high-level description of how total revenue has built in 2015. 1 Client SOW Count: Each client enters into unique statements of work (SOWs) for each services that Inovalon p
Slide 14: Fixed Subscription Fees
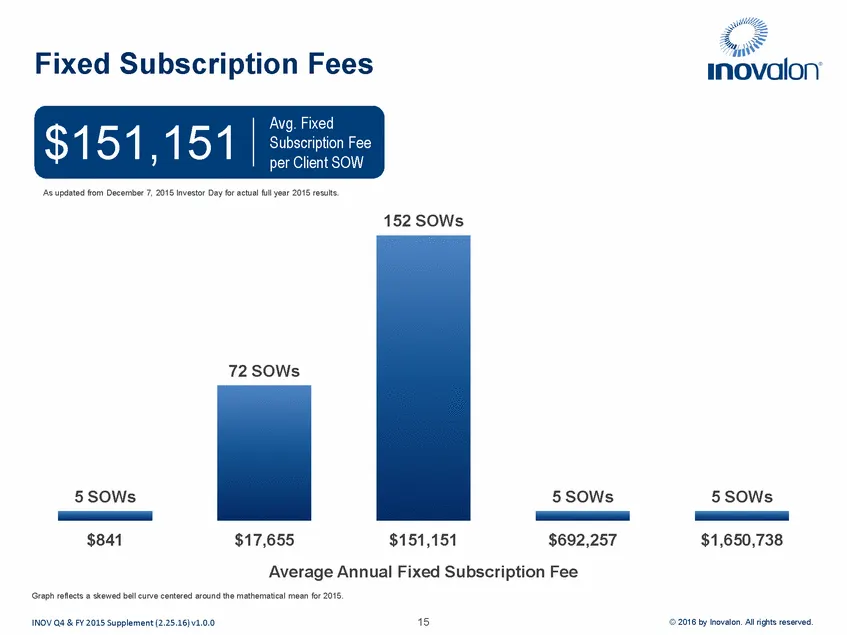
Fixed Subscription Fees Avg. Fixed Subscription Fee per Client SOW $151,151 As updated from December 7, 2015 Investor Day for actual full year 2015 results. 152 SOWs 72 SOWs 5 SOWs 5 SOWs 5 SOWs $841 $17,655 $151,151 $692,257 $1,650,738 Average Annual Fixed Subscription Fee Graph reflects a skewed b
Slide 15: Monthly Analytics Fees
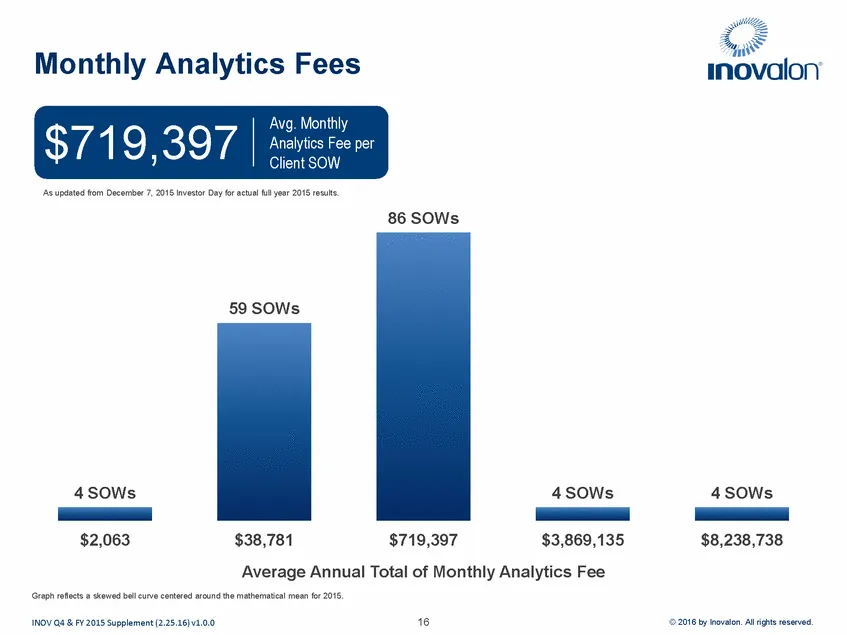
Monthly Analytics Fees Avg. Monthly Analytics Fee per Client SOW $719,397 As updated from December 7, 2015 Investor Day for actual full year 2015 results. 86 SOWs 59 SOWs 4 SOWs 4 SOWs 4 SOWs $2,063 $38,781 $719,397 $3,869,135 $8,238,738 Average Annual Total of Monthly Analytics Fee Graph reflects a
Slide 16: Identified Gap Analytics Fee
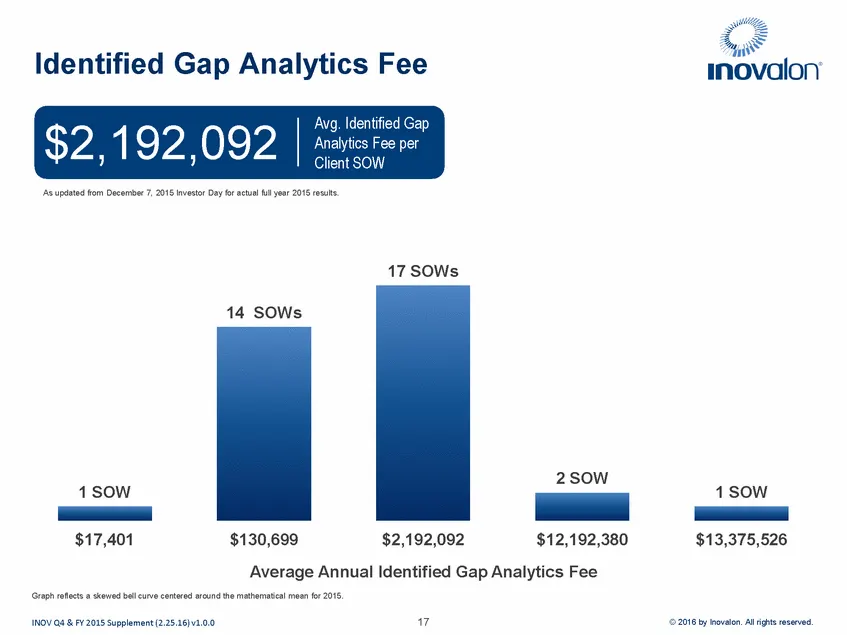
Identified Gap Analytics Fee Avg. Identified Gap Analytics Fee per Client SOW $2,192,092 As updated from December 7, 2015 Investor Day for actual full year 2015 results. 17 SOWs 14 SOWs 2 SOW 1 SOW 1 SOW $17,401 $130,699 $2,192,092 $12,192,380 $13,375,526 Average Annual Identified Gap Analytics Fee
Slide 17: Data-Driven Intervention Platform Fees
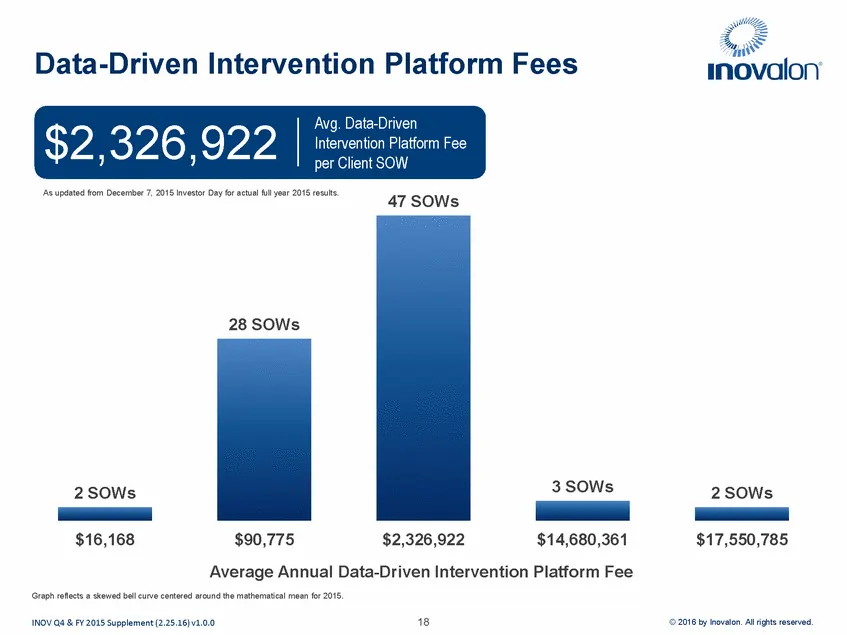
Data-Driven Intervention Platform Fees Avg. Data-Driven Intervention Platform Fee per Client SOW $2,326,922 As updated from December 7, 2015 Investor Day for actual full year 2015 results. 47 SOWs 28 SOWs 3 SOWs 2 SOWs 2 SOWs $16,168 $90,775 $2,326,922 $14,680,361 $17,550,785 Average Annual Data-Dri
Slide 18: Summary Revenue Model
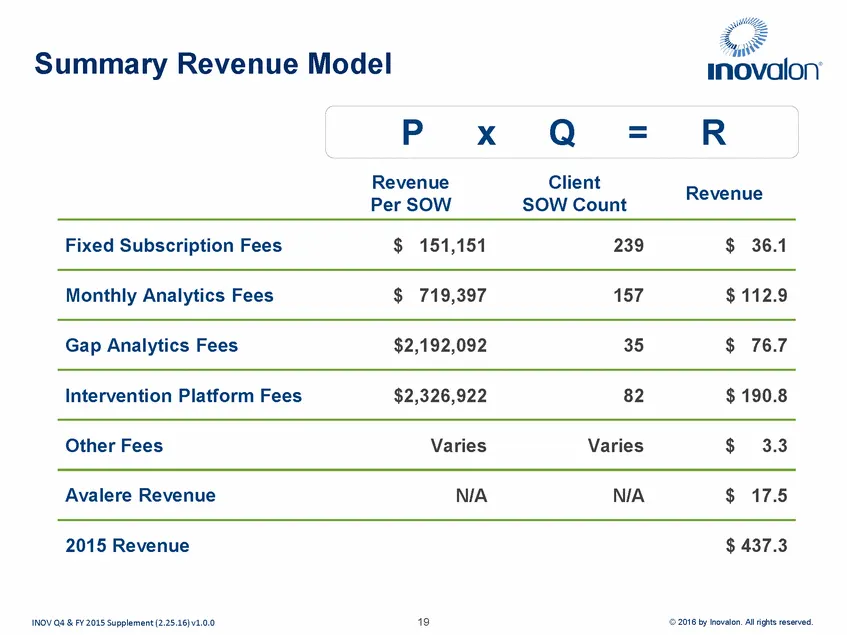
Summary Revenue Model P Revenue Per SOW x Q Client SOW Count = R Revenue 19 INOV Q4 & FY 2015 Supplement (2.25.16) v1.0.0 © 2016 by Inovalon. All rights reserved. Fixed Subscription Fees$151,151239$36.1 Monthly Analytics Fees$719,397157$ 112.9 Gap Analytics Fees$2,192,09235$76.7 Intervention Platfor
Slide 19: Balance Sheet Strength
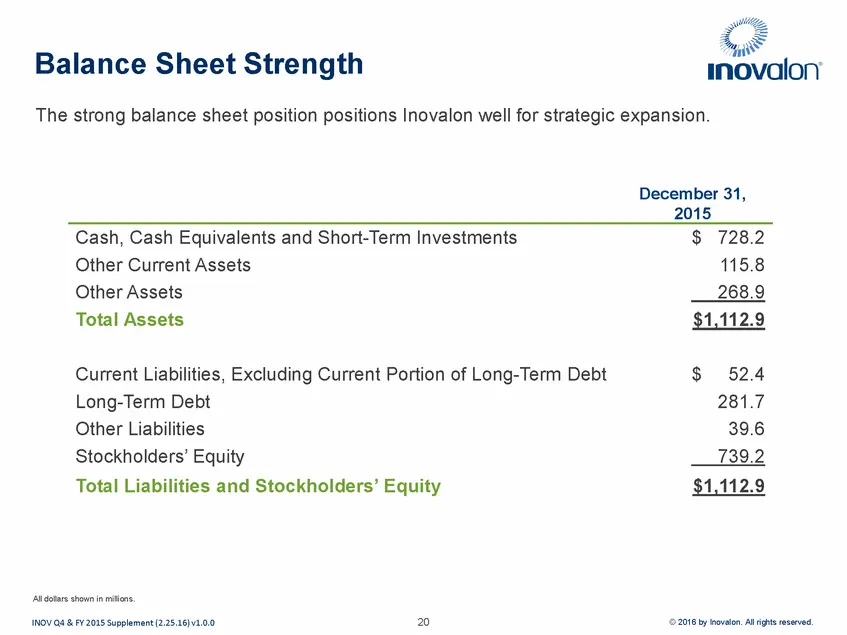
Balance Sheet Strength The strong balance sheet position positions Inovalon well for strategic expansion. All dollars shown in millions. 20 INOV Q4 & FY 2015 Supplement (2.25.16) v1.0.0 © 2016 by Inovalon. All rights reserved. December 31, 2015 Cash, Cash Equivalents and Short-Term Investments$728.2
Slide 20: Acquisition Focus
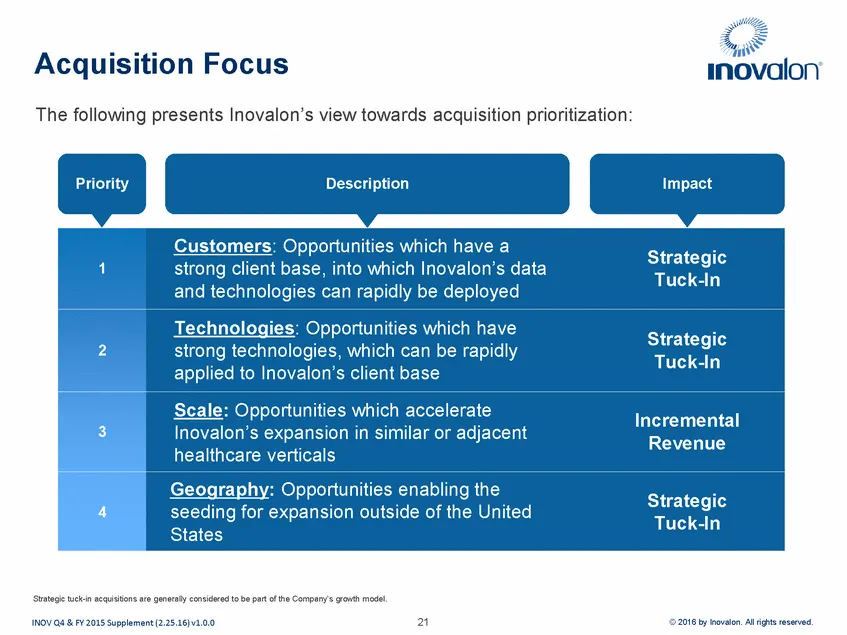
Acquisition Focus The following presents Inovalon’s view towards acquisition prioritization: Priority Description Impact Strategic strong client base, into which Inovalon’s data 1 Strategic strong technologies, which can be rapidly 2 Inovalon’s expansion in similar or adjacent 3 Revenue seeding for
Slide 21: Summary Highlights
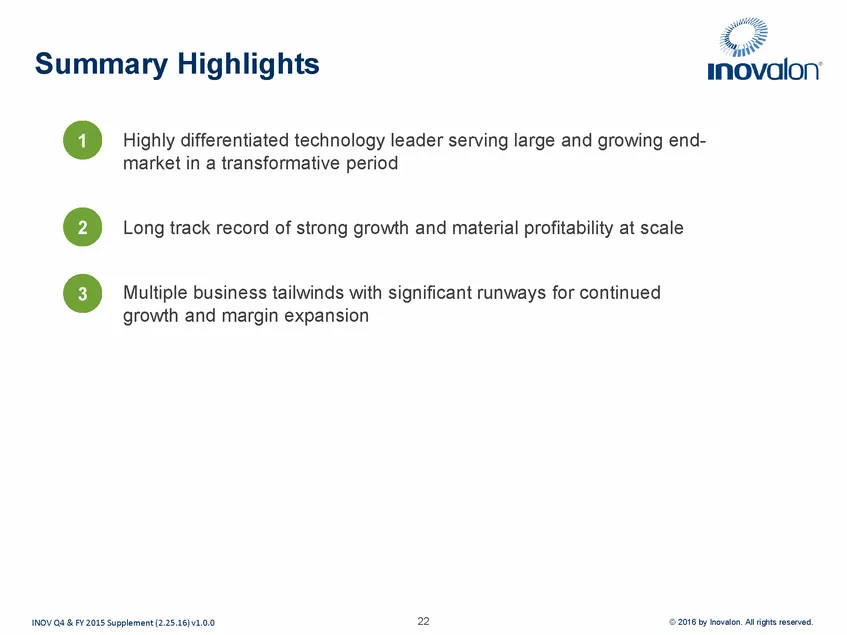
Summary Highlights 1 Highly differentiated technology leader serving large and growing end-market in a transformative period 2 Long track record of strong growth and material profitability at scale Multiple business tailwinds with significant runways for continued growth and margin expansion 3 22 IN
Slide 22: Our 5-Year View
Our 5-Year View •1 Growth at a rate of more than 2x that of our market, achieving revenue of more than $1 billion by 2020 •2 Margin expansion at a rate of more than 100 bp per year, achieving EBITDA margins of more than 40% by 2020 •3 Diversifying client base achieving customer de-concentration by 2
Slide 23: Our 5-Year View
. ae Our 5-Year View inovalon C1) Growth at a rate of more than 2x that of our market, achieving revenue of more than $1 billion by 2020 e Margin expansion at a rate of more than 100 bp per year, achieving EBITDA margins of more than 40% by 2020 © Diversifying client base achieving customer de-conce

Slide 24: Reconciliation of Net Income to Adjusted EBITDA
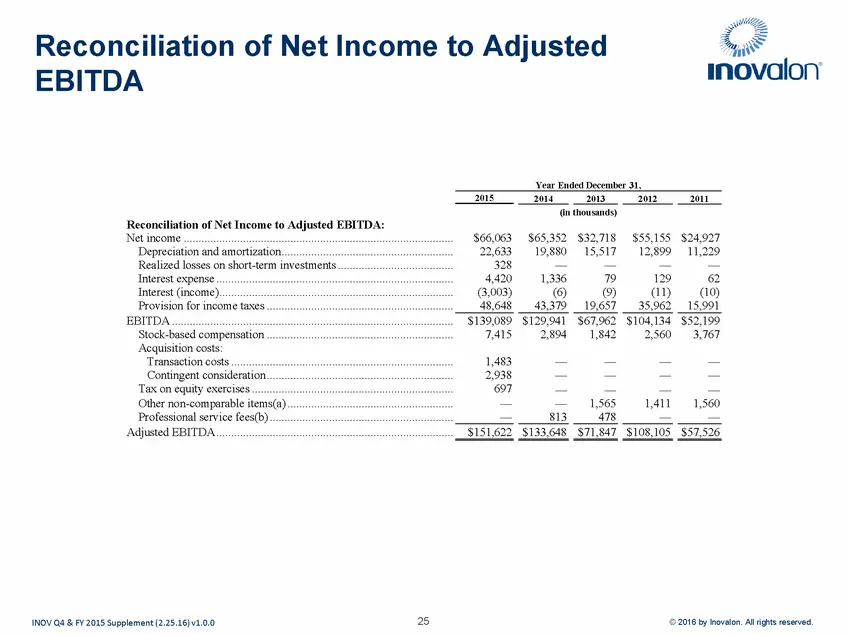
Reconciliation of Net Income to Adjusted EBITDA Year Ended December 31, 2015 2014 2013 2012 2011 (in thousands) Reconciliation of Net Income to Adjusted EBITDA: Net income ........................................................................................... Depreciation and amortization.......
Slide 25: Reconciliation of Net Income to Non-GAAP net income
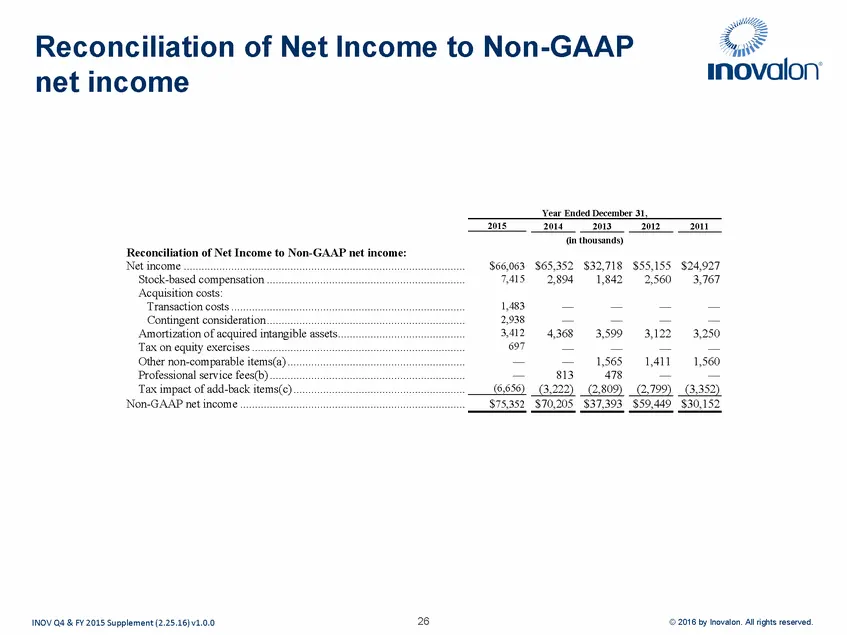
Reconciliation of Net Income to Non-GAAP net income Year Ended December 31, 2015 2014 2013 2012 2011 (in thousands) Reconciliation of Net Income to Non-GAAP net income: Net income ............................................................................................... Stock-based compensation
Slide 26: healthcare empowered
healthcare empowered INOV Q4 & FY 2015 Supplement (2.25.16) vl.O.O
Slide 27: Inovalon – healthcare empowered
hy, = Gi \\ ‘a wig inovalon healthcare empowered
Source: SEC EDGAR · 8-K filed Feb 25, 2016
More decks from Inovalon Holdings Inc
 Q2 2021 Earnings Presentation28 slides · Jul 28, 2021
 Q1 2021 Earnings Presentation28 slides · Apr 28, 2021
 Q4 2020 Earnings Presentation28 slides · Feb 3, 2021
 Q3 2020 Earnings Presentation33 slides · Oct 28, 2020
 Q2 2020 Earnings Presentation33 slides · Jul 29, 2020
 Q1 2020 Earnings Presentation34 slides · Apr 29, 2020