Thule Group AB · OMXSTO:THULE
Thule Group AB — Q4 2014 Earnings Presentation
31 slides from Thule Group AB's earnings presentation, Feb 12, 2015
Slide 1: Roadshow Presentation
Roadshow Presentation February 2015
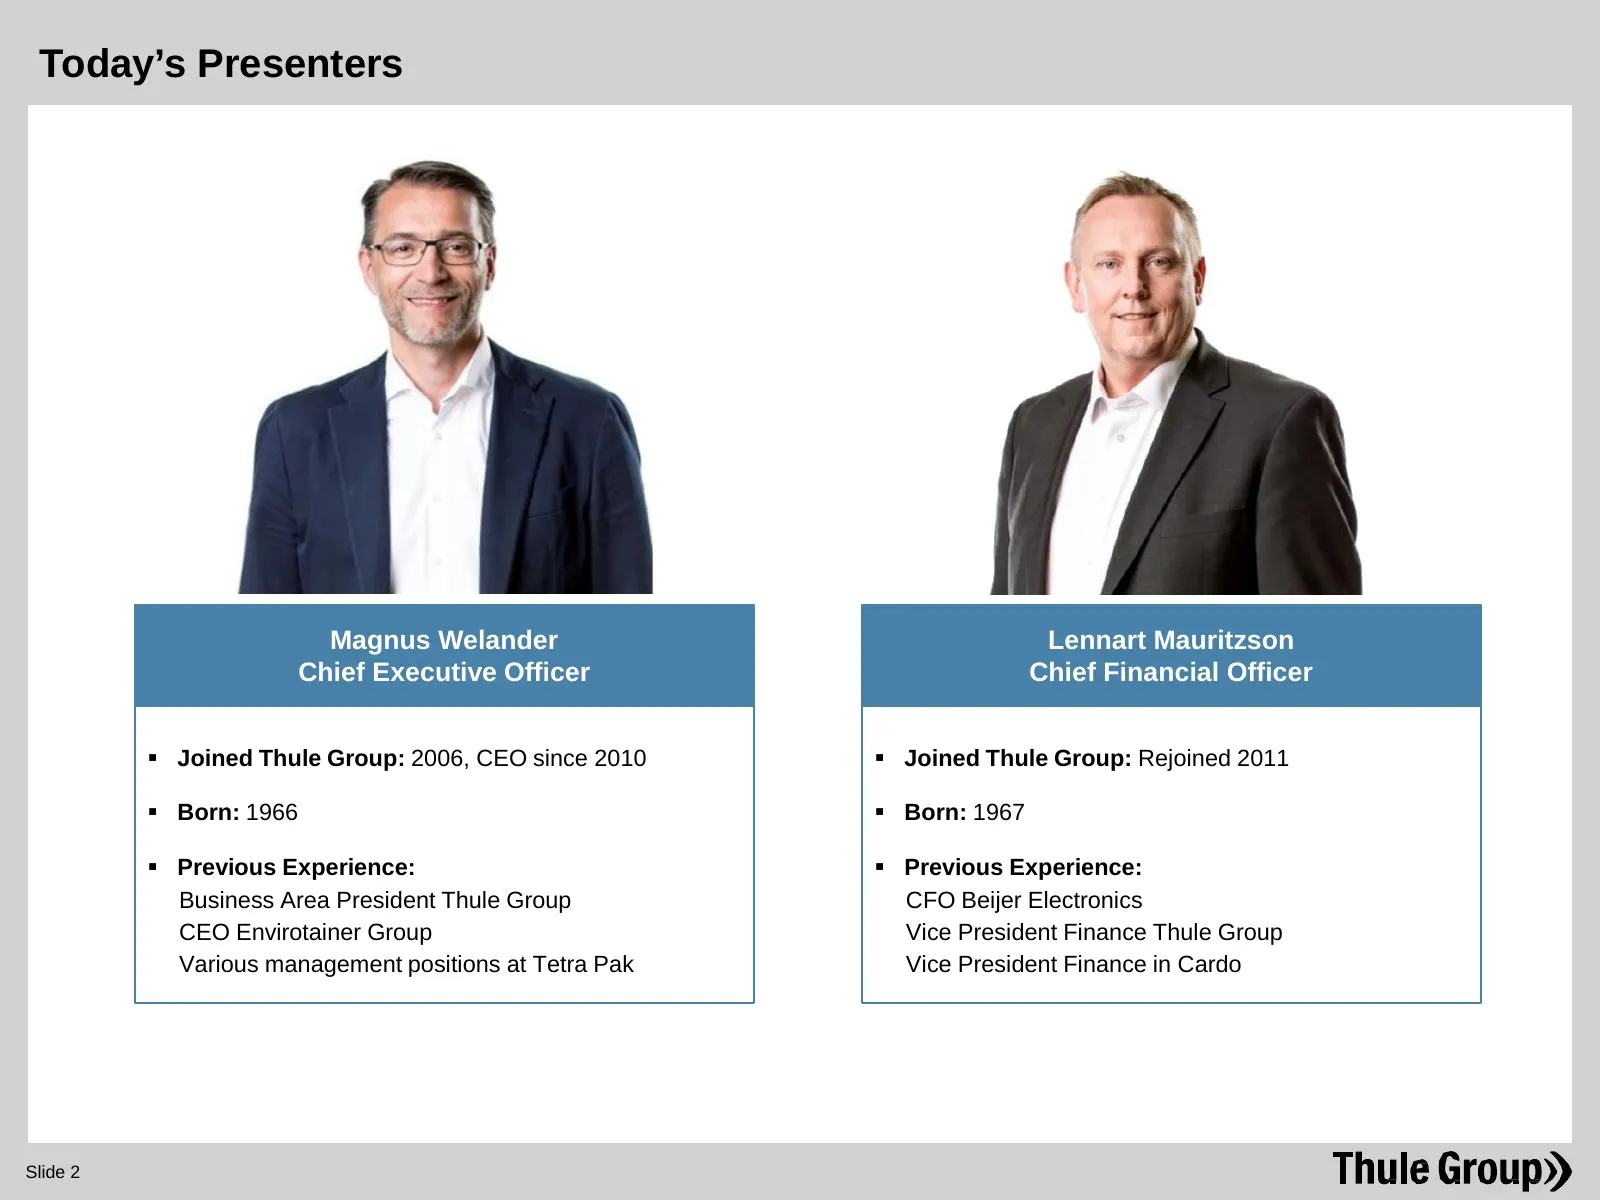
Slide 2: Today's Presenters
Today’s Presenters Magnus Welander Lennart Mauritzson Chief Executive Officer Chief Financial Officer Joined Thule Group: 2006, CEO since 2010 Joined Thule Group: Rejoined 2011 Born: 1966 Born: 1967 Previous Experience: Previous Experience: Business Area President Thule Group CFO Beijer
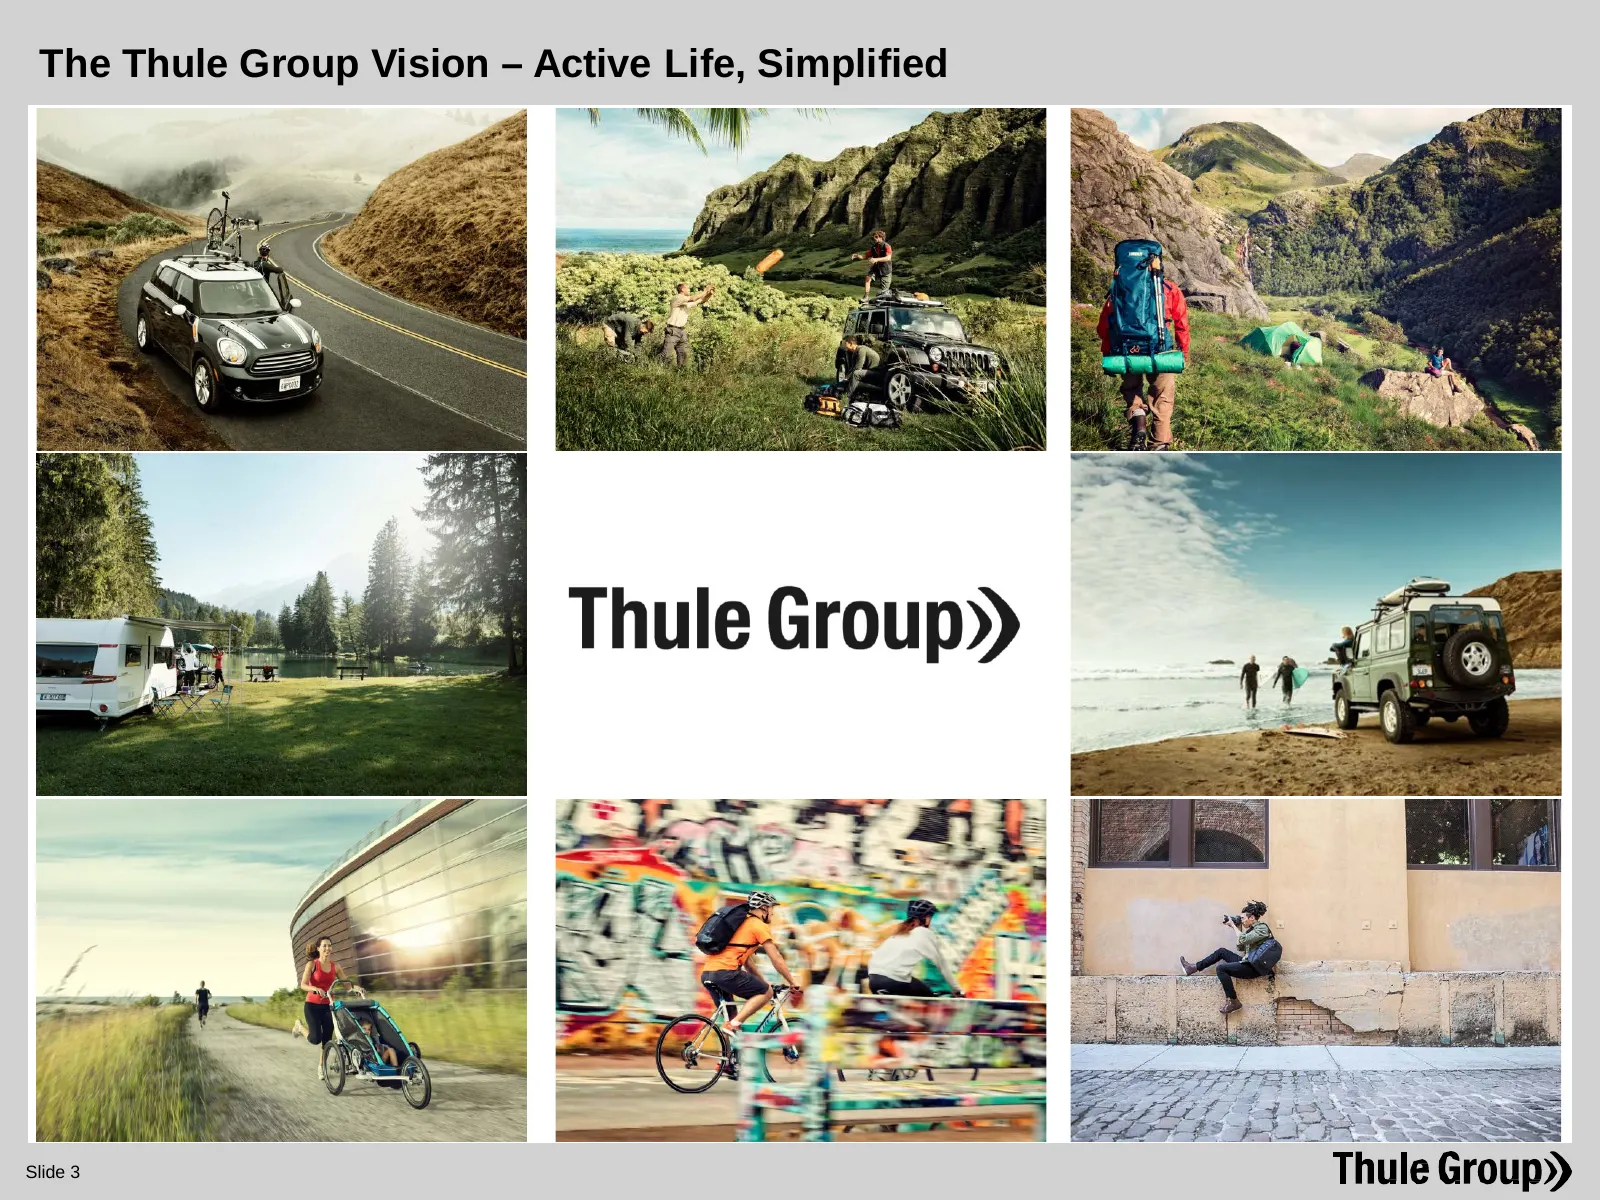
Slide 3: The Thule Group Vision – Active Life, Simplified
The Thule Group Vision – Active Life, Simplified Slide 3
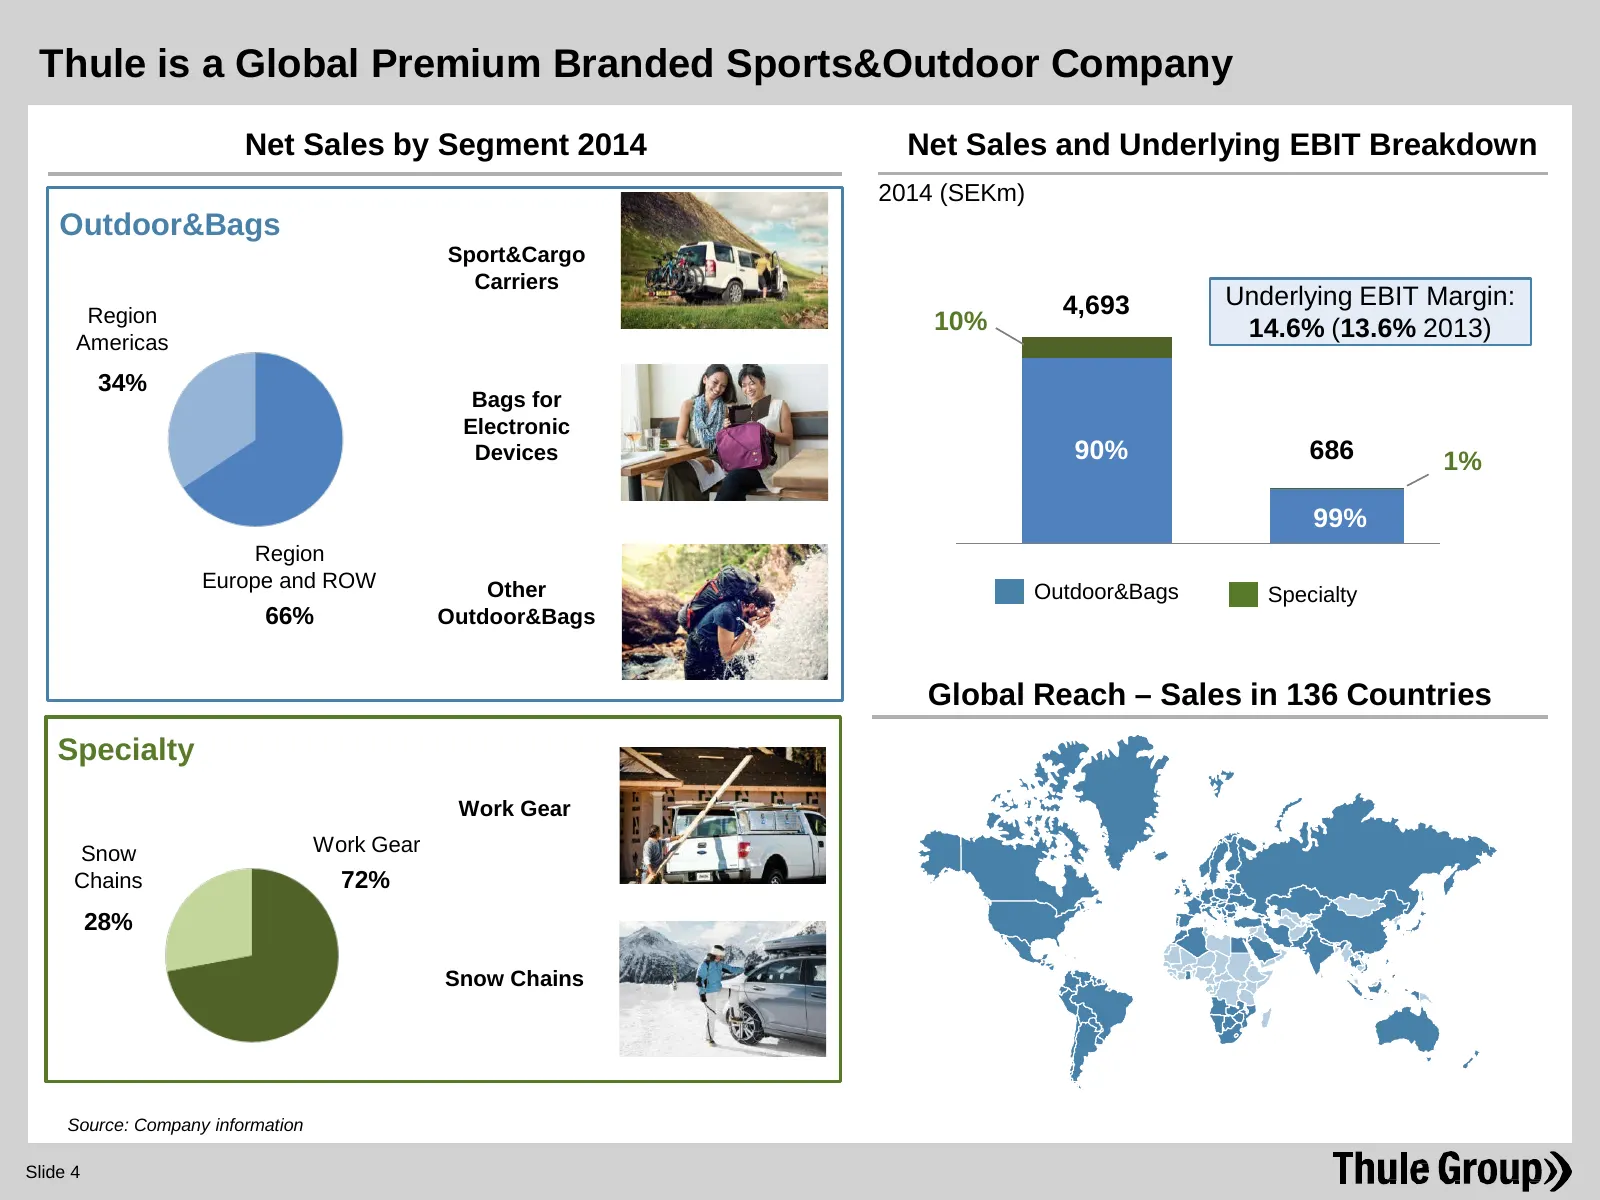
Slide 4: Thule is a Global Premium Branded Sports&Outdoor Company
Thule is a Global Premium Branded Sports&Outdoor Company Net Sales by Segment 2014 Net Sales and Underlying EBIT Breakdown 2014 (SEKm) Outdoor&Bags Sport&Cargo Carriers 4,693 Underlying EBIT Margin: Region 10% Americas 14.6% (13.6% 2013) 34% Bags for Electronic Devices 90% 686 1% 99% Region Europe a
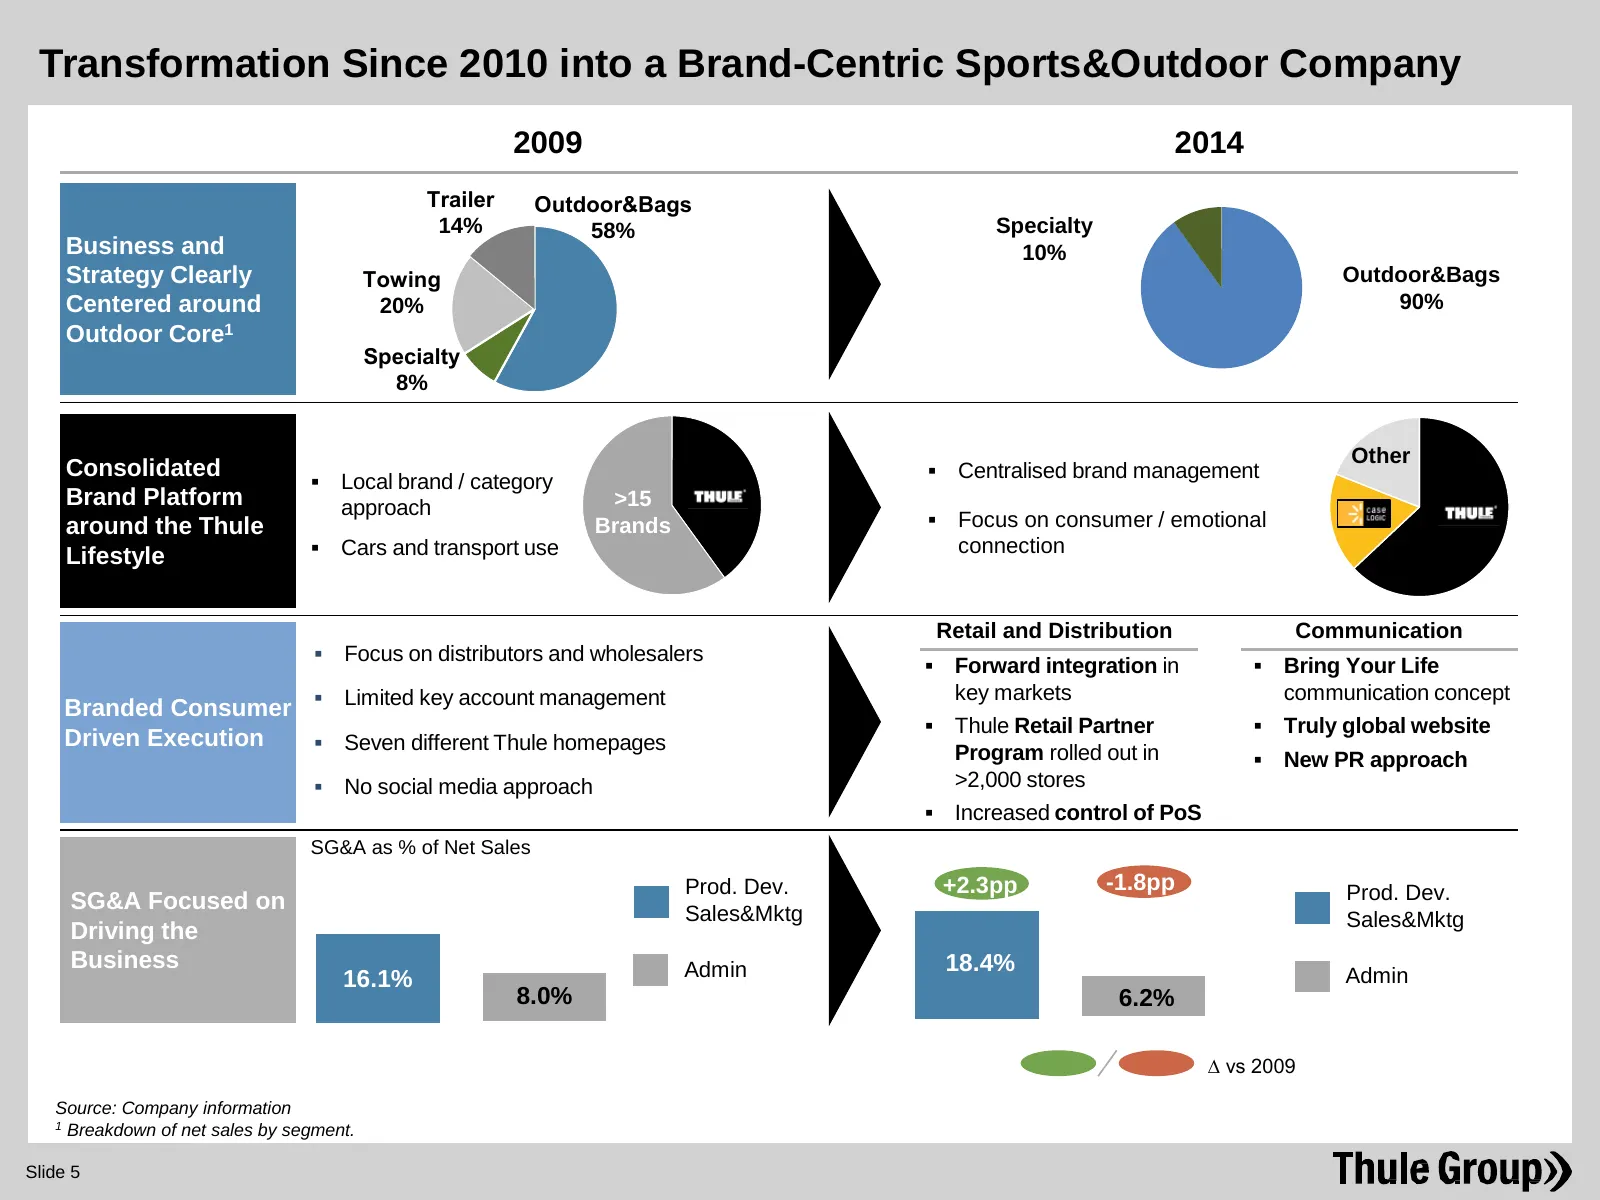
Slide 5: Transformation Since 2010 into a Brand-Centric Sports&Outdoor Company
Transformation Since 2010 into a Brand-Centric Sports&Outdoor Company Point 1 2009 2014 Trailer Outdoor&Bags 14% 58% Specialty Business and 10% Strategy Clearly Towing Outdoor&Bags Centered around 20% 90% Outdoor Core1 Specialty 8% Other Consolidated Centralised brand management Local brand
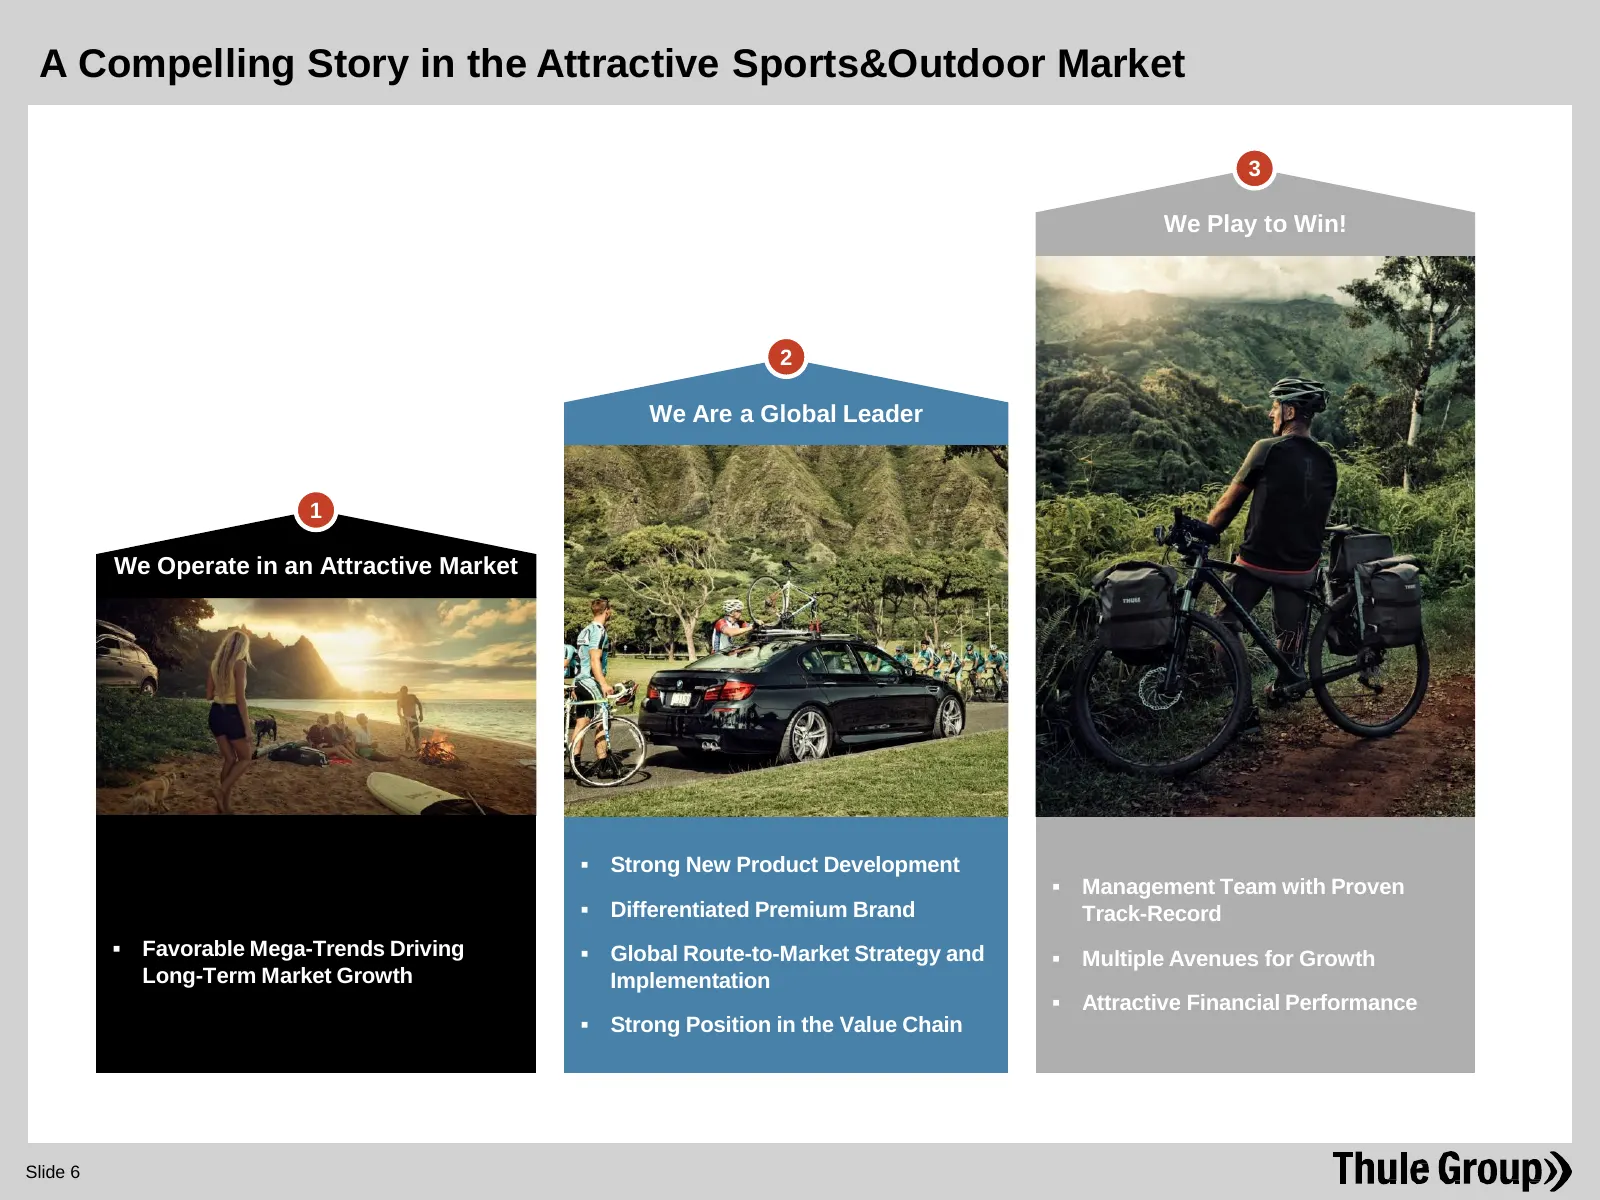
Slide 6: A Compelling Story in the Attractive Sports&Outdoor Market
A Compelling Story in the Attractive Sports&Outdoor Market 3 We Play to Win! 2 We Are a Global Leader 1 We Operate in an Attractive Market Strong New Product Development Management Team with Proven Differentiated Premium Brand Track-Record Favorable Mega-Trends Driving Global Route-to-Mark
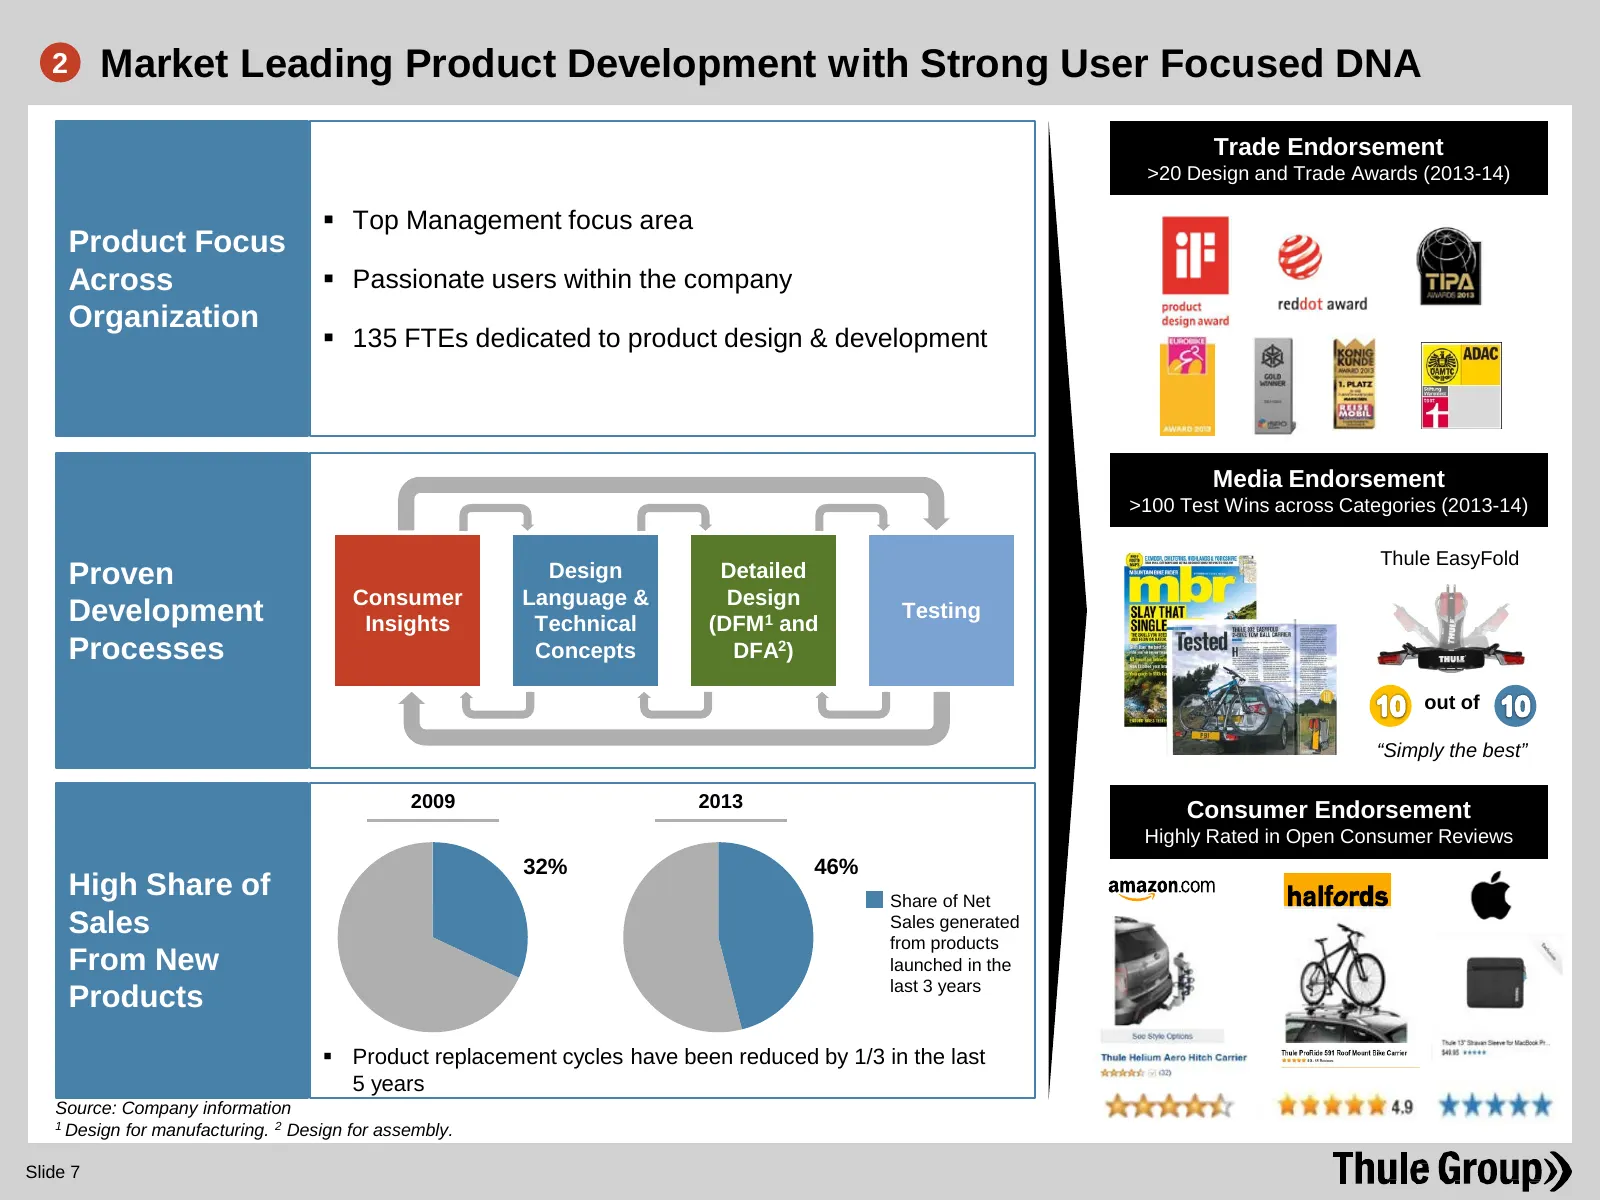
Slide 7: Market Leading Product Development with Strong User Focused DNA
2 Market Leading Product Development with Strong User Focused DNA Trade Endorsement >20 Design and Trade Awards (2013-14) Top Management focus area Product Focus Across Passionate users within the company Organization 135 FTEs dedicated to product design & development Media Endorsement >100 Te
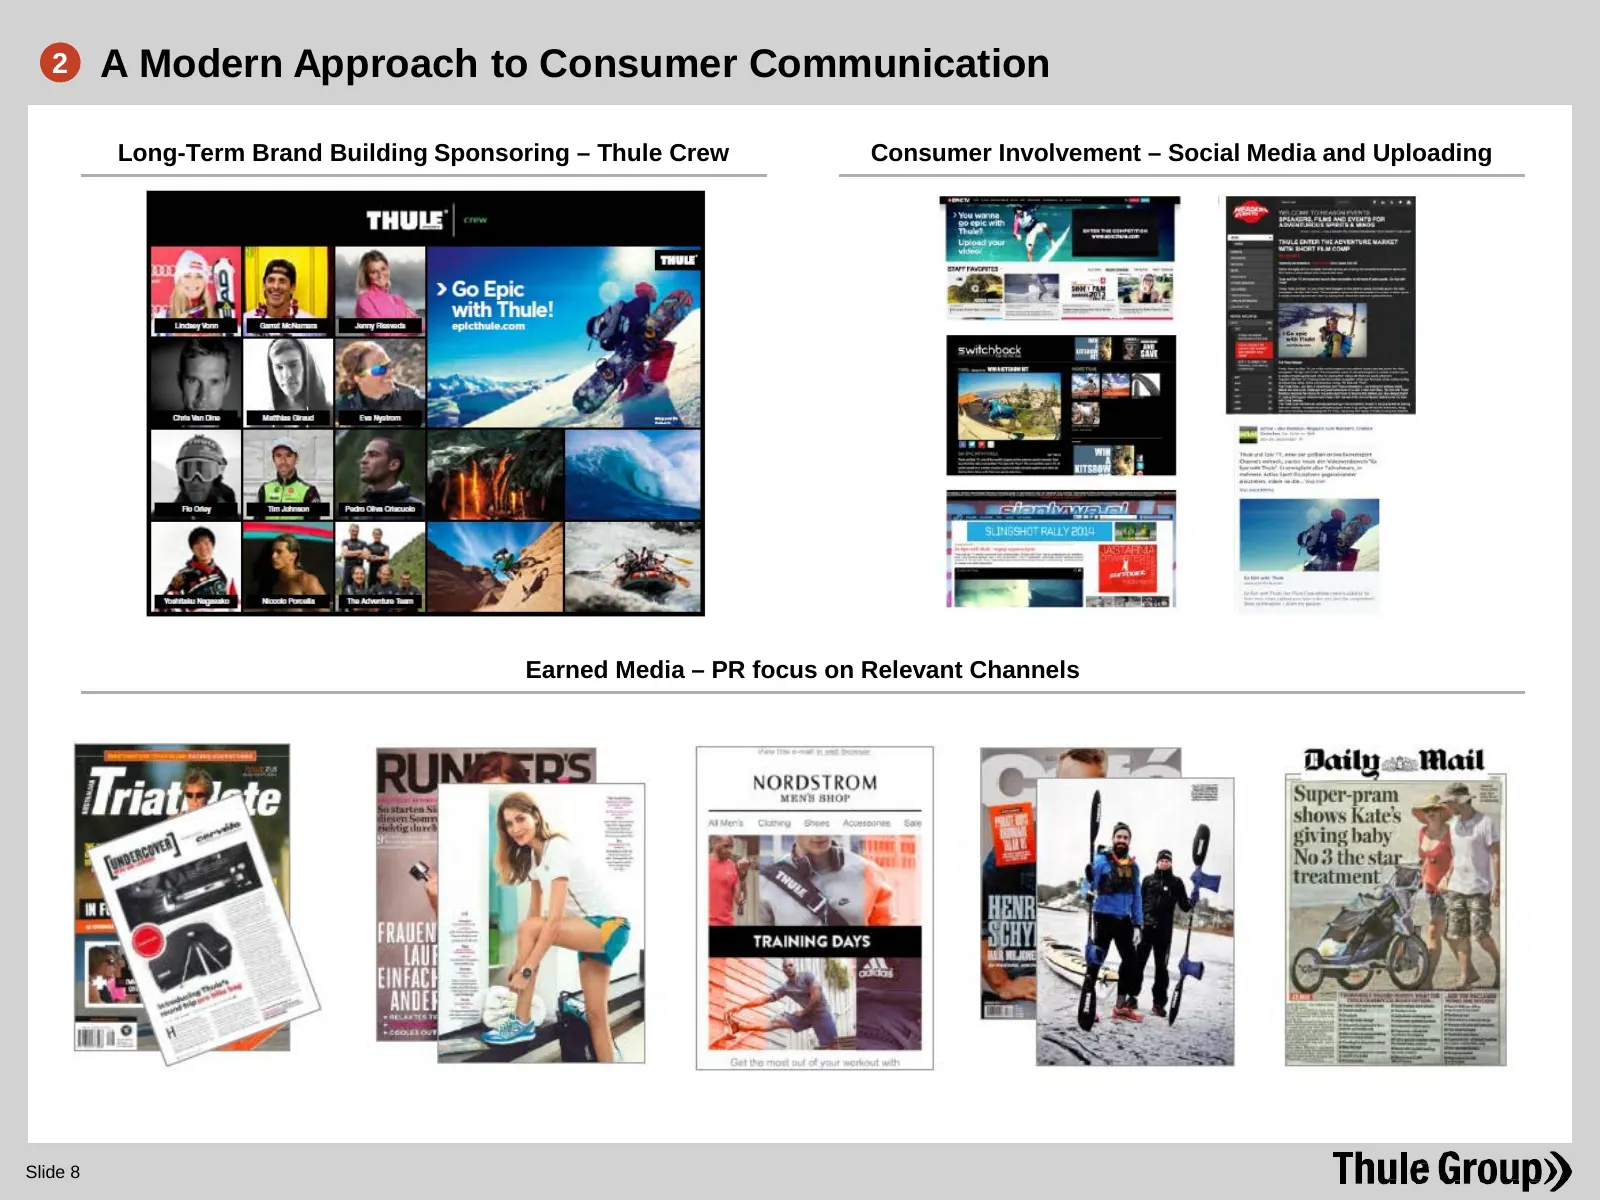
Slide 8: A Modern Approach to Consumer Communication
2 A Modern Approach to Consumer Communication Long-Term Brand Building Sponsoring – Thule Crew Consumer Involvement – Social Media and Uploading Earned Media – PR focus on Relevant Channels Slide 8
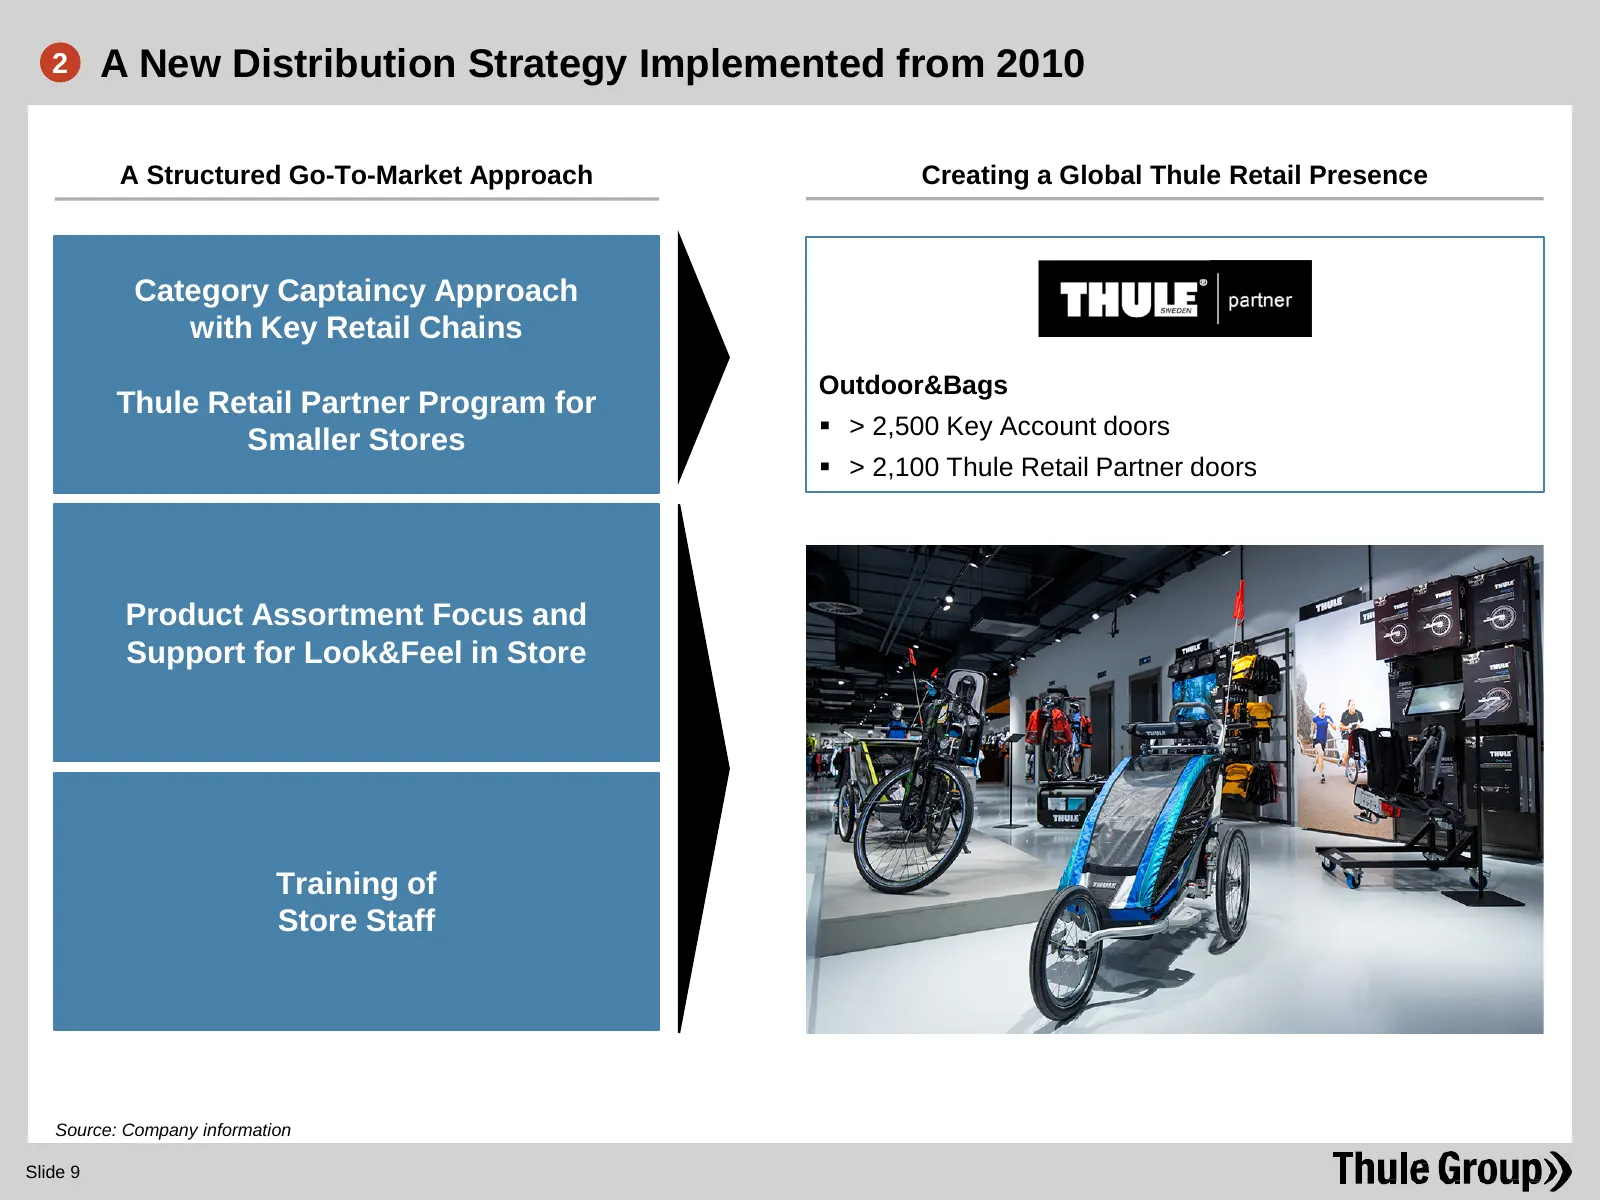
Slide 9: A New Distribution Strategy Implemented from 2010
2 A New Distribution Strategy Implemented from 2010 A Structured Go-To-Market Approach Creating a Global Thule Retail Presence Category Captaincy Approach with Key Retail Chains Outdoor&Bags Thule Retail Partner Program for > 2,500 Key Account doors Smaller Stores > 2,100 Thule Retail Partner do
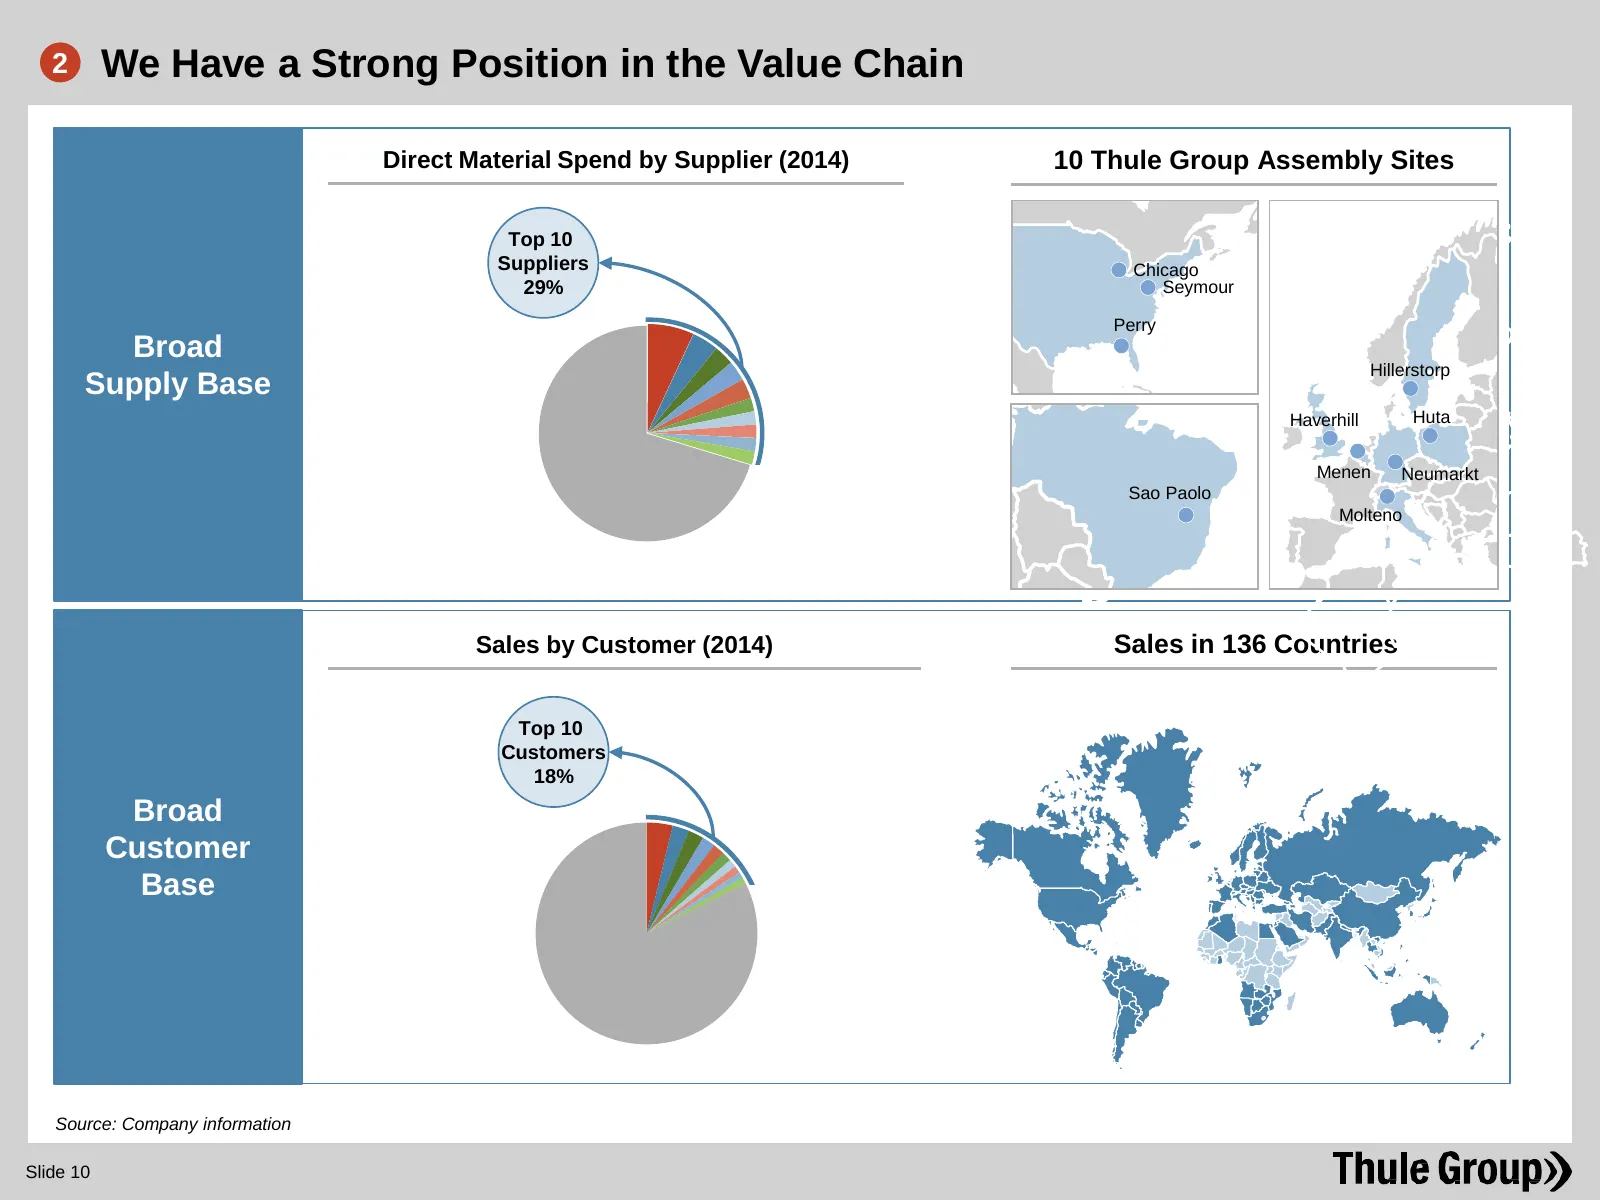
Slide 10: We Have a Strong Position in the Value Chain
2 We Have a Strong Position in the Value Chain Direct Material Spend by Supplier (2014) 10 Thule Group Assembly Sites Top 10 Suppliers Chicago 29% Seymour Perry Broad Hillerstorp Supply Base Haverhill Huta Menen Neumarkt Sao Paolo Molteno Sales by Customer (2014) Sales in 136 Countries Top 10 Custom
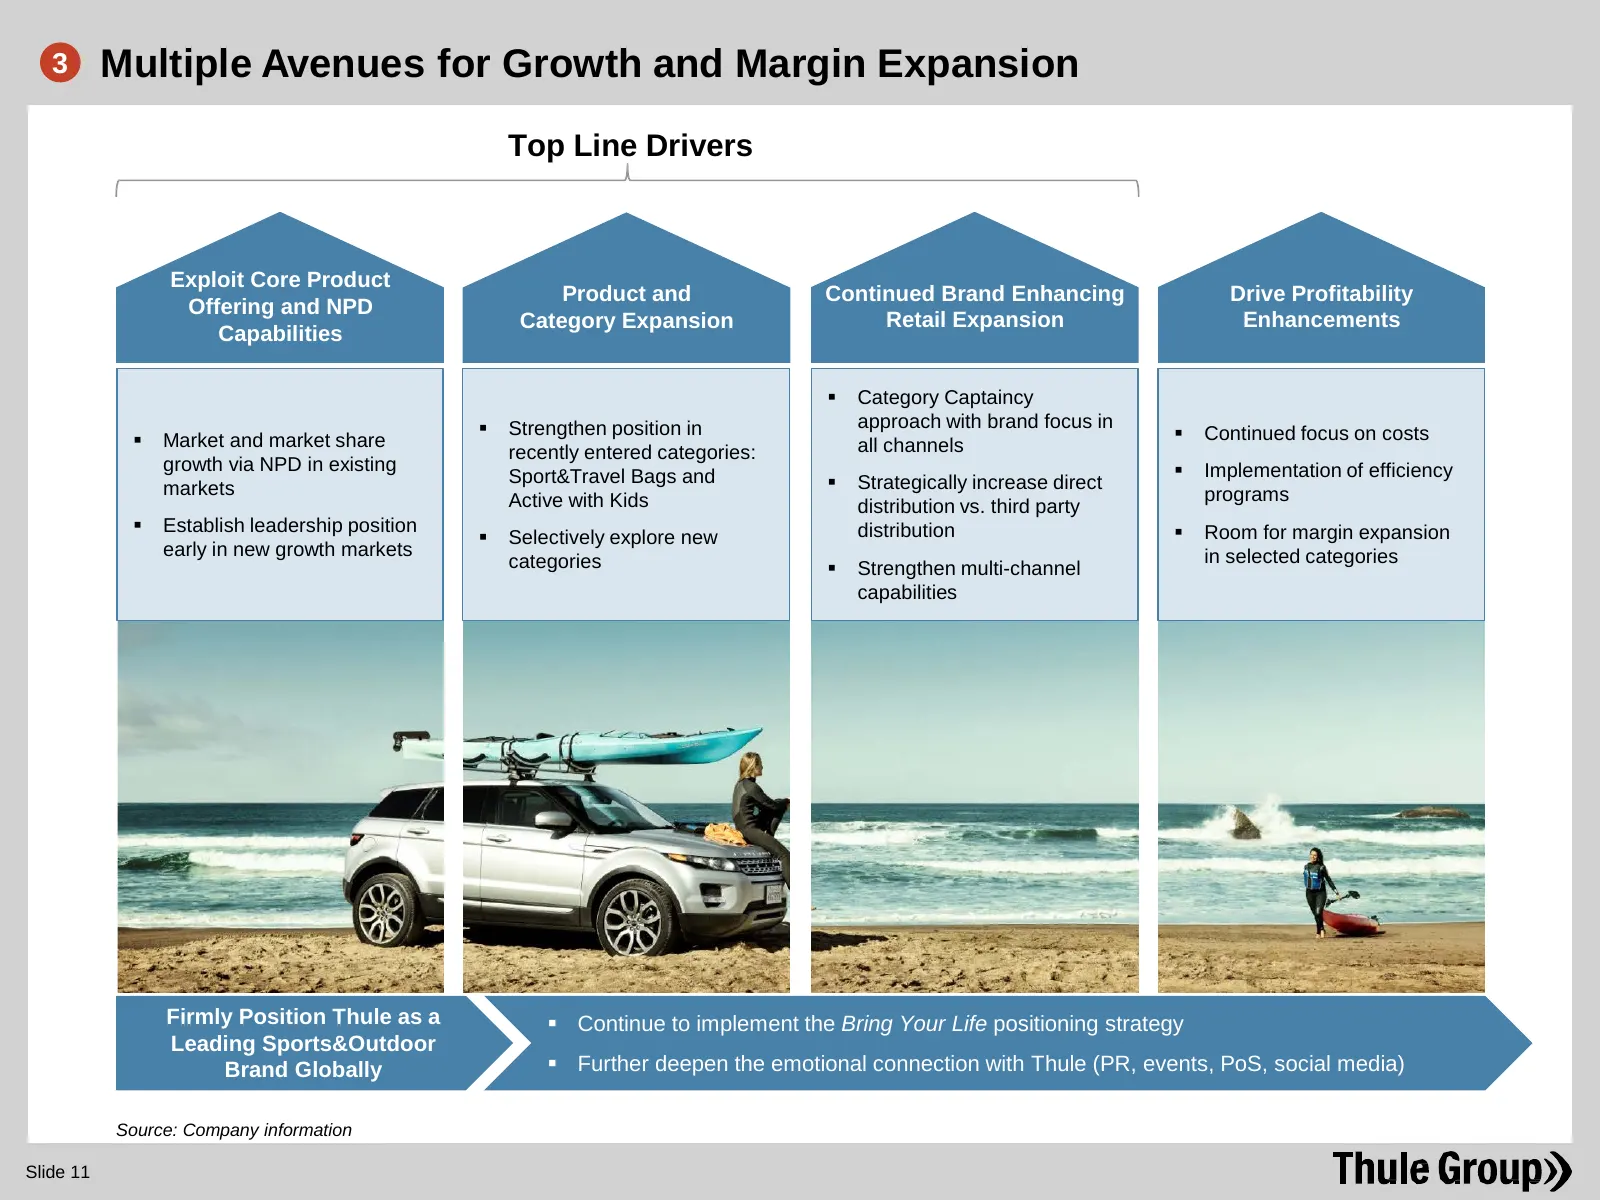
Slide 11: Multiple Avenues for Growth and Margin Expansion
3 Multiple Avenues for Growth and Margin Expansion Top Line Drivers Exploit Core Product Product and Continued Brand Enhancing Drive Profitability Offering and NPD Category Expansion Retail Expansion Enhancements Capabilities Category Captaincy Strengthen position in approach with brand focus in
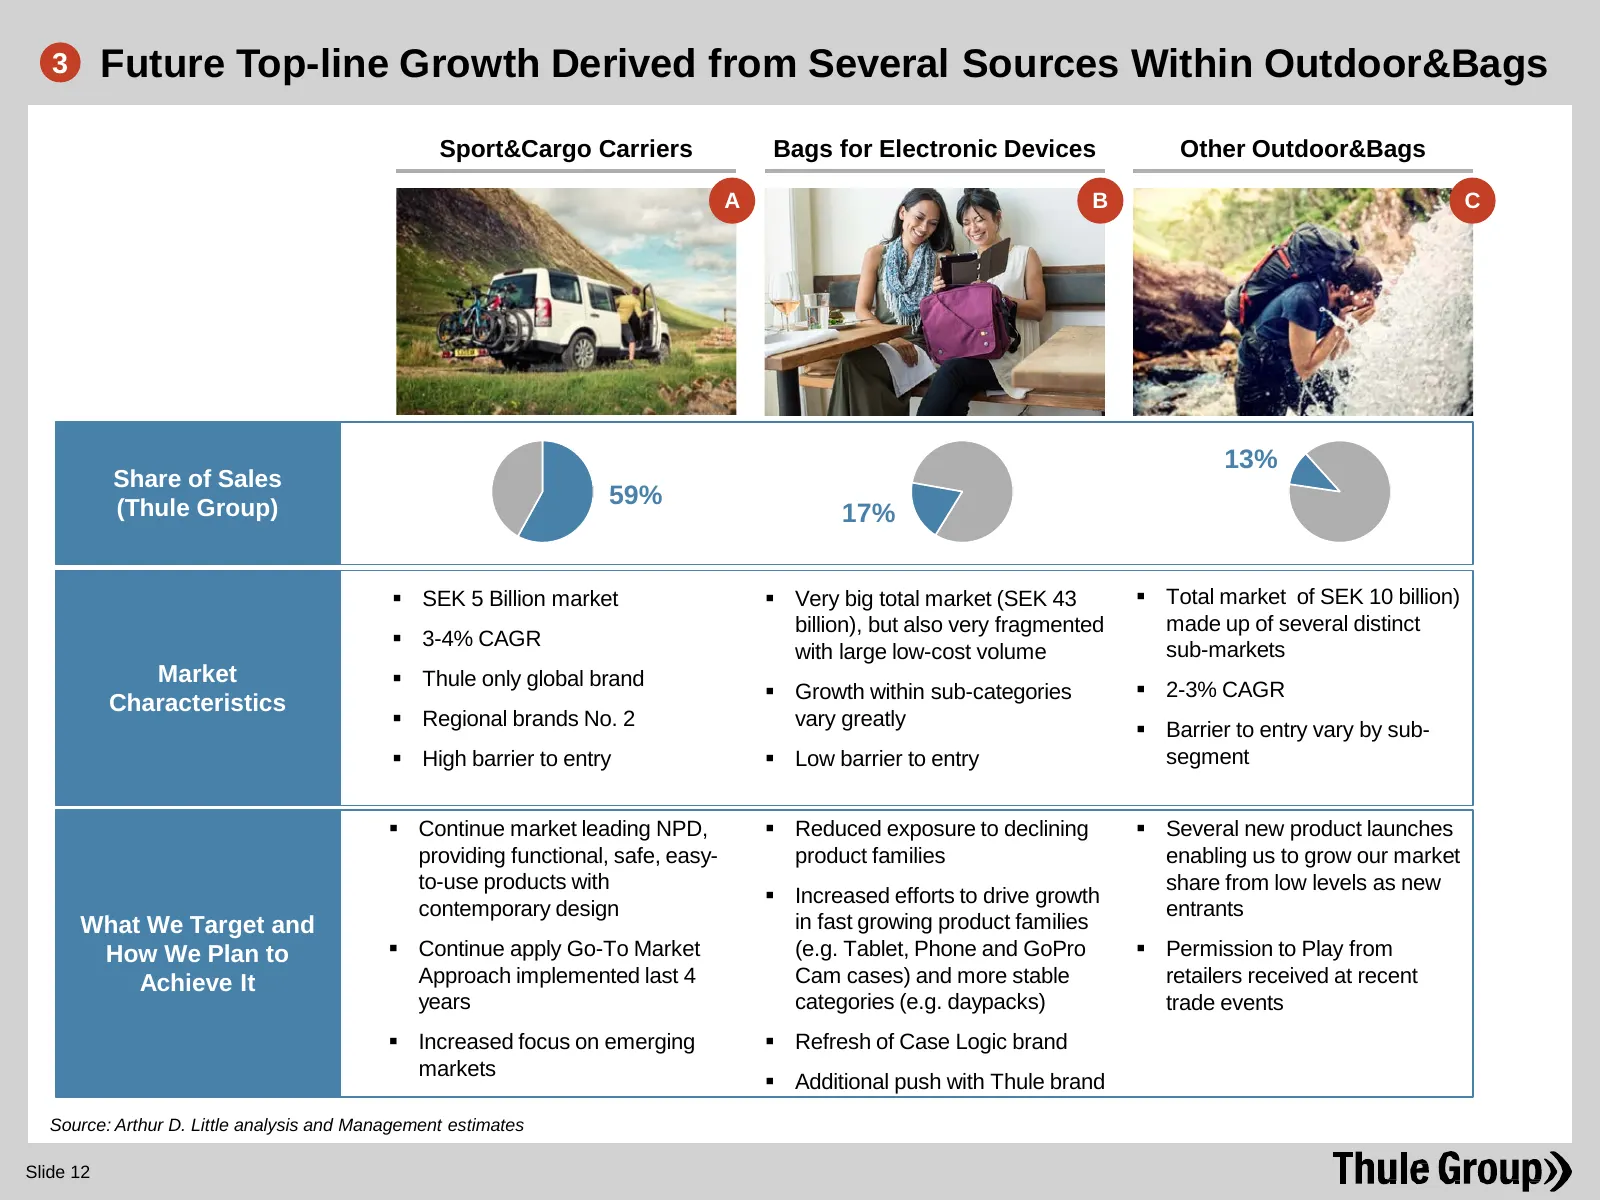
Slide 12: Future Top-line Growth Derived from Several Sources Within Outdoor&Bags
3 Future Top-line Growth Derived from Several Sources Within Outdoor&Bags Sport&Cargo Carriers Bags for Electronic Devices Other Outdoor&Bags A B C 13% Share of Sales (Thule Group) 59% 17% SEK 5 Billion market Very big total market (SEK 43 Total market of SEK 10 billion) billion), but also ver
Slide 13: Sport&Cargo Carriers – Leading Market Positions in All Regions
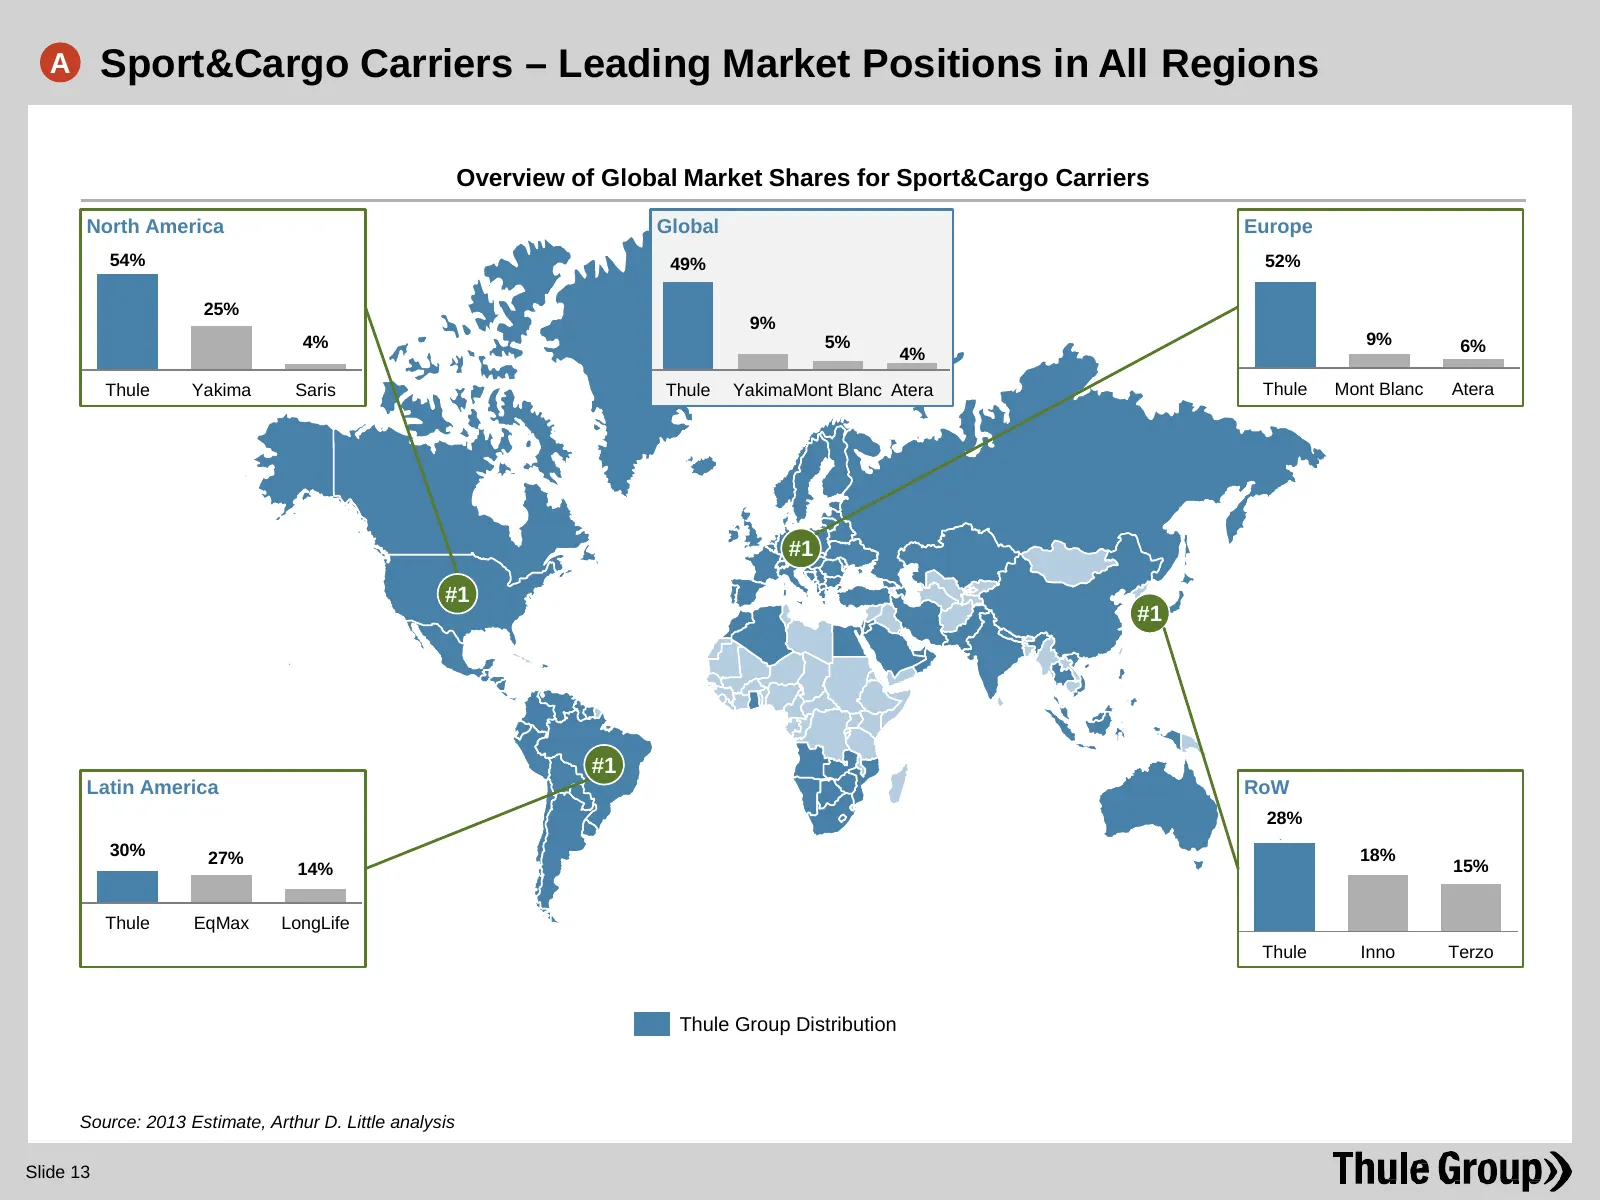
A Sport&Cargo Carriers – Leading Market Positions in All Regions Overview of Global Market Shares for Sport&Cargo Carriers North America Global Europe 54% 49% 52% 25% 9% 4% 5% 9% 6% 4% Thule Yakima Saris Thule YakimaMont Blanc Atera Thule Mont Blanc Atera #1 #1 #1 #1 Latin America RoW 28% 30% 27% 18
Slide 14: Sport&Cargo Carriers – Utilizing Market Leading Position to Drive Growth
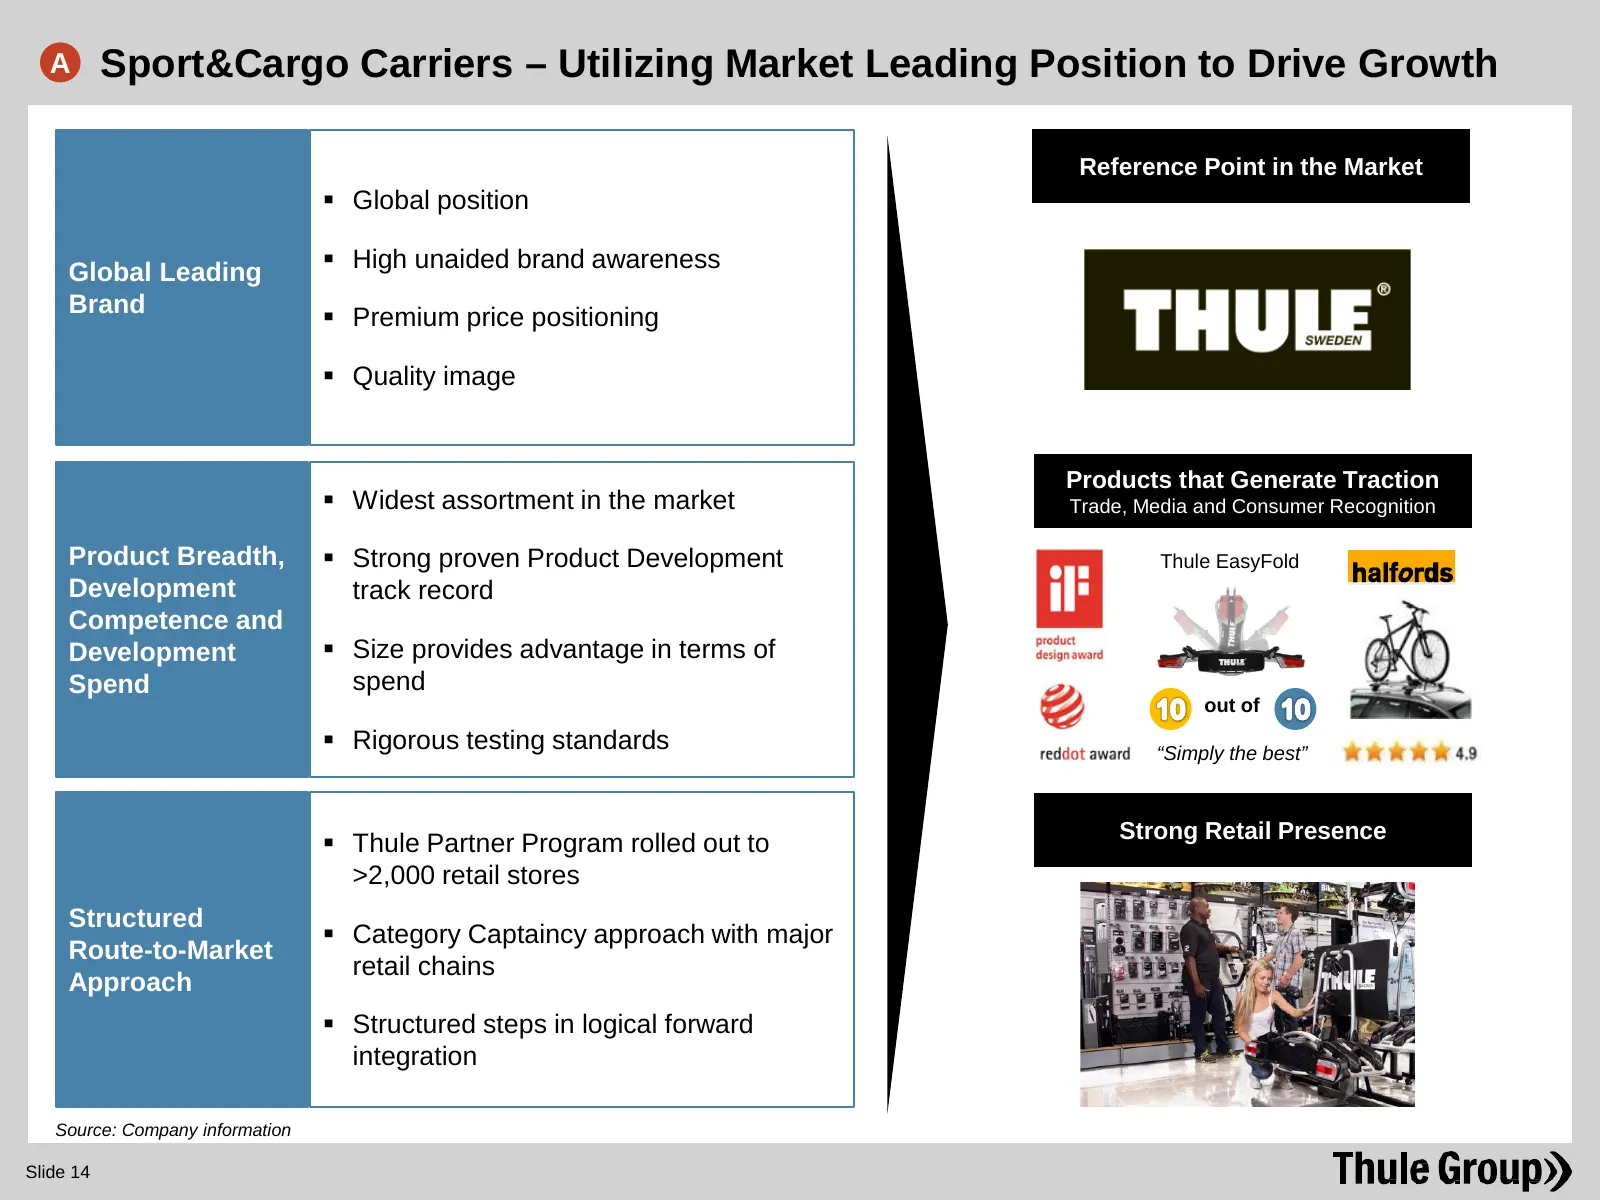
A Sport&Cargo Carriers – Utilizing Market Leading Position to Drive Growth Reference Point in the Market Global position High unaided brand awareness Global Leading Brand Premium price positioning Quality image Products that Generate Traction Widest assortment in the market Trade, Media an
Slide 15: Bags for Electronic Devices – Multiple Initiatives to Drive Growth
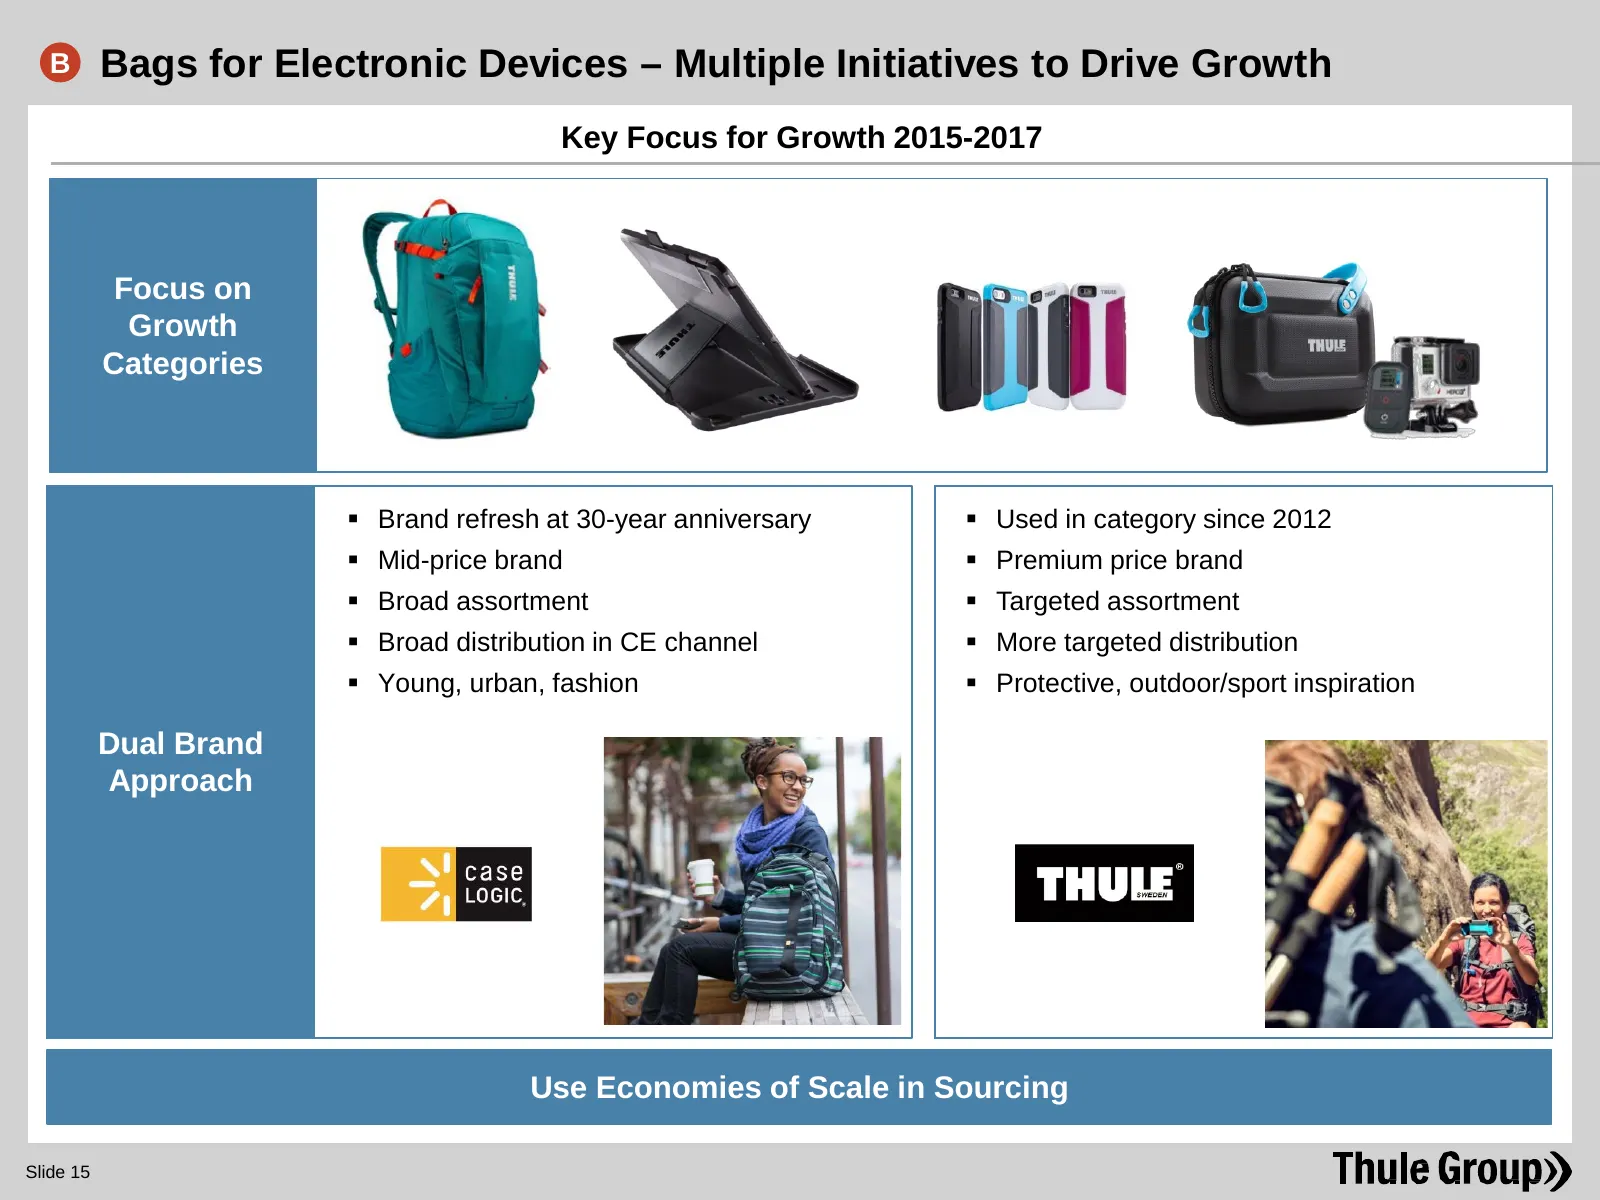
B Bags for Electronic Devices – Multiple Initiatives to Drive Growth Key Focus for Growth 2015-2017 Focus on Growth Categories Brand refresh at 30-year anniversary Used in category since 2012 Mid-price brand Premium price brand Broad assortment Targeted assortment Broad distribution in
Slide 16: Other Outdoor&Bags – Broad New Product Expansions 2014-2015
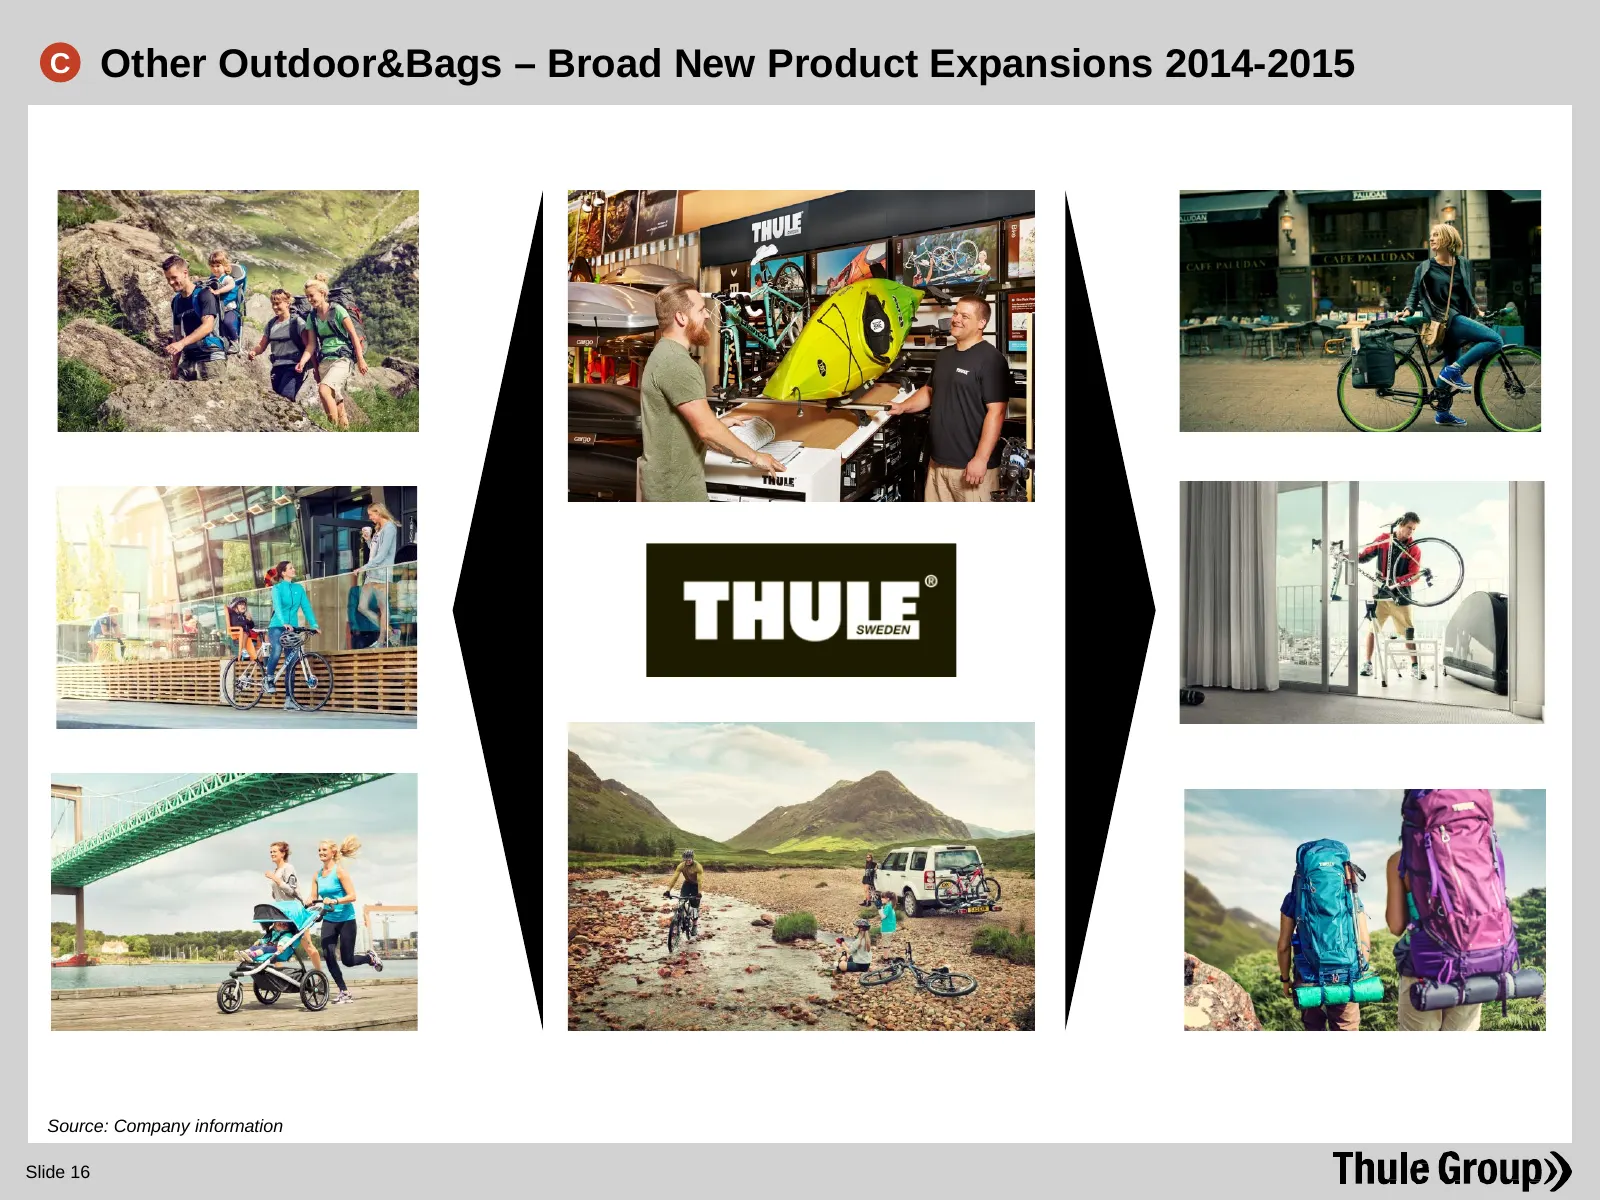
C Other Outdoor&Bags – Broad New Product Expansions 2014-2015 Source: Company information Slide 16
Slide 17: Other Outdoor&Bags – New Products Drive Growth
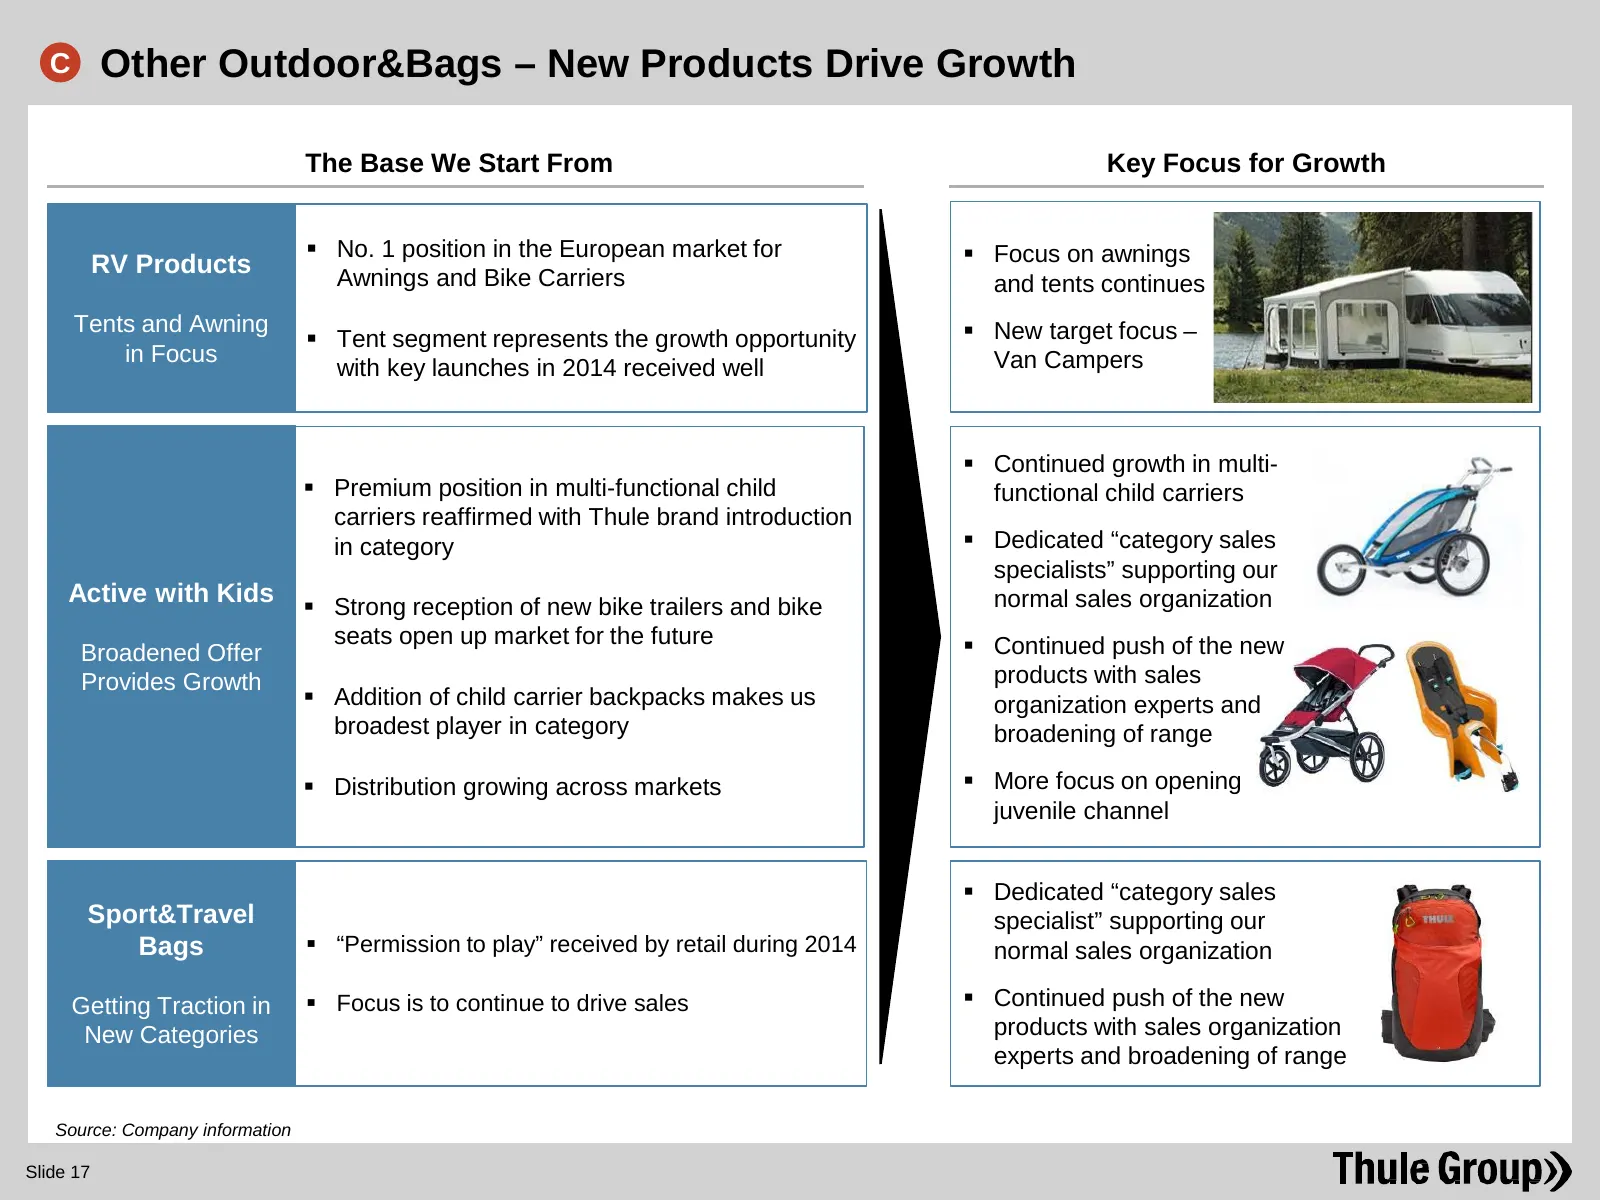
C Other Outdoor&Bags – New Products Drive Growth The Base We Start From Key Focus for Growth No. 1 position in the European market for Focus on awnings RV Products Awnings and Bike Carriers and tents continues Tents and Awning New target focus – Tent segment represents the growth opportunity
Slide 18: 2014 Results
2014 Results
Slide 19: Q4 2014 Highlights – Mild and late winter hurts Snow Chain sales
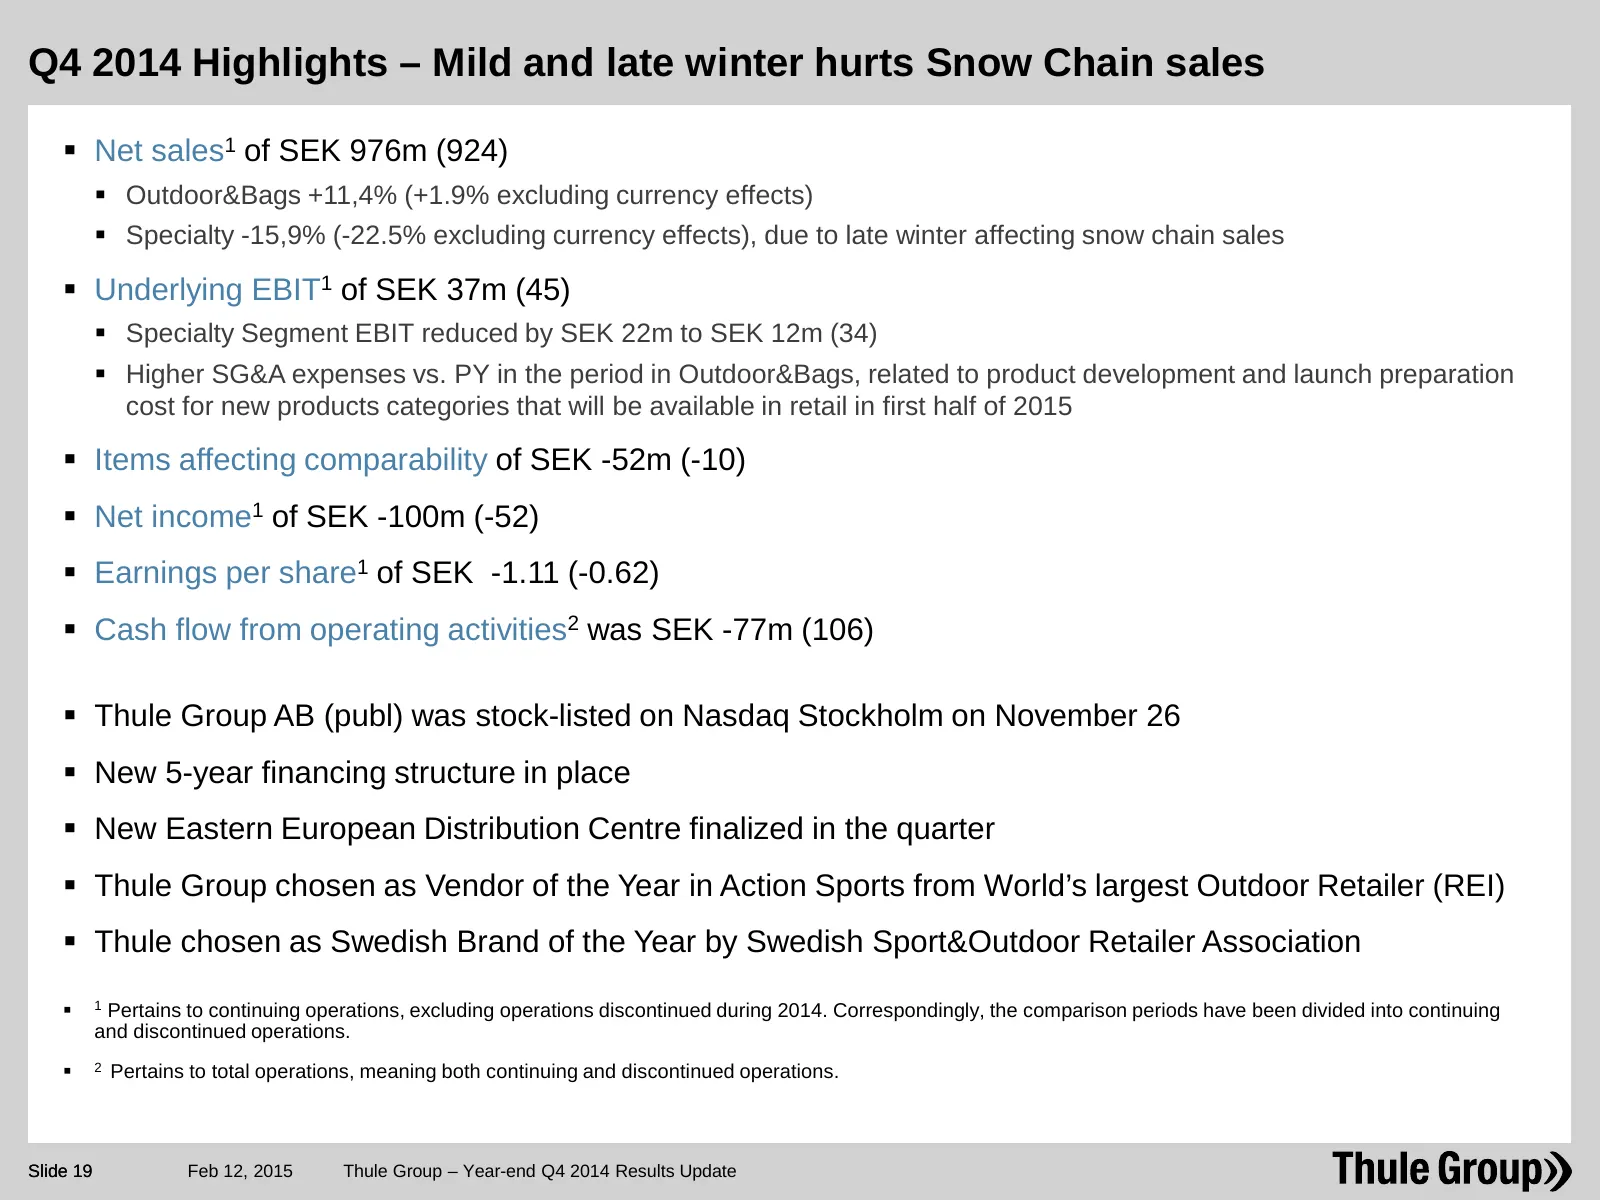
Q4 2014 Highlights – Mild and late winter hurts Snow Chain sales Net sales1 of SEK 976m (924) Outdoor&Bags +11,4% (+1.9% excluding currency effects) Specialty -15,9% (-22.5% excluding currency effects), due to late winter affecting snow chain sales Underlying EBIT1 of SEK 37m (45) Specialt
Slide 20: Q4 2014 Net Sales and EBIT by Segment
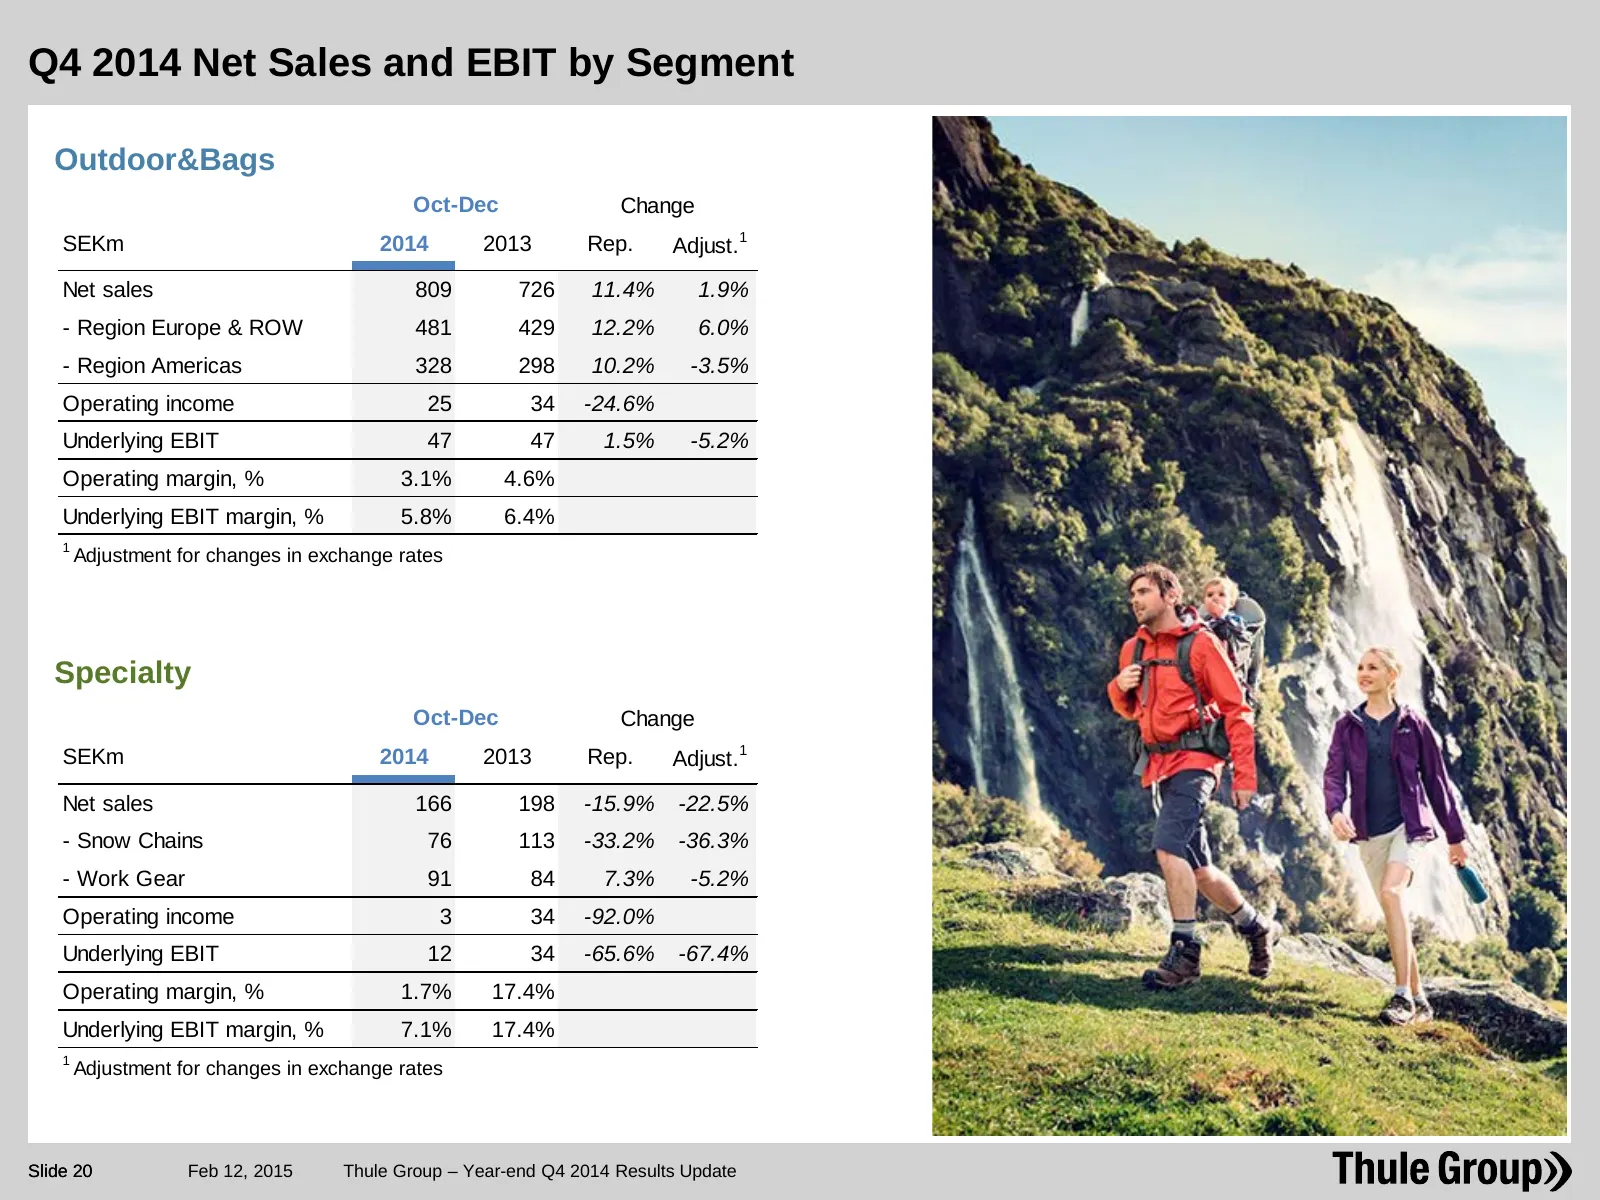
Q4 2014 Net Sales and EBIT by Segment Outdoor&Bags Oct-Dec Change SEKm 2014 2013 Rep. Adjust.1 Net sales 809 726 11.4% 1.9% - Region Europe & ROW 481 429 12.2% 6.0% - Region Americas 328 298 10.2% -3.5% Operating income 25 34 -24.6% Underlying EBIT 47 47 1.5% -5.2% Operating margin, % 3.1% 4.6% Unde
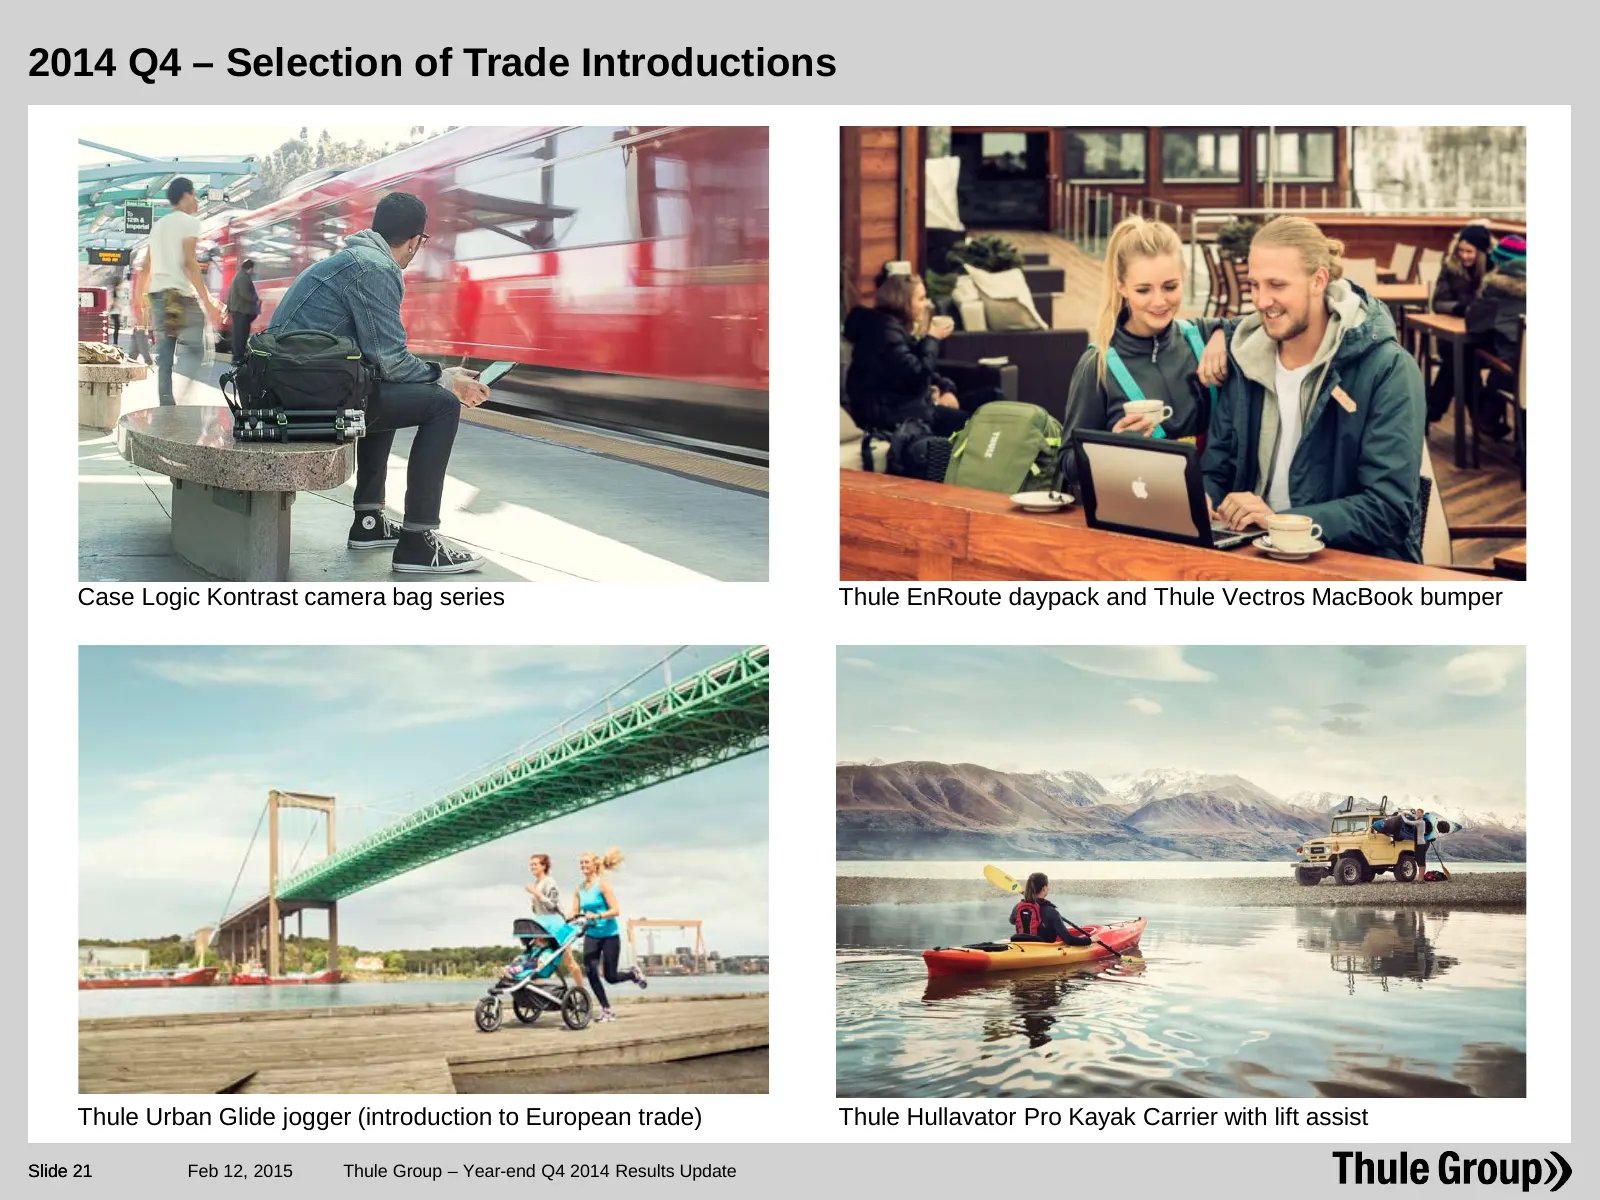
Slide 21: 2014 Q4 – Selection of Trade Introductions
2014 Q4 – Selection of Trade Introductions Case Logic Kontrast camera bag series Thule EnRoute daypack and Thule Vectros MacBook bumper Thule Urban Glide jogger (introduction to European trade) Thule Hullavator Pro Kayak Carrier with lift assist Slide 21 Feb 12, 2015 Thule Group – Year-end Q4 2014 R
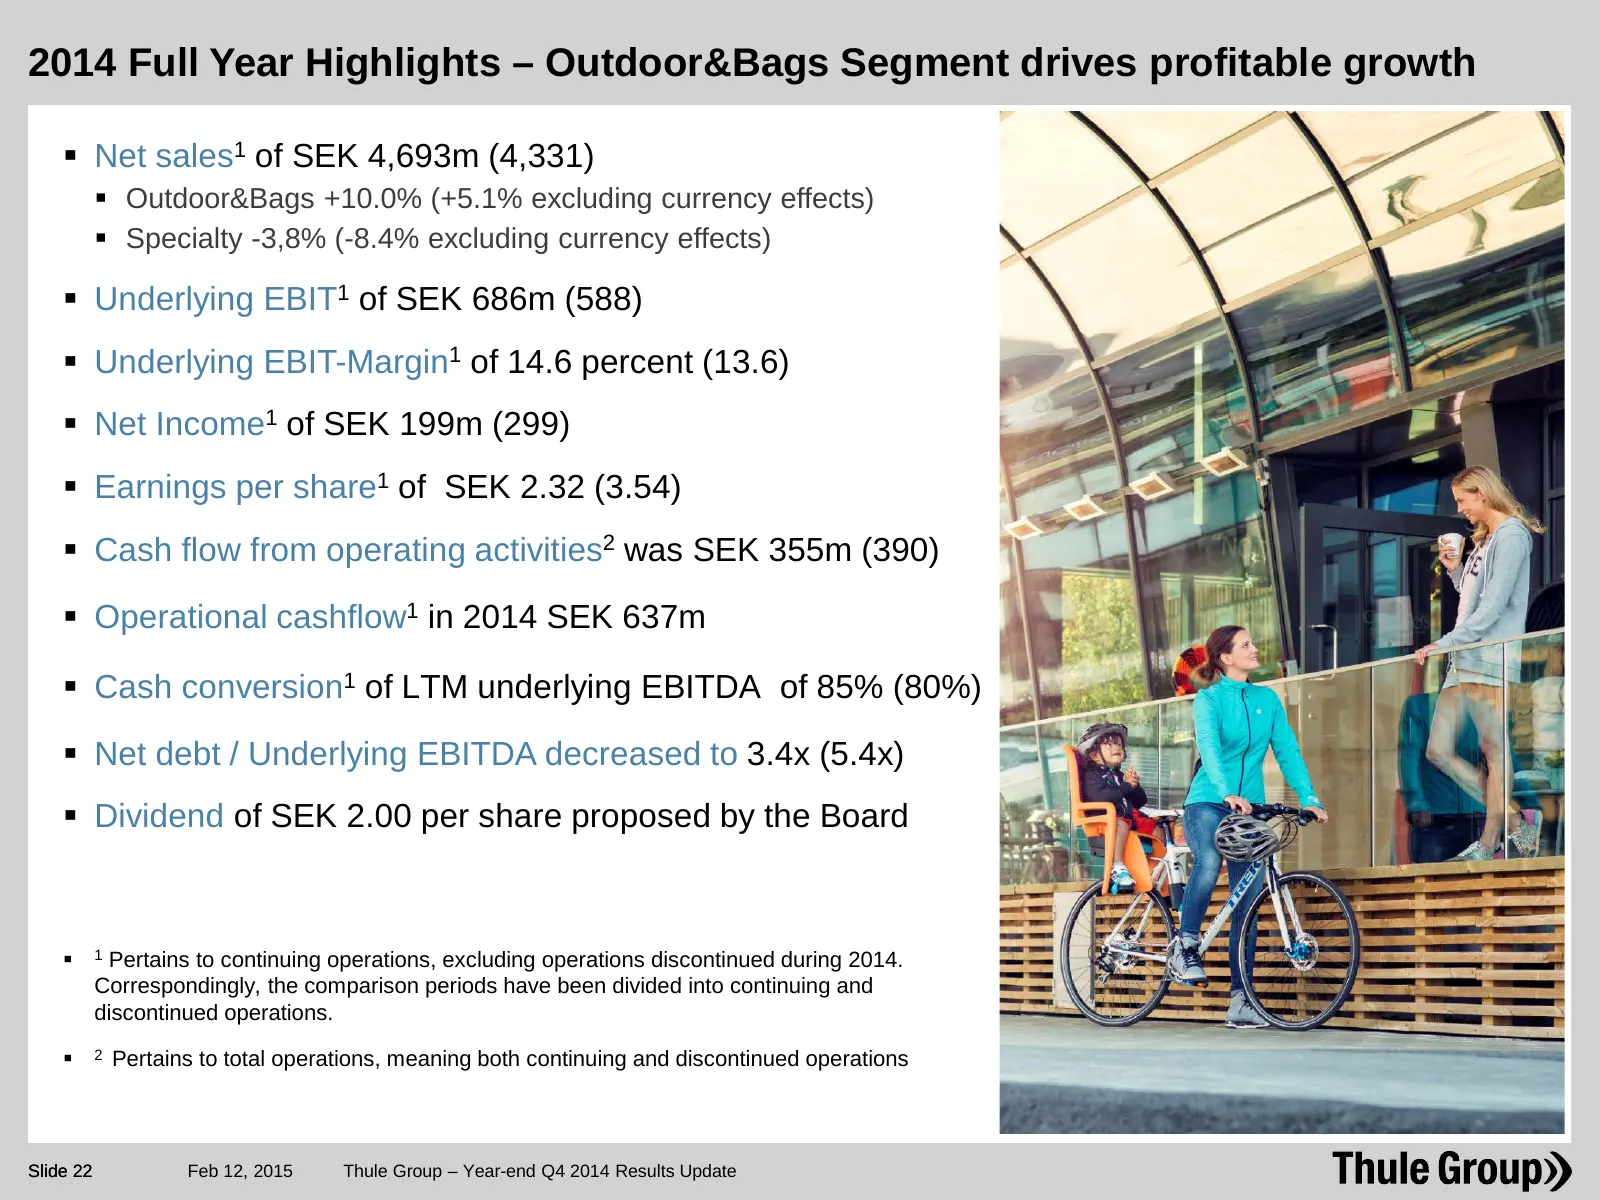
Slide 22: 2014 Full Year Highlights – Outdoor&Bags Segment drives profitable growth
2014 Full Year Highlights – Outdoor&Bags Segment drives profitable growth Net sales1 of SEK 4,693m (4,331) Outdoor&Bags +10.0% (+5.1% excluding currency effects) Specialty -3,8% (-8.4% excluding currency effects) Underlying EBIT1 of SEK 686m (588) Underlying EBIT-Margin1 of 14.6 percent (1
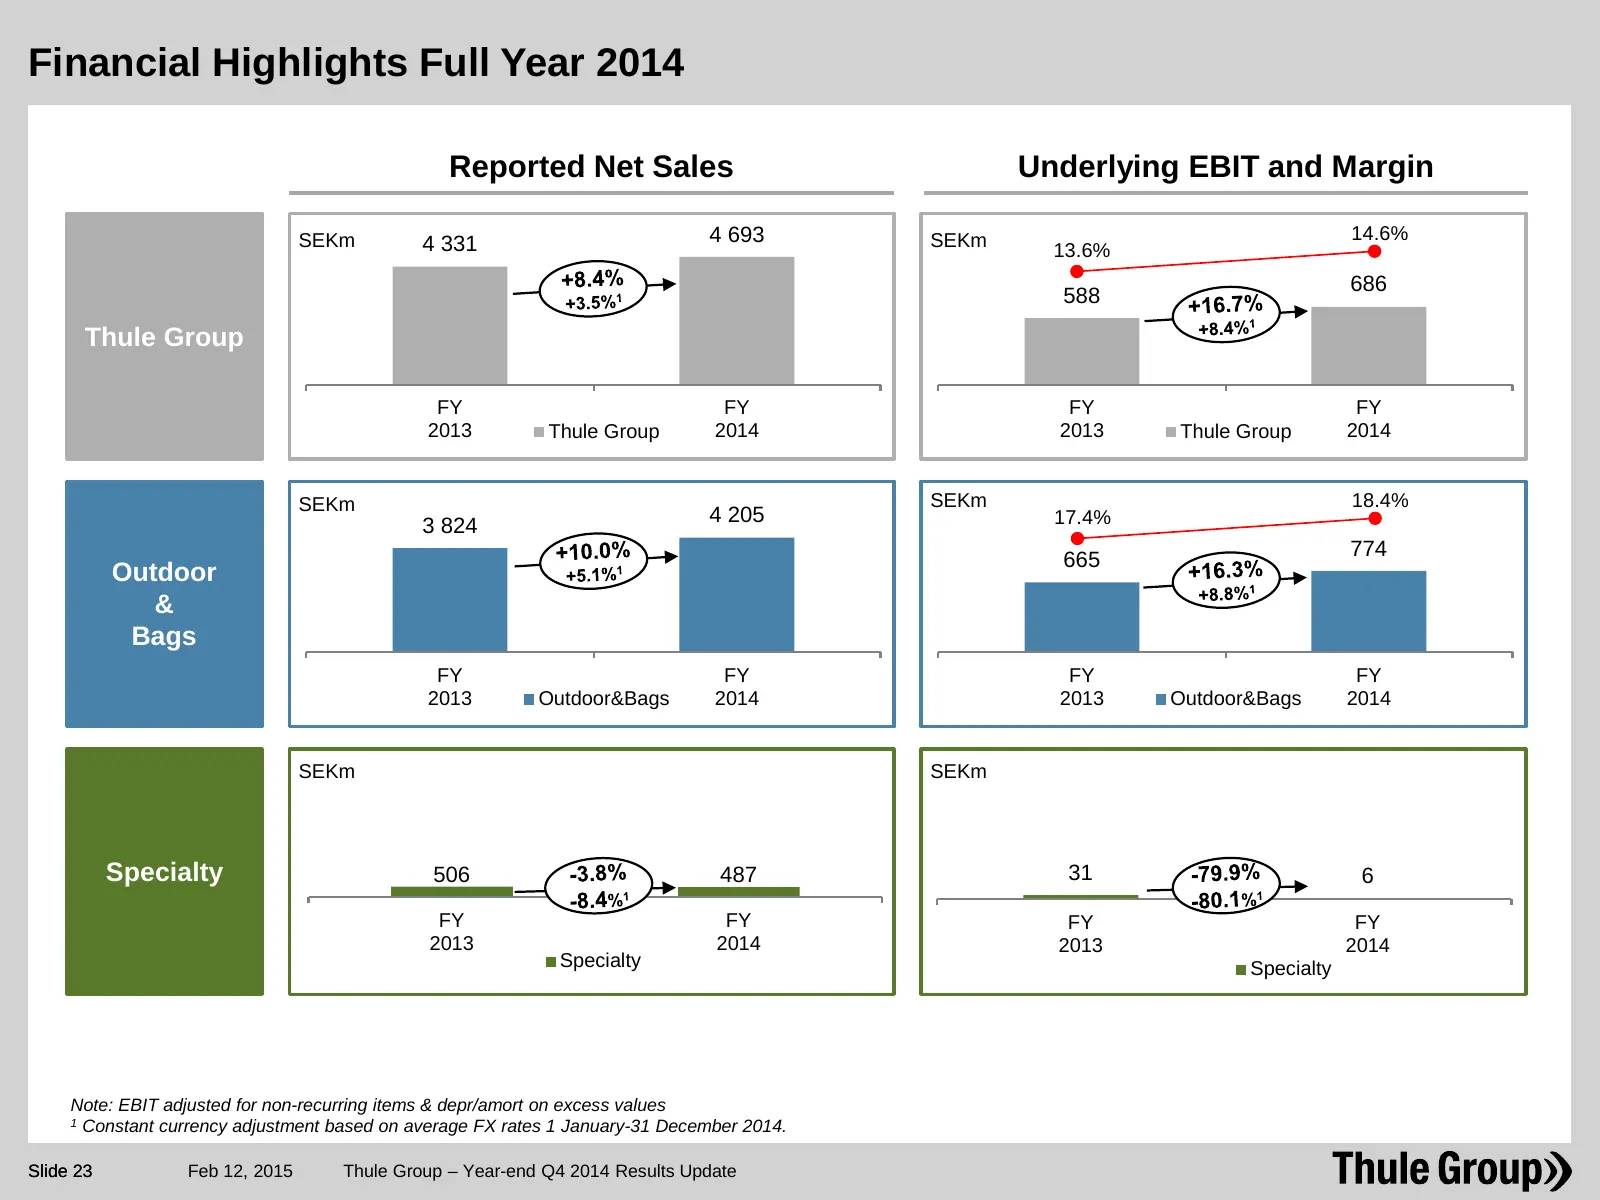
Slide 23: Financial Highlights Full Year 2014
Financial Highlights Full Year 2014 Reported Net Sales Underlying EBIT and Margin SEKm 4 693 SEKm 14.6% 4 331 13.6% 686 588 Thule Group FY FY FY FY 2013 Thule Group 2014 2013 Thule Group 2014 SEKm SEKm 18.4% 3 824 4 205 17.4% 774 665 Outdoor & Bags FY FY FY FY 2013 Outdoor&Bags 2014 2013 Outdoor&Bag
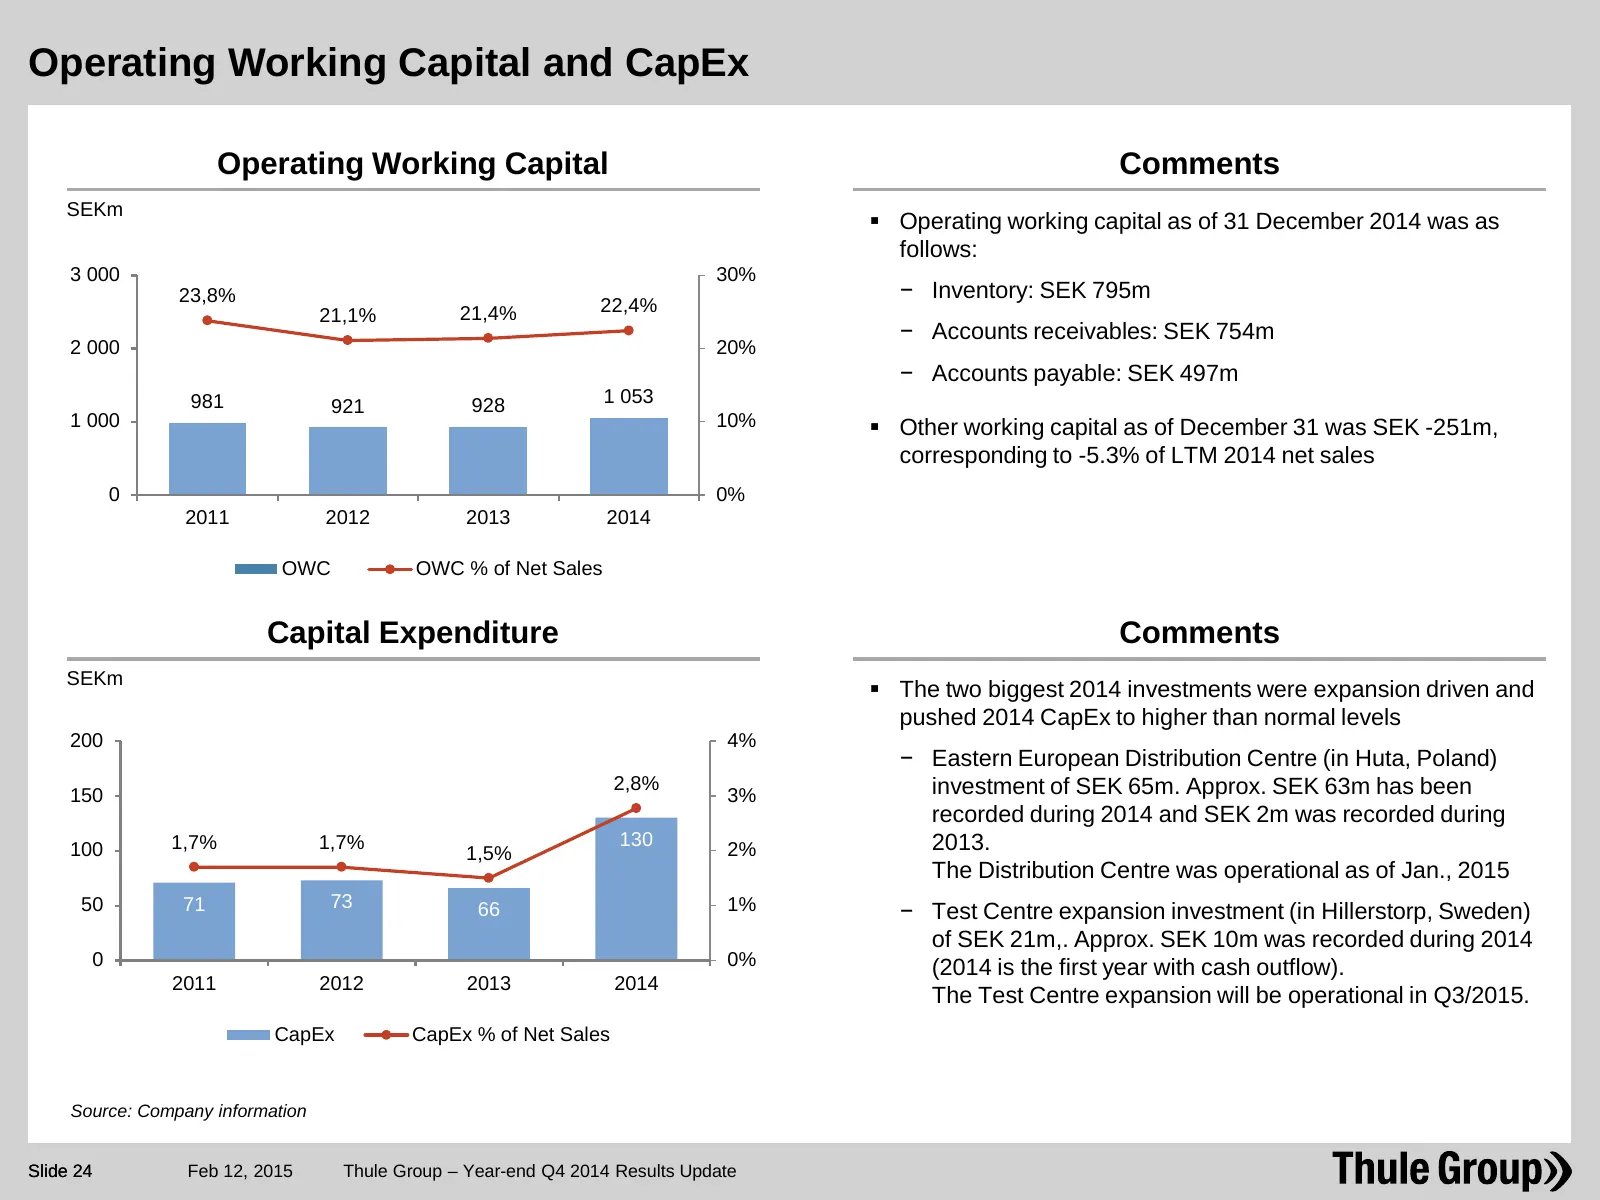
Slide 24: Operating Working Capital and CapEx
Operating Working Capital and CapEx Operating Working Capital Comments SEKm Operating working capital as of 31 December 2014 was as follows: 3 000 30% 23,8% − Inventory: SEK 795m 21,1% 21,4% 22,4% − Accounts receivables: SEK 754m 2 000 20% − Accounts payable: SEK 497m 981 921 928 1 053 1 000 10%
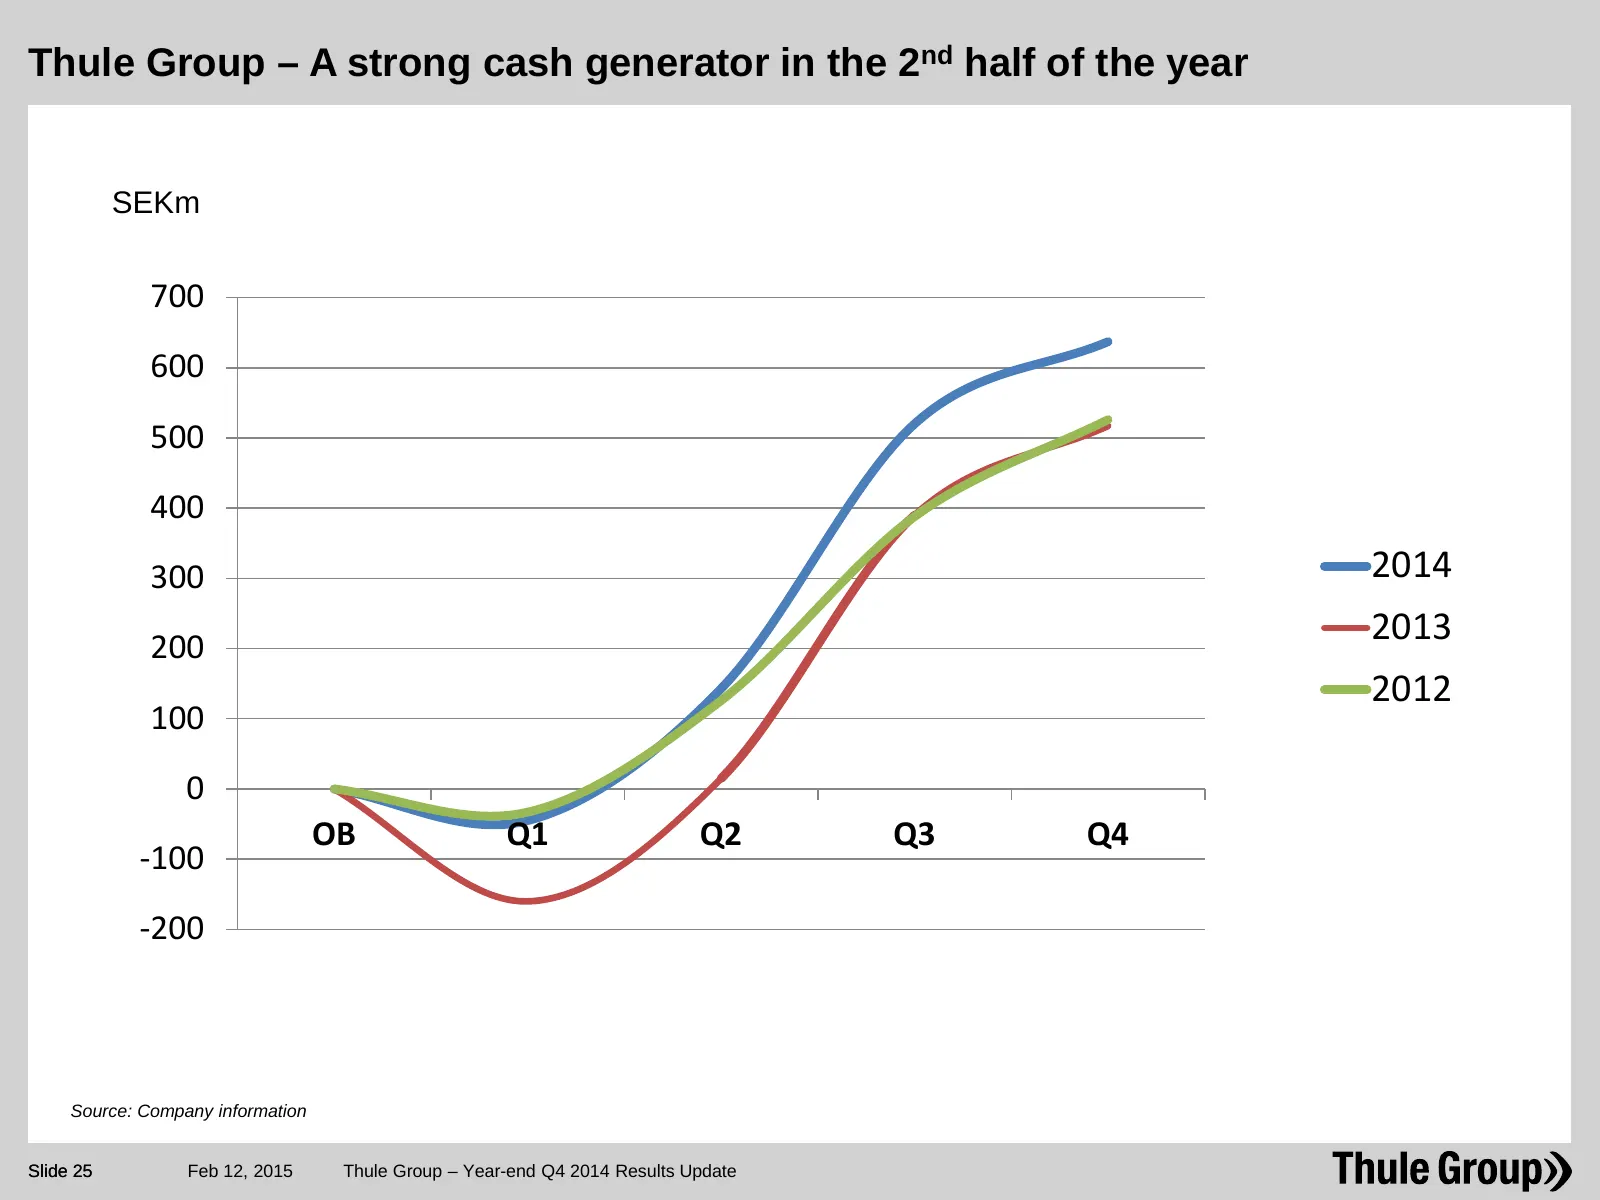
Slide 25: Thule Group – A strong cash generator in the 2nd half of the year
Thule Group – A strong cash generator in the 2nd half of the year SEKm 700 600 500 400 300 2014 200 2013 2012 100 0 OB Q1 Q2 Q3 Q4 -100 -200 Source: Company information Slide 25 Feb 12, 2015 Thule Group – Year-end Q4 2014 Results Update
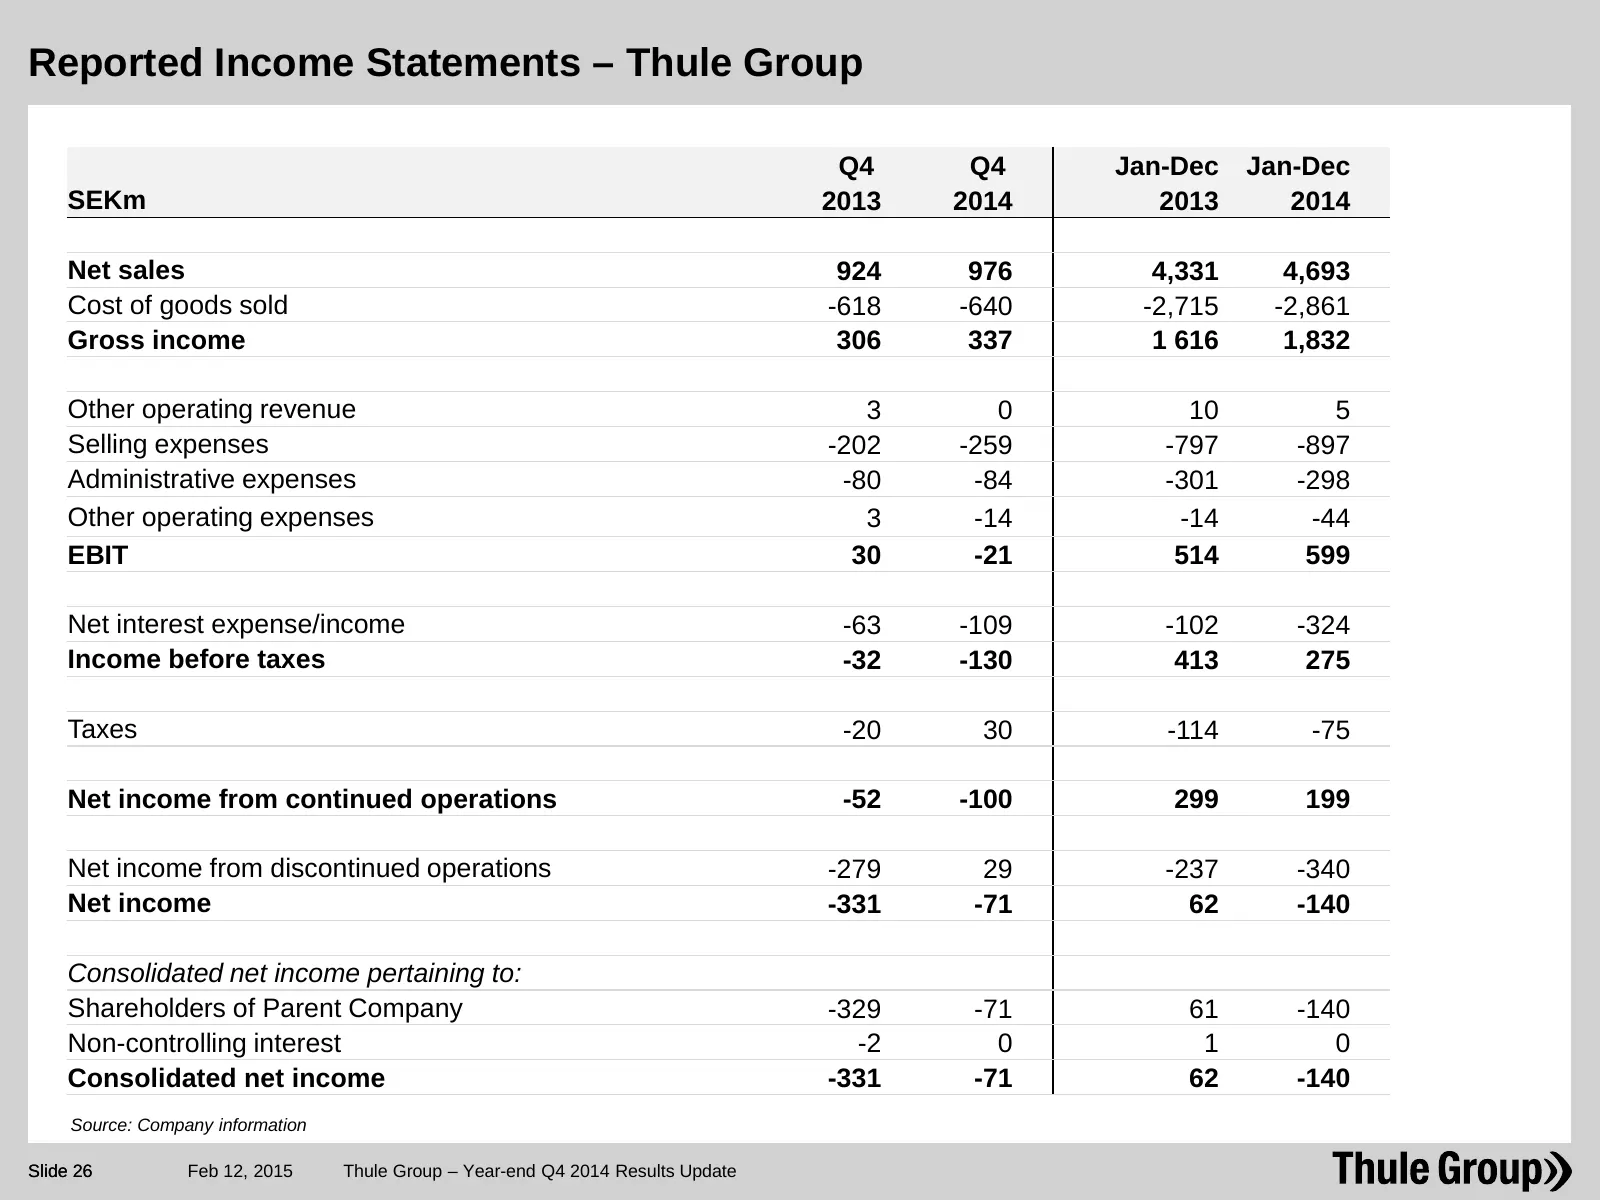
Slide 26: Reported Income Statements – Thule Group
Reported Income Statements – Thule Group Q4 Q4 Jan-Dec Jan-Dec SEKm 2013 2014 2013 2014 Net sales 924 976 4,331 4,693 Cost of goods sold -618 -640 -2,715 -2,861 Gross income 306 337 1 616 1,832 Other operating revenue 3 0 10 5 Selling expenses -202 -259 -797 -897 Administrative expenses -80 -84 -301
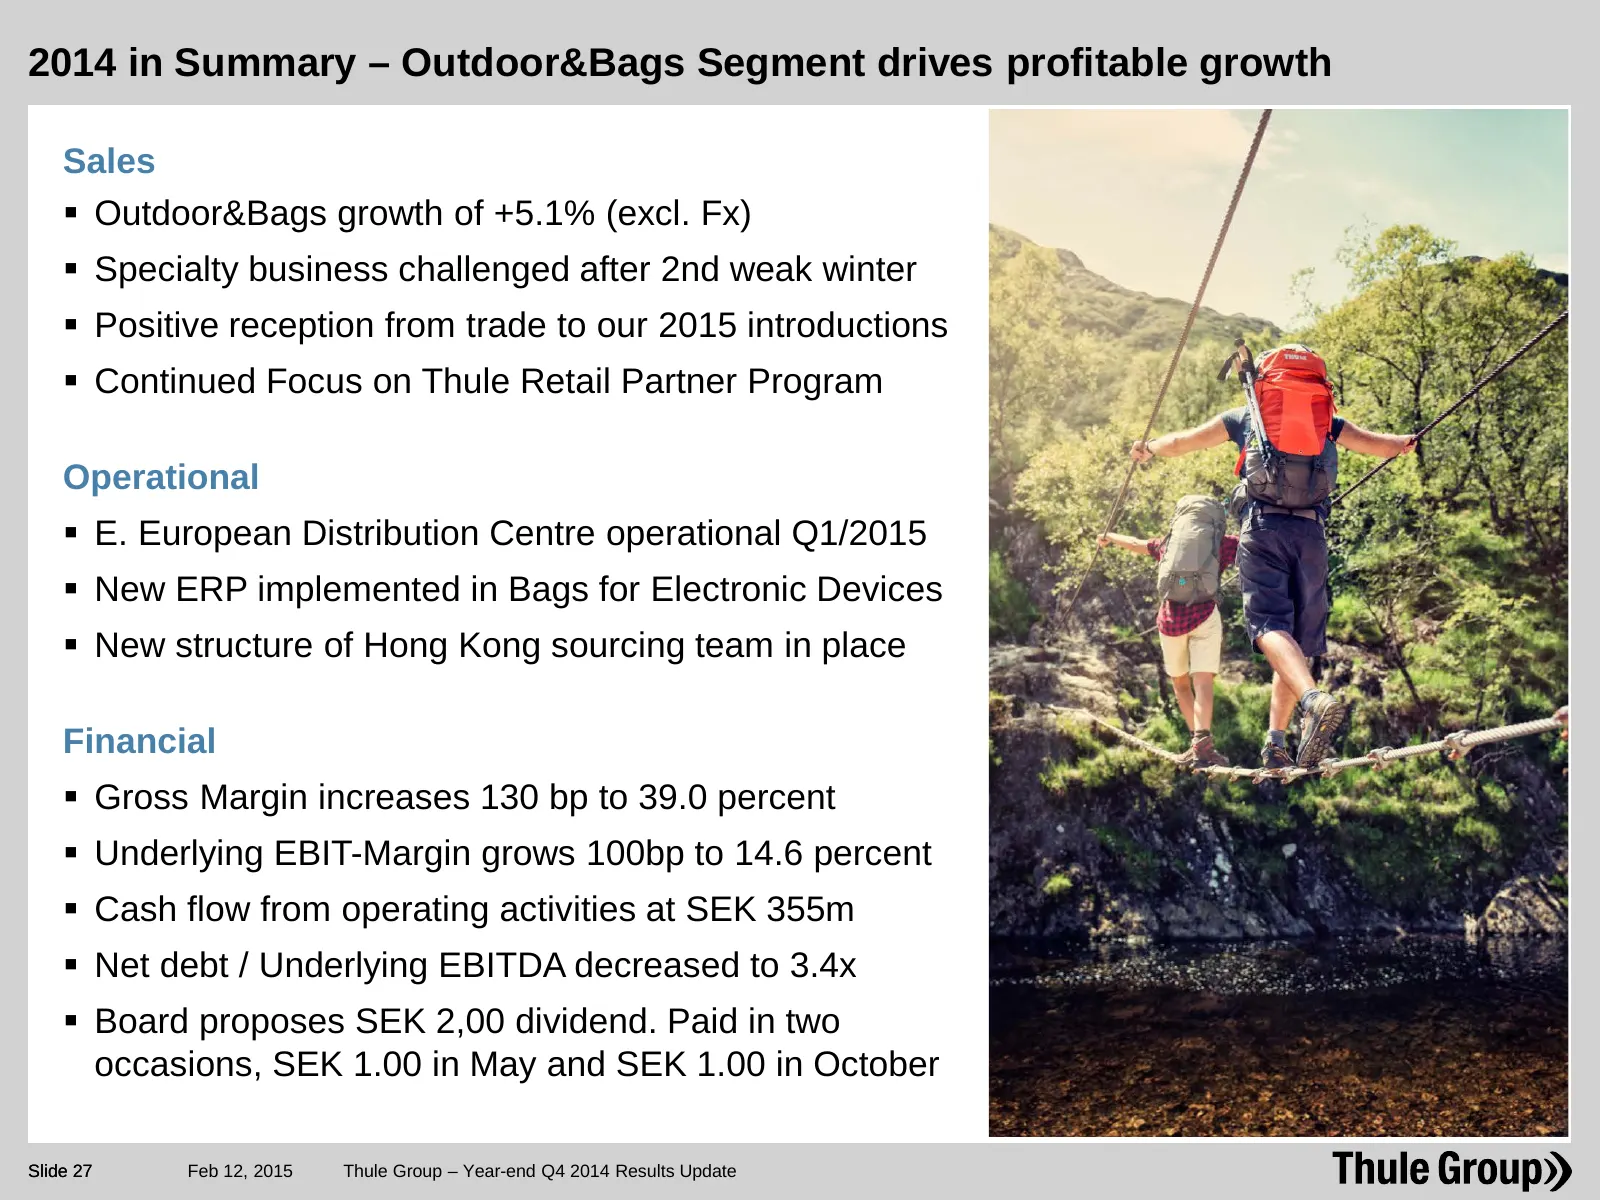
Slide 27: 2014 in Summary – Outdoor&Bags Segment drives profitable growth
2014 in Summary – Outdoor&Bags Segment drives profitable growth Sales Outdoor&Bags growth of +5.1% (excl. Fx) Specialty business challenged after 2nd weak winter Positive reception from trade to our 2015 introductions Continued Focus on Thule Retail Partner Program Operational E. European
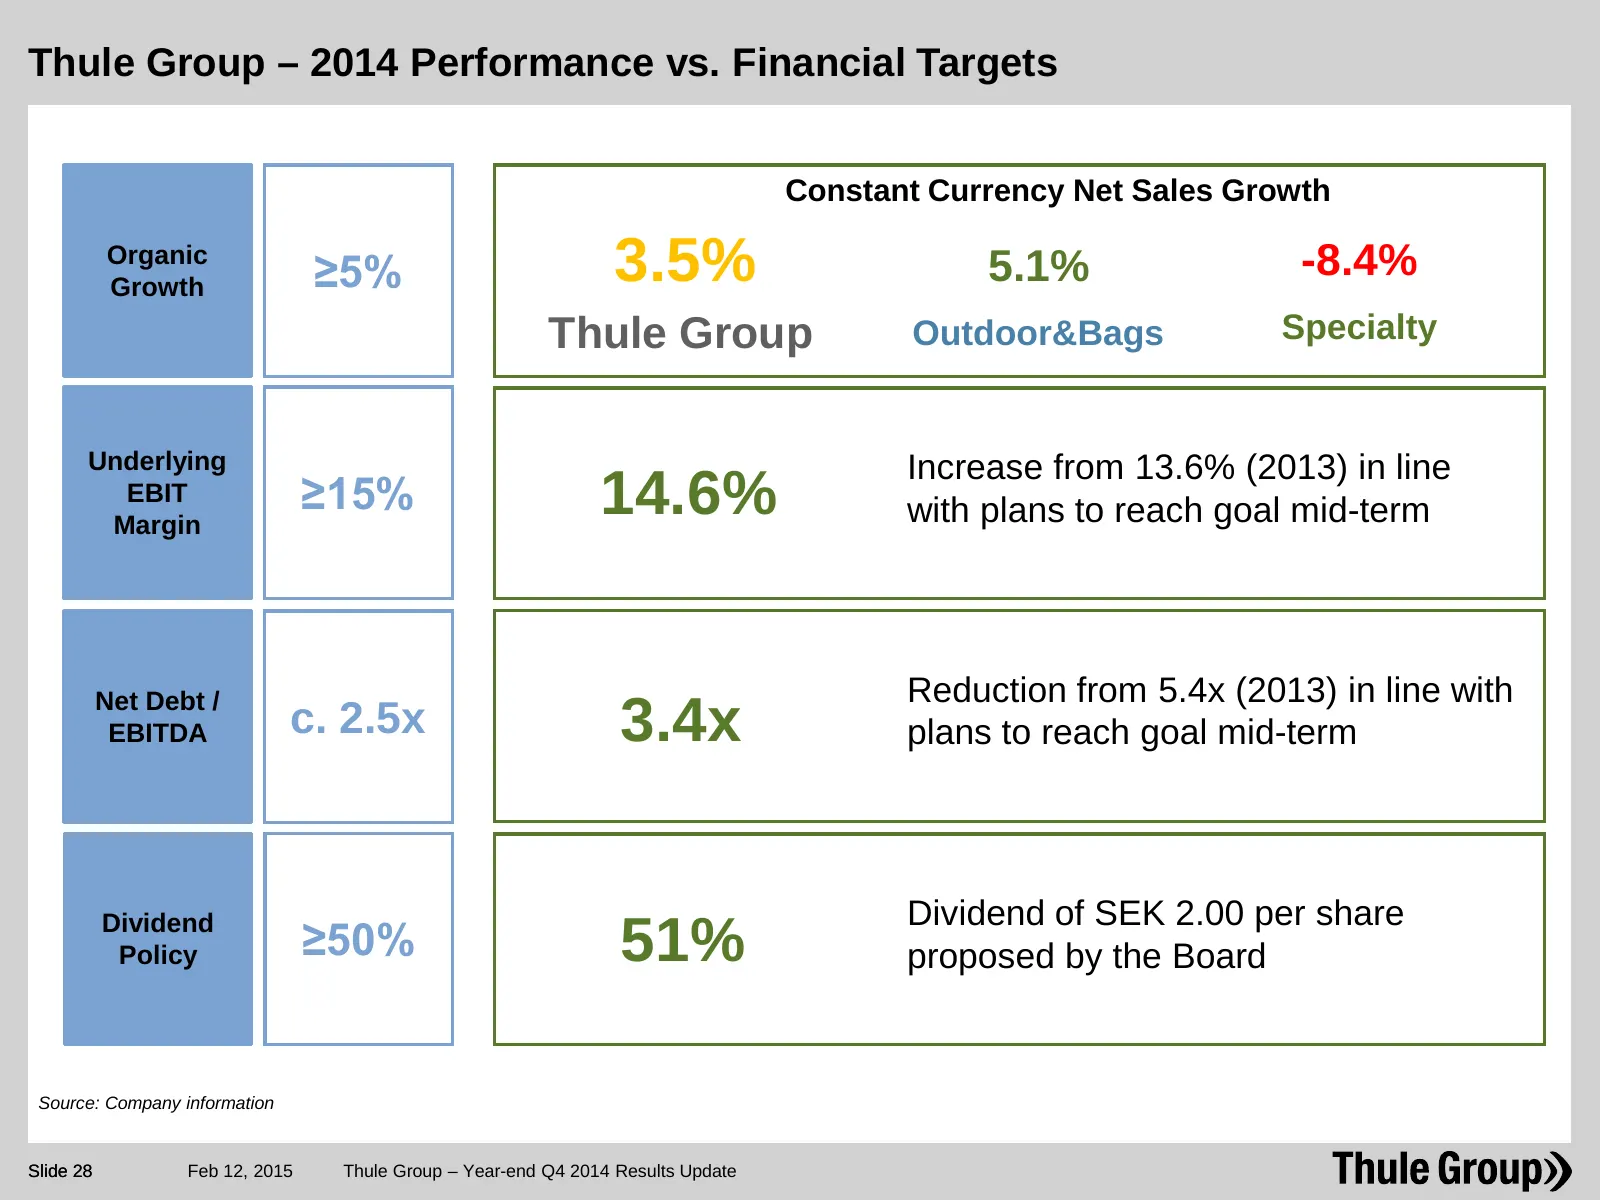
Slide 28: Thule Group – 2014 Performance vs. Financial Targets
Thule Group – 2014 Performance vs. Financial Targets Constant Currency Net Sales Growth Organic Growth ≥5% 3.5% 5.1% -8.4% Thule Group Outdoor&Bags Specialty Underlying Increase from 13.6% (2013) in line EBIT ≥15% 14.6% with plans to reach goal mid-term Margin Net Debt / Reduction from 5.4x (2013) i
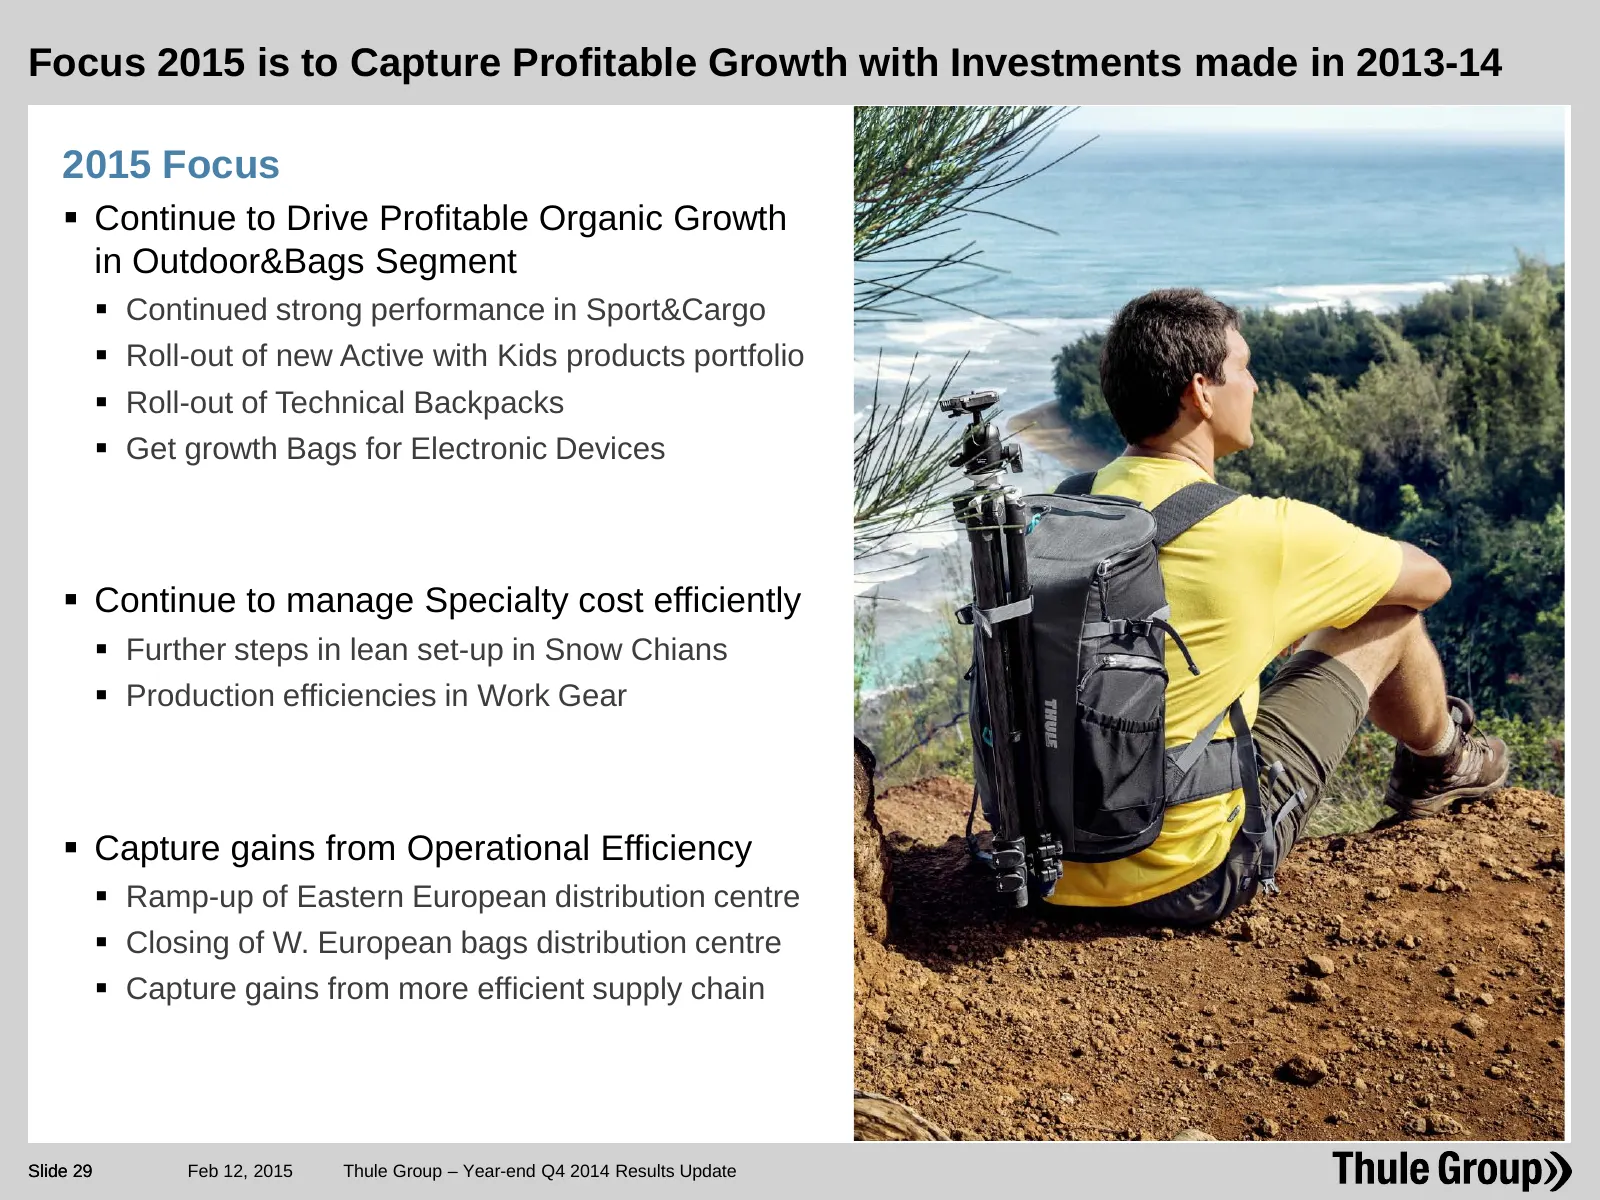
Slide 29: Focus 2015 is to Capture Profitable Growth with Investments made in 2013-14
Focus 2015 is to Capture Profitable Growth with Investments made in 2013-14 2015 Focus Continue to Drive Profitable Organic Growth in Outdoor&Bags Segment Continued strong performance in Sport&Cargo Roll-out of new Active with Kids products portfolio Roll-out of Technical Backpacks Get gro

Slide 30: Q&A
Q&A Slide 30
Slide 31: Disclaimer
Disclaimer This presentation has been prepared by Thule Group AB (publ) (the “Company”) solely for use at this presentation and is furnished to you solely for your information and may not be reproduced or redistributed, in whole or in part, to any other person. The presentation does not constitute
Source: Internet Archive copy of thulegroup.com
More decks from Thule Group AB
 Q3 2026 Earnings Presentation23 slides · Oct 22, 2026
 Q3 2026 Earnings Presentation13 slides · Sep 23, 2026
 Q2 2026 Earnings Presentation23 slides · Jul 20, 2026
 Corporate Update (June 2026)13 slides · Jun 17, 2026
 Q1 2026 Earnings Presentation23 slides · Apr 29, 2026
 Q4 2025 Earnings Presentation13 slides · Mar 30, 2026