CDW Corporation · NASDAQ:CDW
CDW — Q4 2016 Earnings Presentation
26 slides from CDW's earnings presentation, Feb 7, 2017
Slide 1: CDW Corporation Webcast Conference Call
CDW Corporation Webcast Conference Call February 7, 2017 CDW.com | 800.800.4239
Slide 2: Today's Agenda
Today's Agenda ▪ 4th Quarter and Full Year 2016 Results ▪ Key Performance Drivers and Strategic Progress ▪ Financial Results ▪ Outlook ▪ Q&A 2
Slide 3: Disclaimers
Disclaimers This presentation contains forward-looking statements, which are any predications, projections, or other statements about future events. These statements are based on current expectations and assumptions that are subject to risks and uncertainties. Actual results could materially differ
Slide 4: Strong Financial Performance
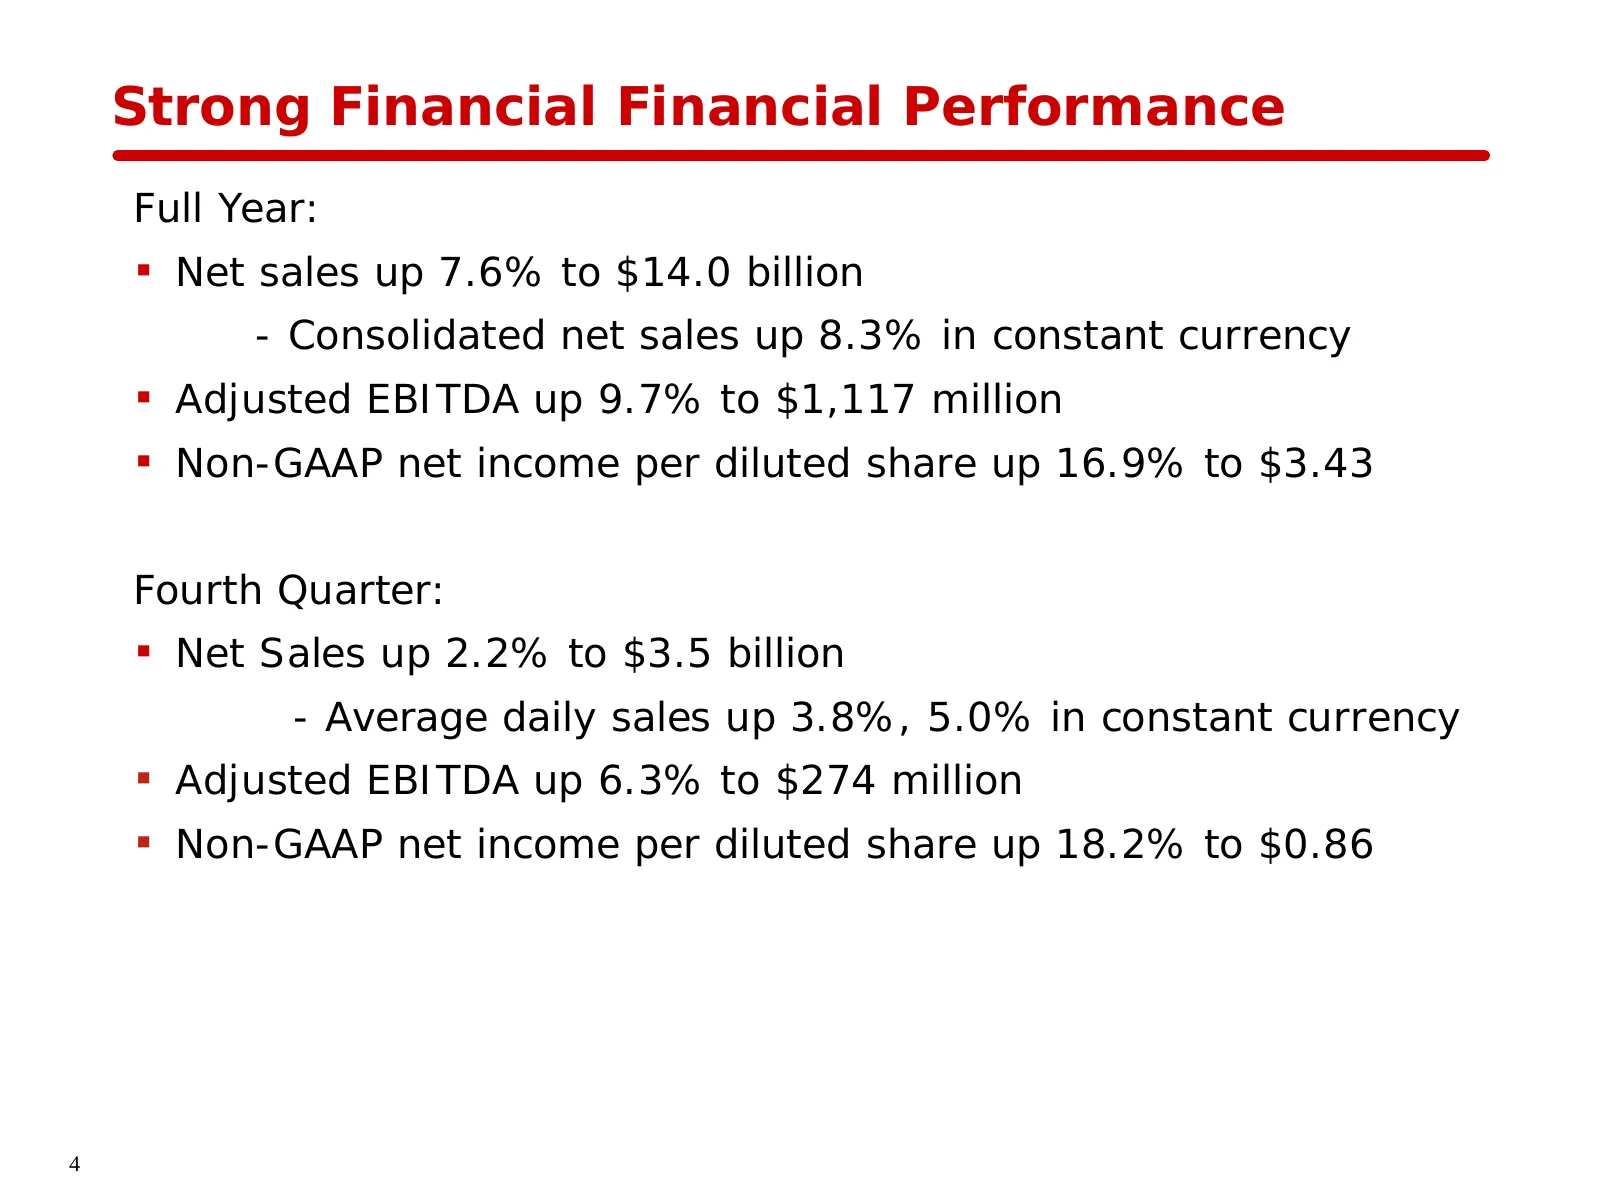
Strong Financial Financial Performance Full Year: ▪ Net sales up 7.6% to $14.0 billion - Consolidated net sales up 8.3% in constant currency ▪ Adjusted EBITDA up 9.7% to $1,117 million ▪ Non-GAAP net income per diluted share up 16.9% to $3.43 Fourth Quarter: ▪ Net Sales up 2.2% to $3.5 billion - Ave
Slide 5: Highlights Combined Power
Highlights Combined Power ▪ Nimble business model ▪ Balanced portfolio of customer end-markets ▪ Diverse product suite 5
Slide 6: Balanced Portfolio Drove Topline
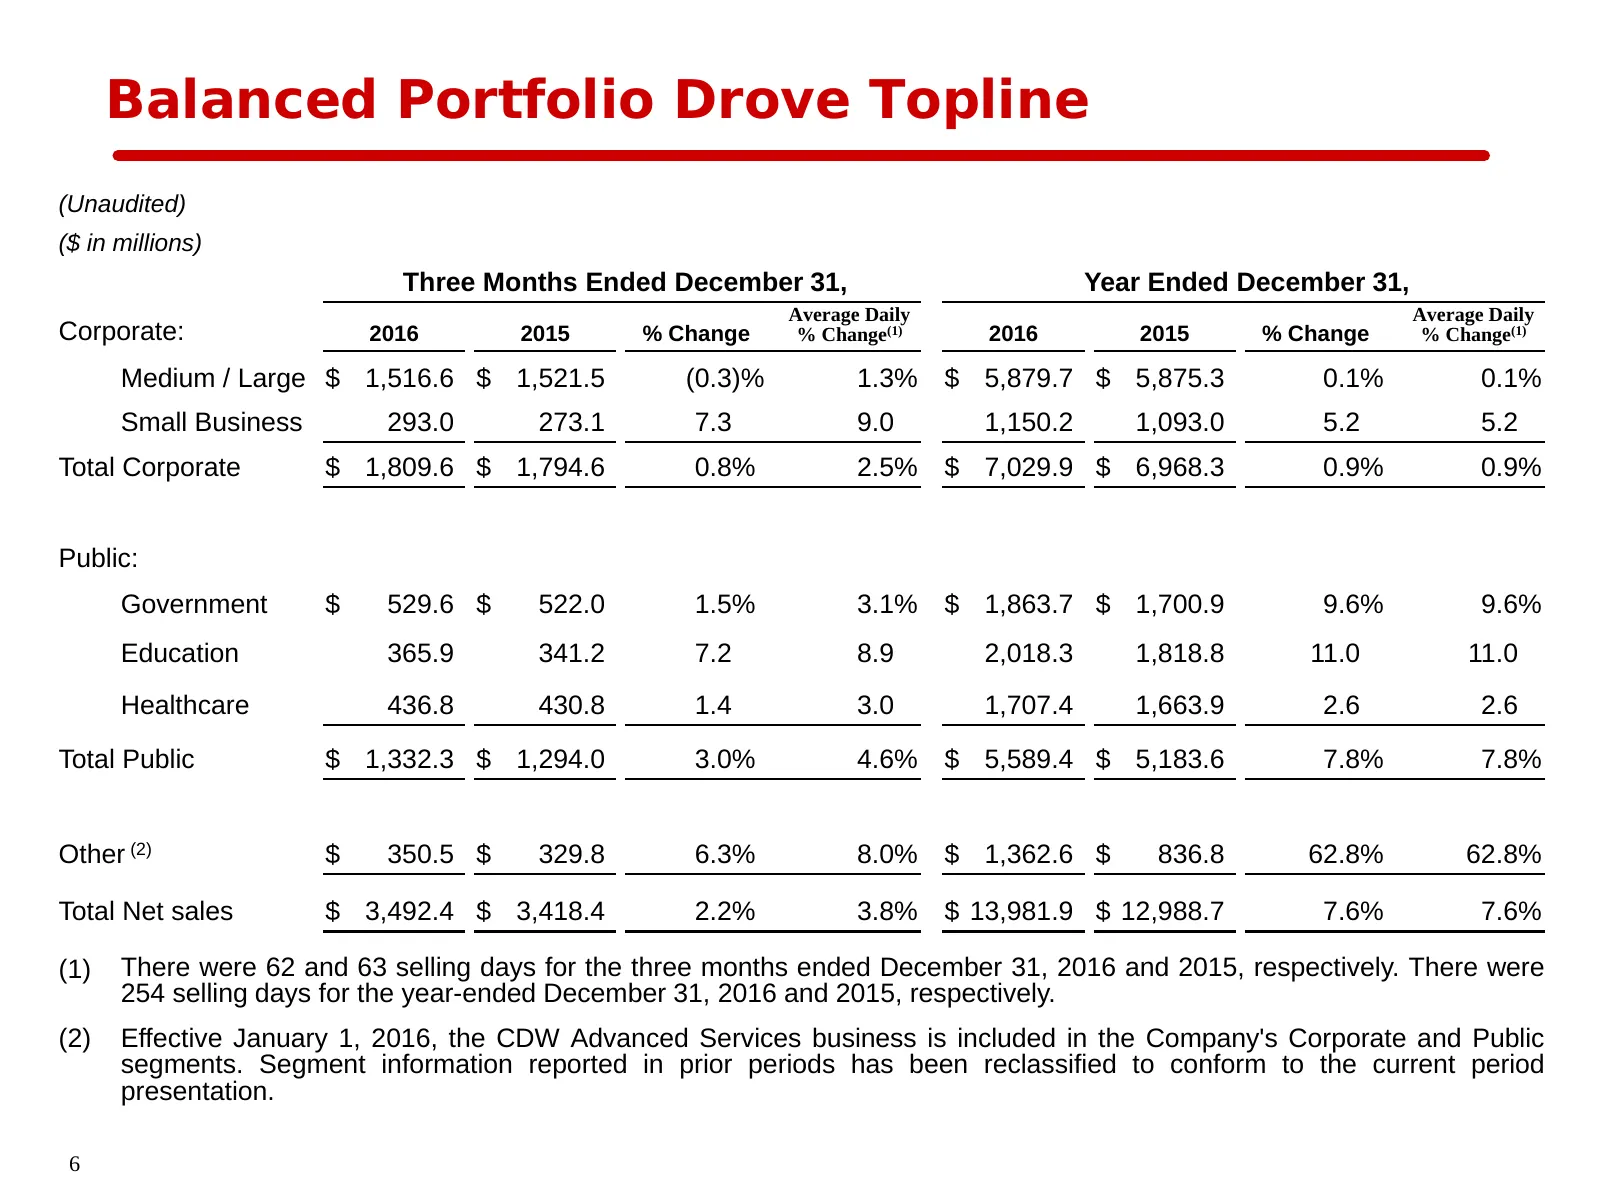
Balanced Portfolio Drove Topline (Unaudited) ($ in millions) Three Months Ended December 31, Year Ended December 31, Average Daily Average Daily Corporate: 2016 2015 % Change % Change(1) 2016 2015 % Change % Change(1) Medium / Large $ 1,516.6 $ 1,521.5 (0.3)% 1.3% $ 5,879.7 $ 5,875.3 0.1% 0.1% Small
Slide 7: Our Three-Part Growth Strategy
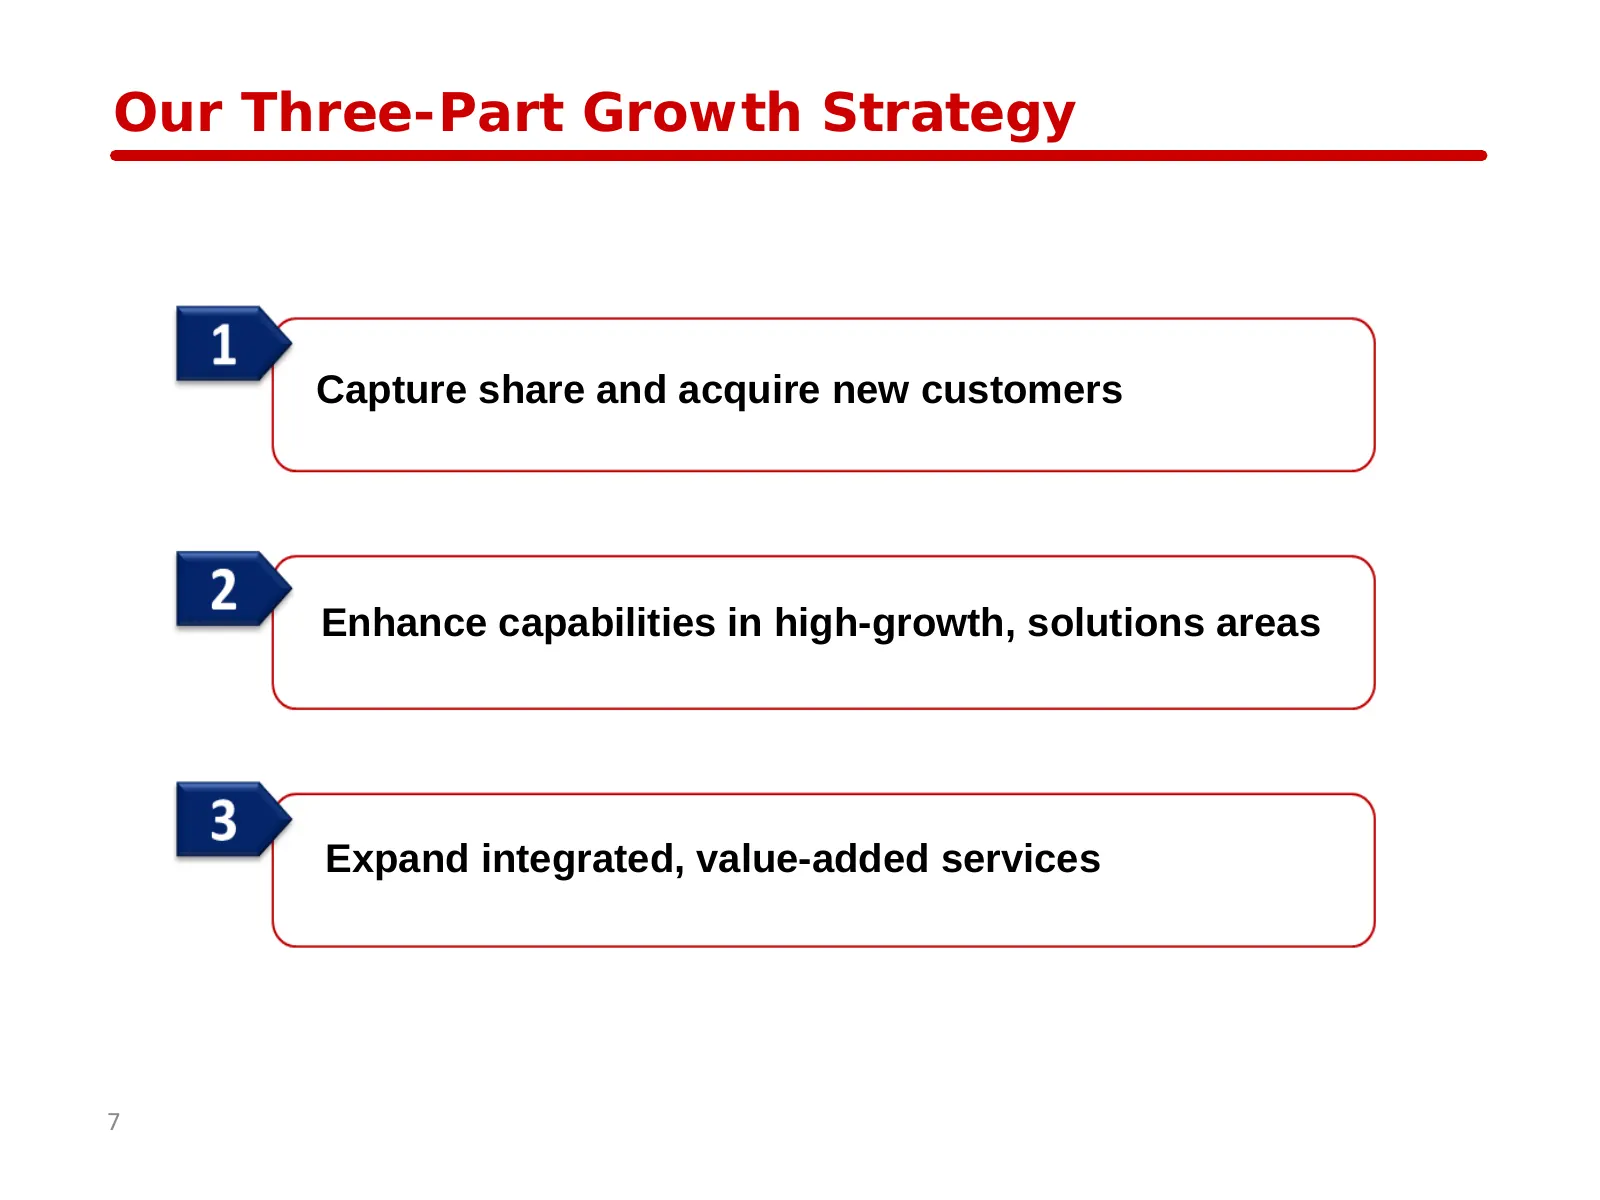
Our Three-Part Growth Strategy Capture share and acquire new customers Enhance capabilities in high-growth, solutions areas Expand integrated, value-added services 7
Slide 8: Fourth Quarter Financial Results
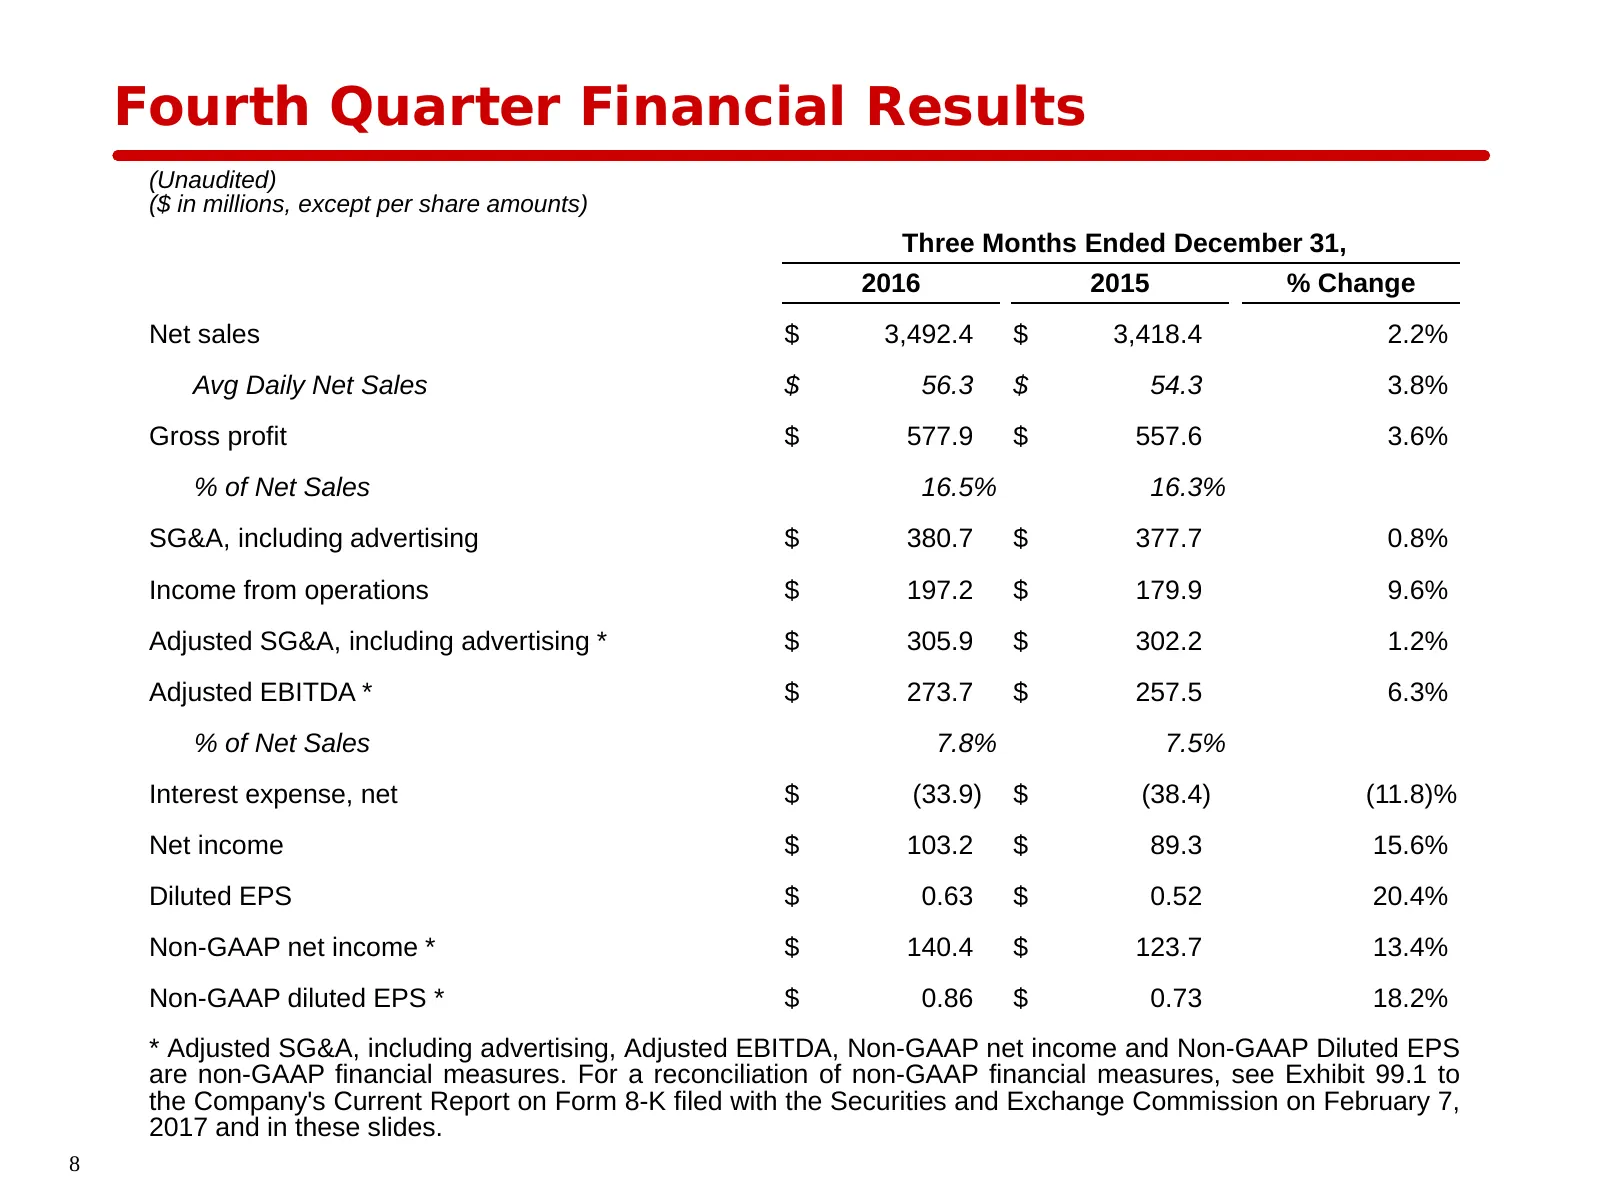
Fourth Quarter Financial Results (Unaudited) ($ in millions, except per share amounts) Three Months Ended December 31, 2016 2015 % Change Net sales $ 3,492.4 $ 3,418.4 2.2% Avg Daily Net Sales $ 56.3 $ 54.3 3.8% Gross profit $ 577.9 $ 557.6 3.6% % of Net Sales 16.5% 16.3% SG&A, including advertising
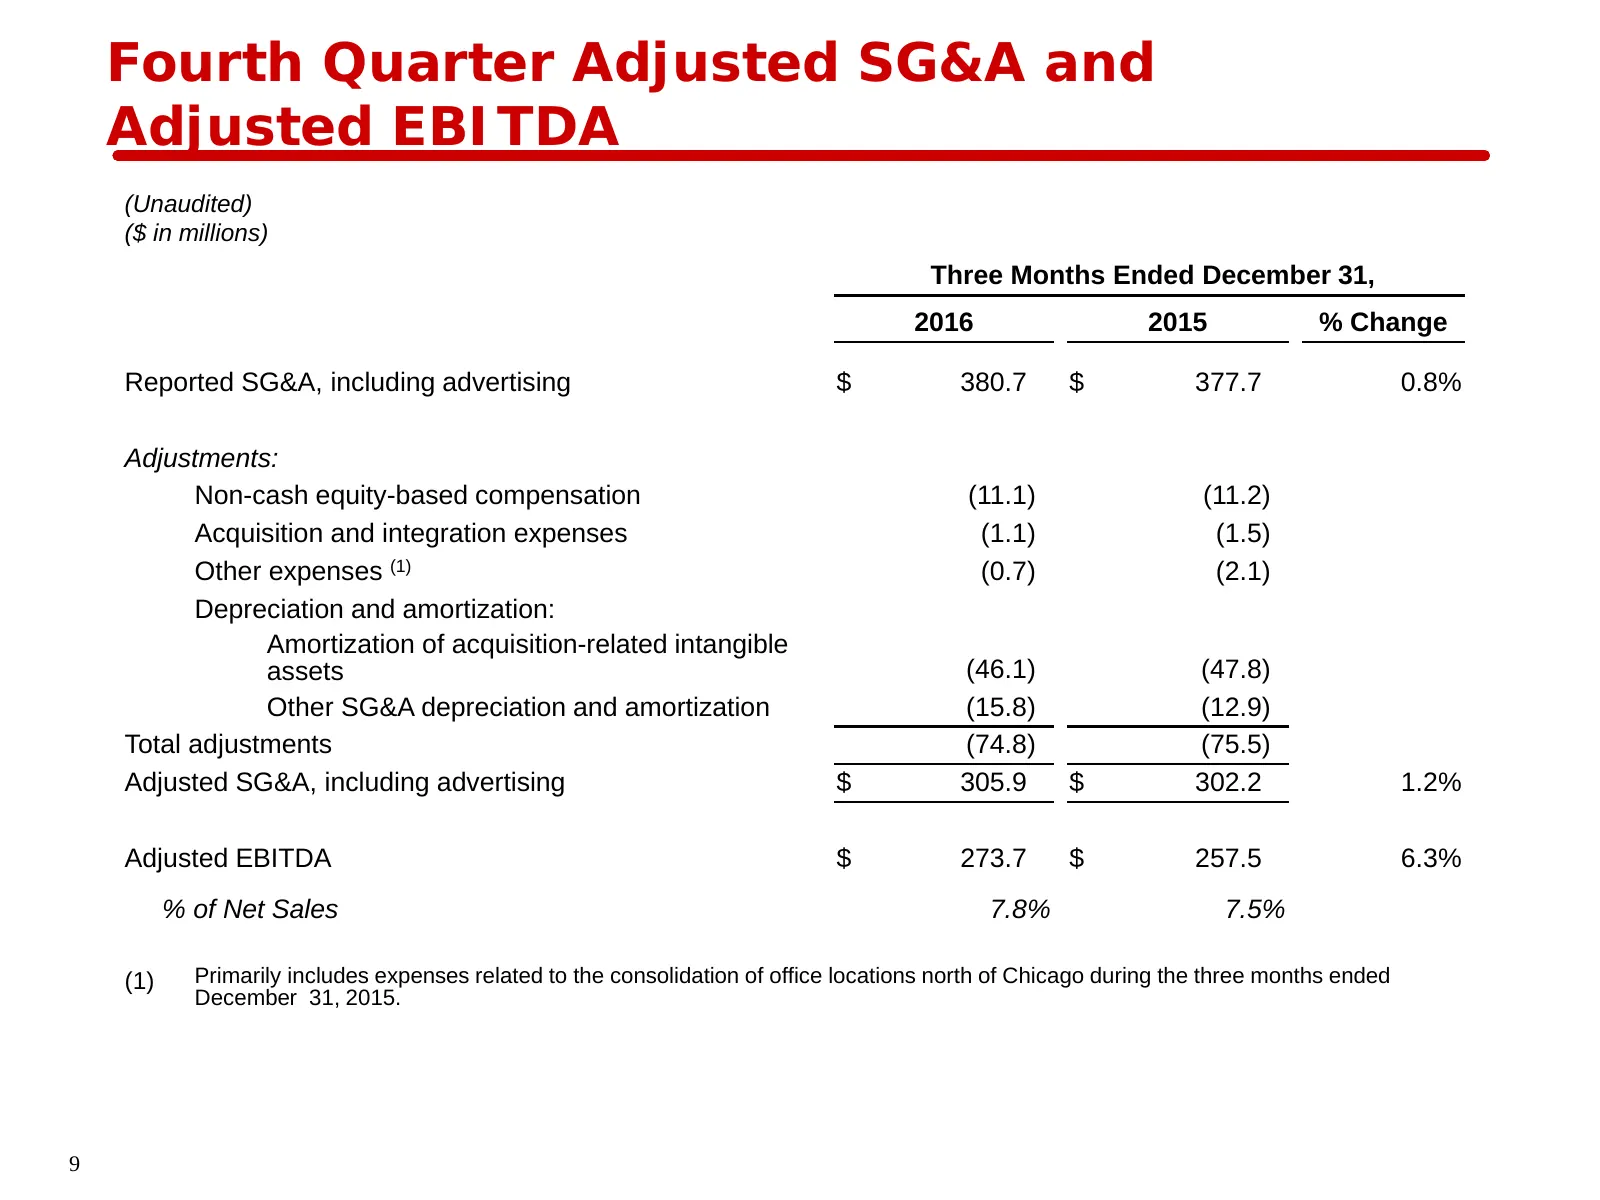
Slide 9: Fourth Quarter Adjusted SG&A and Adjusted EBITDA
Fourth Quarter Adjusted SG&A and Adjusted EBITDA (Unaudited) ($ in millions) Three Months Ended December 31, 2016 2015 % Change Reported SG&A, including advertising $ 380.7 $ 377.7 0.8% Adjustments: Non-cash equity-based compensation (11.1) (11.2) Acquisition and integration expenses (1.1) (1.5) Oth
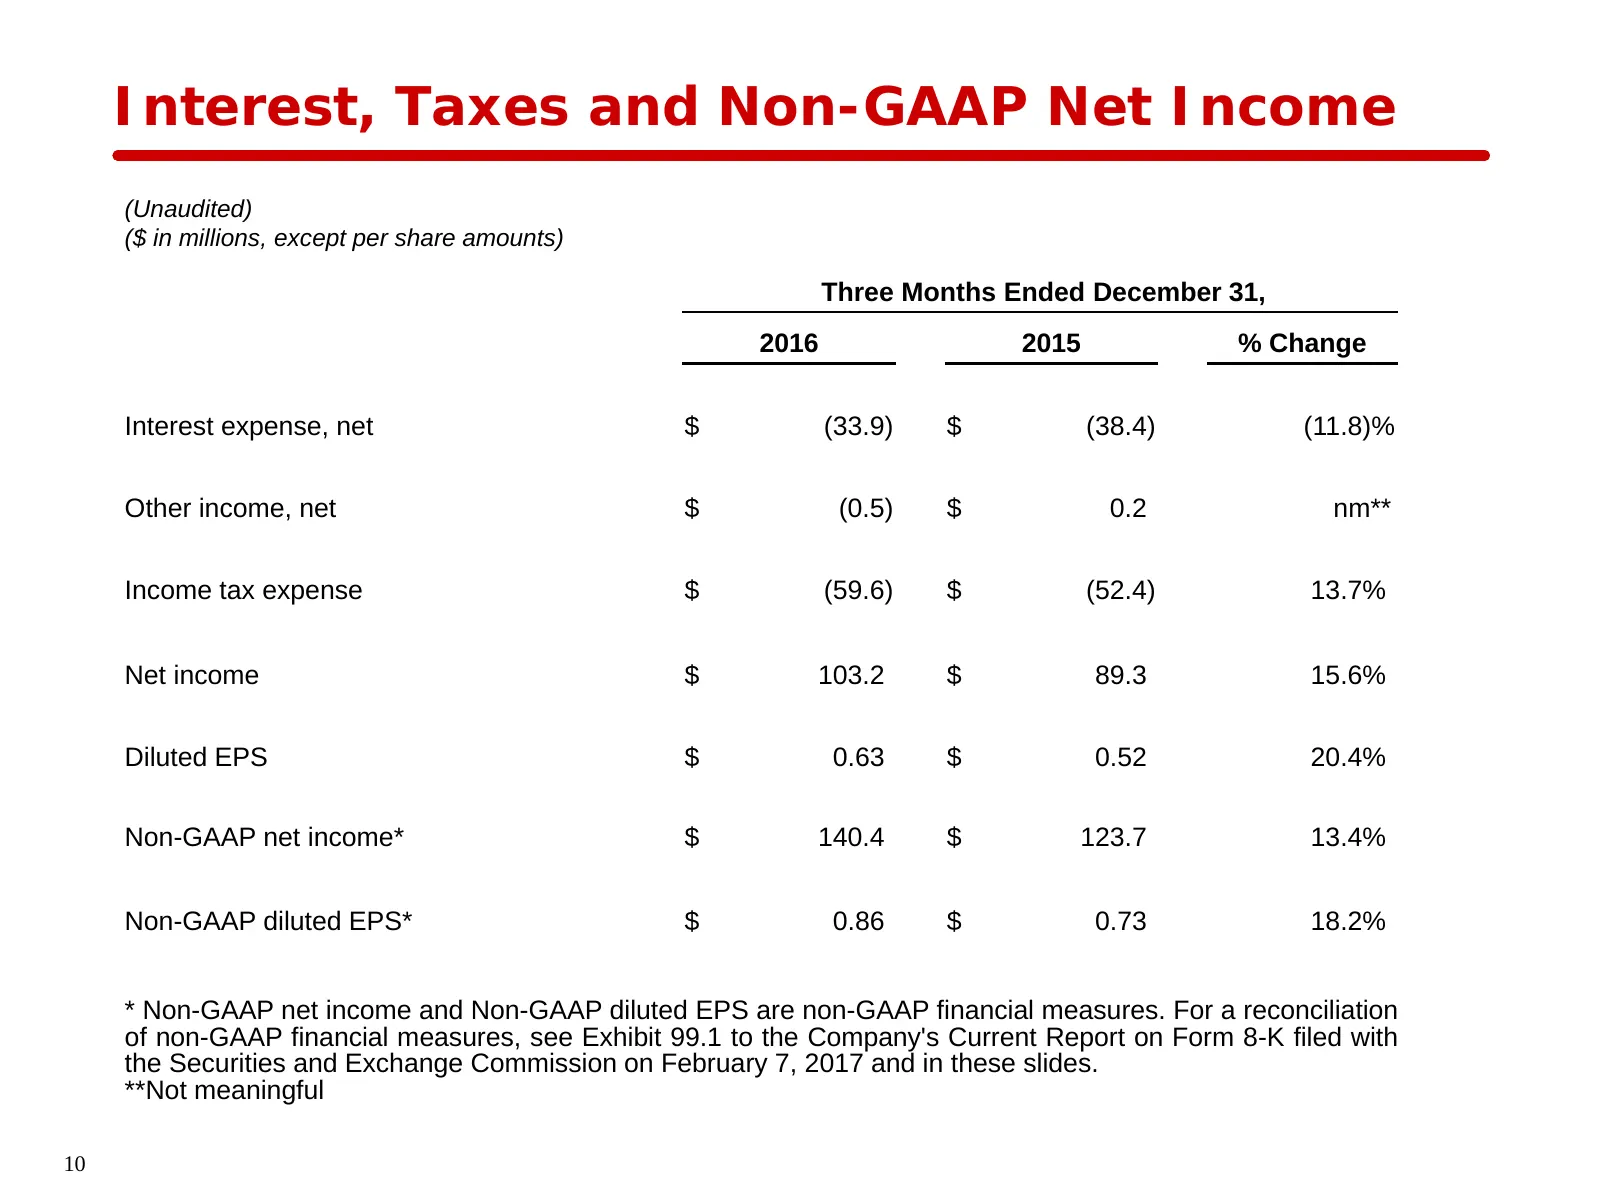
Slide 10: Interest, Taxes and Non-GAAP Net Income
Interest, Taxes and Non-GAAP Net Income (Unaudited) ($ in millions, except per share amounts) Three Months Ended December 31, 2016 2015 % Change Interest expense, net $ (33.9) $ (38.4) (11.8)% Other income, net $ (0.5) $ 0.2 nm** Income tax expense $ (59.6) $ (52.4) 13.7% Net income $ 103.2 $ 89.3 1
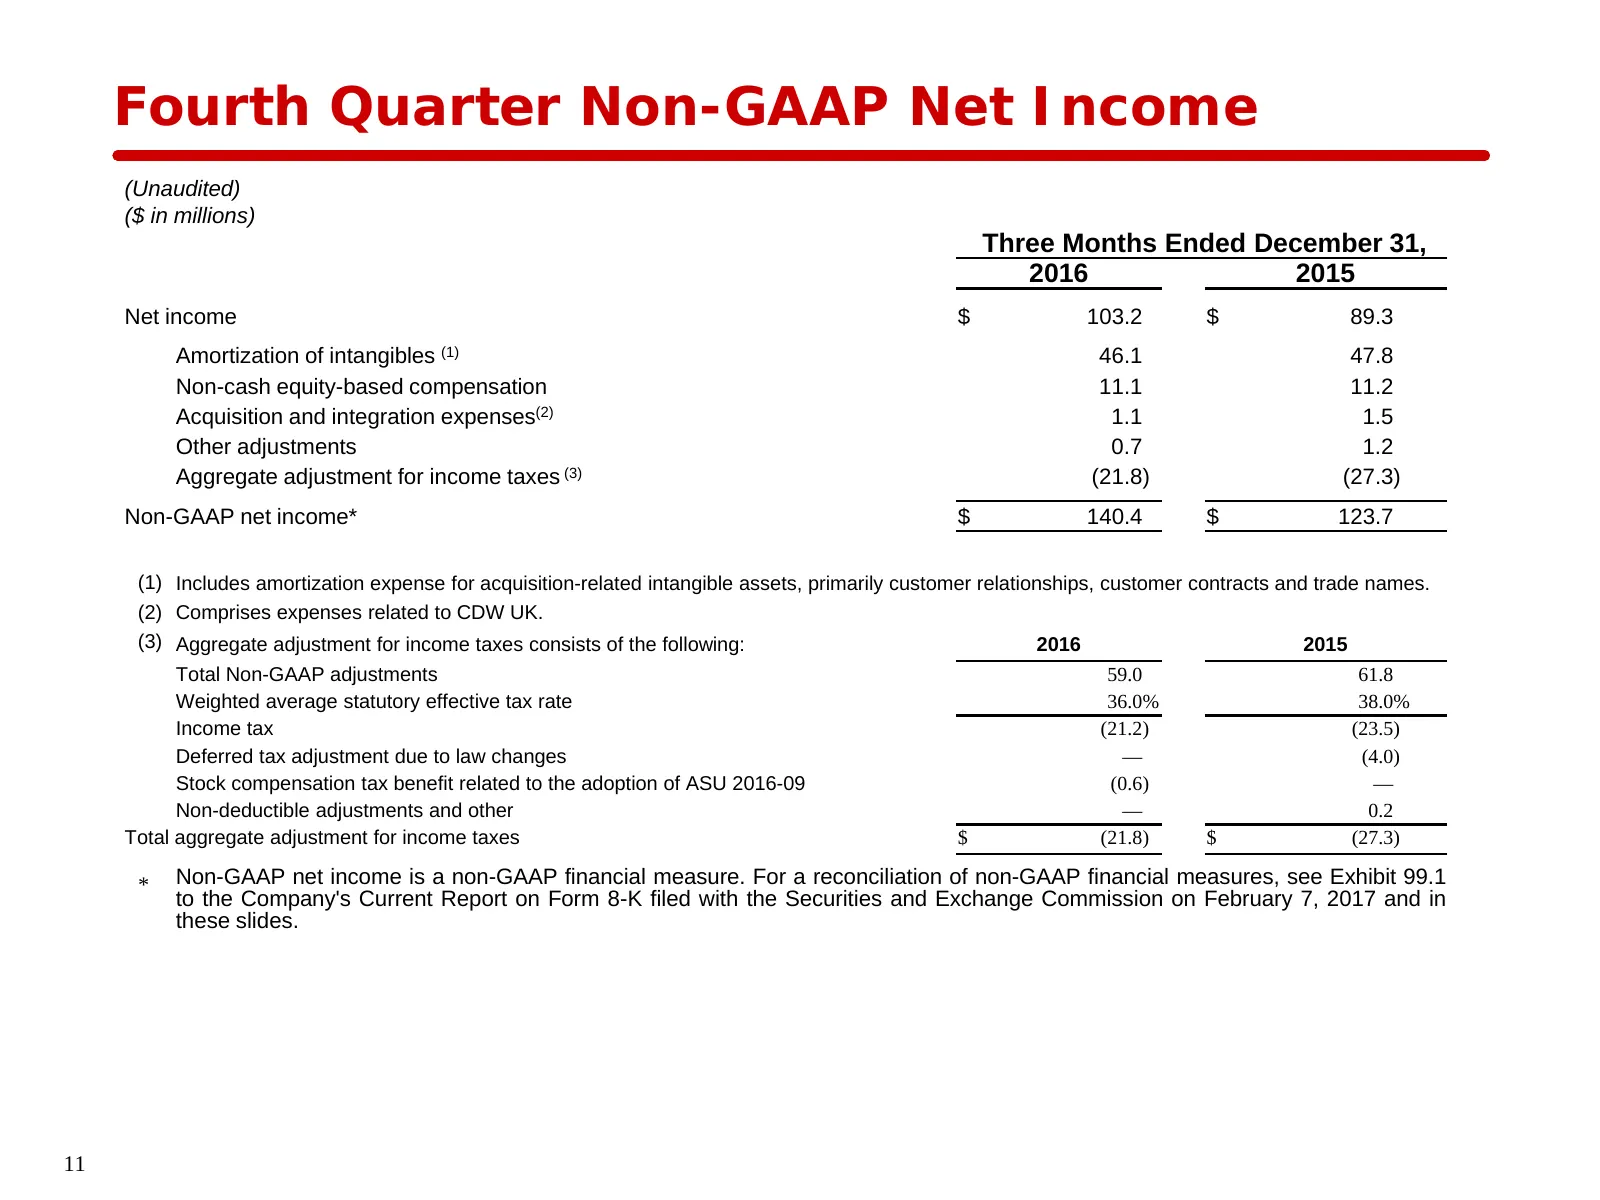
Slide 11: Fourth Quarter Non-GAAP Net Income
Fourth Quarter Non-GAAP Net Income (Unaudited) ($ in millions) Three Months Ended December 31, 2016 2015 Net income $ 103.2 $ 89.3 Amortization of intangibles (1) 46.1 47.8 Non-cash equity-based compensation 11.1 11.2 Acquisition and integration expenses(2) 1.1 1.5 Other adjustments 0.7 1.2 Aggregat
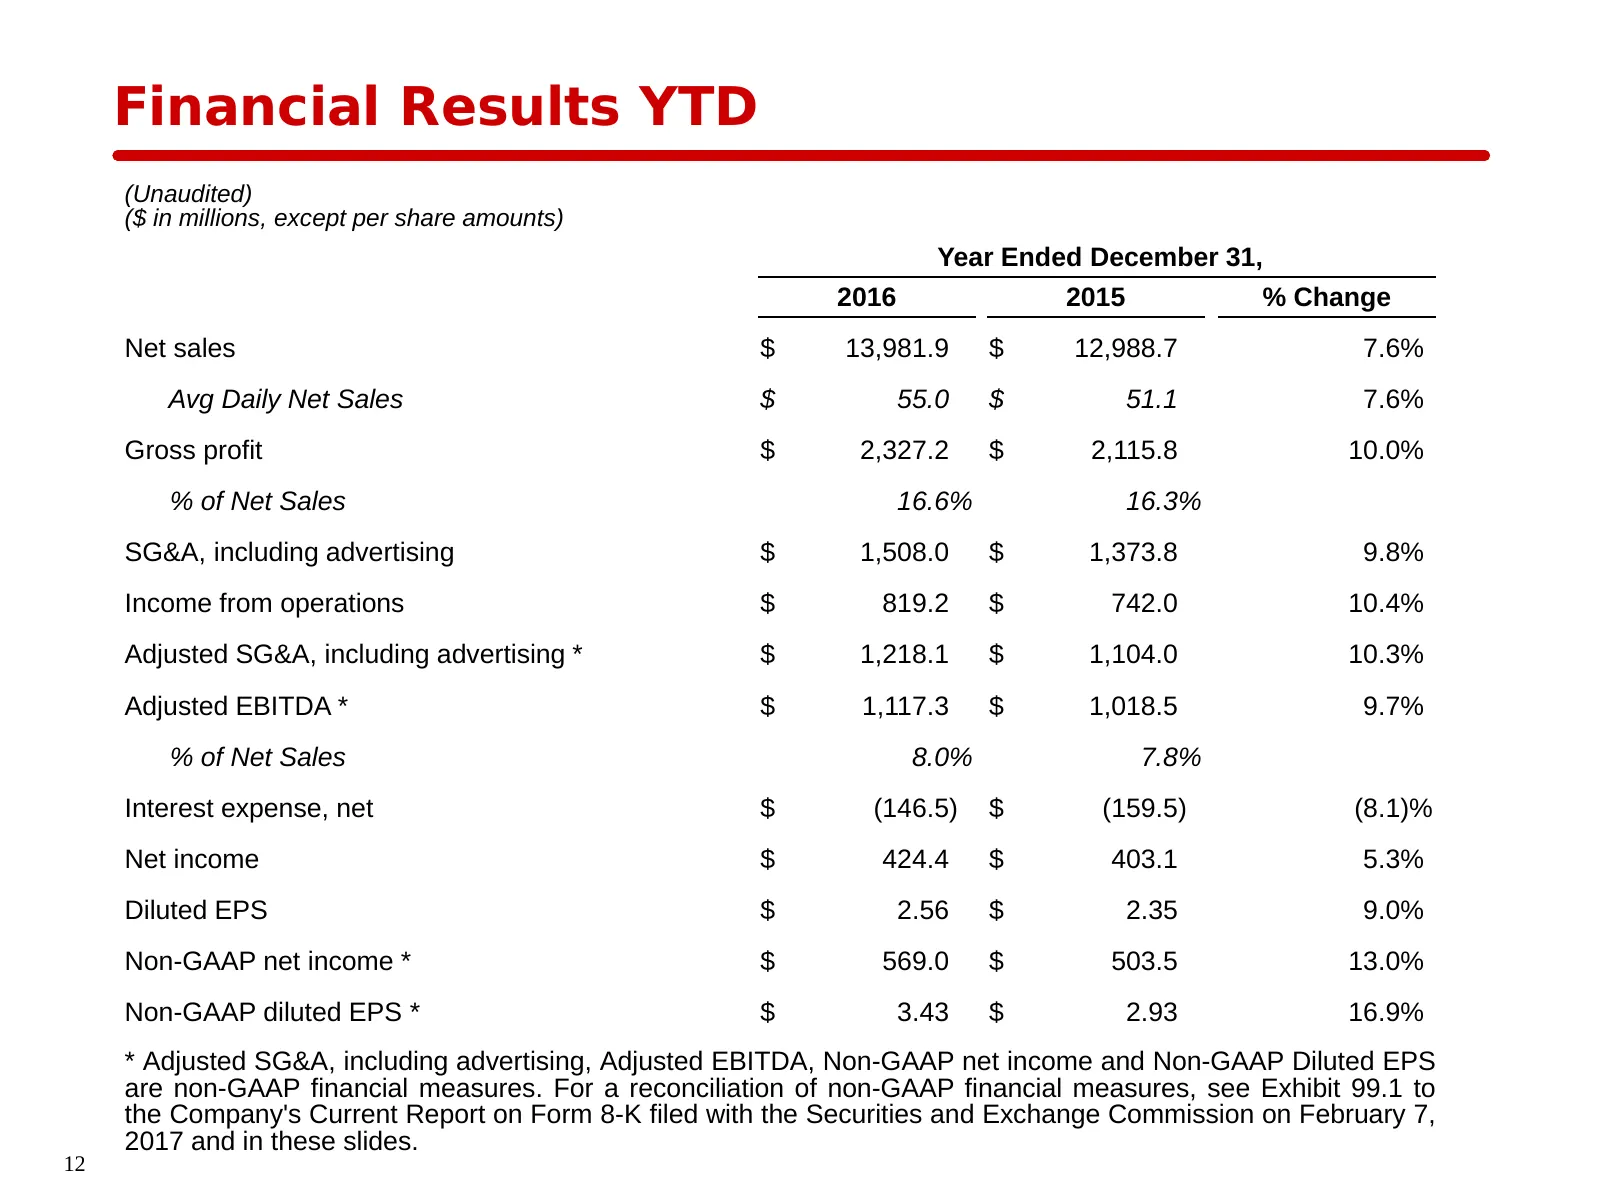
Slide 12: Financial Results YTD
Financial Results YTD (Unaudited) ($ in millions, except per share amounts) Year Ended December 31, 2016 2015 % Change Net sales $ 13,981.9 $ 12,988.7 7.6% Avg Daily Net Sales $ 55.0 $ 51.1 7.6% Gross profit $ 2,327.2 $ 2,115.8 10.0% % of Net Sales 16.6% 16.3% SG&A, including advertising $ 1,508.0 $
Slide 13: Debt and Revolver Availability
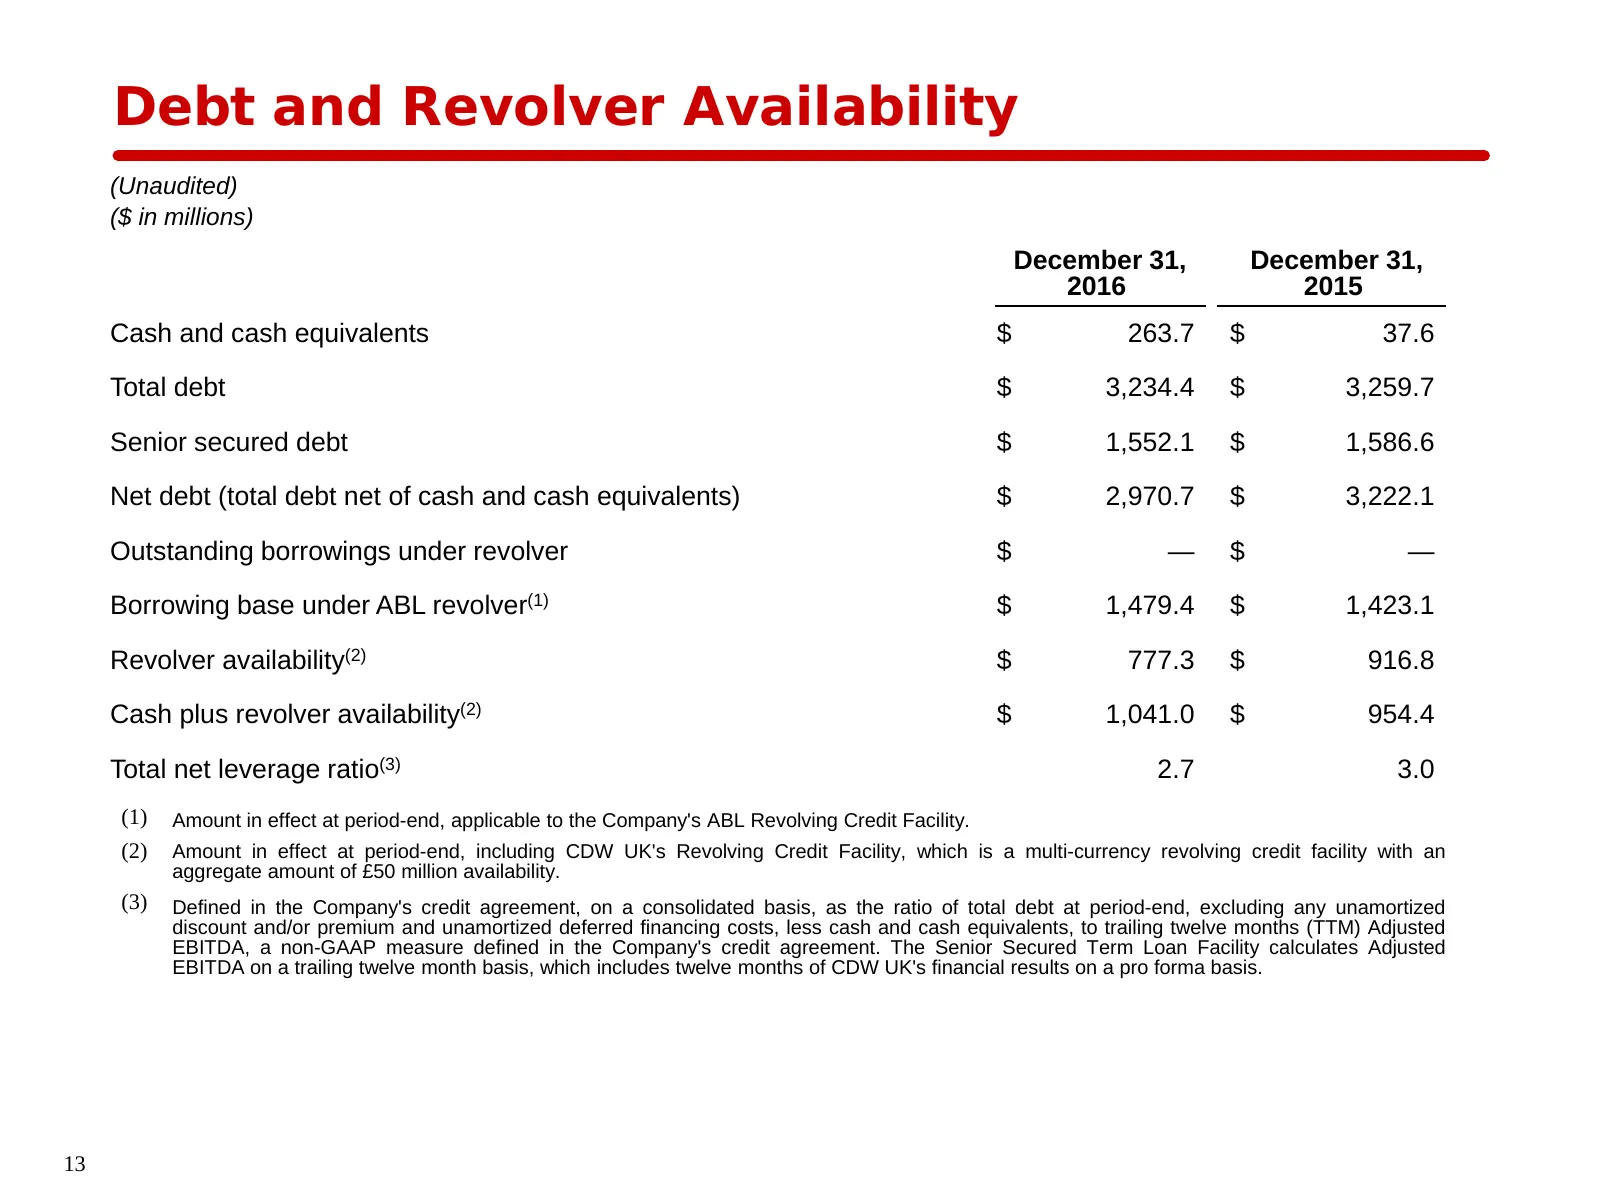
Debt and Revolver Availability (Unaudited) ($ in millions) December 31, December 31, 2016 2015 Cash and cash equivalents $ 263.7 $ 37.6 Total debt $ 3,234.4 $ 3,259.7 Senior secured debt $ 1,552.1 $ 1,586.6 Net debt (total debt net of cash and cash equivalents) $ 2,970.7 $ 3,222.1 Outstanding borrow
Slide 14: Cash Conversion Cycle
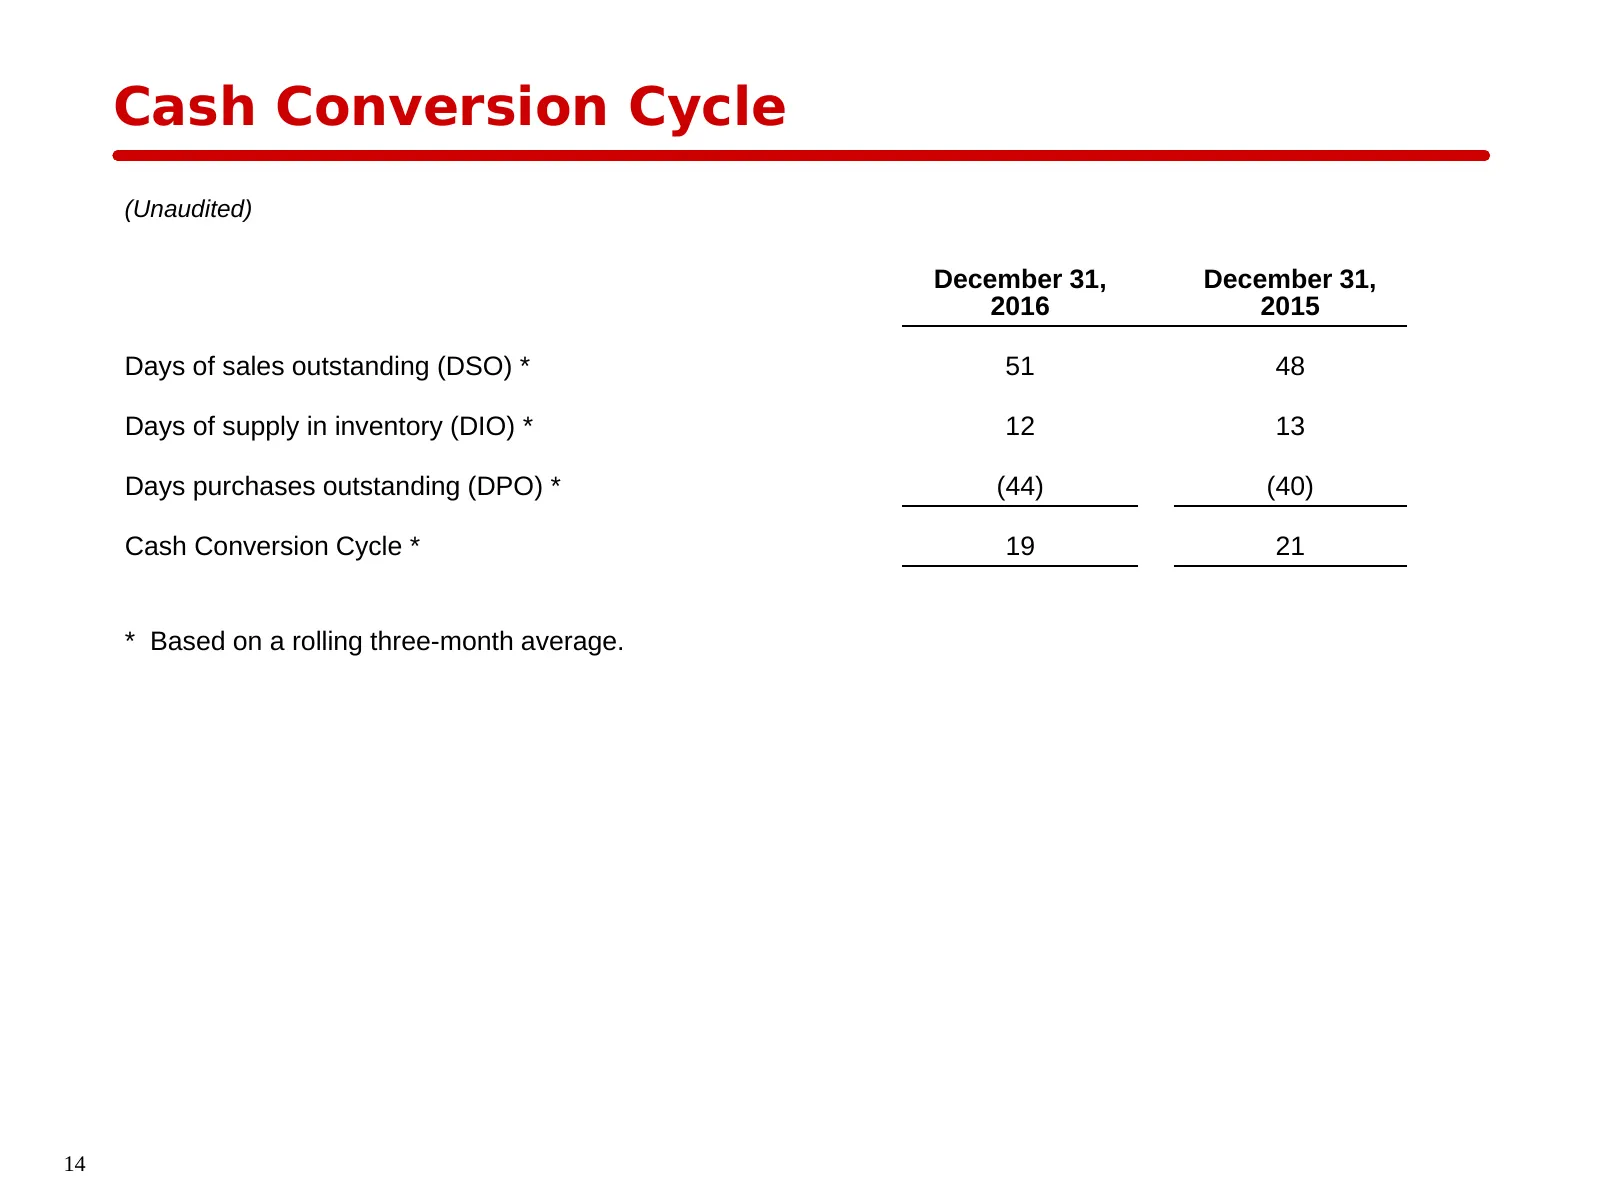
Cash Conversion Cycle (Unaudited) December 31, December 31, 2016 2015 Days of sales outstanding (DSO) * 51 48 Days of supply in inventory (DIO) * 12 13 Days purchases outstanding (DPO) * (44) (40) Cash Conversion Cycle * 19 21 * Based on a rolling three-month average. 14
Slide 15: Four Capital Allocation Priorities
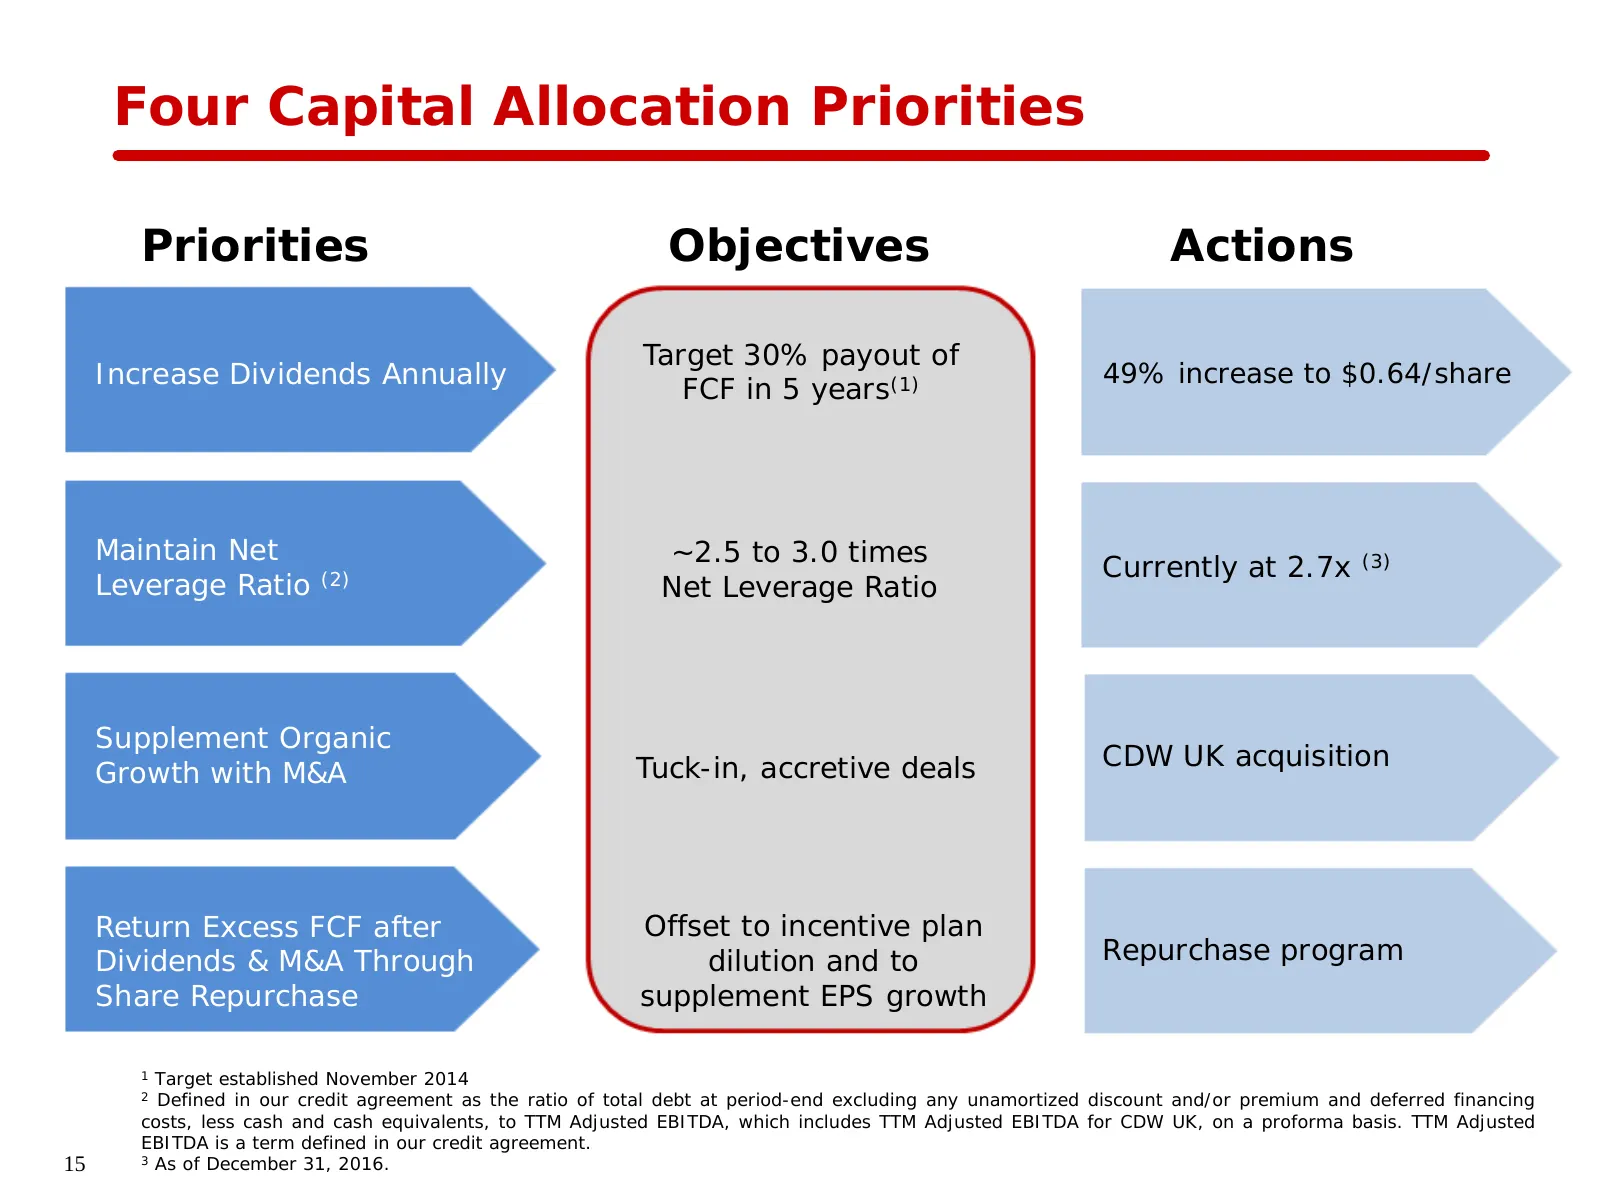
Four Capital Allocation Priorities Priorities Objectives Actions Target 30% payout of Increase Dividends Annually 49% increase to $0.64/share FCF in 5 years(1) Maintain Net ~2.5 to 3.0 times Currently at 2.7x (3) Leverage Ratio (2) Net Leverage Ratio Supplement Organic Tuck-in, accretive deals CDW U
Slide 16: Capital Allocation Priorities Support Medium Term Targets
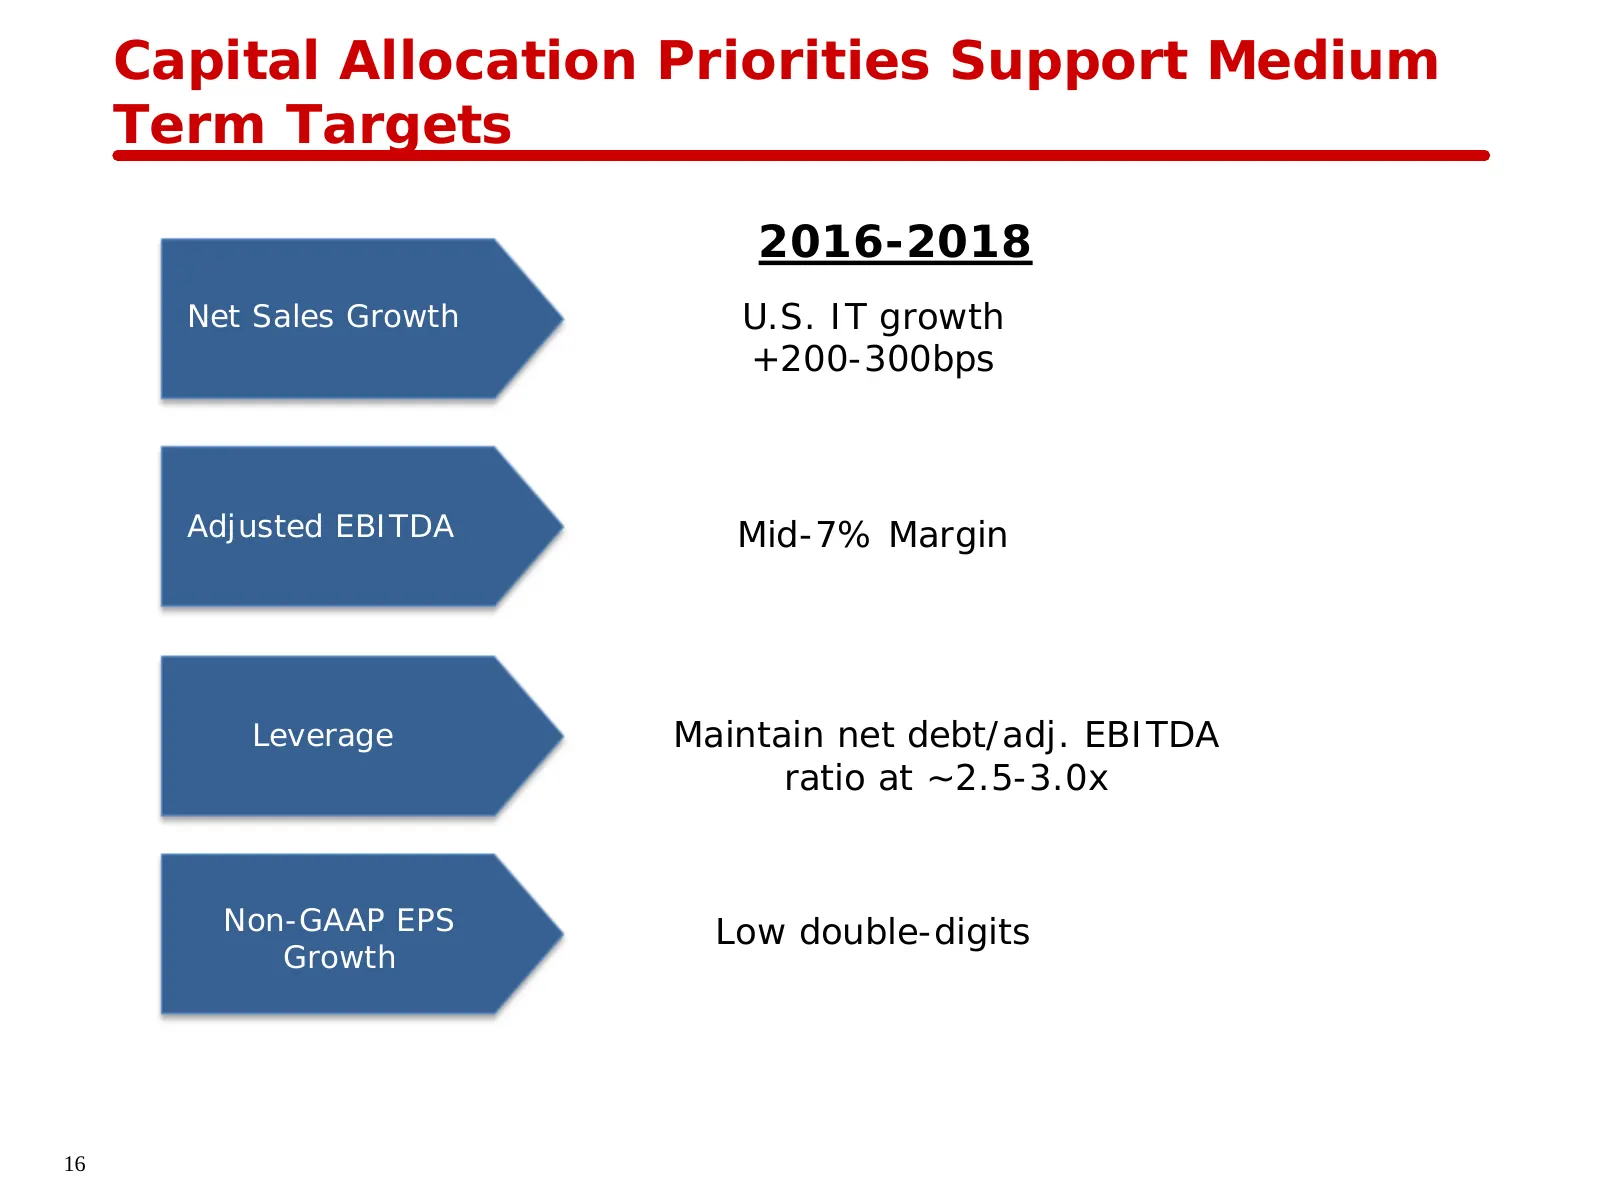
Capital Allocation Priorities Support Medium Term Targets 2016-2018 Net Sales Growth U.S. IT growth +200-300bps Adjusted EBITDA Mid-7% Margin Leverage Maintain net debt/adj. EBITDA ratio at ~2.5-3.0x Non-GAAP EPS Low double-digits Growth 16
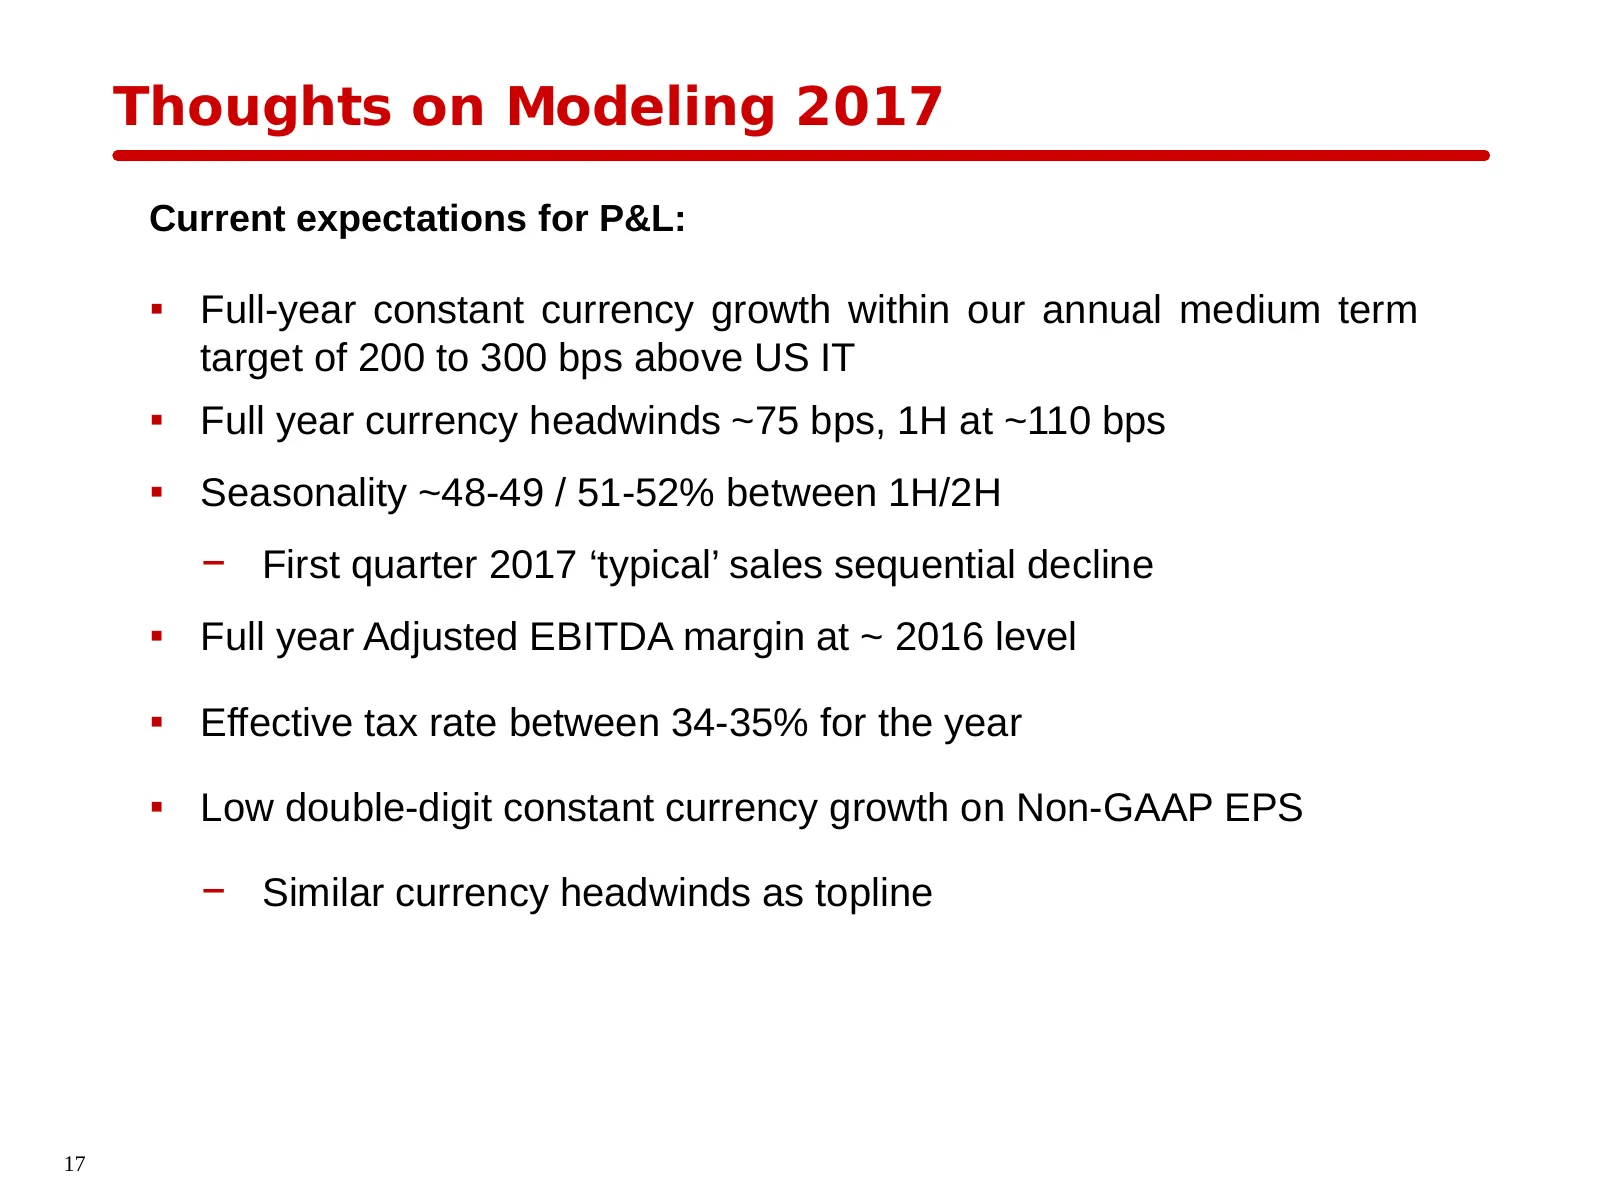
Slide 17: Thoughts on Modeling 2017
Thoughts on Modeling 2017 Current expectations for P&L: ▪ Full-year constant currency growth within our annual medium term target of 200 to 300 bps above US IT ▪ Full year currency headwinds ~75 bps, 1H at ~110 bps ▪ Seasonality ~48-49 / 51-52% between 1H/2H − First quarter 2017 ‘typical’ sales sequ
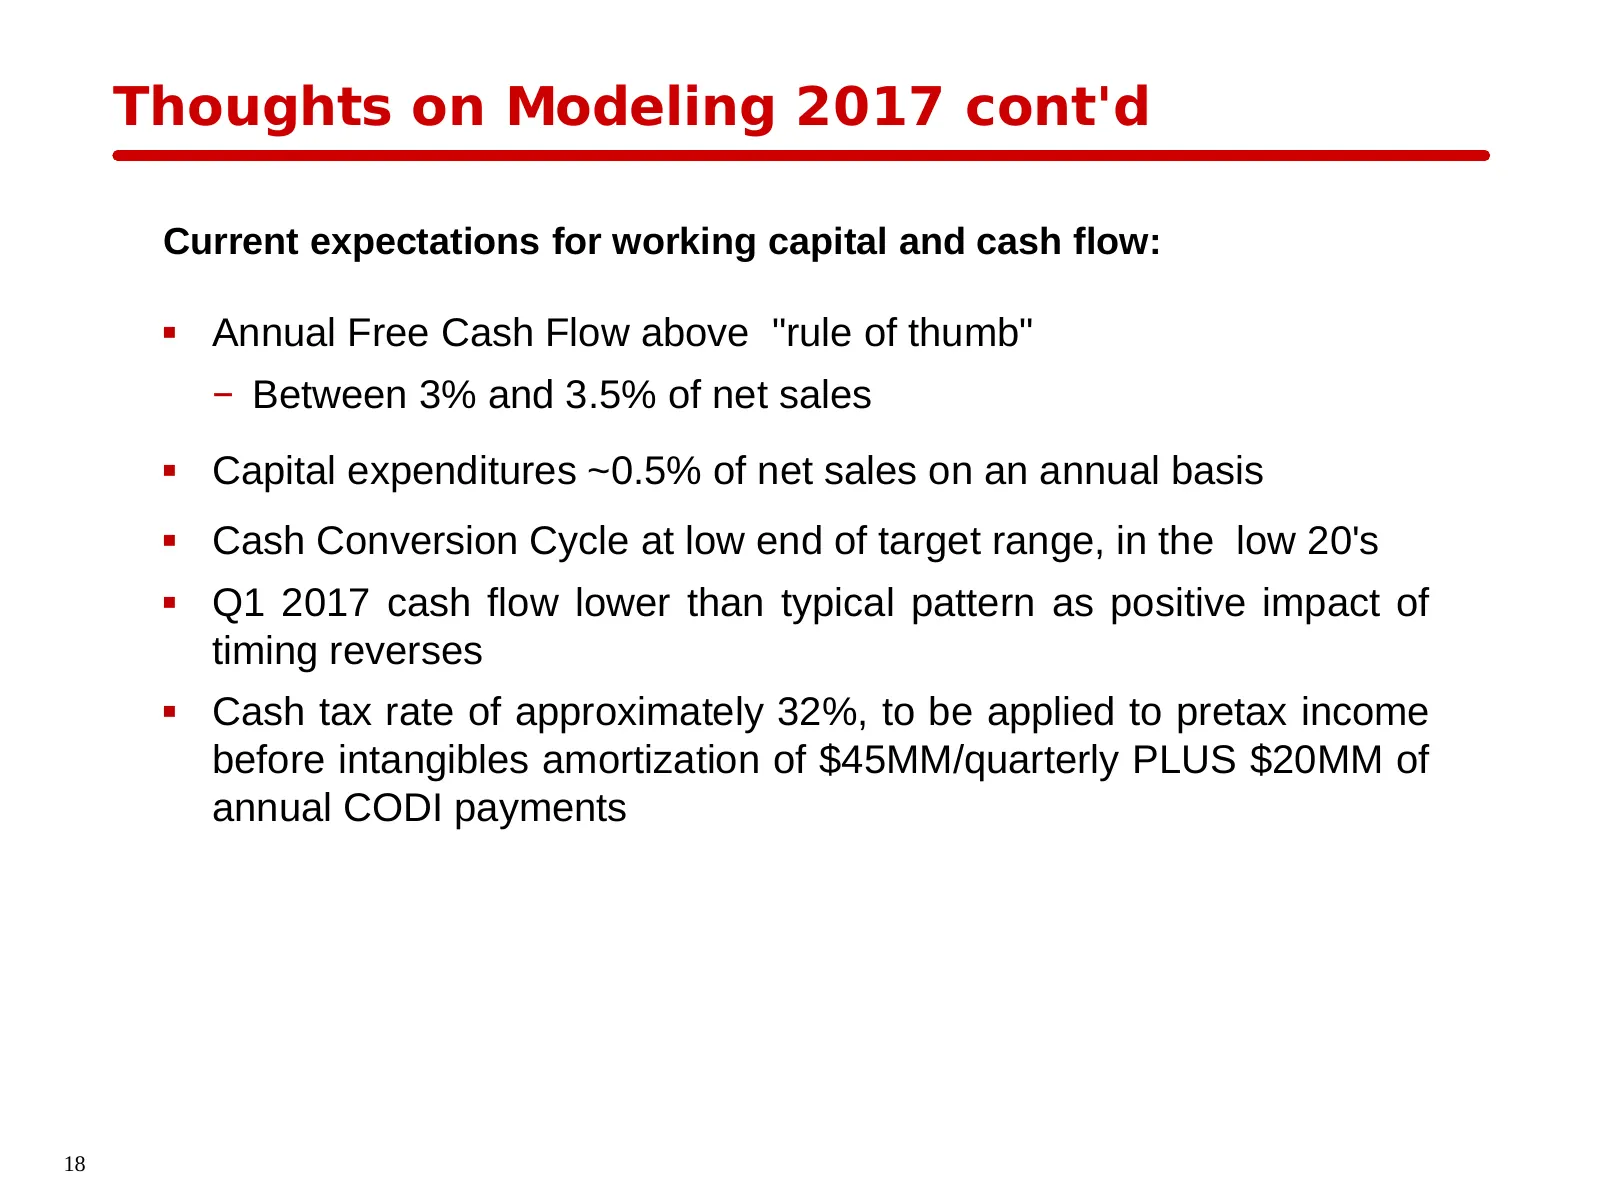
Slide 18: Thoughts on Modeling 2017 cont'd
Thoughts on Modeling 2017 cont'd Current expectations for working capital and cash flow: Annual Free Cash Flow above "rule of thumb" − Between 3% and 3.5% of net sales Capital expenditures ~0.5% of net sales on an annual basis Cash Conversion Cycle at low end of target range, in the low 20's

Slide 19: Questions and Answers
al Questions and Answers DU PEOPLE WHO GET IT 4 |
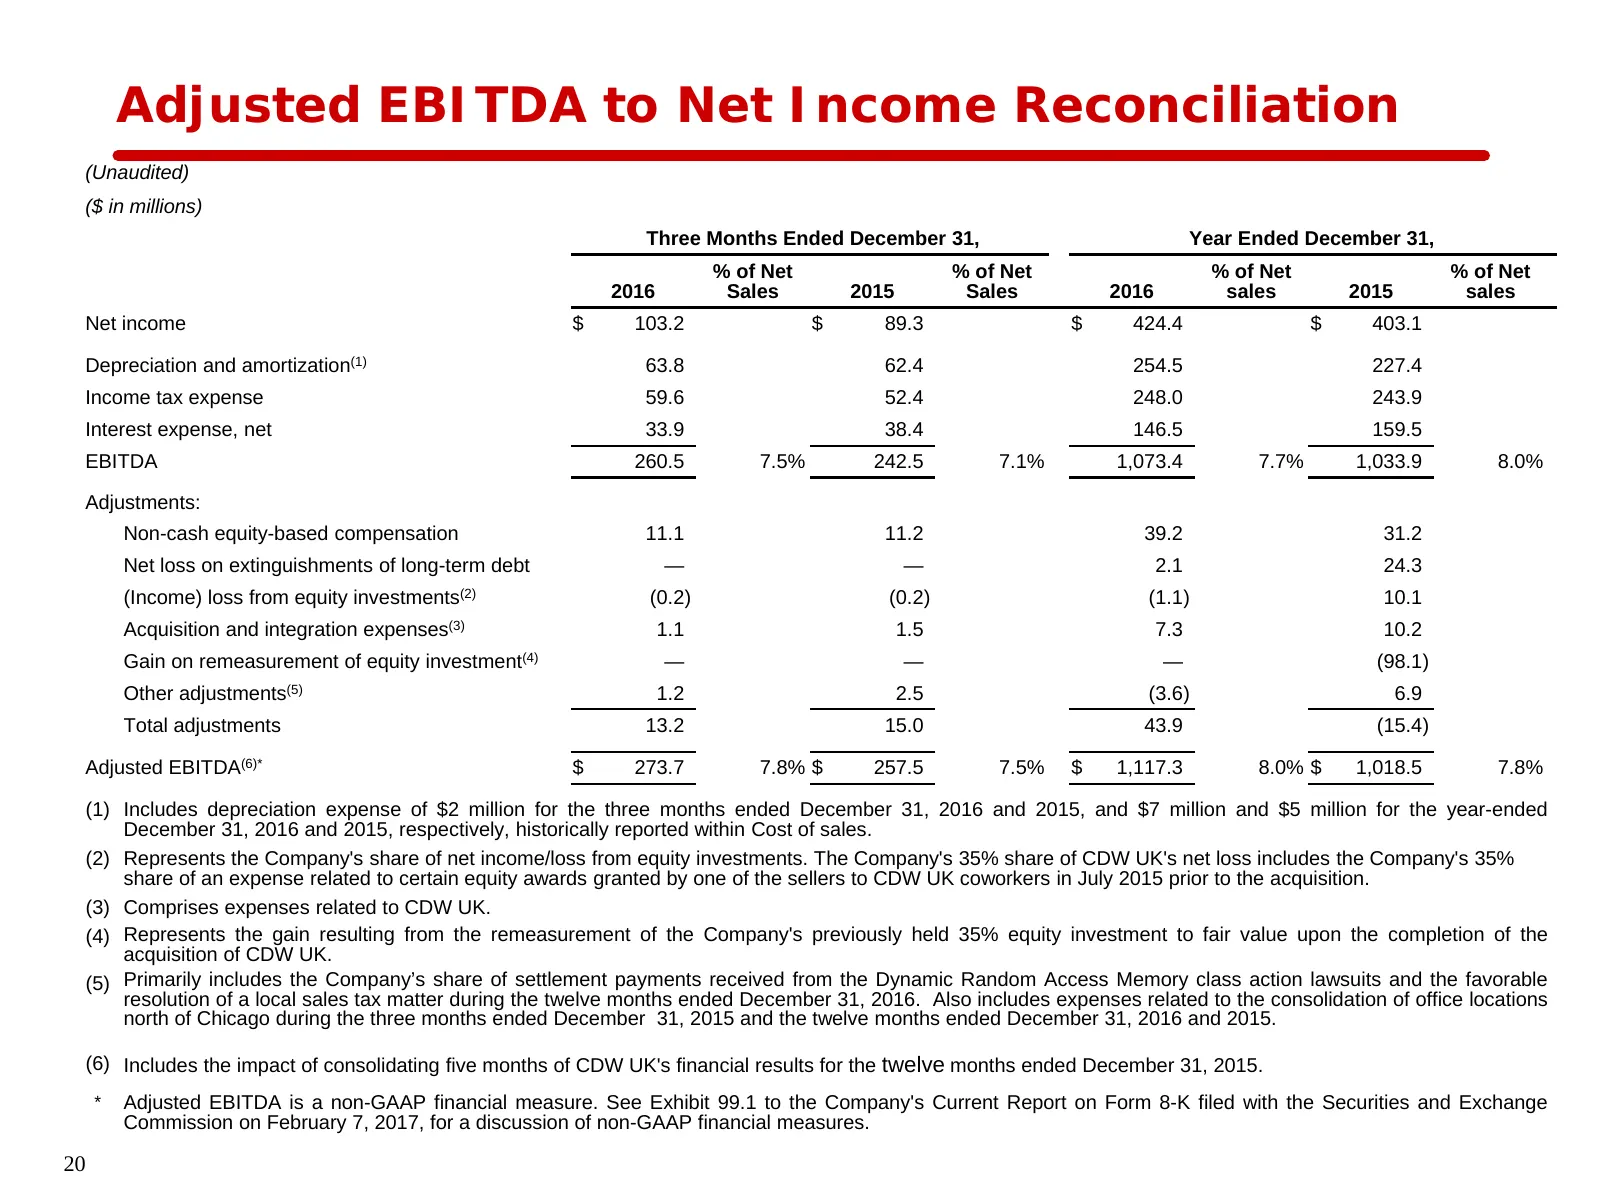
Slide 20: Adjusted EBITDA to Net Income Reconciliation
Adjusted EBITDA to Net Income Reconciliation (Unaudited) ($ in millions) Three Months Ended December 31, Year Ended December 31, % of Net % of Net % of Net % of Net 2016 Sales 2015 Sales 2016 sales 2015 sales Net income $ 103.2 $ 89.3 $ 424.4 $ 403.1 Depreciation and amortization(1) 63.8 62.4 254.5
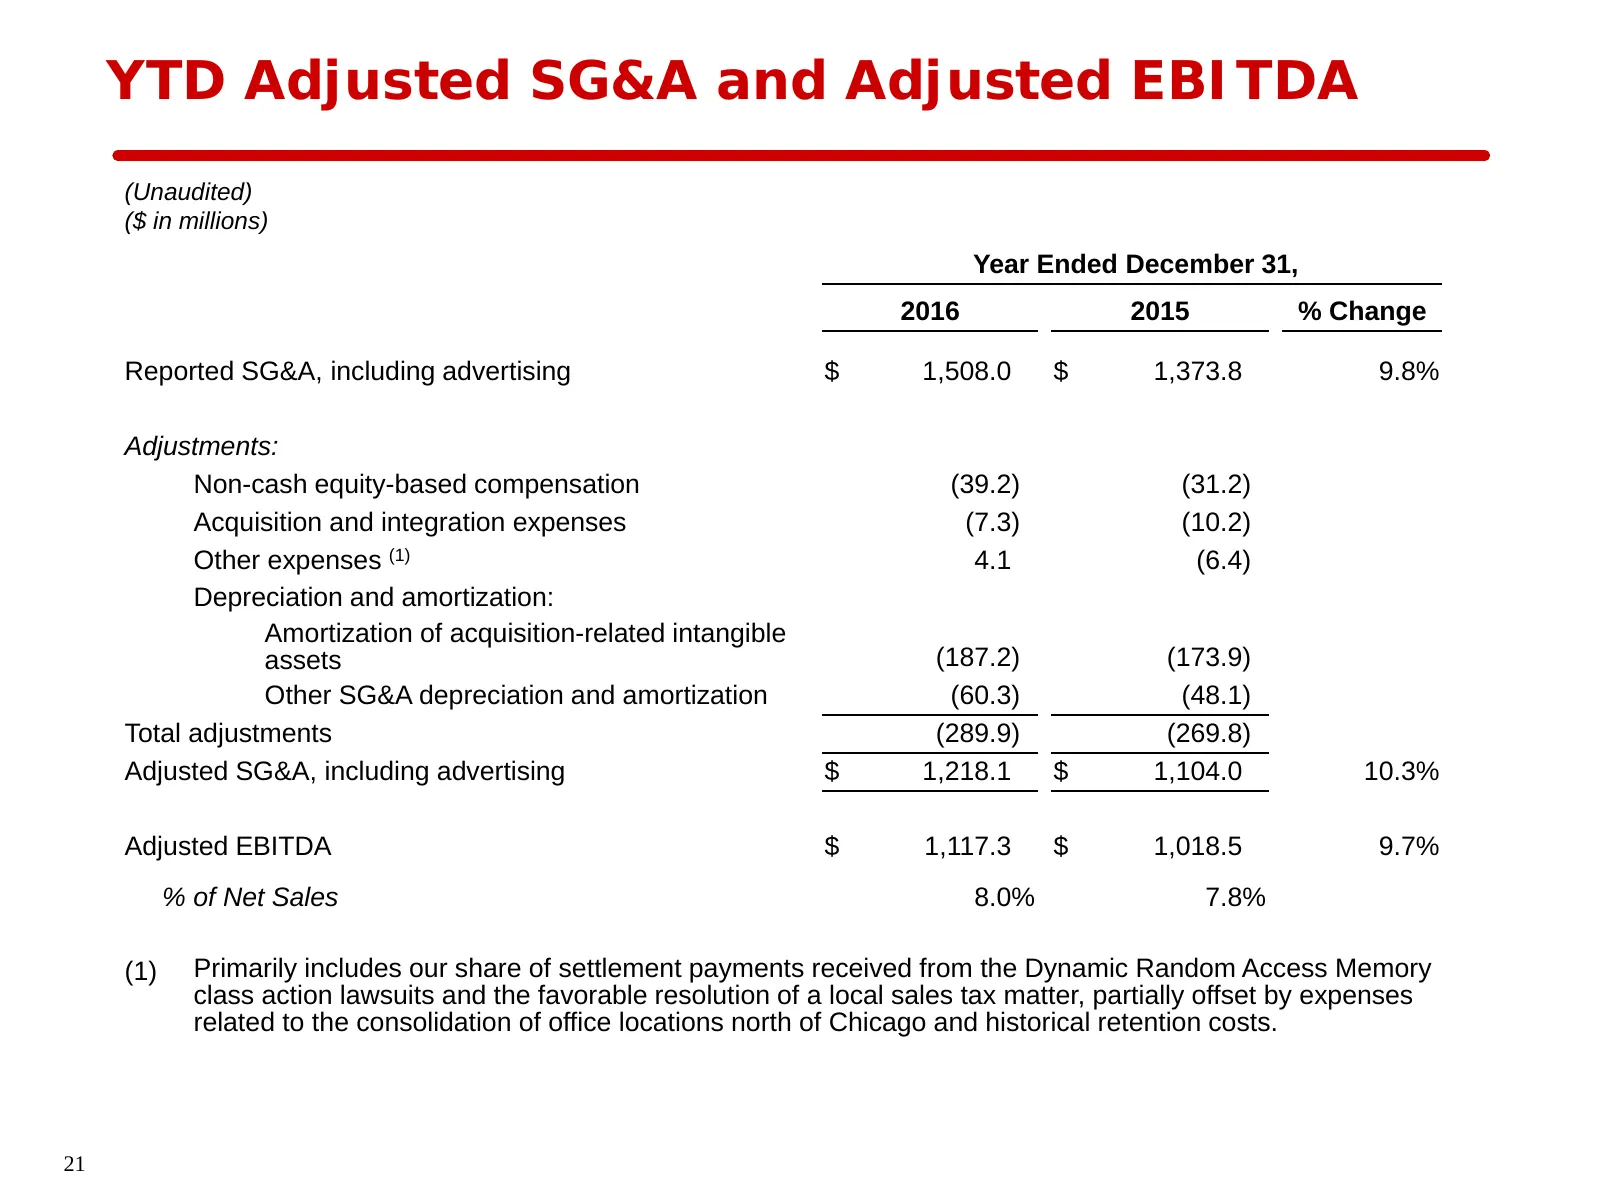
Slide 21: YTD Adjusted SG&A and Adjusted EBITDA
YTD Adjusted SG&A and Adjusted EBITDA (Unaudited) ($ in millions) Year Ended December 31, 2016 2015 % Change Reported SG&A, including advertising $ 1,508.0 $ 1,373.8 9.8% Adjustments: Non-cash equity-based compensation (39.2) (31.2) Acquisition and integration expenses (7.3) (10.2) Other expenses (1
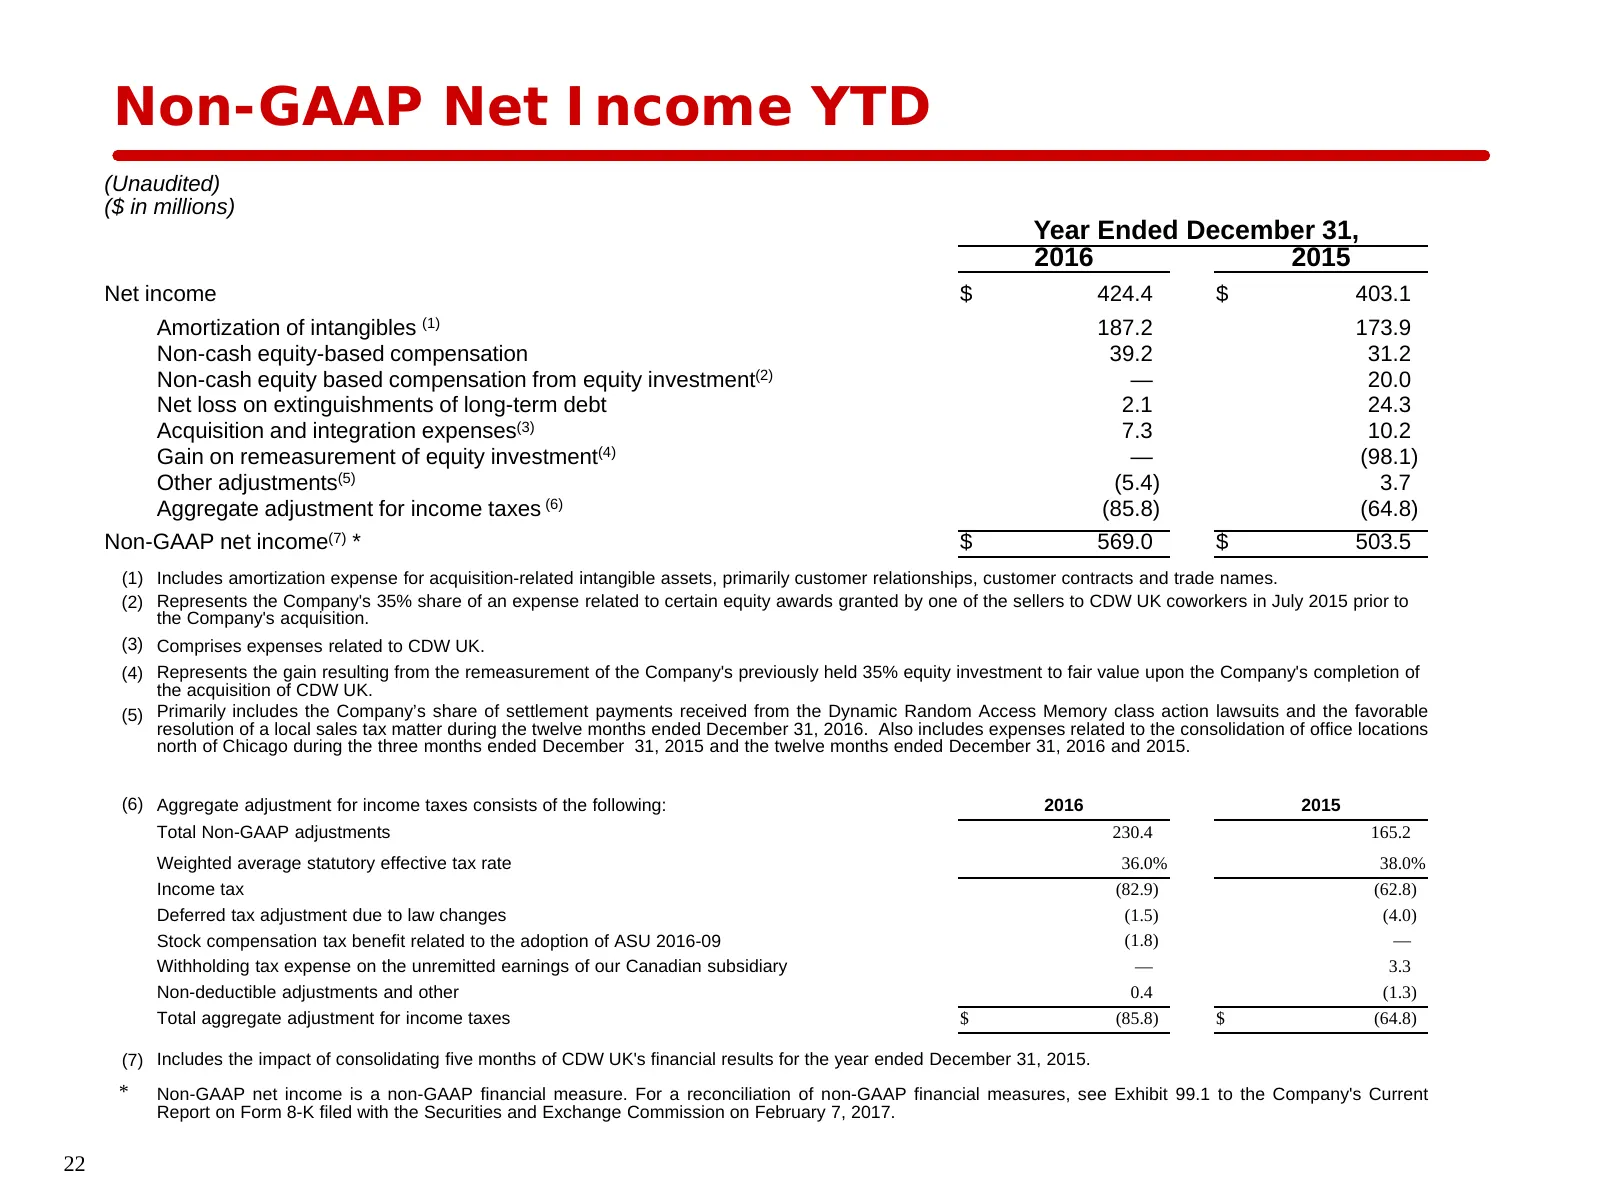
Slide 22: Non-GAAP Net Income YTD
Non-GAAP Net Income YTD (Unaudited) ($ in millions) Year Ended December 31, 2016 2015 Net income $ 424.4 $ 403.1 Amortization of intangibles (1) 187.2 173.9 Non-cash equity-based compensation 39.2 31.2 Non-cash equity based compensation from equity investment(2) — 20.0 Net loss on extinguishments of
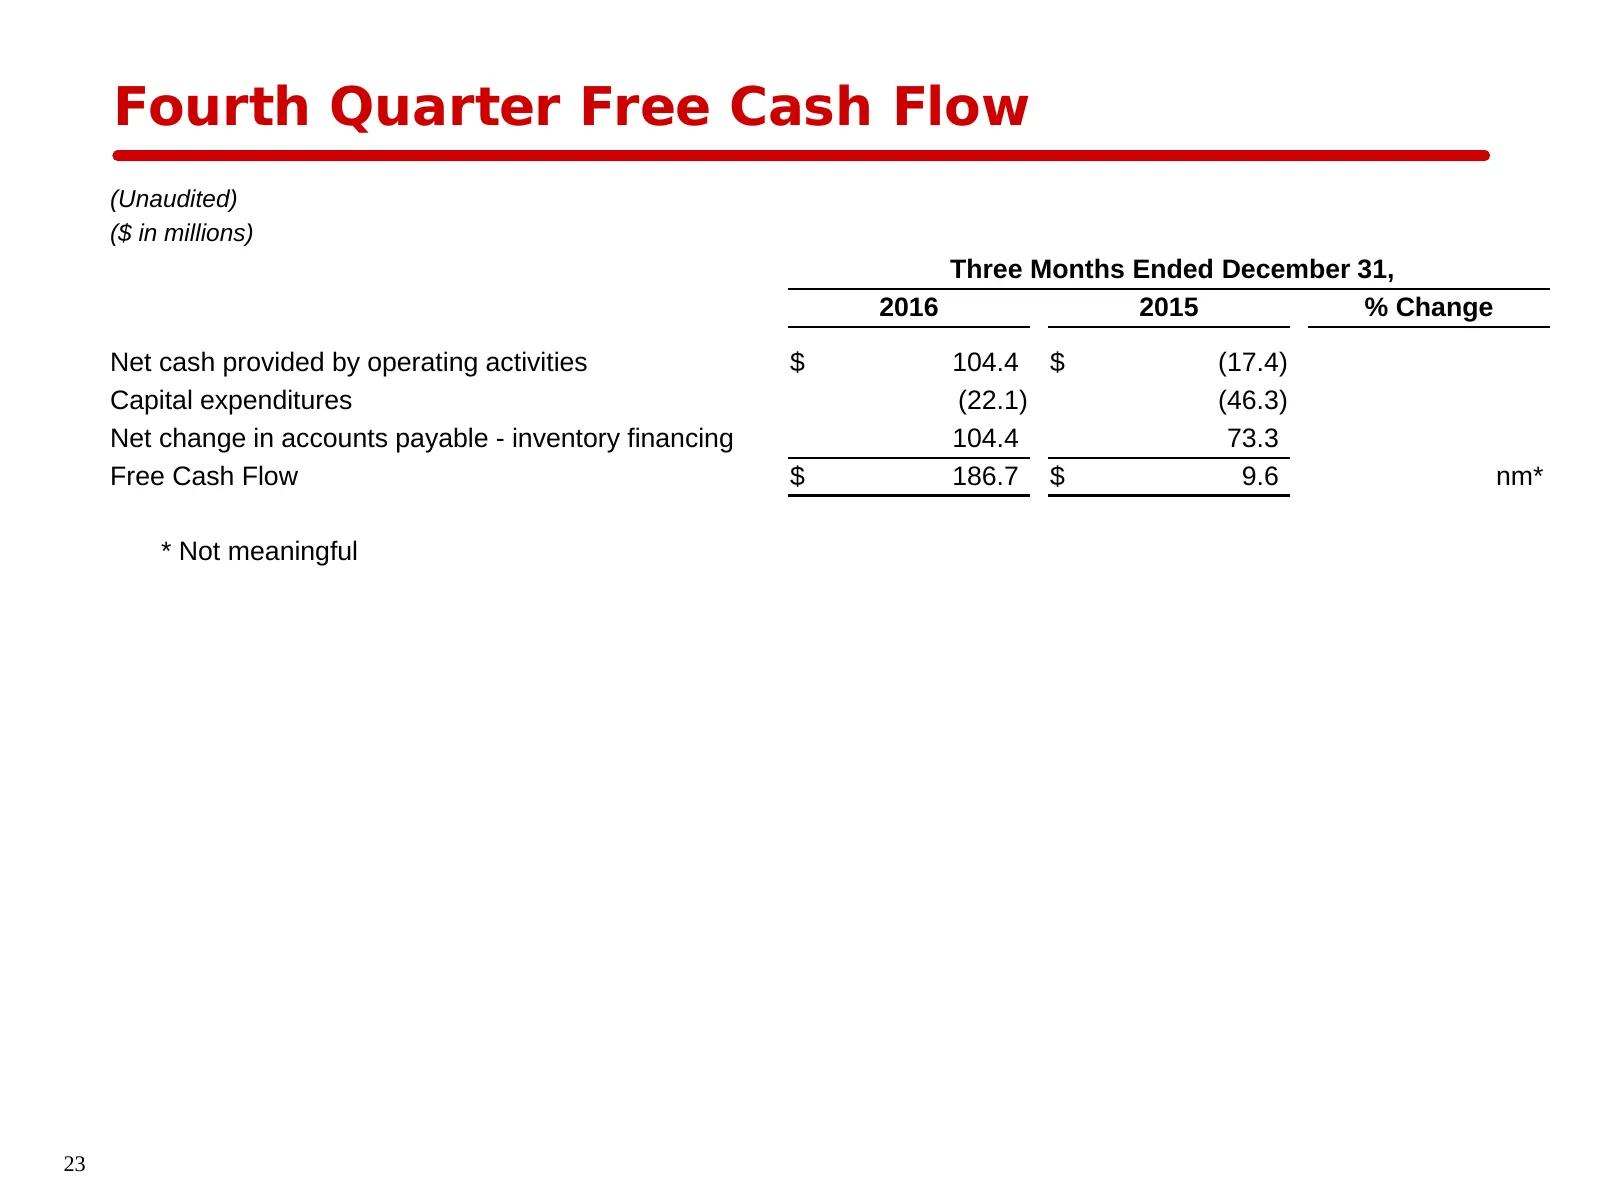
Slide 23: Fourth Quarter Free Cash Flow
Fourth Quarter Free Cash Flow (Unaudited) ($ in millions) Three Months Ended December 31, 2016 2015 % Change Net cash provided by operating activities $ 104.4 $ (17.4) Capital expenditures (22.1) (46.3) Net change in accounts payable - inventory financing 104.4 73.3 Free Cash Flow $ 186.7 $ 9.6 nm*
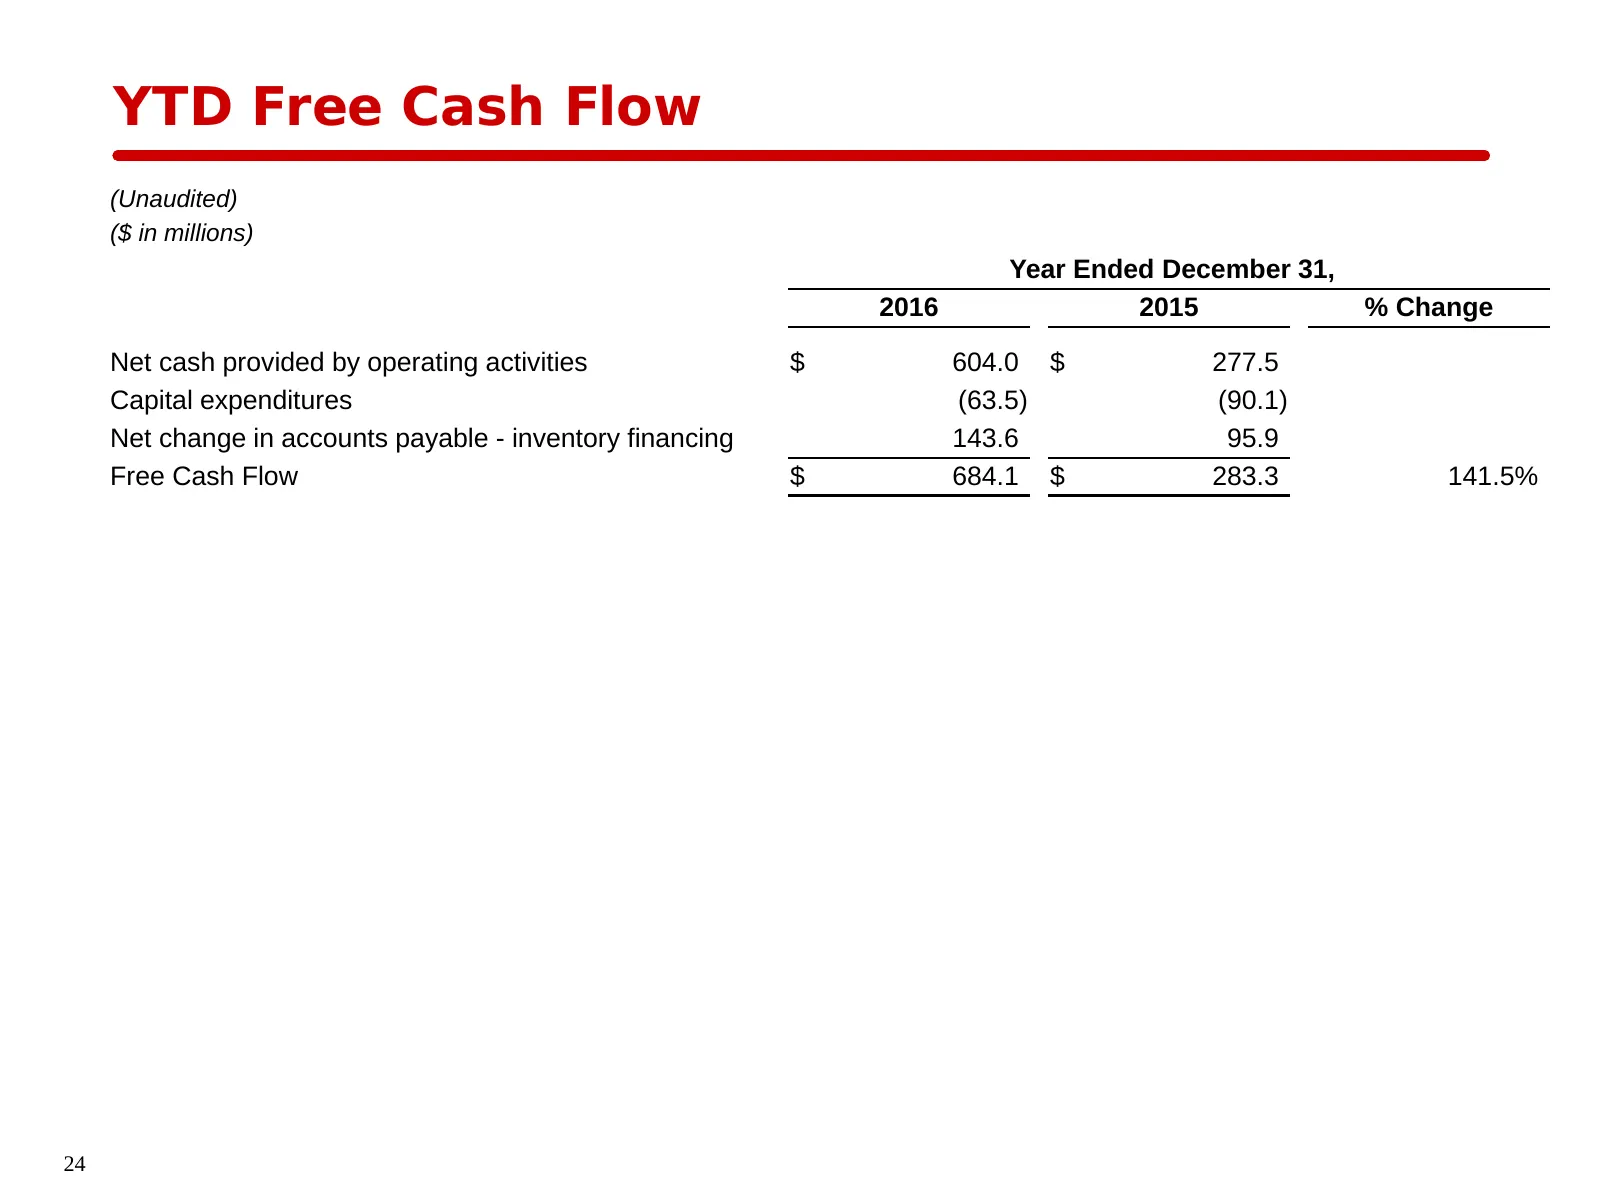
Slide 24: YTD Free Cash Flow
YTD Free Cash Flow (Unaudited) ($ in millions) Year Ended December 31, 2016 2015 % Change Net cash provided by operating activities $ 604.0 $ 277.5 Capital expenditures (63.5) (90.1) Net change in accounts payable - inventory financing 143.6 95.9 Free Cash Flow $ 684.1 $ 283.3 141.5% 24
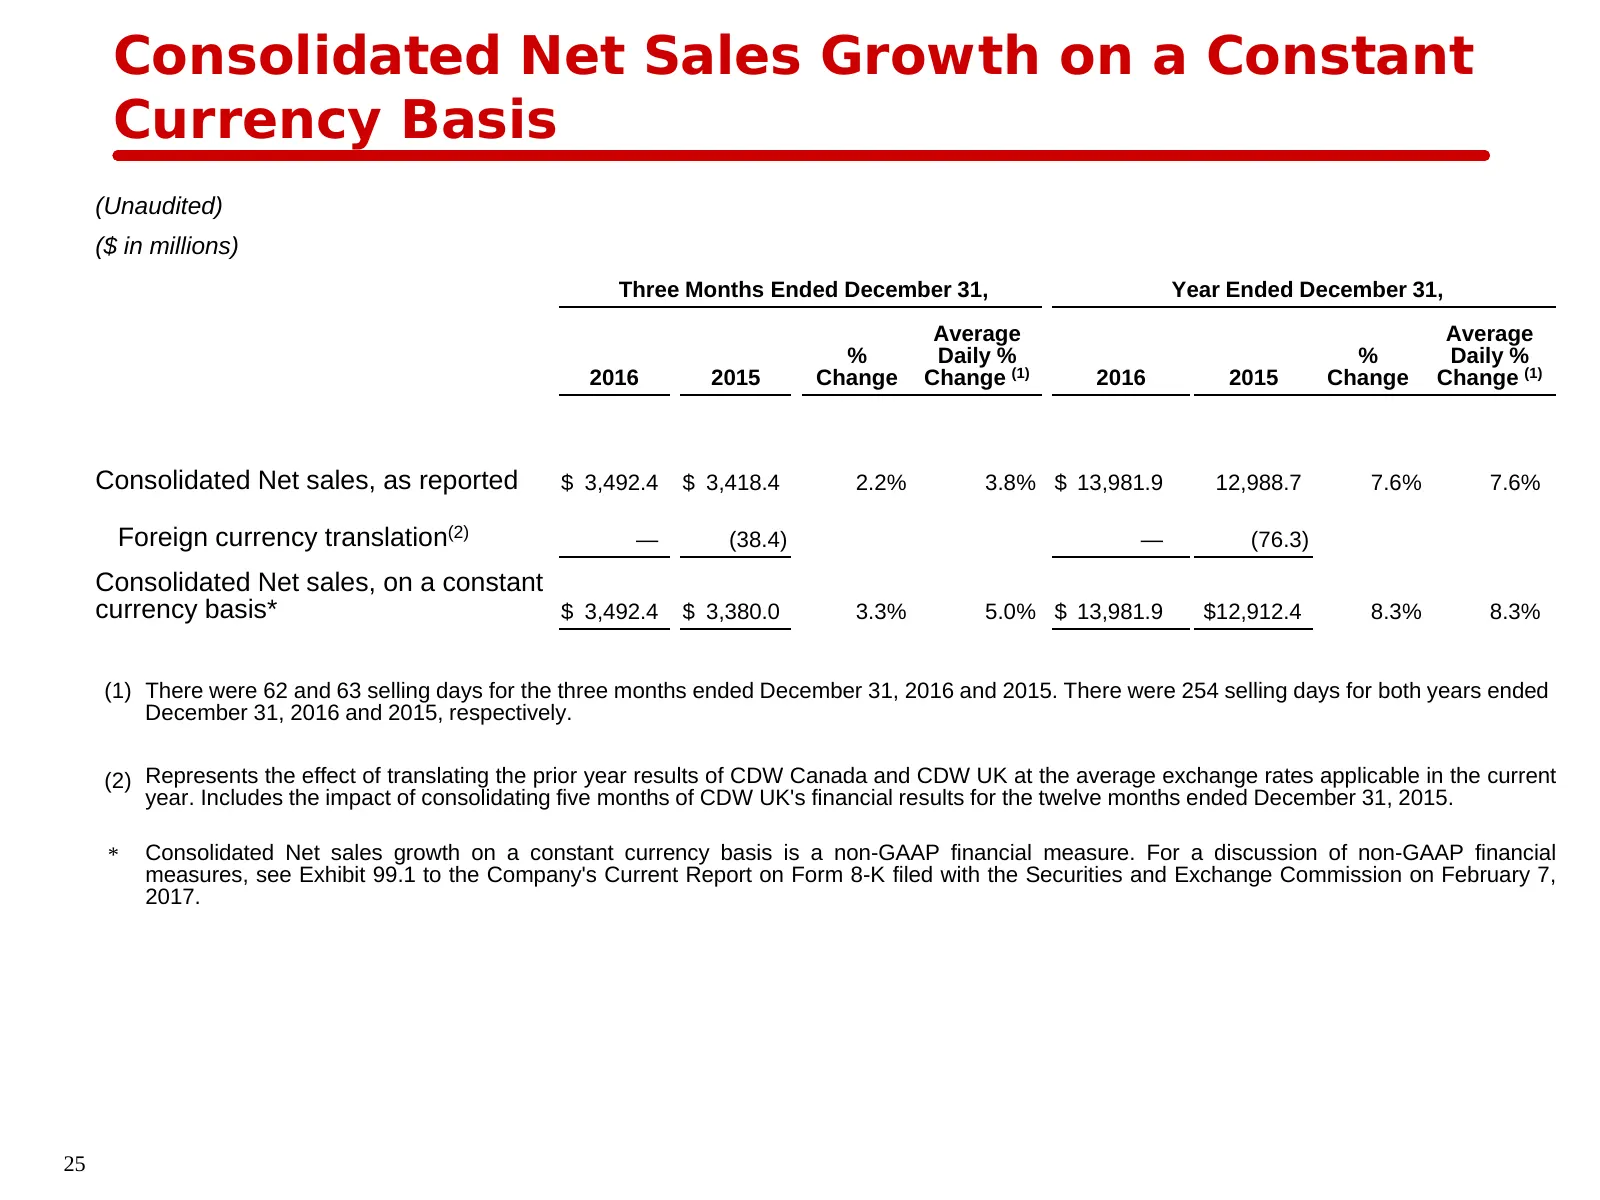
Slide 25: Consolidated Net Sales Growth on a Constant Currency Basis
Consolidated Net Sales Growth on a Constant Currency Basis (Unaudited) ($ in millions) Three Months Ended December 31, Year Ended December 31, Average Average % Daily % % Daily % 2016 2015 Change Change (1) 2016 2015 Change Change (1) Consolidated Net sales, as reported $ 3,492.4 $ 3,418.4 2.2% 3.8%
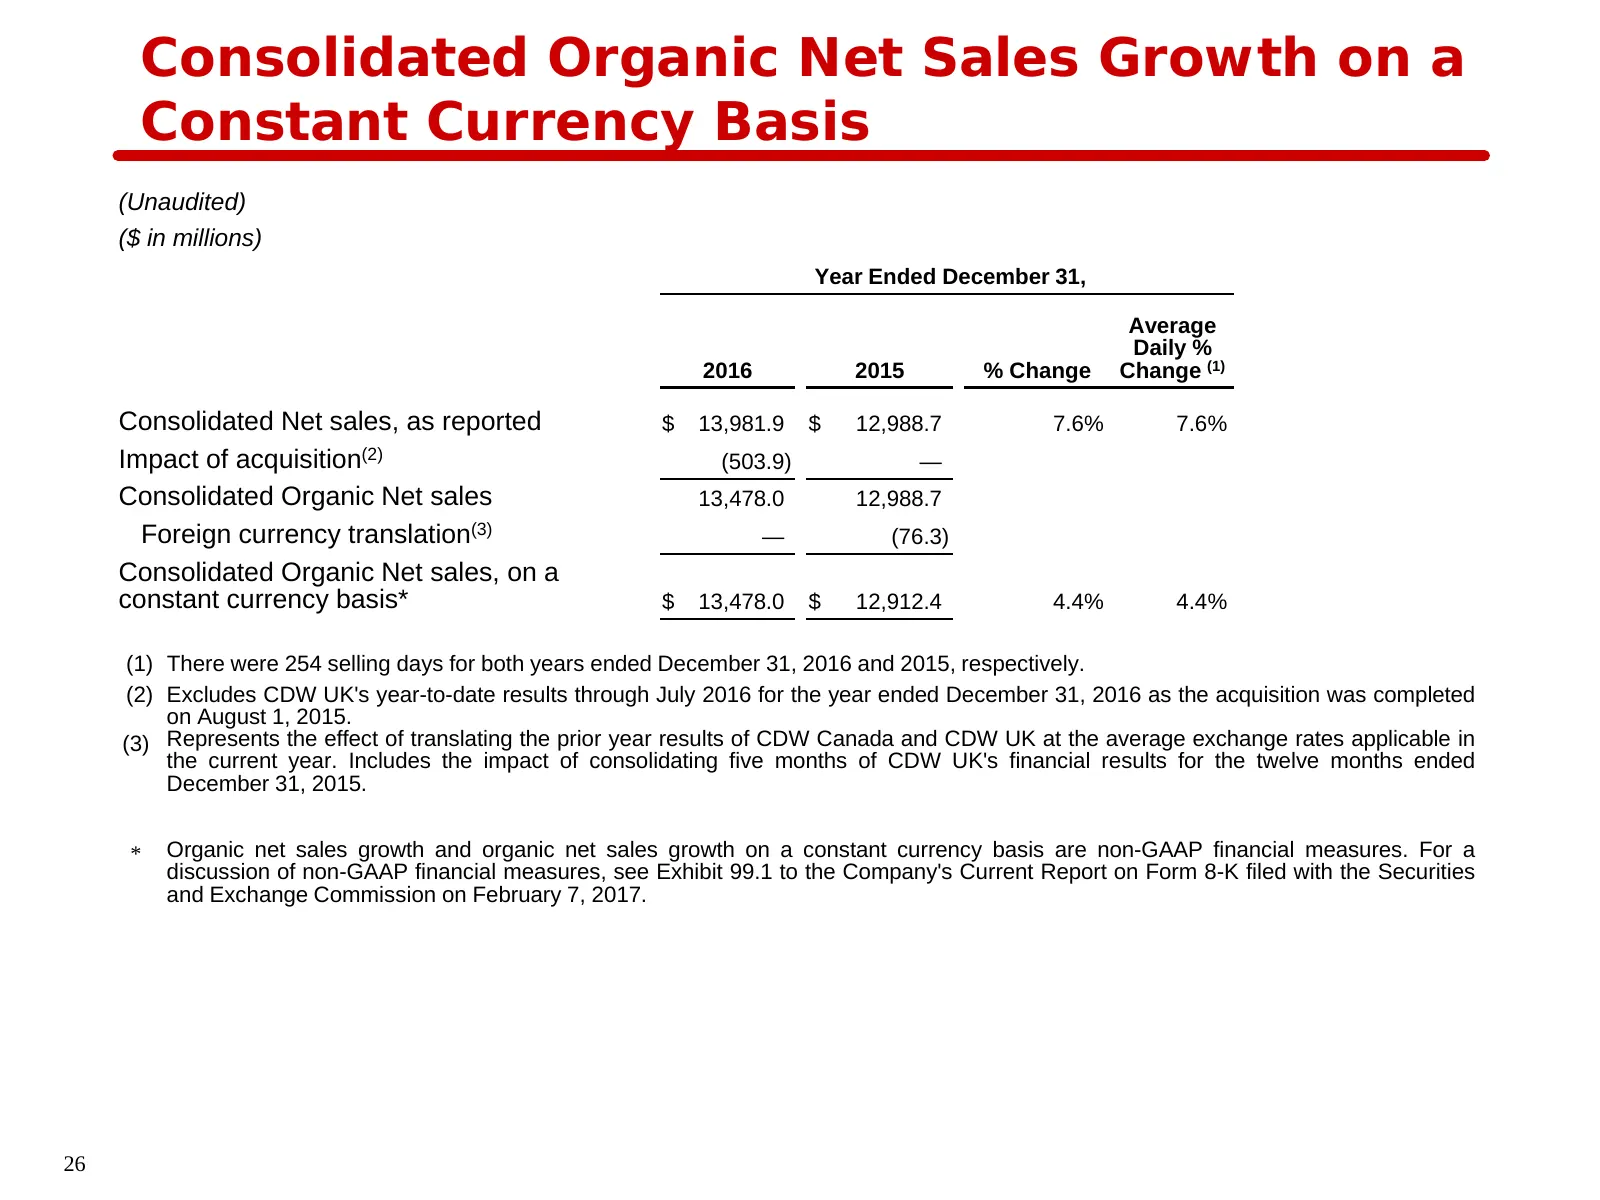
Slide 26: Consolidated Organic Net Sales Growth on a Constant Currency Basis
Consolidated Organic Net Sales Growth on a Constant Currency Basis (Unaudited) ($ in millions) Year Ended December 31, Average Daily % 2016 2015 % Change Change (1) Consolidated Net sales, as reported $ 13,981.9 $ 12,988.7 7.6% 7.6% Impact of acquisition(2) (503.9) — Consolidated Organic Net sales 1
Source: Internet Archive copy of s205.q4cdn.com
More decks from CDW Corporation
 Q3 2026 Earnings Presentation15 slides · Nov 4, 2026
 Q2 2026 Earnings Presentation15 slides · Aug 5, 2026
 Q1 2026 Earnings Presentation15 slides · May 6, 2026
 Investor Presentation (May 2026)23 slides · May 2026
 Q4 2025 Earnings Presentation17 slides · Feb 4, 2026
 Investor Presentation (2025)25 slides · Dec 6, 2025