Grant Prideco — Credit Suisse First Boston Vail Energy Conference 2005
30 slides from Grant Prideco's conference presentation, Feb 1, 2005

Slide 1: Credit Suisse First Boston - Vail Energy Conference
Credit Suisse First Boston - Vail Energy Conference February 2, 2005 Mike McShane, Chairman & CEO
Slide 2: Forward-Looking Statements
The information in this presentation contains forward-looking statements within the meaning of the Private Securities Litigation Reform Act of 1995 concerning, among other things, Grant Prideco's prospects for its operations and future demand for its products and services, all of which are subject t
Slide 3: 2004 Highlights
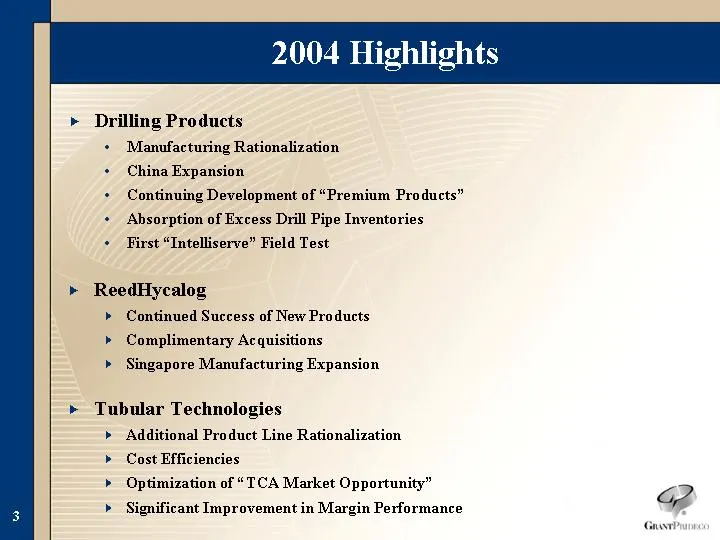
2004 Highlights Drilling Products Manufacturing Rationalization China Expansion Continuing Development of "Premium Products" Absorption of Excess Drill Pipe Inventories First "Intelliserve" Field Test Tubular Technologies Additional Product Line Rationalization Cost Efficiencies Optimization of "TCA
Slide 4: 2005 - Opportunities & Objectives
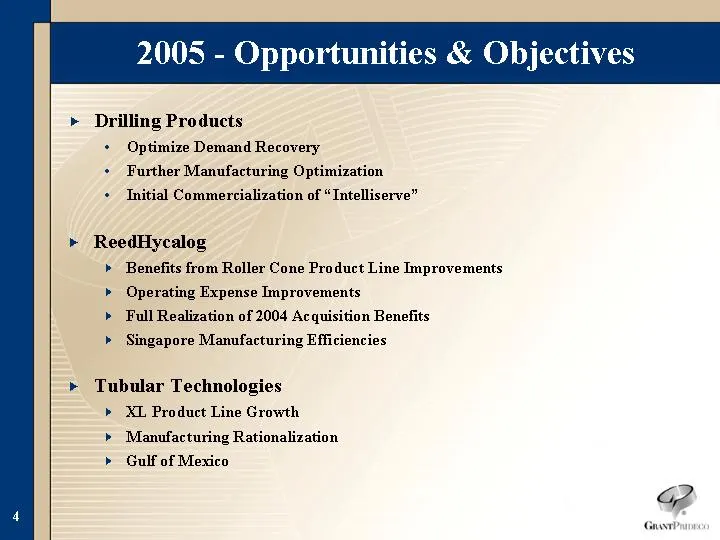
2005 - Opportunities & Objectives Drilling Products Optimize Demand Recovery Further Manufacturing Optimization Initial Commercialization of "Intelliserve" Tubular Technologies XL Product Line Growth Manufacturing Rationalization Gulf of Mexico ReedHycalog Benefits from Roller Cone Product Line Impr
Slide 5: Grant Prideco Consolidated Revenue by Segment
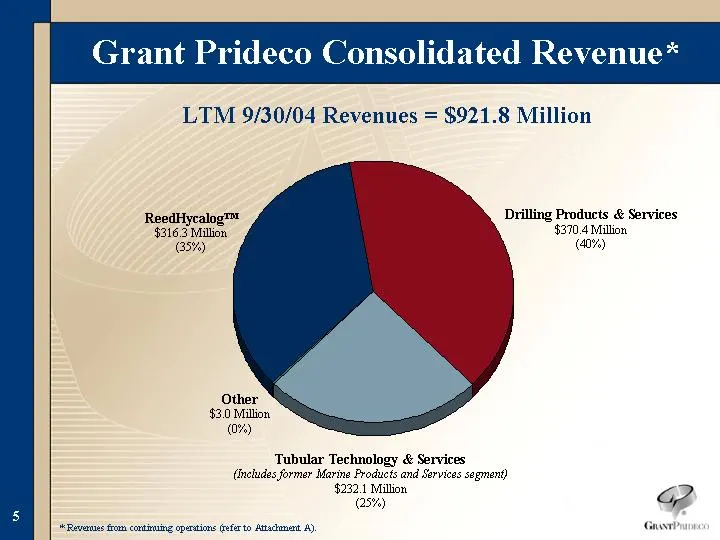
Drilling Products & Services $370.4 Million (40%) Grant Prideco Consolidated Revenue* DP&S TT&S Other RH 370.4 232 3 316.2 Other $3.0 Million (0%) LTM 9/30/04 Revenues = $921.8 Million ReedHycalog(tm) $316.3 Million (35%) Tubular Technology & Services (Includes former Marine Products and Services se
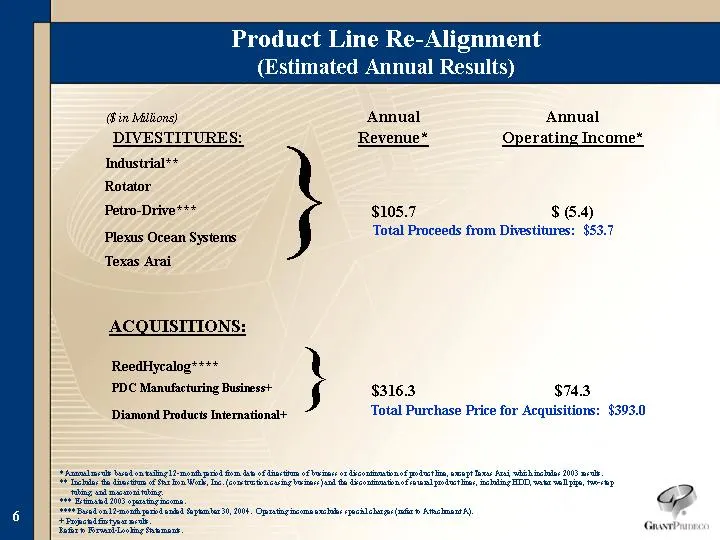
Slide 6: Divestitures and Acquisitions
($ in Millions) DIVESTITURES: Annual Revenue* Annual Operating Income* Industrial** Rotator Petro-Drive*** $105.7 $ (5.4) Plexus Ocean Systems Texas Arai ACQUISITIONS: ReedHycalog**** PDC Manufacturing Business+ $316.3 $74.3 Diamond Products International+ * Annual results based on trailing 12-month

Slide 7: Product Line Review
Product Line Review
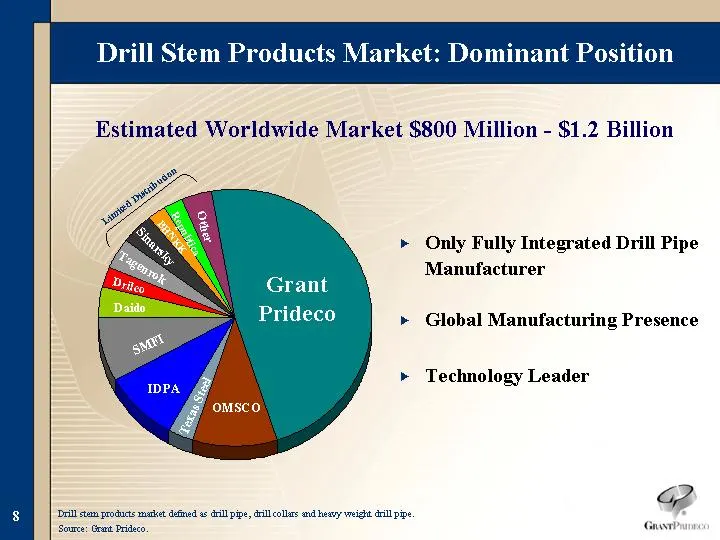
Slide 8: Drill Stem Products Market: Dominant Position
Grant Prideco OMSCO Texas Steel IDPA SMFI Daido Drilco Tagenrok Sinarsky BHNKK Republica OTHER Market Share 299 61 19 57 49 24 16 24 24 14 14 23.1 Drill stem products market defined as drill pipe, drill collars and heavy weight drill pipe. Source: Grant Prideco. Limited Distribution Estimated Worldw
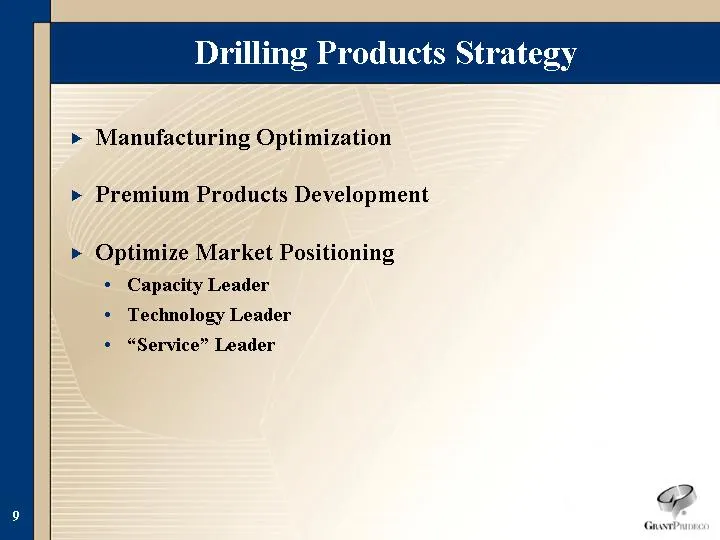
Slide 9: Drilling Products Strategy
Drilling Products Strategy Manufacturing Optimization Premium Products Development Optimize Market Positioning Capacity Leader Technology Leader "Service" Leader
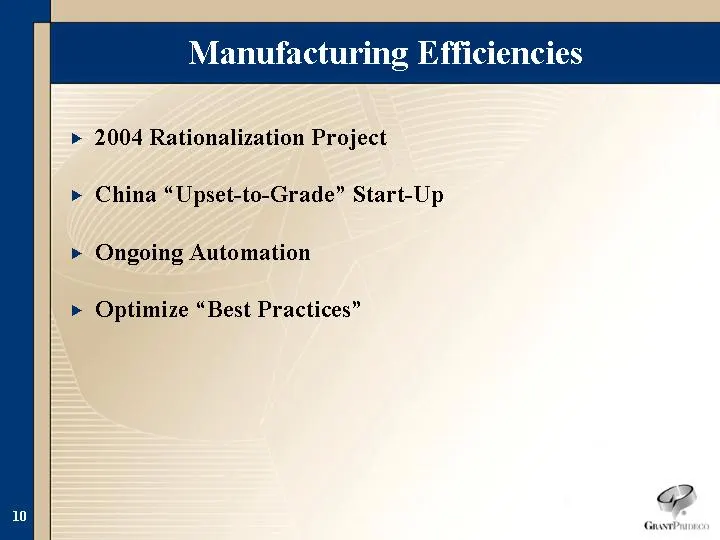
Slide 10: Manufacturing Efficiencies
Manufacturing Efficiencies 2004 Rationalization Project China "Upset-to-Grade" Start-Up Ongoing Automation Optimize "Best Practices"
Slide 11: Continuing China Expansion
Continuing China Expansion Currently Supplying Over 50% of Local Market Drill Pipe Recent Vertical Integration Adds Upset-to-Grade JV in China Heavyweight Drill Pipe Expansion Start-Up: March 2005
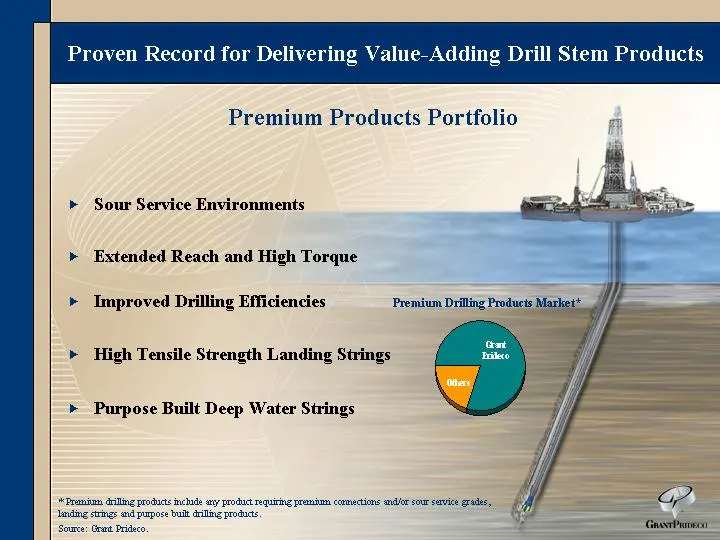
Slide 12: Proven Record for Delivering Value-Adding Drill Stem Products
Proven Record for Delivering Value-Adding Drill Stem Products Premium Products Portfolio Sour Service Environments Extended Reach and High Torque Improved Drilling Efficiencies High Tensile Strength Landing Strings Purpose Built Deep Water Strings Grant Prideco Others Total OCTG Market 0.8 0.2 Premi
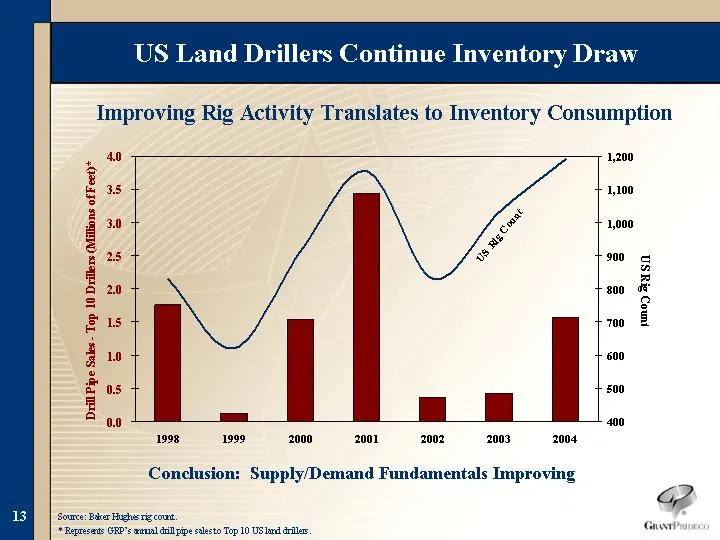
Slide 13: Shrinking Drill Pipe Inventories Should Provide Future Benefit
1998 1999 2000 2001 2002 2003 2004 Difference Between Production and Consumption 1.768 0.119 1.533 3.44 0.361 0.435 1.569 US Rig Count 829 622 916 1155 831 1032 1190 Shrinking Drill Pipe Inventories Should Provide Future Benefit Source: Baker Hughes rig count. * Represents GRP's annual drill pipe sa
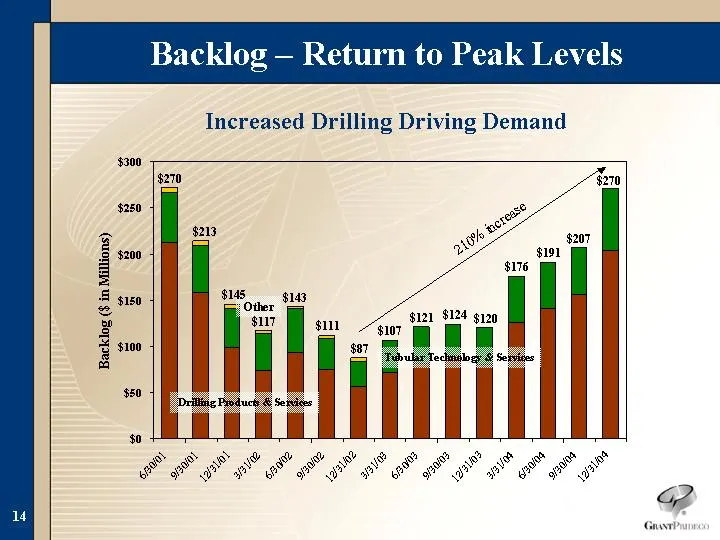
Slide 14: Backlog - Return to Peak Levels
Backlog - Return to Peak Levels 6/30/2001 9/30/2001 12/31/2001 3/31/2002 6/30/2002 9/30/2002 12/31/2002 3/31/2003 6/30/2003 9/30/2003 12/31/2003 3/31/2004 6/30/2004 9/30/2004 12/31/2004 Drilling Products & Services 212.3 158.4 98.5 73.6 92.8 75.1 56.2 72 81 90 80 126 141.5 155.533 203.259 Tubular Te
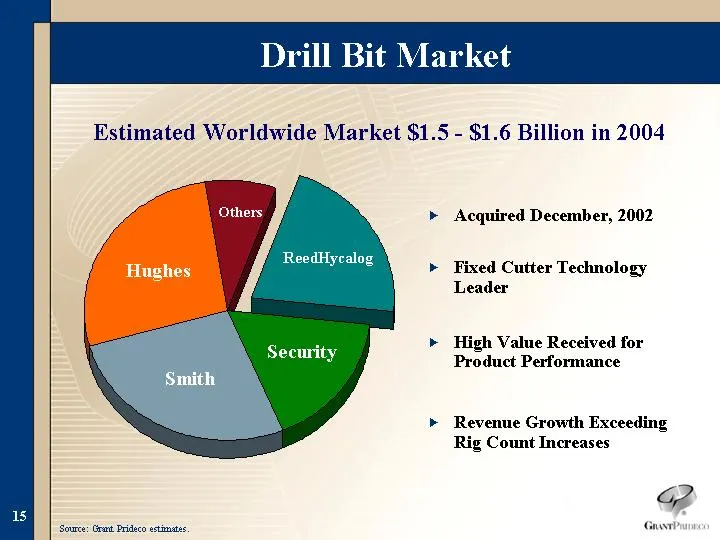
Slide 15: ReedHycalog Drill Bit Market
Reed-Hycalog Security Smith Hughes Others 0.21 0.17 0.27 0.27 0.08 ReedHycalog Security Hughes Smith Others Drill Bit Market Estimated Worldwide Market $1.5 - $1.6 Billion in 2004 Source: Grant Prideco estimates. Acquired December, 2002 Fixed Cutter Technology Leader High Value Received for Product
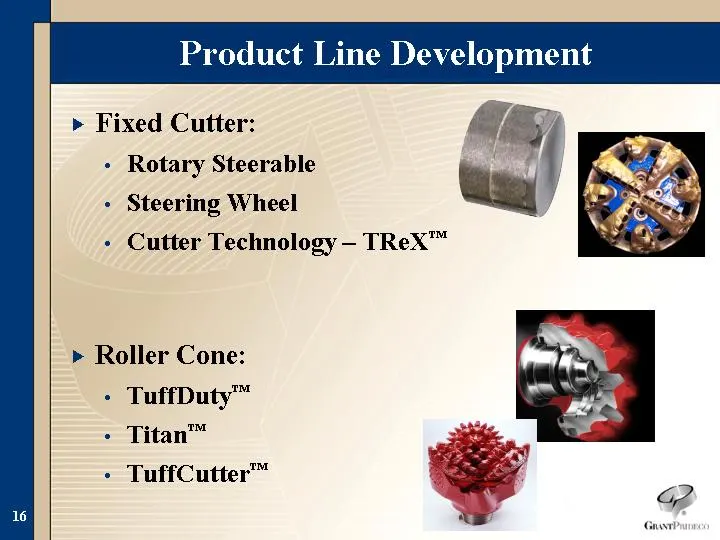
Slide 16: Product Line Development
Product Line Development Fixed Cutter: Rotary Steerable Steering Wheel Cutter Technology - TReX(tm) Roller Cone: TuffDuty(tm) Titan(tm) TuffCutter(tm)
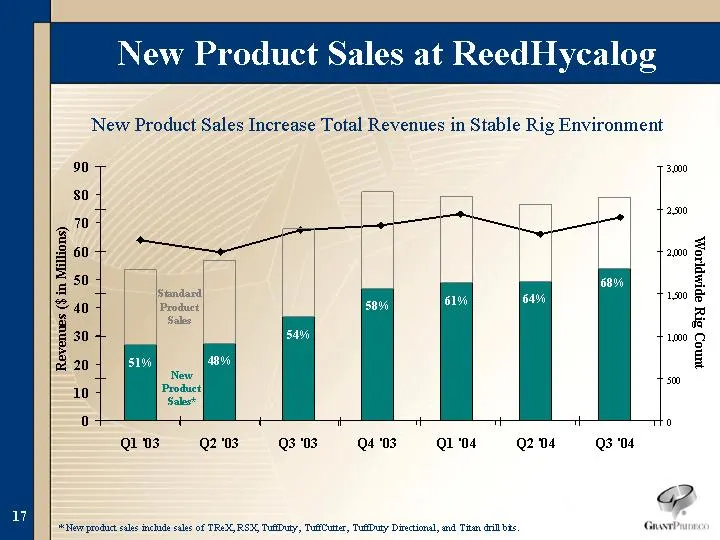
Slide 17: New Product Sales at ReedHycalog
Q1 '03 Q2 '03 Q3 '03 Q4 '03 Q1 '04 Q2 '04 Q3 '04 Worldwide Rig Count 2135 1996 2253 2308 2444 2203 2401 2135 1996 2253 2308 2444 2203 2401 New Product Sales at ReedHycalog New Product Sales Increase Total Revenues in Stable Rig Environment Q1 '03 Q2 '03 Q3 '03 Q4 '03 Q1 '04 Q2 '04 Q3 '04 Total New P
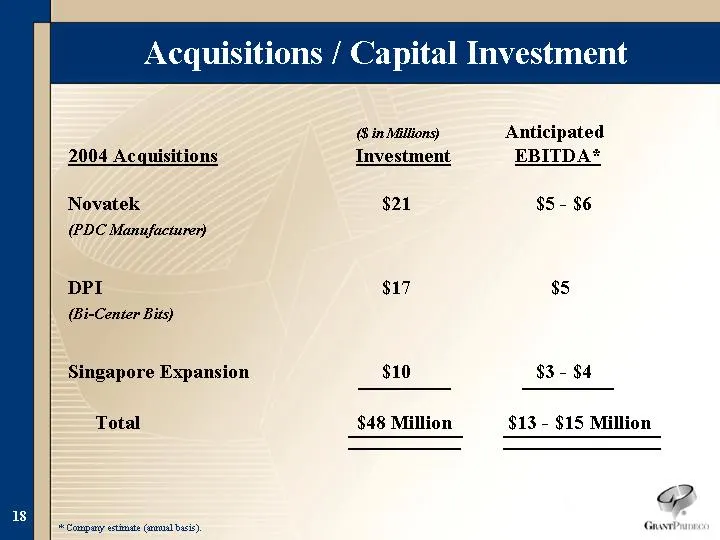
Slide 18: Acquisitions / Capital Investment
Acquisitions / Capital Investment ($ in Millions) Anticipated 2004 Acquisitions Investment EBITDA* Novatek $21 $5 - $6 (PDC Manufacturer) DPI $17 $5 (Bi-Center Bits) Singapore Expansion $10 $3 - $4 Total $48 Million $13 - $15 Million * Company estimate (annual basis).
Slide 19: Continuing Improvement at ReedHycalog
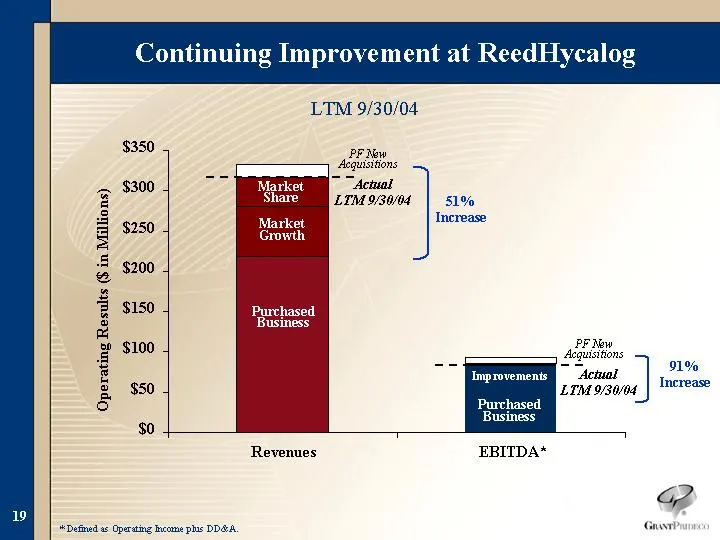
Continuing Improvement at ReedHycalog $0 $50 $100 $150 $200 $250 $300 $350 Operating Results ($ in Millions) * Defined as Operating Income plus DD&A. LTM 9/30/04 Revenues Purchased Business Market Growth Market Share PF New Acquisitions EBITDA* Purchased Business Improvements PF New Acquisitions Act
Slide 20: Tubular Technology & Services
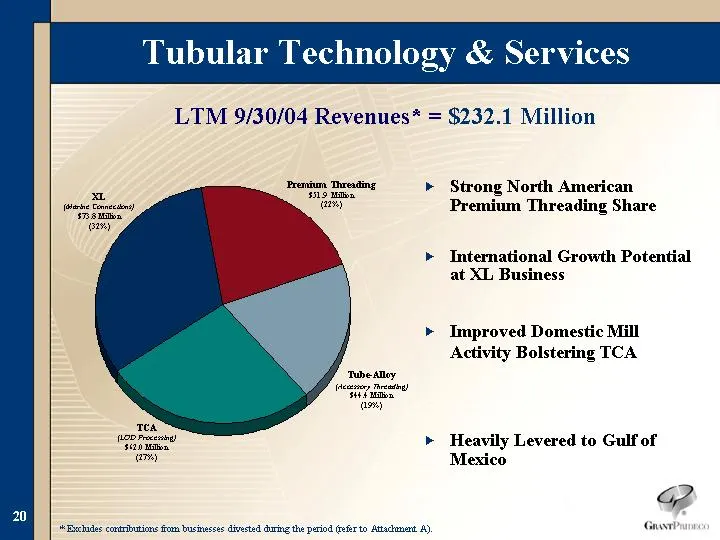
Premium Threading $51.9 Million (22%) Tubular Technology & Services Premium Threading Tube-Alloy TCA XL 51.9 44.4 62 73.8 TCA (LOD Processing) $62.0 Million (27%) LTM 9/30/04 Revenues* = $232.1 Million XL (Marine Connections) $73.8 Million (32%) Tube-Alloy (Accessory Threading) $44.4 Million (19%) *
Slide 21: Tubular Technology & Services: Divested Businesses and Cost Extraction
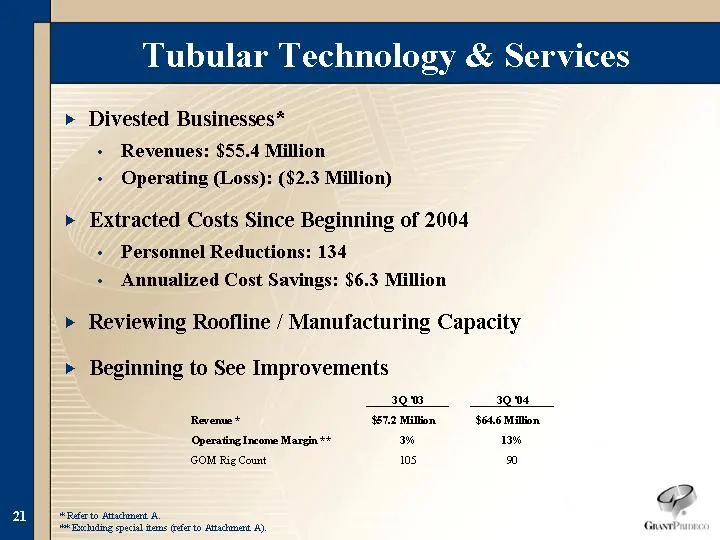
Divested Businesses* Revenues: $55.4 Million Operating (Loss): ($2.3 Million) Extracted Costs Since Beginning of 2004 Personnel Reductions: 134 Annualized Cost Savings: $6.3 Million Reviewing Roofline / Manufacturing Capacity Beginning to See Improvements Tubular Technology & Services * Refer to Att

Slide 22: Business Trends
Business Trends
Slide 23: 2005 Outlook
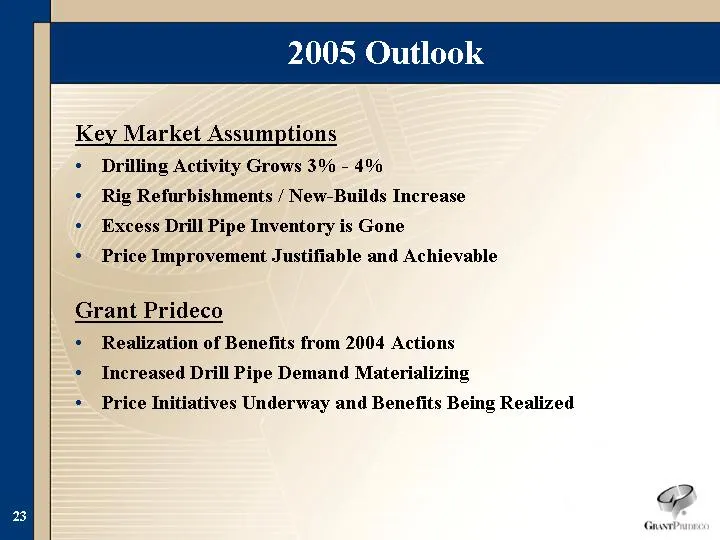
2005 Outlook Key Market Assumptions Drilling Activity Grows 3% - 4% Rig Refurbishments / New-Builds Increase Excess Drill Pipe Inventory is Gone Price Improvement Justifiable and Achievable Grant Prideco Realization of Benefits from 2004 Actions Increased Drill Pipe Demand Materializing Price Initia
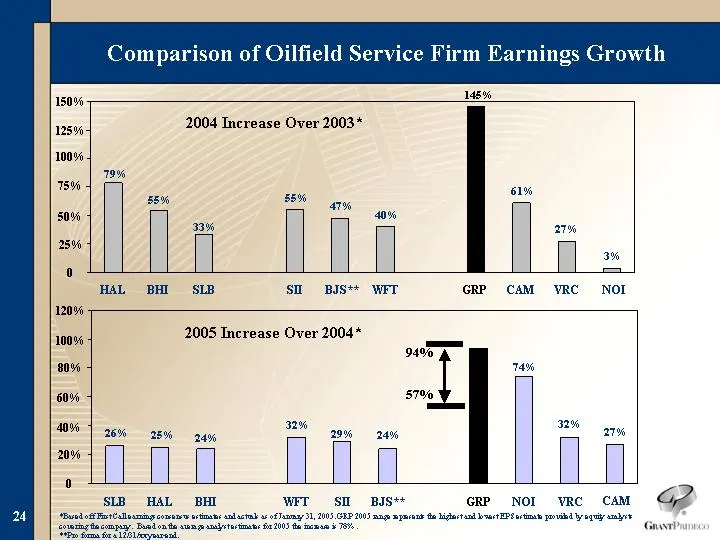
Slide 24: Comparison of Oilfield Service Firm Earnings Growth
Comparison of Oilfield Service Firm Earnings Growth *Based off First Call earnings consensus estimates and actuals as of January 31, 2005. GRP 2005 range represents the highest and lowest EPS estimate provided by equity analysts covering the company. Based on the average analyst estimates for 2005 t
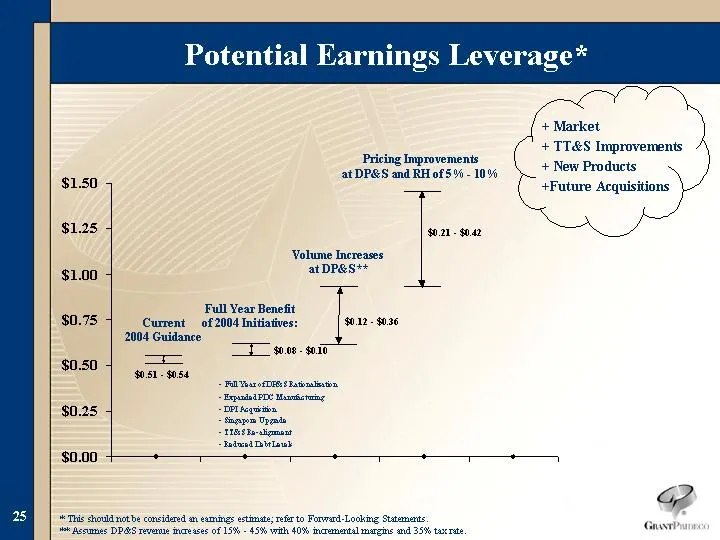
Slide 25: Potential Earnings Leverage
Potential Earnings Leverage* * This should not be considered an earnings estimate; refer to Forward-Looking Statements. ** Assumes DP&S revenue increases of 15% - 45% with 40% incremental margins and 35% tax rate. Pricing Improvements at DP&S and RH of 5% - 10% $0.21 - $0.42 Full Year Benefit of 200
Slide 26: Summary
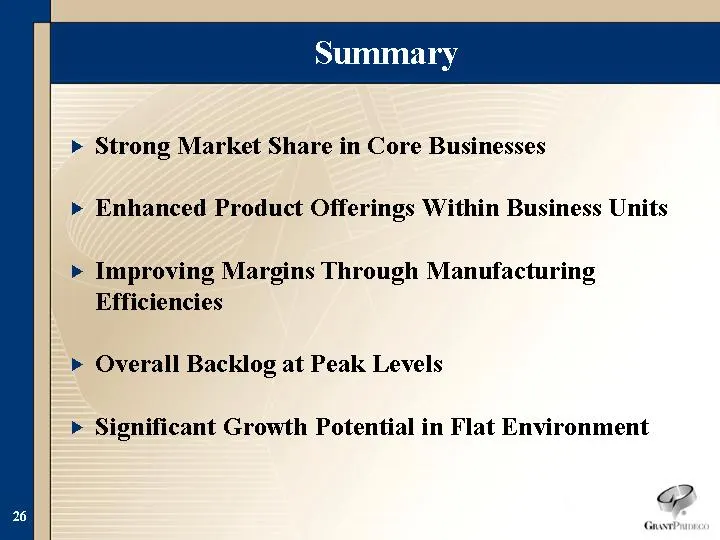
Summary Strong Market Share in Core Businesses Enhanced Product Offerings Within Business Units Improving Margins Through Manufacturing Efficiencies Overall Backlog at Peak Levels Significant Growth Potential in Flat Environment

Slide 27
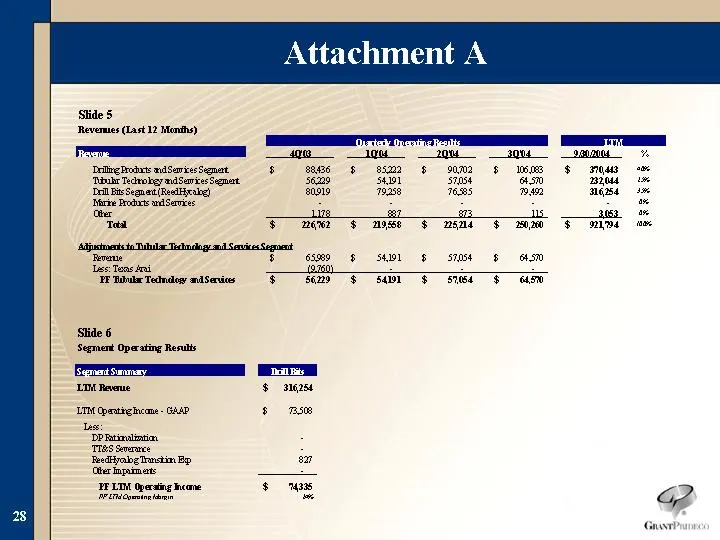
Slide 28: Attachment A
Slide 5 Reverues (Last 12 Months) DelikeBoin maSariesSenat 5 Be ‘Muli TedeobaymdSaressSeenat sen Dell Bis Seen etFizabel ang. ‘ke ota Sere her "Tot omer 569 LIM opersing cone $4338 $ ¥ 8 $ saa 5401 19388 9s6¢ 541 aD ¥ s ¥
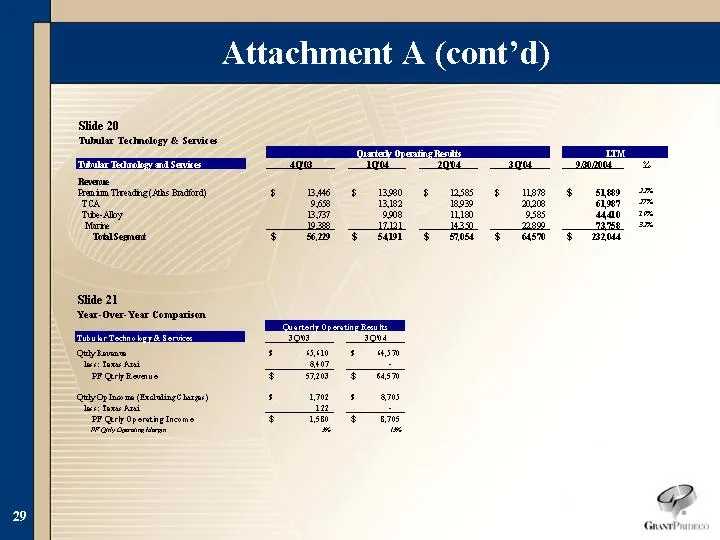
Slide 29: Attachment A (cont'd)
Attachment A (cont’d) Slide 21 ‘Year-Over-Year Comparison 3008 3004 Quytenee rr rrr) Te Te at 3405 PE Chroma ss Fas (GeyOp in me (eaing eps) sams apes BF Chr Operene cone Fase Fae
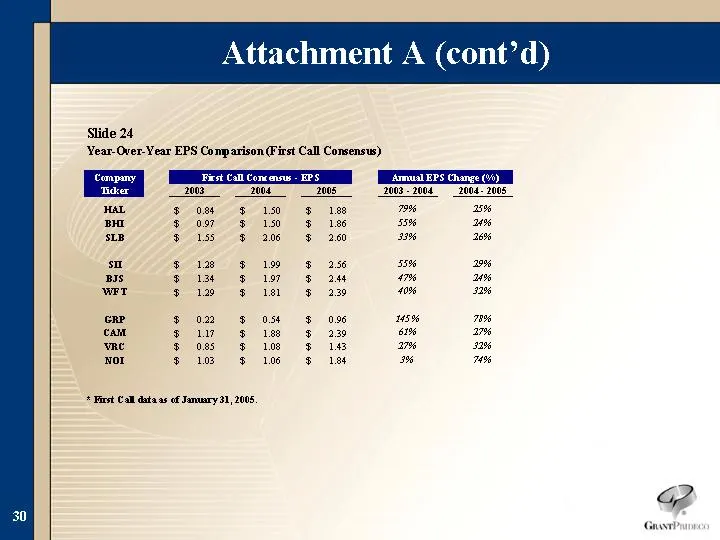
Slide 30: Attachment A (cont'd)
Attachment A (cont’d) Slide 24 ‘Year- Over: Year EPS Comparison (First Call Consensus) “Armual EPS Change 2002 2008 2005 2002 2004 2004-2008 5 os § 10 § 18 7H 259% 309 § 10 § 186 5596 20% 3 iss $206 F200 3396 269% su 5 1 § 19 3 256 5596 209% BIS Dist 3 lr 3 le m% 20% weT 3 19 § isl 3 239 4088 229% c
Source: SEC EDGAR · 8-K filed Feb 1, 2005
More decks from Grant Prideco Inc
 Pritchard Capital Partners 2008 Energize Conference30 slides · Jan 8, 2008
 Credit Suisse Vail Energy Conference 200636 slides · Feb 1, 2006
 Lehman Brothers 19th Annual CEO Energy / Power Conference (September 2005)28 slides · Sep 7, 2005
 Debt Investor Presentation (July 2005)29 slides · Jul 13, 2005
 Credit Suisse First Boston 2005 Offshore Technology Conference Roundtable28 slides · May 3, 2005
 UBS Warburg 2004 Global Oil & Gas Conference19 slides · Jun 4, 2004