Capital Bank Financial — Q4 2015 Earnings Presentation
22 slides from Capital Bank Financial's earnings presentation, Jan 28, 2016
Slide 1: 2015 Fourth Quarter Earnings
2015 Fourth Quarter Earnings January 28, 2016
Slide 2: Safe Harbor Statement
Safe Harbor Statement 2 1/28/2016 Forward-Looking Statements Information in this presentation contains forward-looking statements. Any statements about our expectations, beliefs, plans, predictions, forecasts, objectives, assumptions or future events or performance are not historical facts and may b
Slide 3: Creating Regional Bank Franchise in SE Growth Markets
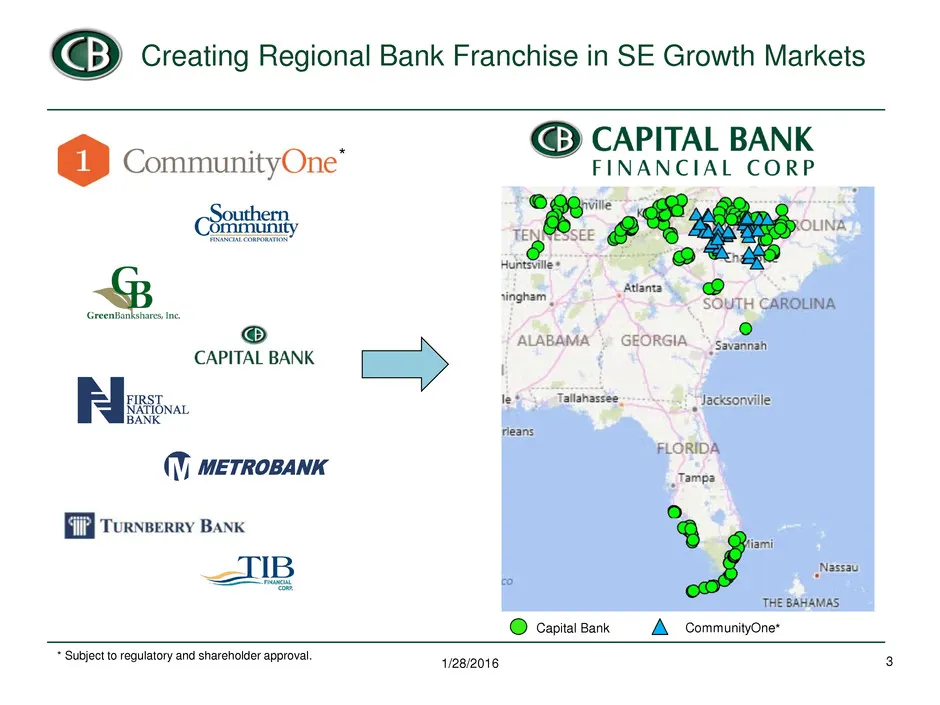
3 Creating Regional Bank Franchise in SE Growth Markets 1/28/2016 CommunityOne* Capital Bank * Subject to regulatory and shareholder approval. *
Slide 4: Commitment to Profitability and Returns
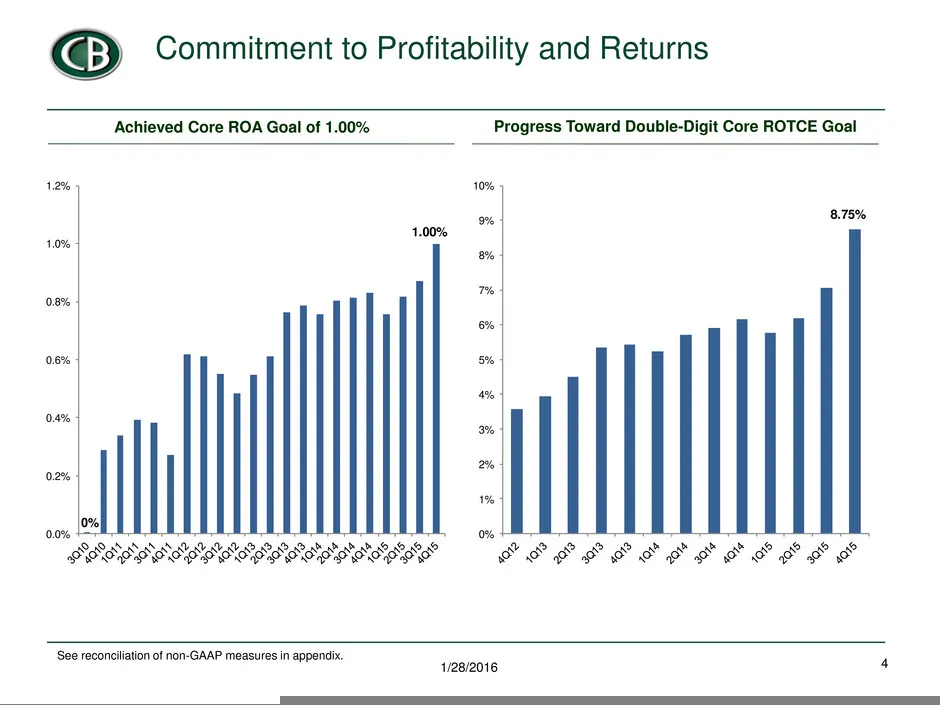
4 Commitment to Profitability and Returns 1/28/2016 See reconciliation of non-GAAP measures in appendix. Progress Toward Double-Digit Core ROTCE Goal Achieved Core ROA Goal of 1.00% 0% 1.00% 0.0% 0.2% 0.4% 0.6% 0.8% 1.0% 1.2% 8.75% 0% 1% 2% 3% 4% 5% 6% 7% 8% 9% 10%
Slide 5: Fourth Quarter Highlights
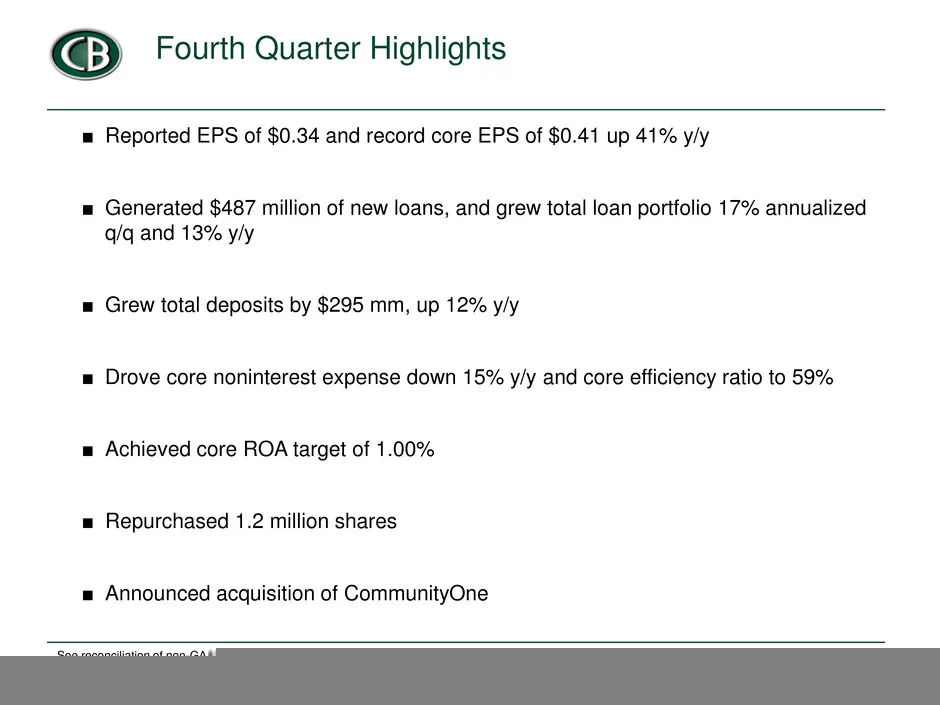
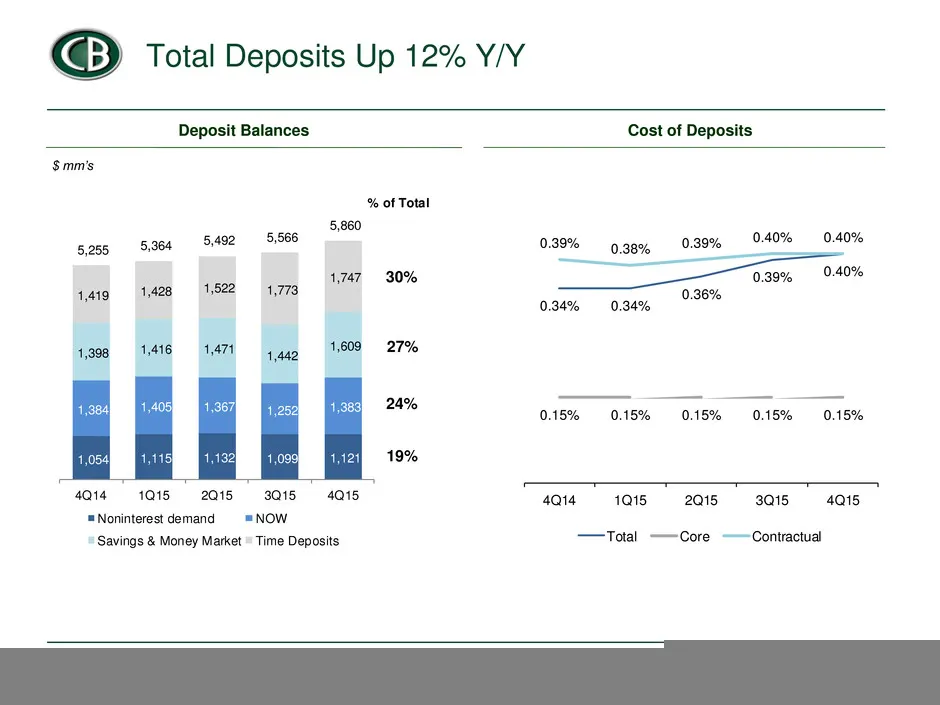
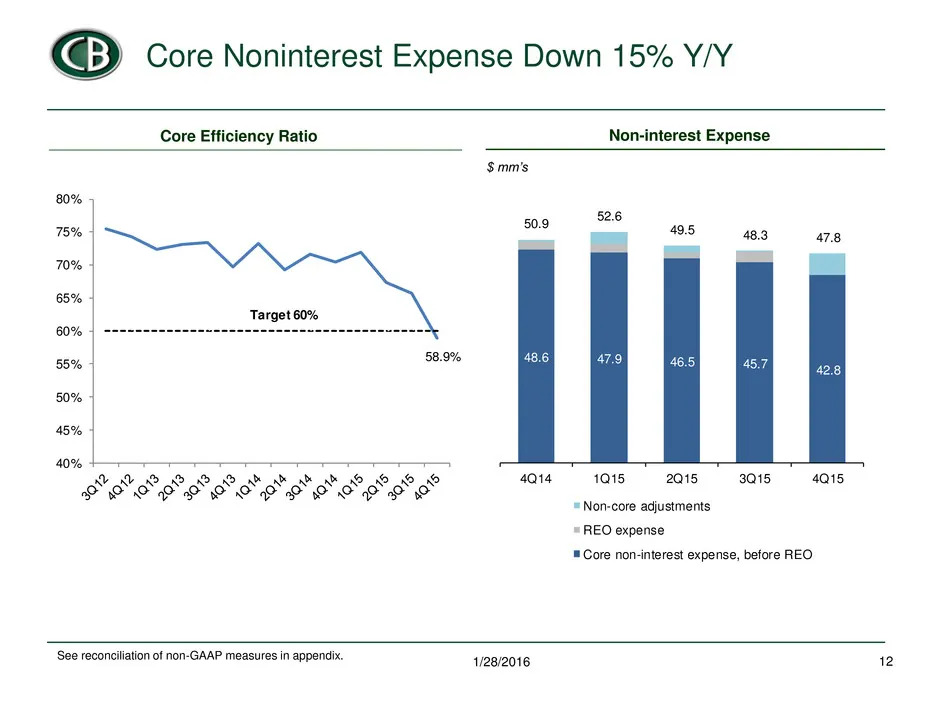
5 Fourth Quarter Highlights ■ Reported EPS of $0.34 and record core EPS of $0.41 up 41% y/y ■ Generated $487 million of new loans, and grew total loan portfolio 17% annualized q/q and 13% y/y ■ Grew total deposits by $295 mm, up 12% y/y ■ Drove core noninterest expense down 15% y/y and core efficien
Slide 6: Fourth Quarter Financial Summary
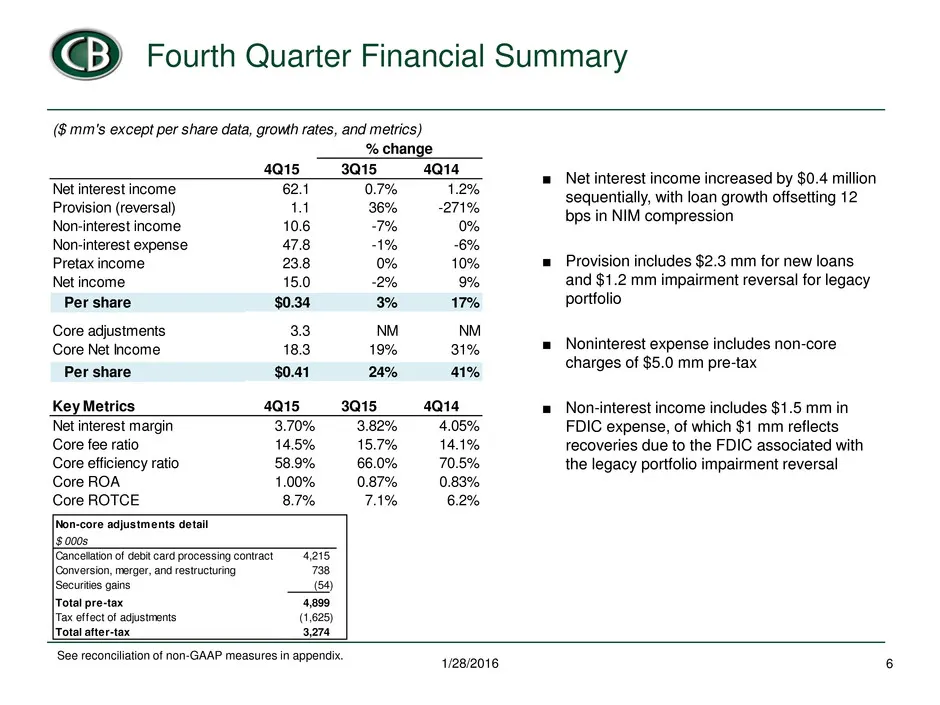
Fourth Quarter Financial Summary 6 1/28/2016 See reconciliation of non-GAAP measures in appendix. ■ Net interest income increased by $0.4 million sequentially, with loan growth offsetting 12 bps in NIM compression ■ Provision includes $2.3 mm for new loans and $1.2 mm impairment reversal for legacy
Slide 7: New ROA Target for 2017
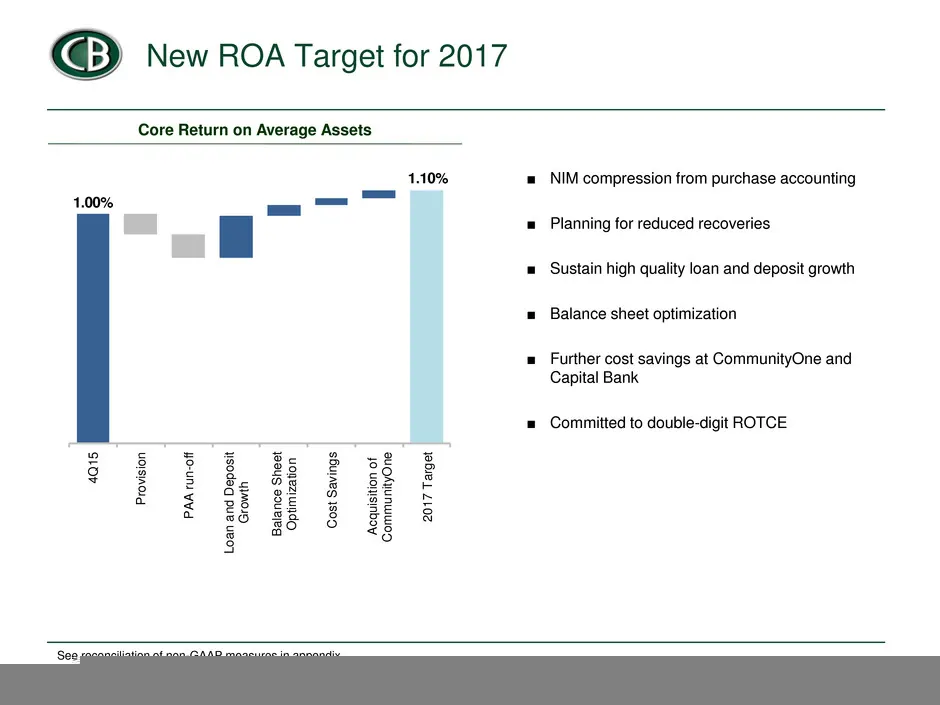
New ROA Target for 2017 7 1/28/2016 Core Return on Average Assets See reconciliation of non-GAAP measures in appendix. 1.00% 1.10% 4 Q 1 5 P ro vi s io n P A A r u n -o ff L o a n a n d D e p o s it G ro w th B a la n c e S h e e t O p tim iz a tio n C o s t S a v in g s A c q u is it io n o f C o m
Slide 8: Generated $487 mm of New Loans
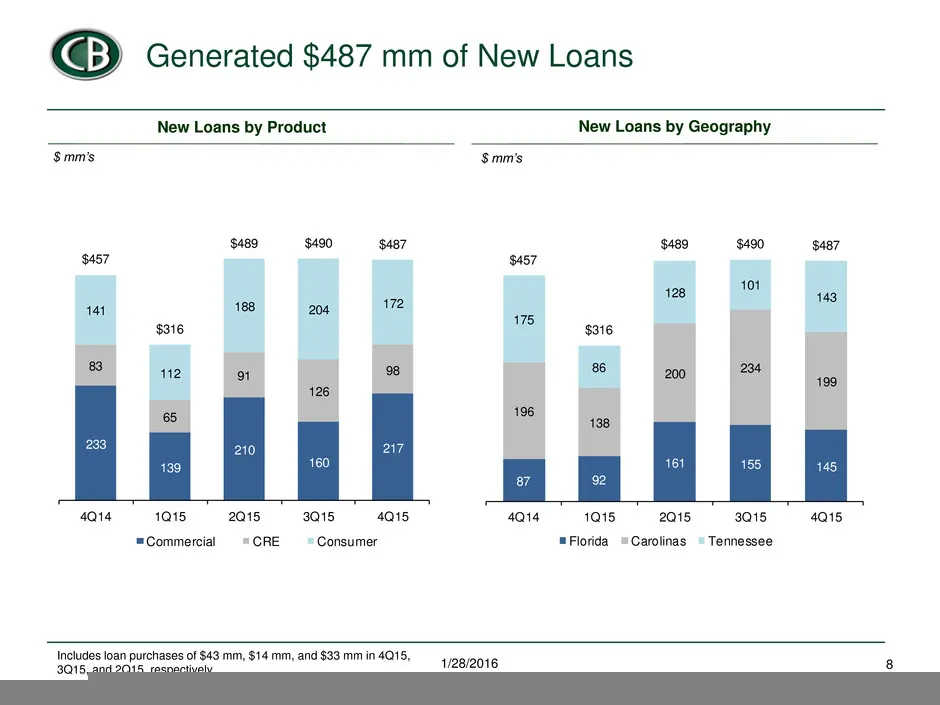
Generated $487 mm of New Loans 8 1/28/2016 New Loans by Geography New Loans by Product $ mm’s $ mm’s 87 92 161 155 145 196 138 200 234 199 175 86 128 101 143 $457 $316 $489 $490 $487 4Q14 1Q15 2Q15 3Q15 4Q15 Florida Carolinas Tennessee 233 139 210 160 217 83 65 91 126 98 141 112 188 204 172 $457 $31
Slide 9: Total Deposits Up 12% Y/Y
Total Deposits Up 12% Y/Y 9 1/28/2016 Cost of Deposits Deposit Balances $ mm’s 0.34% 0.34% 0.36% 0.39% 0.40% 0.15% 0.15% 0.15% 0.15% 0.15% 0.39% 0.38% 0.39% 0.40% 0.40% 4Q14 1Q15 2Q15 3Q15 4Q15 Total Core Contractual 1,054 1,115 1,132 1,099 1,121 1,384 1,405 1,367 1,252 1,383 1,398 1,416 1,471 1,442
Slide 10: NIM Compression In Line with Forecast
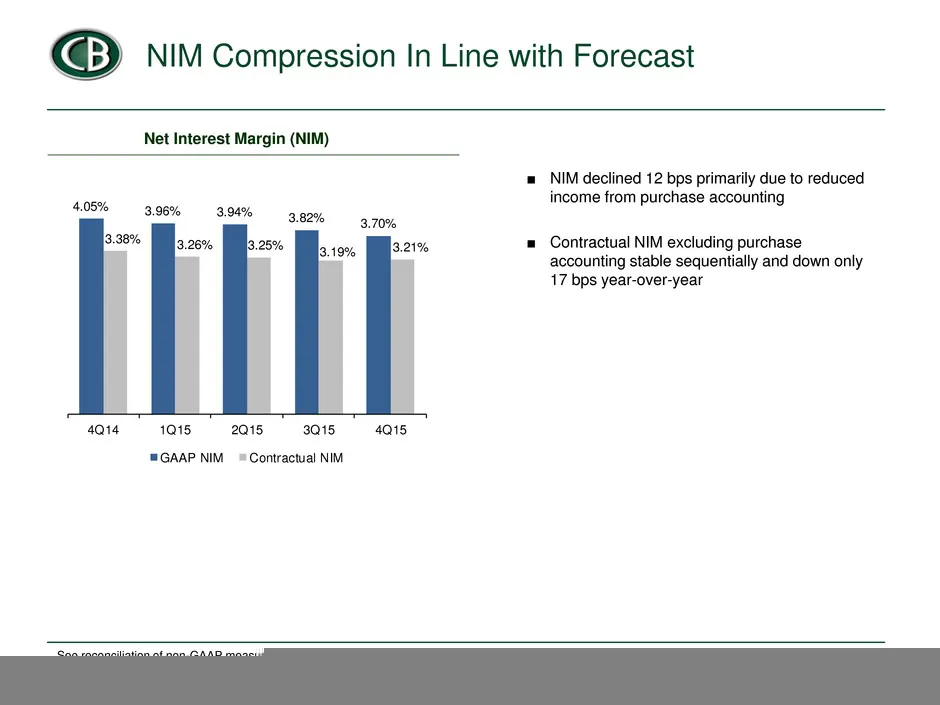
NIM Compression In Line with Forecast 10 1/28/2016 Net Interest Margin (NIM) See reconciliation of non-GAAP measures in appendix. 4.05% 3.96% 3.94% 3.82% 3.70% 3.38% 3.26% 3.25% 3.19% 3.21% 4Q14 1Q15 2Q15 3Q15 4Q15 GAAP NIM Contractual NIM ■ NIM declined 12 bps primarily due to reduced income from p
Slide 11: Total Non-interest Income Flat y/y
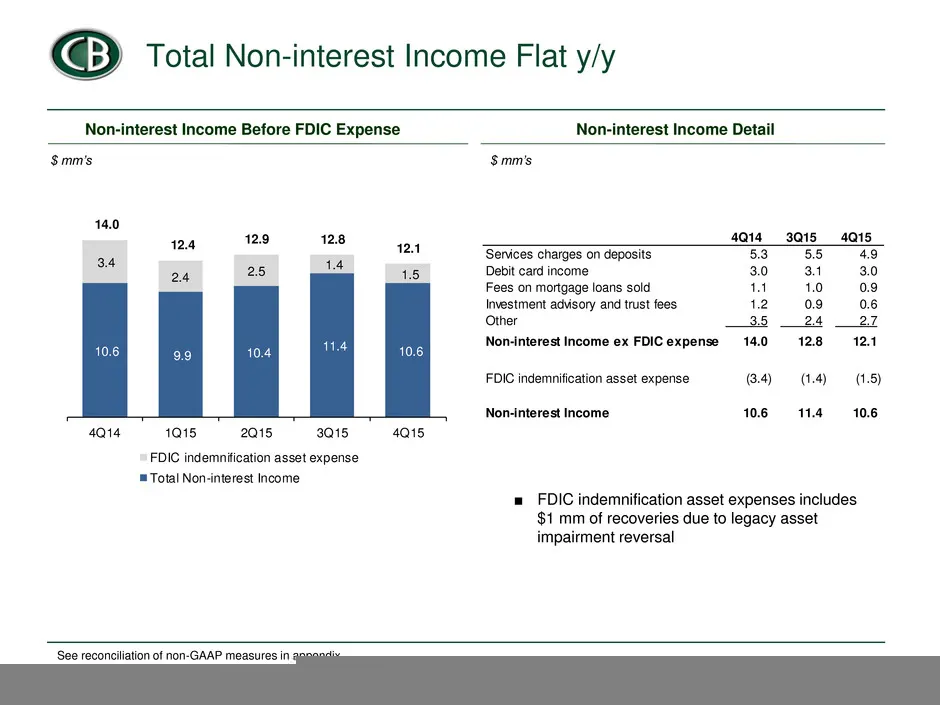
Total Non-interest Income Flat y/y 11 1/28/2016 Non-interest Income Before FDIC Expense $ mm’s See reconciliation of non-GAAP measures in appendix. Non-interest Income Detail $ mm’s 4Q14 3Q15 4Q15 Services charges on deposits 5.3 5.5 4.9 Debit card income 3.0 3.1 3.0 Fees on mortgage loans sold 1.1
Slide 12: Core Noninterest Expense Down 15% Y/Y
Core Noninterest Expense Down 15% Y/Y 12 1/28/2016 Non-interest Expense $ mm’s See reconciliation of non-GAAP measures in appendix. Core Efficiency Ratio 58.9% 40% 45% 50% 55% 60% 65% 70% 75% 80% Target 60% 48.6 47.9 46.5 45.7 42.8 50.9 52.6 49.5 48.3 47.8 4Q14 1Q15 2Q15 3Q15 4Q15 Non-core adjustmen
Slide 13: Liquidity and Capital Ratios Remain Strong
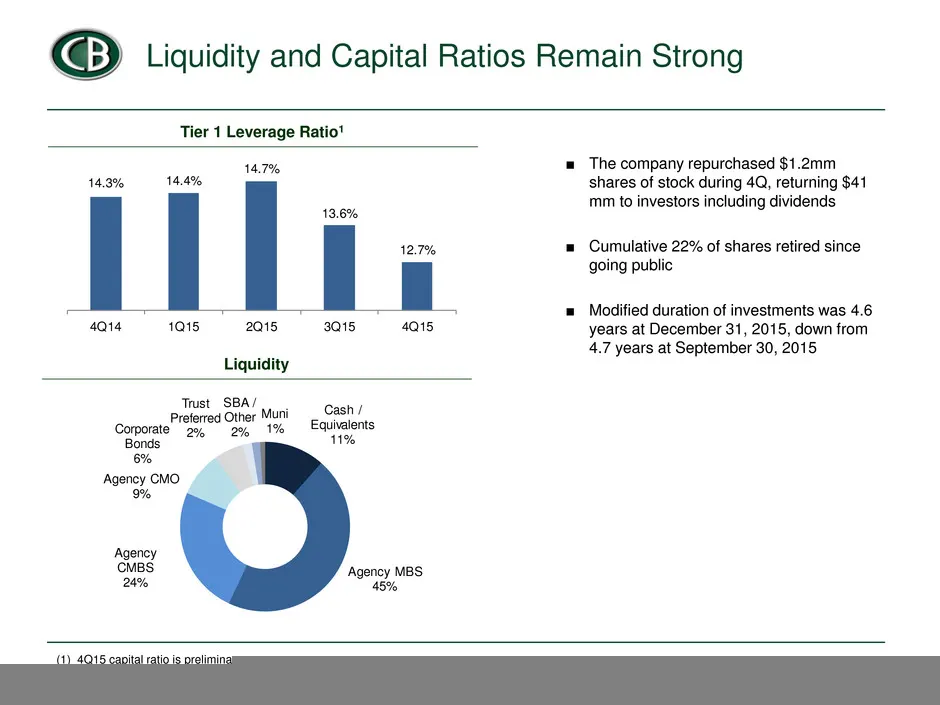
Liquidity and Capital Ratios Remain Strong 13 1/28/2016 ■ The company repurchased $1.2mm shares of stock during 4Q, returning $41 mm to investors including dividends ■ Cumulative 22% of shares retired since going public ■ Modified duration of investments was 4.6 years at December 31, 2015, down from
Slide 14: New Loan Portfolio Performing Strongly
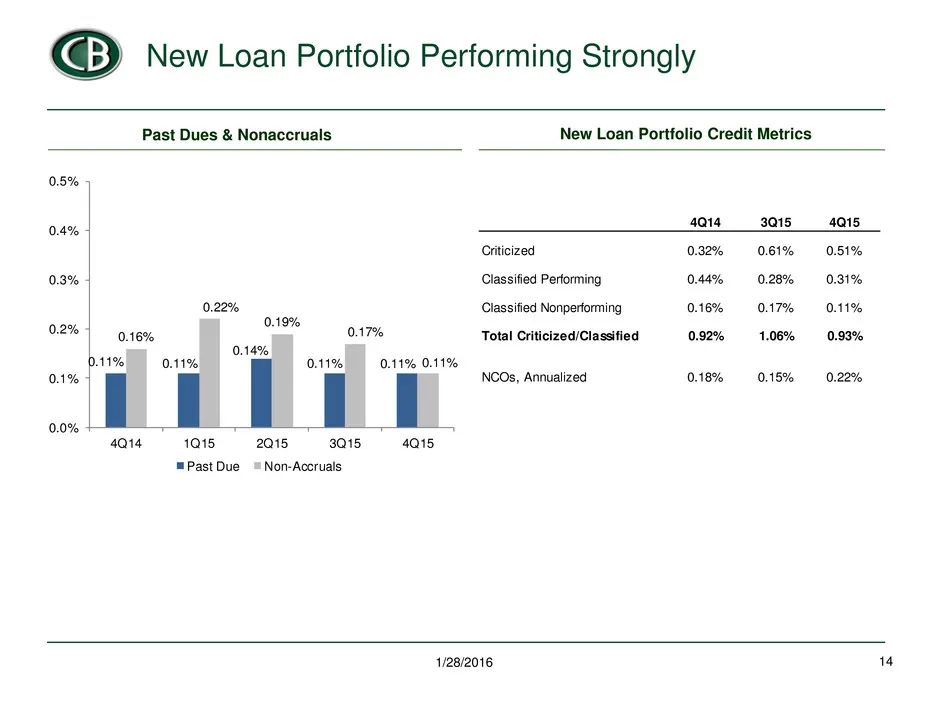
New Loan Portfolio Performing Strongly 14 1/28/2016 New Loan Portfolio Credit Metrics Past Dues & Nonaccruals 0.11% 0.11% 0.14% 0.11% 0.11% 0.16% 0.22% 0.19% 0.17% 0.11% 0.0% 0.1% 0.2% 0.3% 0.4% 0.5% 4Q14 1Q15 2Q15 3Q15 4Q15 Past Due Non-Accruals 4Q14 3Q15 4Q15 Criticized 0.32% 0.61% 0.51% Classifie
Slide 15: Special Assets Down 72% Since 2012
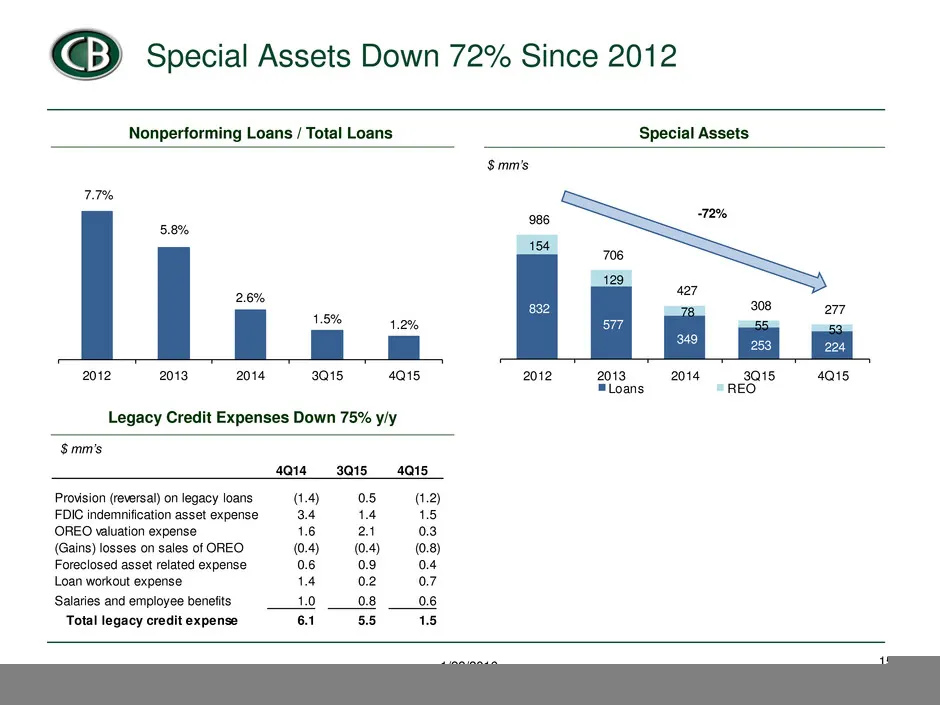
Special Assets Down 72% Since 2012 15 1/28/2016 Special Assets Nonperforming Loans / Total Loans $ mm’s Legacy Credit Expenses Down 75% y/y $ mm’s 832 577 349 253 224 154 129 78 55 53 986 706 427 308 277 2012 2013 2014 3Q15 4Q15 Loans REO -72% 7.7% 5.8% 2.6% 1.5% 1.2% 2012 2013 2014 3Q15 4Q154Q14 3Q
Slide 16: 2016 Outlook
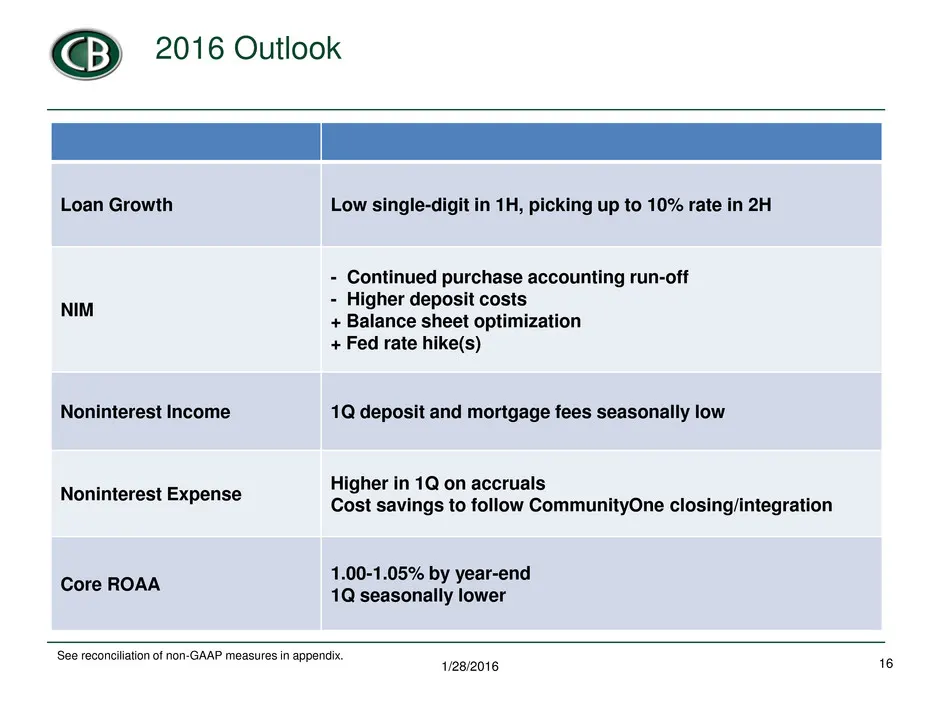
16 2016 Outlook 1/28/2016 Loan Growth Low single-digit in 1H, picking up to 10% rate in 2H NIM - Continued purchase accounting run-off - Higher deposit costs + Balance sheet optimization + Fed rate hike(s) Noninterest Income 1Q deposit and mortgage fees seasonally low Noninterest Expense Higher in 1
Slide 17: Capital Bank Investment Highlights
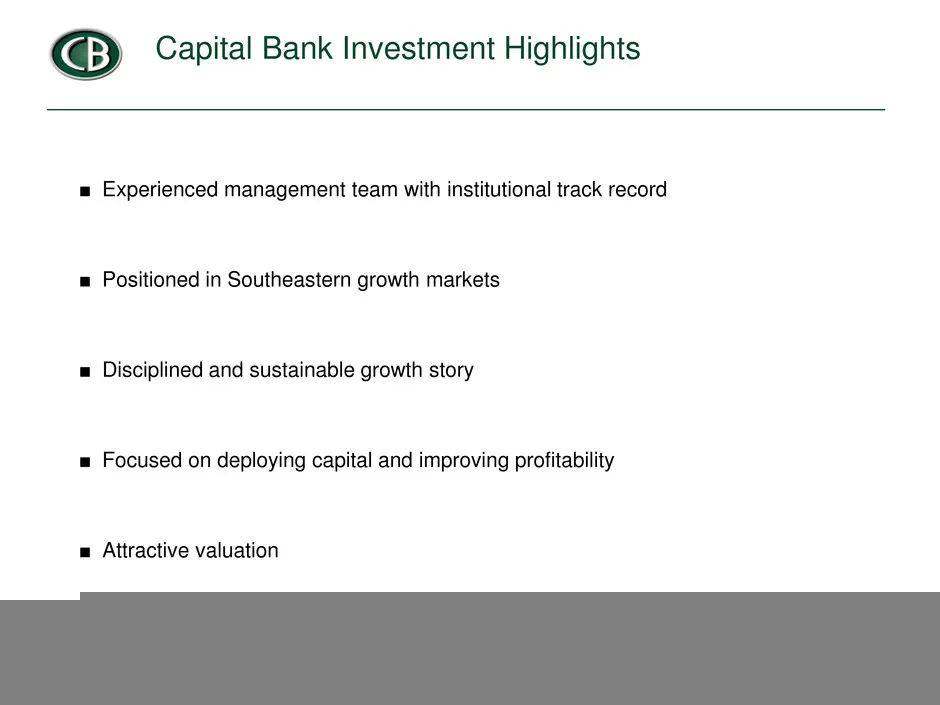
17 Capital Bank Investment Highlights ■ Experienced management team with institutional track record ■ Positioned in Southeastern growth markets ■ Disciplined and sustainable growth story ■ Focused on deploying capital and improving profitability ■ Attractive valuation 1/28/2016

Slide 18: Appendix
Appendix 18 1/28/2016
Slide 19: Reconciliation of Core Noninterest Income / Expense
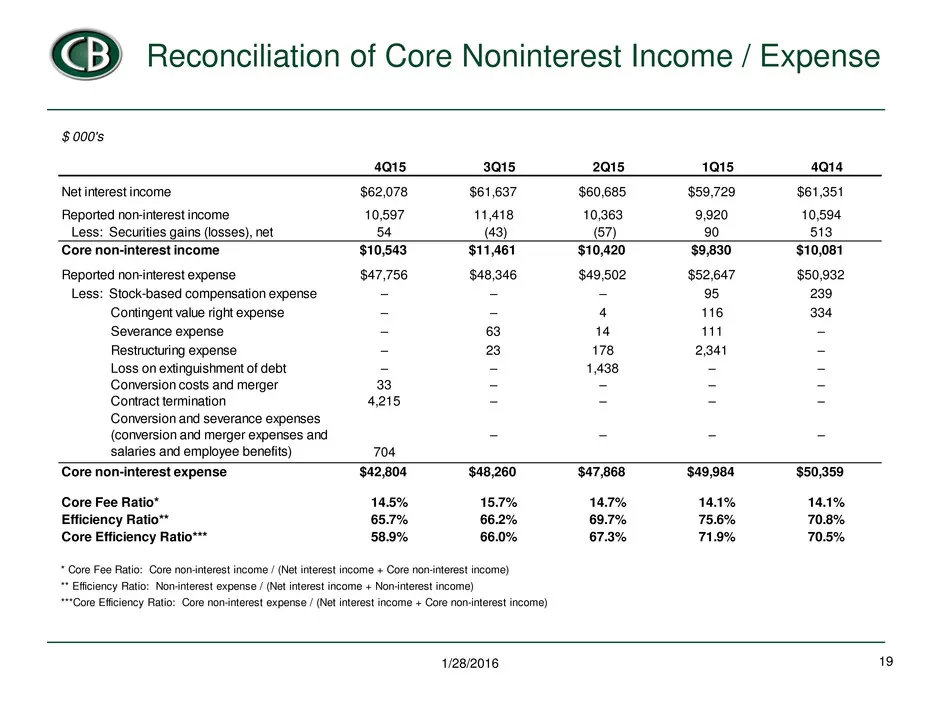
Reconciliation of Core Noninterest Income / Expense 19 1/28/2016 $ 000's 4Q15 3Q15 2Q15 1Q15 4Q14 Net interest income $62,078 $61,637 $60,685 $59,729 $61,351 Reported non-interest income 10,597 11,418 10,363 9,920 10,594 Less: Securities gains (losses), net 54 (43) (57) 90 513 Core non-interest inco
Slide 20: Reconciliation of Core Net Income
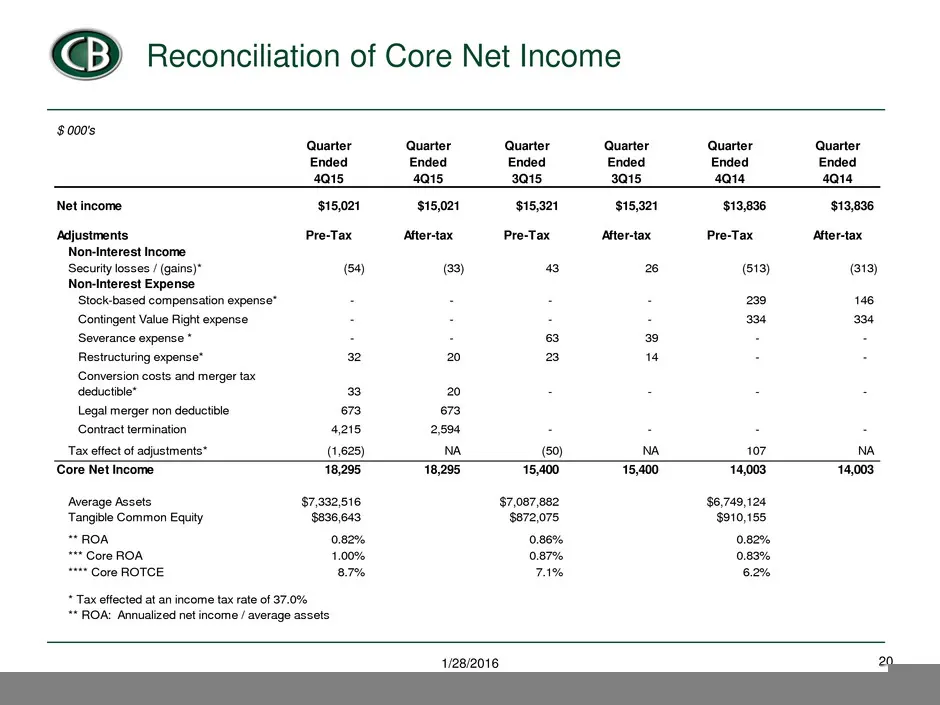
Reconciliation of Core Net Income 20 1/28/2016 $ 000's Quarter Quarter Quarter Quarter Quarter Quarter Ended Ended Ended Ended Ended Ended 4Q15 4Q15 3Q15 3Q15 4Q14 4Q14 $15,021 $15,021 $15,321 $15,321 $13,836 $13,836 Pre-Tax After-tax Pre-Tax After-tax Pre-Tax After-tax Non-Interest Income Security
Slide 21: Tangible Book Value
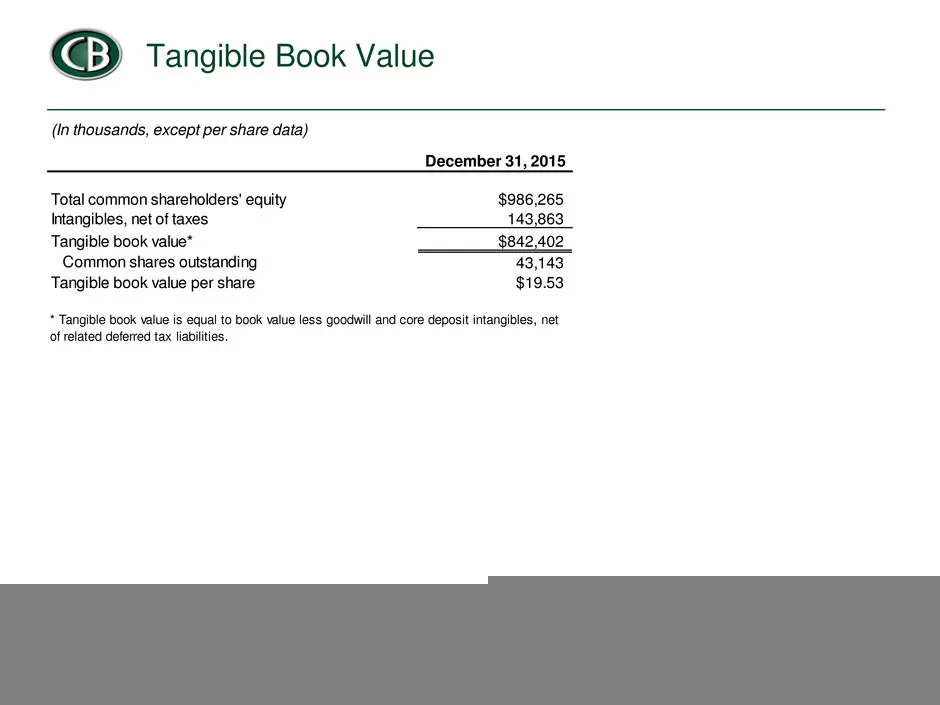
Tangible Book Value 21 1/28/2016 (In thousands, except per share data) December 31, 2015 Total common shareholders' equity $986,265 Intangibles, net of taxes 143,863 Tangible book value* $842,402 Common shares outstanding 43,143 Tangible book value per share $19.53 * Tangible book value is equal to
Slide 22: Contractual Net Interest Margin
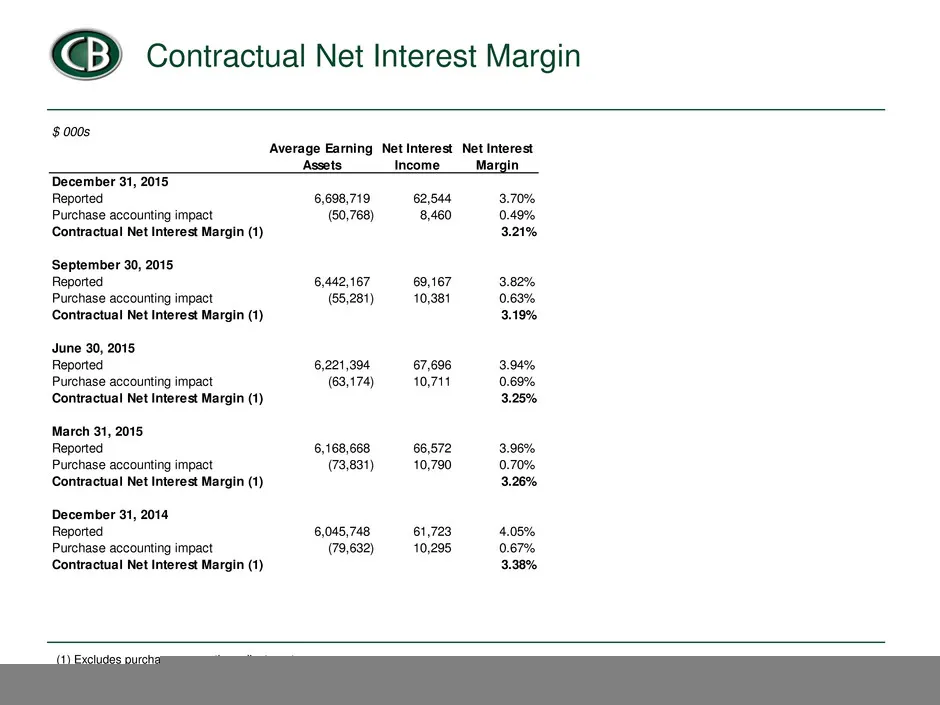
Contractual Net Interest Margin 22 1/28/2016 (1) Excludes purchase accounting adjustments $ 000s Average Earning Assets Net Interest Income Net Interest Margin December 31, 2015 Reported 6,698,719 62,544 3.70% Purchase accounting impact (50,768) 8,460 0.49% Contractual Net Interest Margin (1) 3.21%
Source: SEC EDGAR · 8-K filed Jan 28, 2016
More decks from Capital Bank Financial Corp
 Q2 2017 Earnings Presentation22 slides · Jul 14, 2017
 Morgan Stanley Financial Services Conference 201715 slides · Jun 13, 2017
 Merger or Acquisition (June 2017)27 slides · Jun 6, 2017
 Merger or Acquisition (May 2017)17 slides · May 4, 2017
 Q1 2017 Earnings Presentation21 slides · Apr 21, 2017
 Q4 2016 Earnings Presentation25 slides · Jan 26, 2017