Peapack-Gladstone Financial Corporation · NASDAQ:PGC
Peapack-Gladstone Financial — Investor Presentation (October 2017)
31 slides from Peapack-Gladstone Financial's investor presentation, Oct 27, 2017
Slide 1: Expanding Our Reach: Strategic Update
Investor Presentation “Expanding Our Reach” Strategic Update 09/30/2017 P EAPACK - G LADSTONE B ANK
Slide 2: Forward-looking statements
The foregoing contains forward - looking statements within the meaning of the Private Securities Litigation Reform Act of 1995. Such statements are not historical facts but rather may include expressions about Management’s view of future financial condition and results of operations, Management’s co
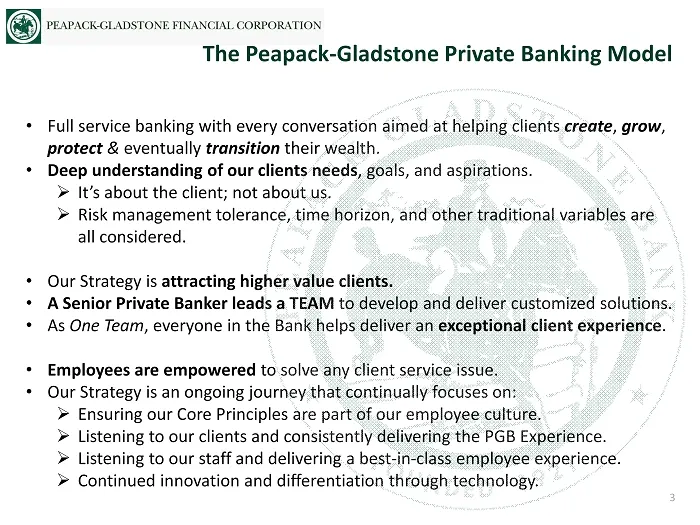
Slide 3: The Peapack-Gladstone Private Banking Model
• Full service banking with every conversation aimed at helping clients create , grow , protect & eventually transition their wealth. • Deep understanding of our clients needs , goals, and aspirations. » It’s about the client; not about us. » Risk management tolerance, time horizon, and other tradit
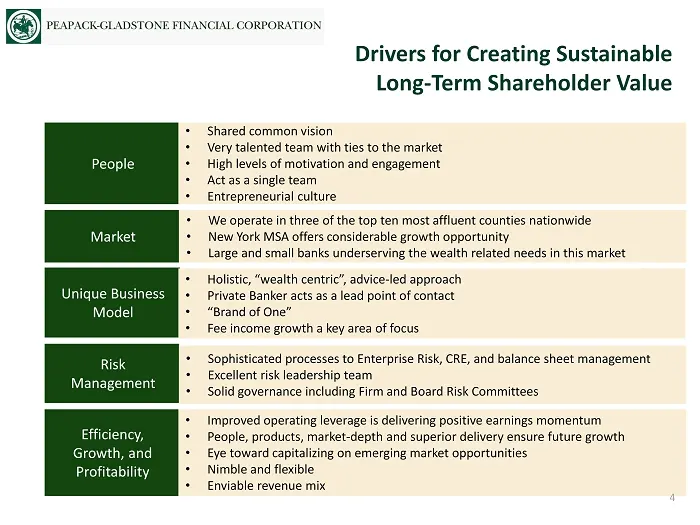
Slide 4: People, Market, Unique Business Model
People Market Efficiency, Growth, and Profitability • Shared common vision • Very talented team with ties to the market • High levels of motivation and engagement • Act as a single team • Entrepreneurial culture • We operate in three of the top ten most affluent counties nationwide • New York MSA of
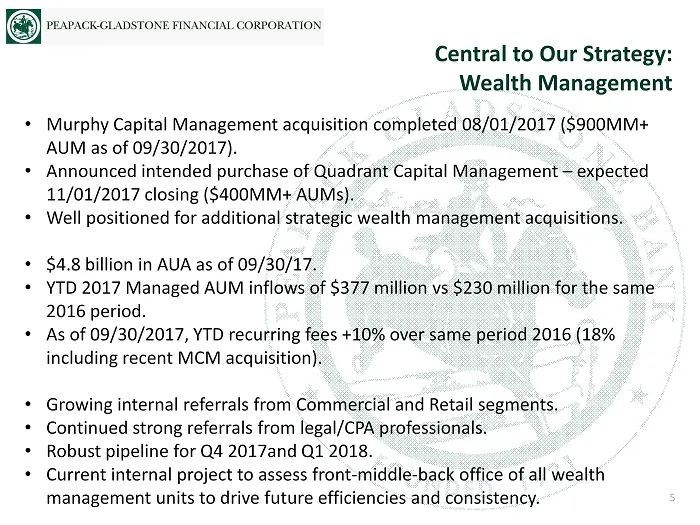
Slide 5: Central to Our Strategy: Wealth Management
• Murphy Capital Management acquisition completed 08/01/2017 ($900MM+ AUM as of 09/30/2017). • Announced intended purchase of Quadrant Capital Management – expected 11/01/2017 closing ($400MM+ AUMs). • Well positioned for additional strategic wealth management acquisitions. • $4.8 billion in AUA as
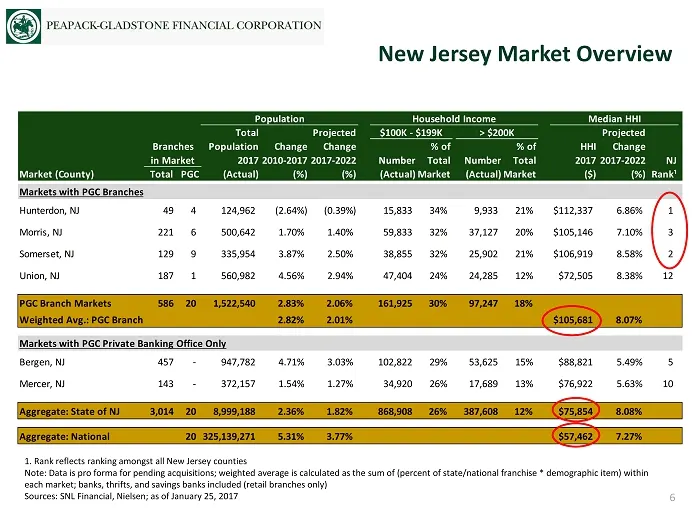
Slide 6: Market demographics and branch markets
Population Household Income Median HHI Total Projected $100K - $199K > $200K Projected Branches Population Change Change % of % of HHI Change in Market 20172010-20172017-2022 Number Total Number Total 20172017-2022 NJ Market (County) Total PGC (Actual) (%) (%) (Actual)Market (Actual)Market ($) (%)Ra
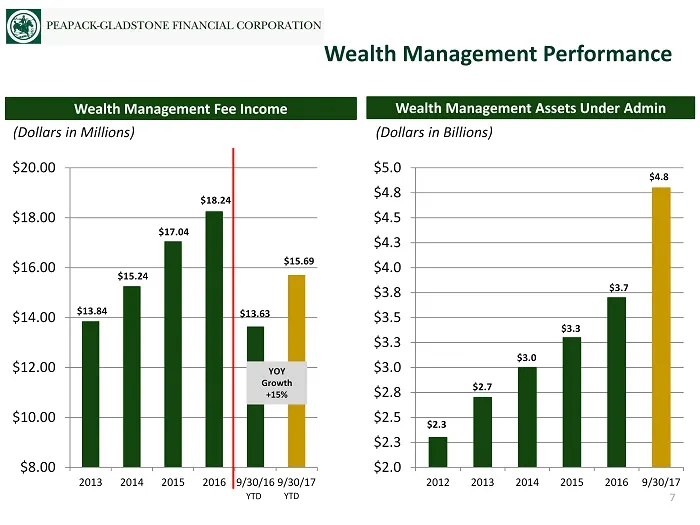
Slide 7: Wealth Management Performance
Wealth Management Assets Under Admin Wealth Management Fee Income Wealth Management Performance $8.00 $10.00 $12.00 $14.00 $16.00 $18.00 $20.00 2013 2014 2015 2016 9/30/16 9/30/17 (Dollars in Millions) $2.0 $2.3 $2.5 $2.8 $3.0 $3.3 $3.5 $3.8 $4.0 $4.3 $4.5 $4.8 $5.0 2012 2013 2014 2015 2016 9/30/17
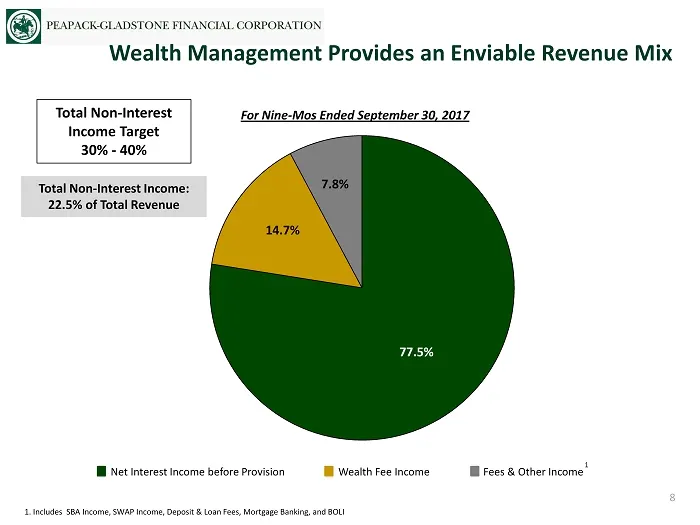
Slide 8: Wealth Management Provides an Enviable Revenue Mix
1. Includes SBA Income, SWAP Income, Deposit & Loan Fees, Mortgage Banking, and BOLI Wealth Management Provides an Enviable Revenue Mix 77.5% 14.7% 7.8% For Nine - Mos Ended September 30, 2017 Total Non - Interest Income: 22.5% of Total Revenue Net Interest Income before Provision Wealth Fee Income
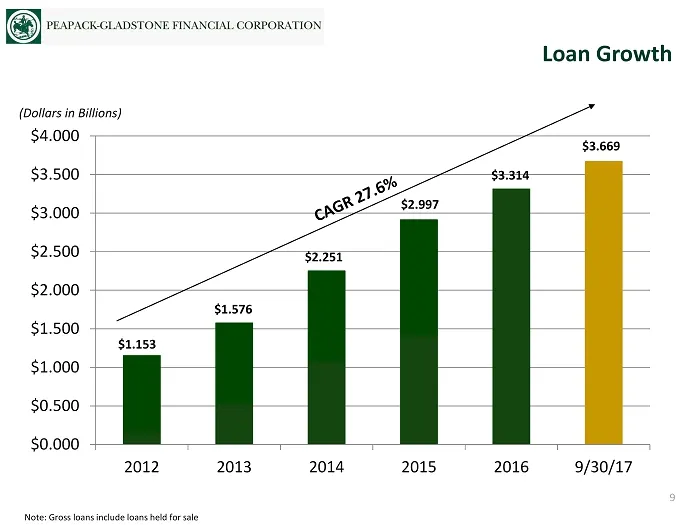
Slide 9: Loan Growth
Note: Gross loans include loans held for sale Loan Growth $0.000 $0.500 $1.000 $1.500 $2.000 $2.500 $3.000 $3.500 $4.000 2012 2013 2014 2015 2016 9/30/17 $2.997 $2.251 $1.576 $1.153 $3.314 (Dollars in Billions) 9 $3.669
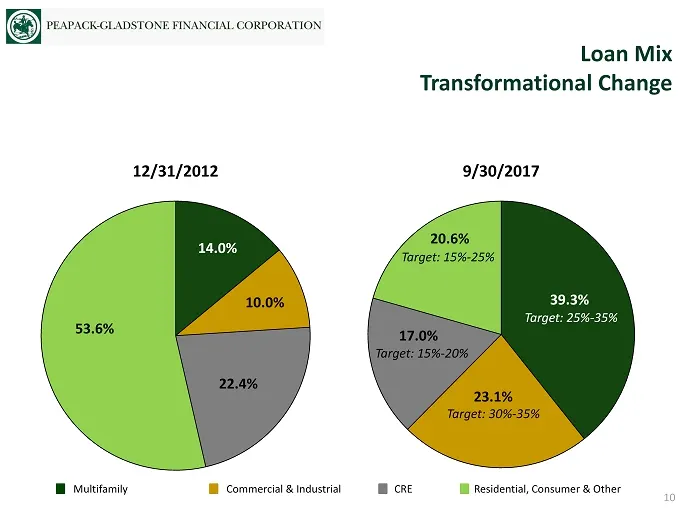
Slide 10: Loan Mix Transformational Change
Loan Mix Transformational Change Multifamily Commercial & Industrial CRE Resident ial , Consumer & Other 39.3% 17.0% 23.1% 20.6% 14.0% 10.0% 22.4% 53.6% 12/31/2012 9/30/2017 Target: 25% - 35% Target: 30% - 35% Target: 15% - 20% Target: 15% - 25% 10
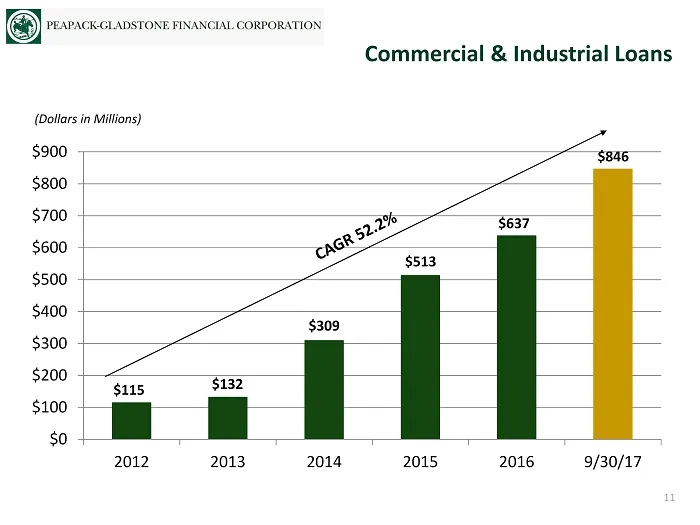
Slide 11: Commercial & Industrial Loans
Commercial & Industrial Loans $0 $100 $200 $300 $400 $500 $600 $700 $800 $900 2012 2013 2014 2015 2016 9/30/17 (Dollars in Millions) $115 $132 $309 $513 $637 11 $846
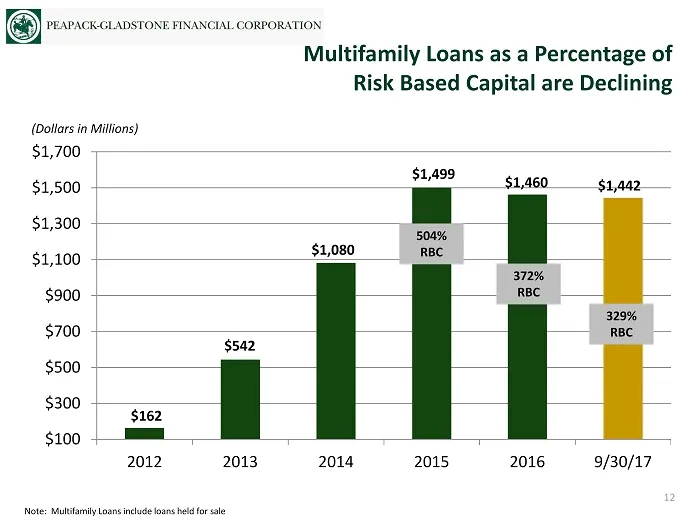
Slide 12: Multifamily Loans as a Percentage of Risk Based Capital are Declining
Multifamily Loans as a Percentage of Risk Based Capital are Declining $100 $300 $500 $700 $900 $1,100 $1,300 $1,500 $1,700 2012 2013 2014 2015 2016 9/30/17 (Dollars in Millions) $162 $542 $1,080 $1,499 $1,460 Note: Multifamily Loans include loans held for sale 504% RBC 12 $1,442 372% RBC 329% RBC
Slide 13: Multifamily loan portfolio overview
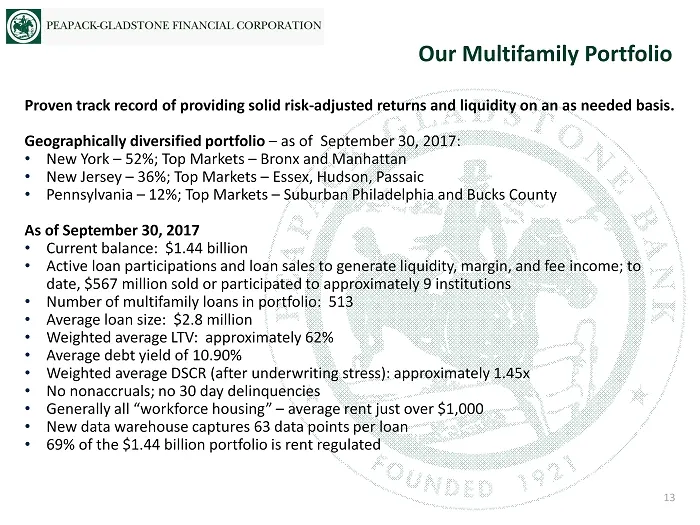
Proven track record of providing solid risk - adjusted returns and liquidity on an as needed basis. Geographically diversified portfolio – as of September 30, 2017: • New York – 52%; Top Markets – Bronx and Manhattan • New Jersey – 36%; Top Markets – Essex, Hudson, Passaic • Pennsylvania – 12%; Top
Slide 14: Total CRE with Multifamily as % of Risk Based Capital
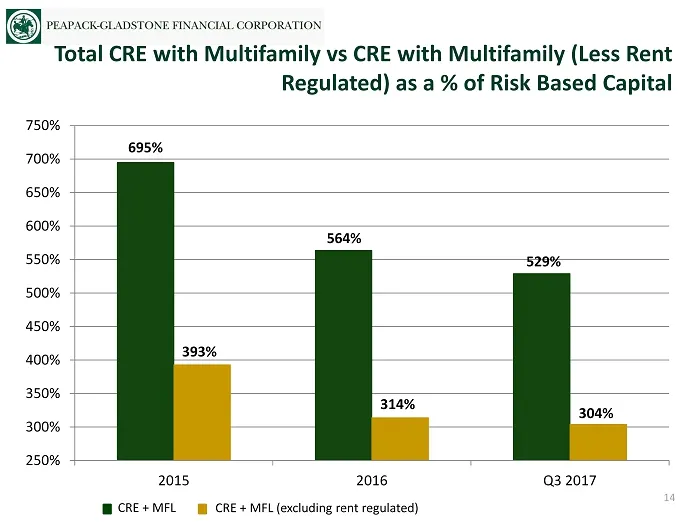
Total CRE with Multifamily vs CRE with Multifamily (Less Rent Regulated) as a % of Risk Based Capital 250% 300% 350% 400% 450% 500% 550% 600% 650% 700% 750% 2015 2016 Q3 2017 14 314% 564% CRE + MFL CRE + MFL (excluding rent regulated) 529% 304% 695% 393%
Slide 15: Credit Risk Management - Metrics & Performance
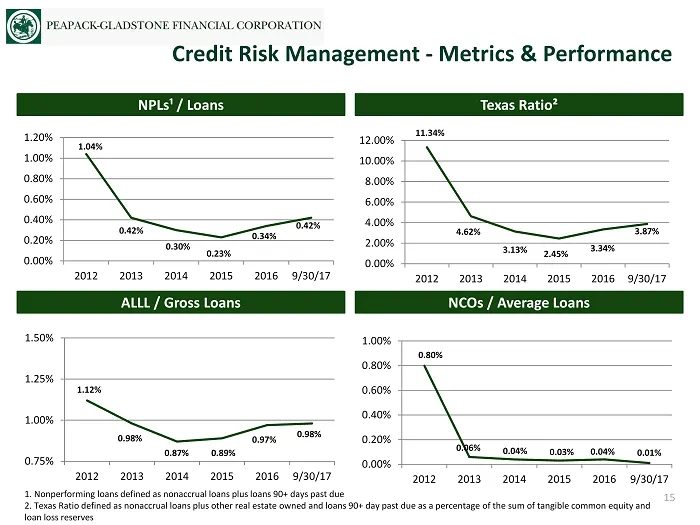
1. Nonperforming loans defined as nonaccrual loans plus loans 90+ days past due 2. Texas Ratio defined as nonaccrual loans plus other real estate owned and loans 90+ day past due as a percentage of the sum of tangible common equity and loan loss reserves Texas Ratio² NPLs¹ / Loans NCOs / Average Loa
Slide 16: Deposit Growth
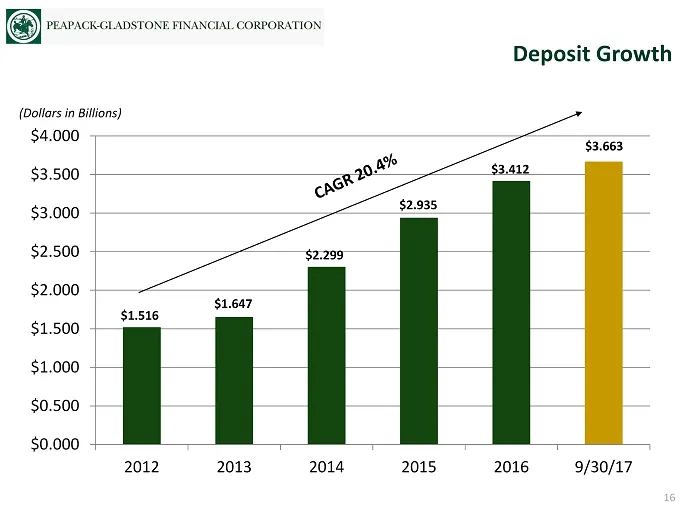
Deposit Growth $0.000 $0.500 $1.000 $1.500 $2.000 $2.500 $3.000 $3.500 $4.000 2012 2013 2014 2015 2016 9/30/17 $2.935 $2.299 $1.647 $1.516 $3.412 (Dollars in Billions) 16 $3.663
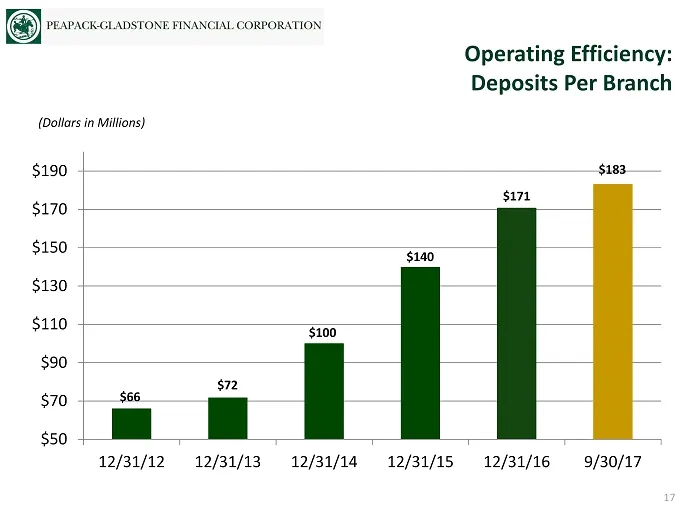
Slide 17: Operating Efficiency: Deposits Per Branch
Operating Efficiency: Deposits Per Branch $50 $70 $90 $110 $130 $150 $170 $190 12/31/12 12/31/13 12/31/14 12/31/15 12/31/16 9/30/17 (Dollars in Millions) $66 $171 $72 17 $100 $140 $183
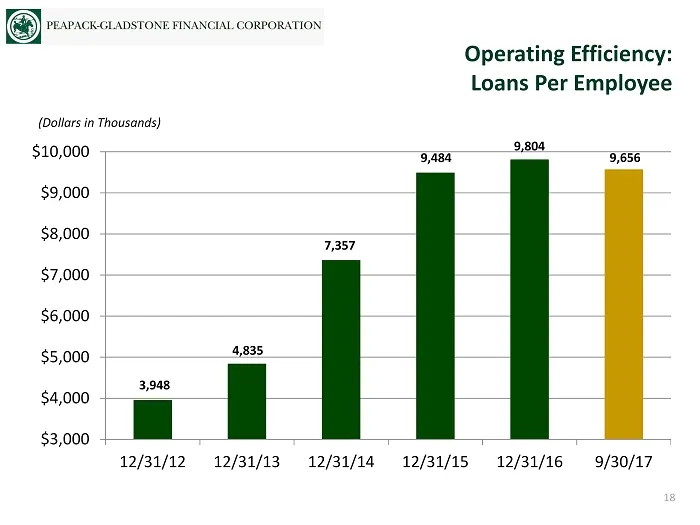
Slide 18: Operating Efficiency: Loans Per Employee
Operating Efficiency: Loans Per Employee $3,000 $4,000 $5,000 $6,000 $7,000 $8,000 $9,000 $10,000 12/31/12 12/31/13 12/31/14 12/31/15 12/31/16 9/30/17 (Dollars in Thousands) 4,835 7,357 9,484 9,804 18 9,656 3,948
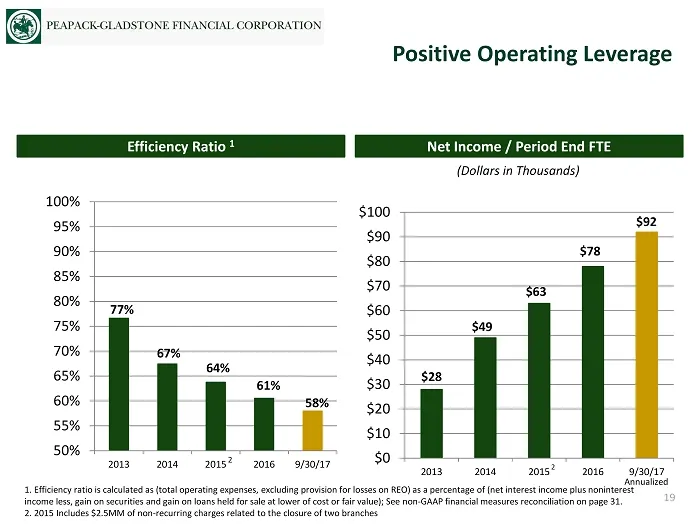
Slide 19: Positive Operating Leverage
1. Efficiency ratio is calculated as (total operating expenses, excluding provision for losses on REO) as a percentage of (ne t i nterest income plus noninterest income less, gain on securities and gain on loans held for sale at lower of cost or fair value); See non - GAAP financial measures reconci
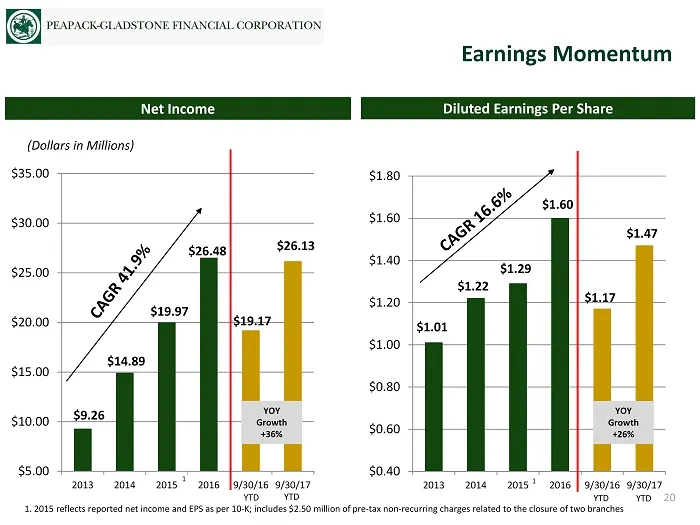
Slide 20: Earnings Momentum
1. 2015 reflects reported net income and EPS as per 10 - K; includes $2.50 million of pre - tax non - recurring charges related to the closure of two branches Earnings Momentum $5.00 $10.00 $15.00 $20.00 $25.00 $30.00 $35.00 2013 2014 2015 2016 9/30/16 9/30/17 1 Net Income Diluted Earnings Per Share
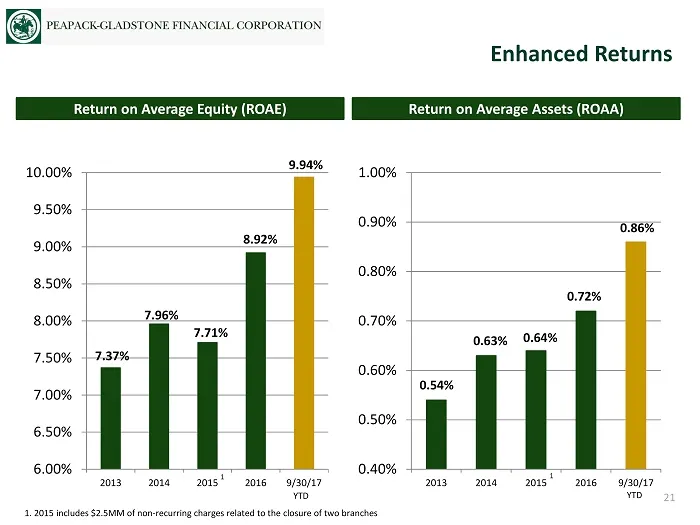
Slide 21: Enhanced Returns
Enhanced Returns 6.00% 6.50% 7.00% 7.50% 8.00% 8.50% 9.00% 9.50% 10.00% 2013 2014 2015 2016 9/30/17 Return on Average Equity (ROAE) Return on Average Assets (ROAA) 0.40% 0.50% 0.60% 0.70% 0.80% 0.90% 1.00% 2013 2014 2015 2016 9/30/17 7.37% 7.96% 7.71% 8.92% 0.54% 0.63% 0.64% 0.72% 1. 2015 includes $
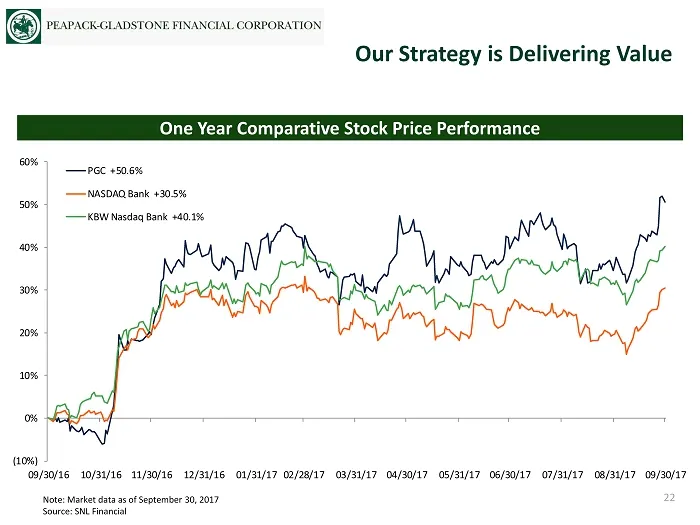
Slide 22: Our Strategy is Delivering Value
Our Strategy is Delivering Value Note: Market data as of September 30, 2017 Source: SNL Financial One Year Comparative Stock Price Performance 22 (10%) 0% 10% 20% 30% 40% 50% 60% 09/30/16 10/31/16 11/30/16 12/31/16 01/31/17 02/28/17 03/31/17 04/30/17 05/31/17 06/30/17 07/31/17 08/31/17 09/30/17 PGC
Slide 23: Upside Potential
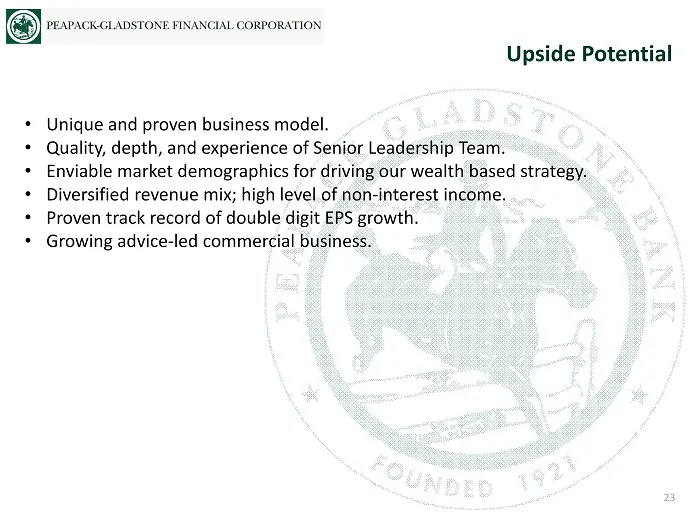
• Unique and proven business model. • Quality, depth, and experience of Senior Leadership Team. • Enviable market demographics for driving our wealth based strategy. • Diversified revenue mix; high level of non - interest income. • Proven track record of double digit EPS growth. • Growing advice - l
Slide 24: Management targets and outlook
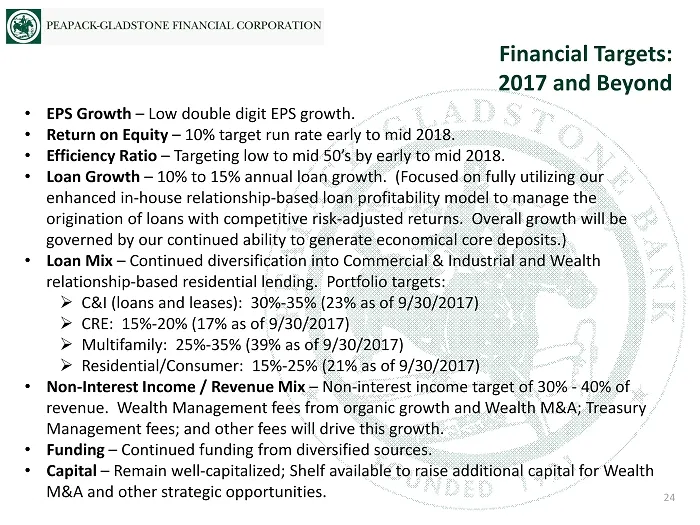
• EPS Growth – Low double digit EPS growth. • Return on Equity – 10% target run rate early to mid 2018. • Efficiency Ratio – Targeting low to mid 50’s by early to mid 2018. • Loan Growth – 10% to 15% annual loan growth. (Focused on fully utilizing our enhanced in - house relationship - based loan pr

Slide 25: Appendix
Appendix P EAPACK - G LADSTONE B ANK
Slide 26: Senior management team
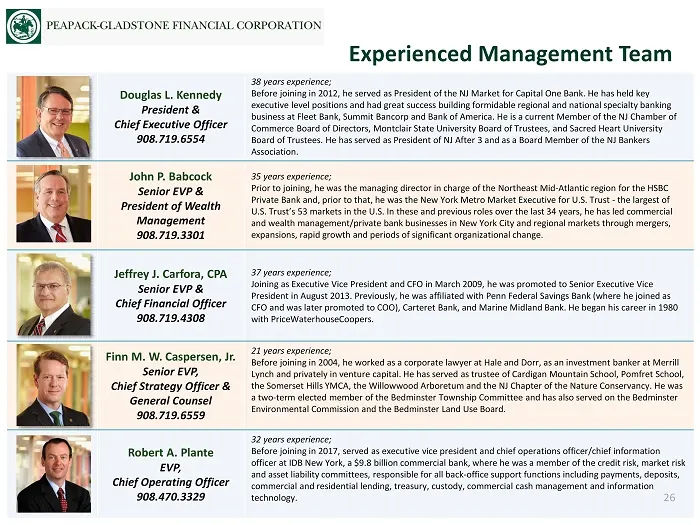
Douglas L. Kennedy President & Chief Executive Officer 908.719.6554 38 years experience; Before joining in 2012, he served as President of the NJ Market for Capital One Bank. He has held key executive level positions and had great success building formidable regional and national specialty banking b
Slide 27: Board of Directors
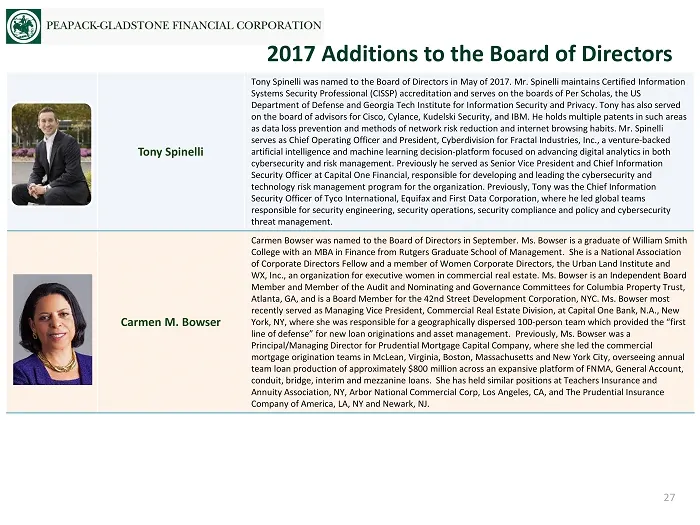
Tony Spinelli Tony Spinelli was named to the Board of Directors in May of 2017. Mr. Spinelli maintains Certified Information Systems Security Professional (CISSP) accreditation and serves on the boards of Per Scholas , the US Department of Defense and Georgia Tech Institute for Information Security
Slide 28: Quarterly Income Statement Summary
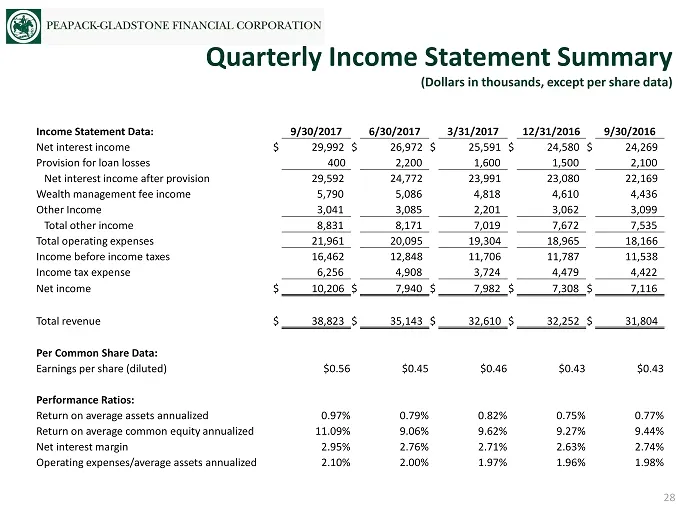
Quarterly Income Statement Summary (Dollars in thousands, except per share data) 28 Income Statement Data: 9/30/2017 6/30/2017 3/31/2017 12/31/2016 9/30/2016 Net interest income $ 29,992 $ 26,972 $ 25,591 $ 24,580 $ 24,269 Provision for loan losses 400 2,200 1,600 1,500 2,100 Net interest income aft
Slide 29: Capital Summary
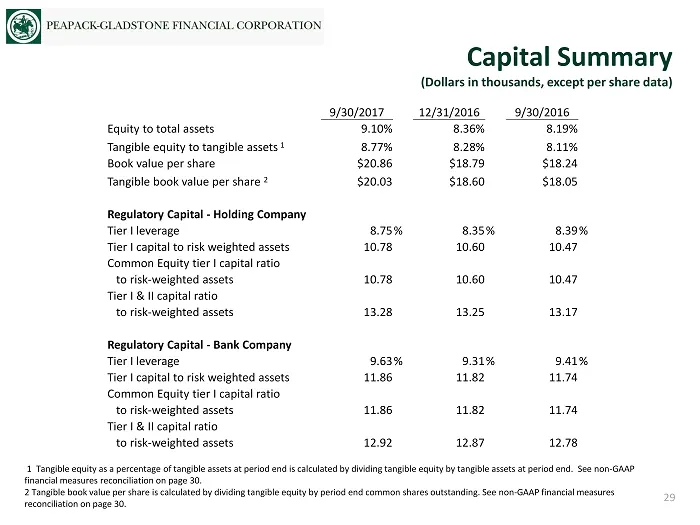
Capital Summary (Dollars in thousands, except per share data) 29 1 Tangible equity as a percentage of tangible assets at period end is calculated by dividing tangible equity by tangible ass et s at period end. See non - GAAP financial measures reconciliation on page 30. 2 Tangible book value per sha
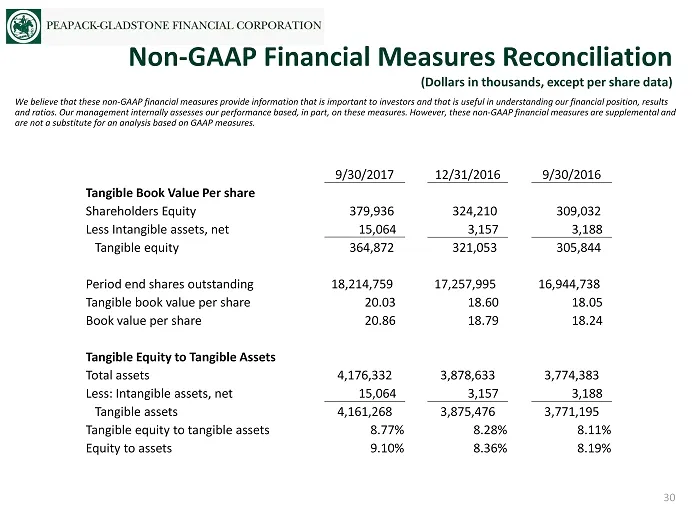
Slide 30: Non-GAAP Financial Measures Reconciliation
Non - GAAP Financial Measures Reconciliation (Dollars in thousands, except per share data) 30 We believe that these non - GAAP financial measures provide information that is important to investors and that is useful in under standing our financial position, results and ratios. Our management interna
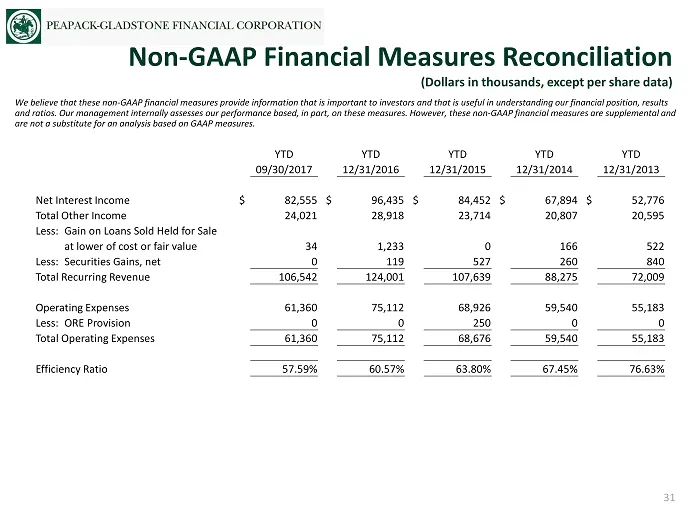
Slide 31: Non-GAAP Financial Measures Reconciliation
We believe that these non - GAAP financial measures provide information that is important to investors and that is useful in under standing our financial position, results and ratios. Our management internally assesses our performance based, in part, on these measures. However, these non - GAAP fina
Source: SEC EDGAR · 8-K filed Oct 27, 2017
More decks from Peapack-Gladstone Financial Corporation
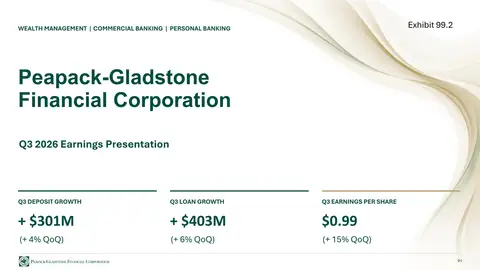 Q3 2026 Earnings Presentation28 slides · Oct 27, 2026
 Q2 2026 Earnings Presentation27 slides · Jul 27, 2026
 Shareholder Meeting (April 2026)16 slides · Apr 30, 2026
 Q1 2026 Earnings Presentation26 slides · Apr 22, 2026
 Q4 2025 Earnings Presentation30 slides · Jan 29, 2026
 Q3 2025 Earnings Presentation24 slides · Oct 22, 2025