Kindred Healthcare — Investor Presentation (March 2010)
43 slides from Kindred Healthcare's investor presentation, Mar 24, 2010

Slide 1: Kindred Healthcare Investor Presentation March 2010
NYSE:KND Investor Presentation March 2010 EXHIBIT 99.1 Kindred Healthcare

Slide 2: Forward-Looking Statements
FORWARD-LOOKING STATEMENTS This presentation includes forward-looking statements within the meaning of Section 27A of the Securities Act of 1933, as amended, and Section 21E of the Securities Exchange Act of 1934, as amended. All statements regarding the Company’s expected future financial position,

Slide 3: Largest Diversified Post-Acute Provider in the United States
3 621 (3) sites of service, 305 facilities in 41 states 54,100 (3) dedicated employees, making Kindred a top-200 private employer in the U.S. (4) 32,000 (3) patients and residents per day $4.3 billion (2) consolidated revenues LARGEST DIVERSIFIED POST-ACUTE PROVIDER IN THE UNITED STATES (1) (1) Rank
Slide 4: Three Market Leading Businesses Positioned for Growth
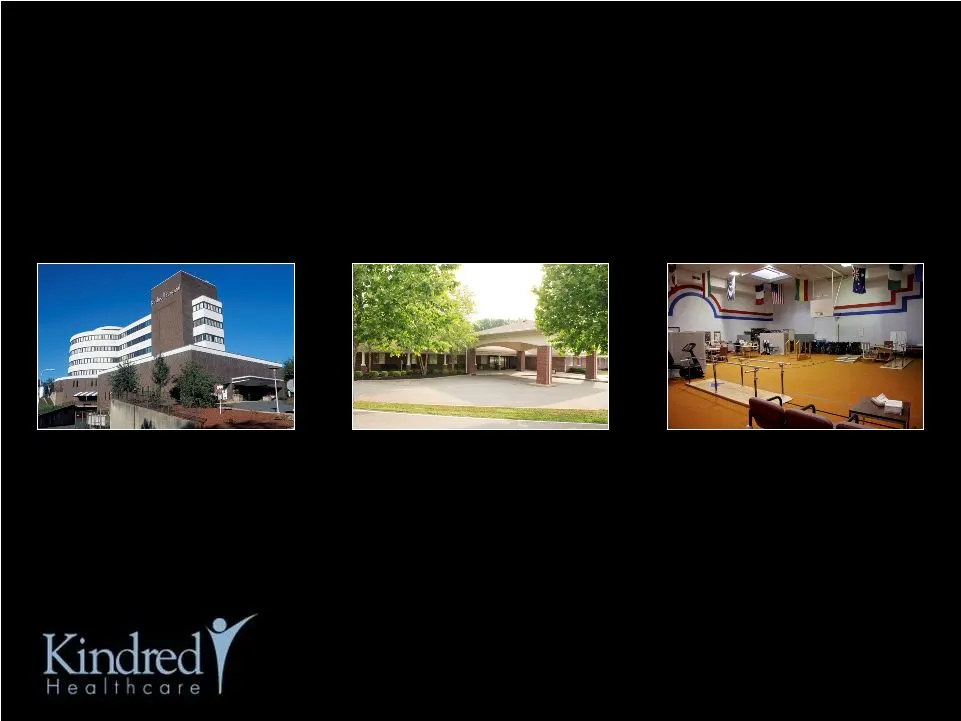
4 $1.9 billion revenues (1) HOSPITAL Long-term Acute Care Hospitals $2.2 billion revenues (1) HEALTH SERVICES Nursing and Rehabilitation Centers $475 million revenues (1) REHABILITATION People first Rehabilitation Services (1) Revenues for the fiscal year ended December 31, 2009 (divisional revenues
Slide 5: Diverse Geographic Portfolio with Cluster Market Development Focus
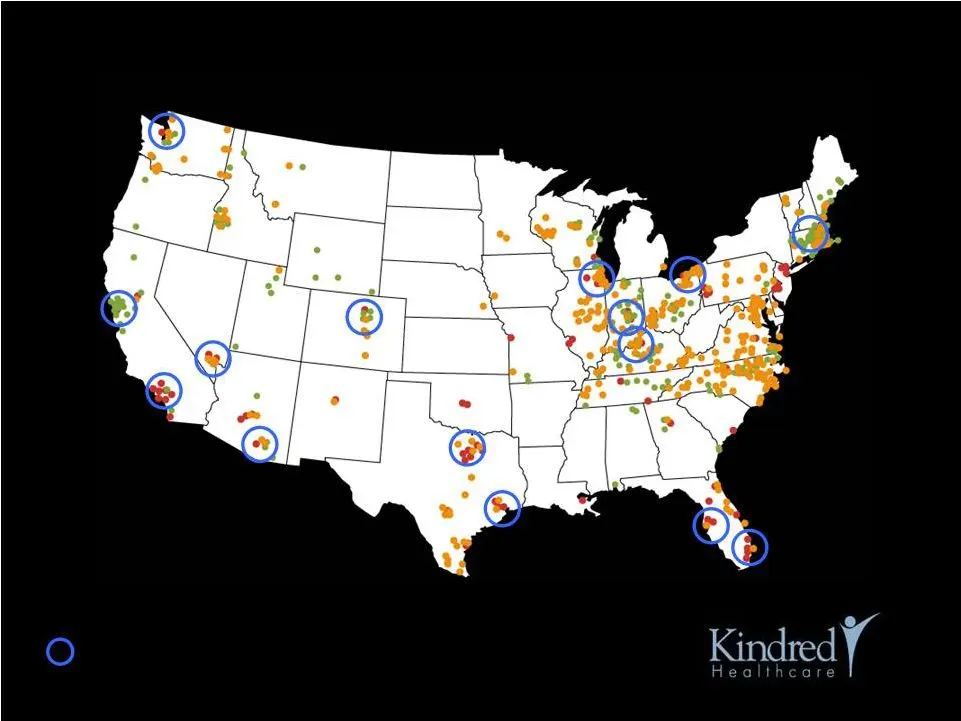
5 DIVERSE GEOGRAPHIC PORTFOLIO WITH INCREASED FOCUS ON CLUSTER MARKET DEVELOPMENT CLUSTER MARKET DEVELOPMENT FOCUS As of December 31, 2009 83 HOSPITALS 222 NURSING CENTERS 316 EXTERNAL REHAB CUSTOMERS

Slide 6: Healthcare Companies in the World, Fortune Magazine
Healthcare Companies in the World, Fortune Magazine 2009 and 2010

Slide 7: Post-Acute Landscape Change Drivers
7 POST-ACUTE LANDSCAPE CHANGE DRIVERS • Long-term growth prospects supported by strong demographic trends and significant increase in the incidence of chronic diseases • Advances in medical technology, clinical practice and new integrated delivery models • Payors and consumers looking for lower cost

Slide 8: Healthcare Reform
8 HEALTHCARE REFORM • The Senate legislation passed by the House and signed by President Obama extends the therapy cap exception process through December 2010 and the MMSEA LTACH provisions for two additional years until the end of 2012 • System and payment reforms will accelerate under healthcare r
Slide 9: Opportunities for Growth Within Changing Post-Acute Landscape
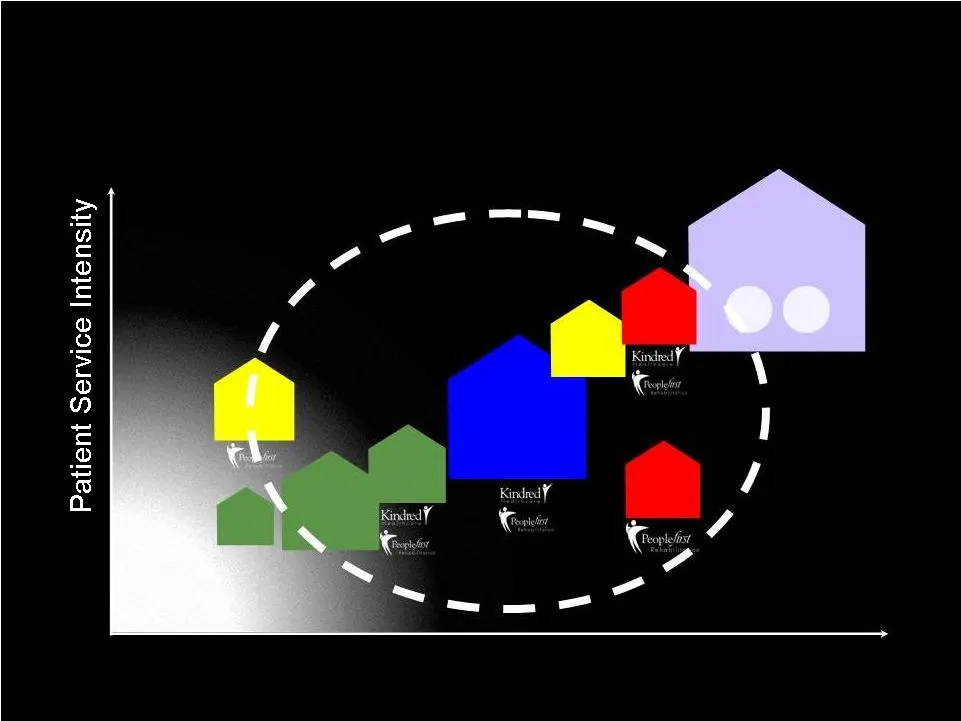
9 OPPORTUNITIES FOR GROWTH WITHIN CHANGING POST-ACUTE LANDSCAPE Patient Illness Severity SKILLED NURSING FACILITIES TRANS CARE ICU HOSPICE HOME HEALTH CARE ADULT DAY CARE OUTPATIENT REHAB ASSISTED LIVING ACUTE CARE HOSPITALS TRANS CA R E R E E ICU IN-PATIENT REHAB LTACs FREESTANDING/ HIH HOME

Slide 10: Portfolio Strategy, Current Business Strategy, Long-Term Strategic Initiatives
10 Portfolio Strategy Current Business Strategy Long-Term Strategic Initiatives

Slide 11: Portfolio Strategy
11 Portfolio Strategy • Reinvest in our SNFs and selectively acquire SNFs and ALFs in Cluster Markets • Reinvest/develop new LTACs and hospital-based subacute units • Build our People first Rehab business (SNF/Hospital/inpatient and outpatient)

Slide 12: Current Business Strategy
12 • Leverage Culture and Performance Improvement Process including: – Company-wide Service Excellence Program – Employee Satisfaction and Engagement Programs • Continue to energize our Sales and Marketing efforts • Execute on a market specific Managed Care Strategy • Develop and expand Physician Se

Slide 13: Long-Term Strategic Initiatives
13 • Develop Centers of Clinical Excellence • Develop Post - Acute Service Lines and better manage patients across the continuum (i.e., LTAC to subacute or SNF to Homecare/Hospice/ALF) • Cluster Market Development • Execute on Hospice/Home Health strategy • Promote our Value Proposition Long-Term St

Slide 14: Developing Centers of Clinical Excellence and Expanding Clinical Programs
14 • Orthopedic and other Rehab • Cardio/Pulmonary Rehab • Complex Wound, Stroke Recovery and other Medically Complex Care • Respiratory Therapy, including Vent/Trach Care • Diabetes, Renal Care and Infectious Disease Management, including dialysis services DEVELOPING CENTERS OF CLINCIAL EXCELLENCE
Slide 15: Kindred's Developing Post-Acute Service Lines
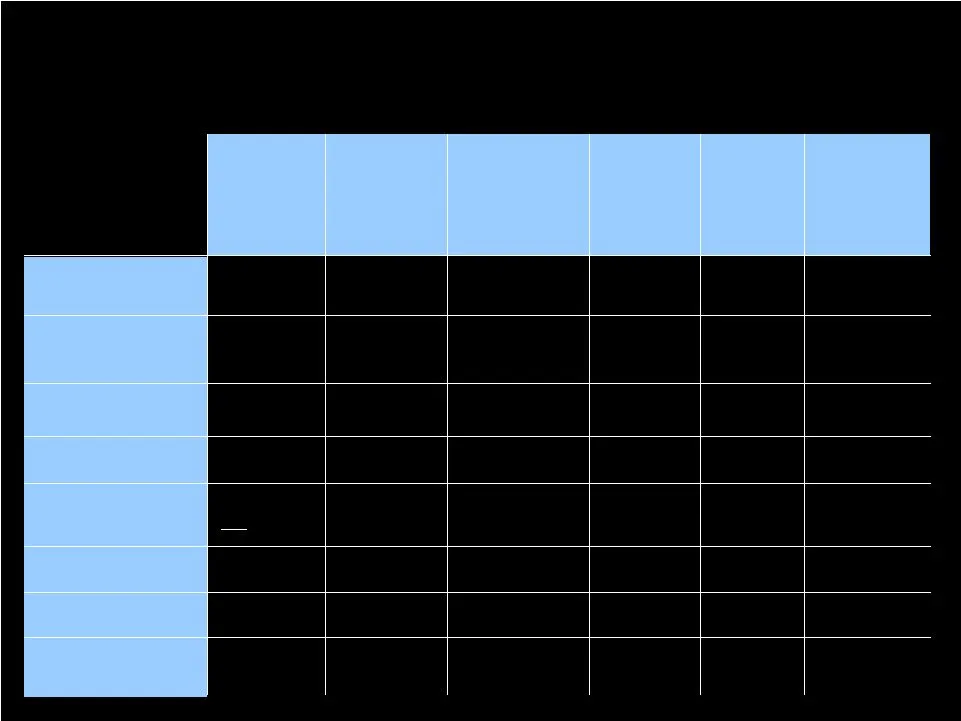
15 $130-180 92+ days 1.0-1.5 Yes 0 3.25-3.4 every 30 days Yes $300-600 20-40 days 2.0-3.0 Yes 0-1.0 4.0-5.0 2-3 times weekly Yes $300-600 20-40 days 2.0-3.0 Yes 0-1.0 4.0-5.0 2-3 times weekly Yes $400-700 15-30 days 2.5-3.5 Yes 1.0-1.5 5.0-6.5 3-4 times weekly/offered daily Yes $1,200-1,800 26 days

Slide 16: Cluster Market Defined
16 • A framework and strategy to improve operations in sites of service that are geographically proximate • A business strategy to position assets/service lines and deploy capital to take advantage of an increasingly integrated healthcare delivery system in certain local markets • A competitive stra

Slide 17: Aspects of a Cluster Market Strategy
17 • Centralized Business Office Operations • Coordinated Human Resource and Staffing Functions • Shared Services (e.g., lab, radiology, etc.) • Collaborative Sales and Marketing • Collaborative Managed Care Strategy • Collaborative Physician Services Strategy • Coordinated Care, Continuum of Care M
Slide 18: Service Line Coverage in Cluster Markets
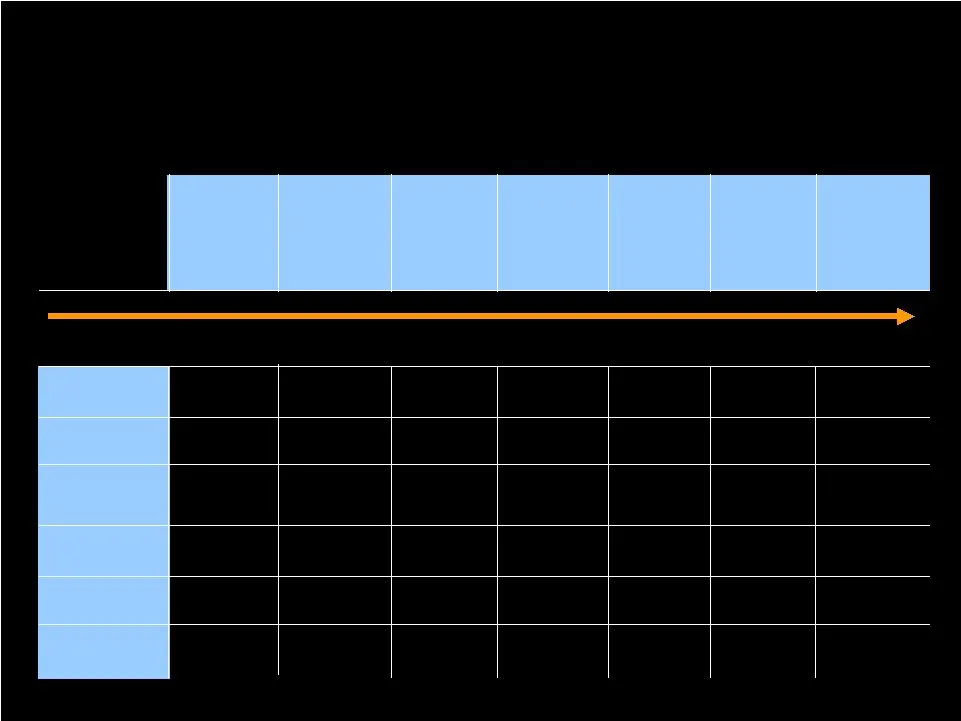
18 SERVICE LINE COVERAGE IN CLUSTER MARKETS Reflects anticipated development activity - - - 2 3 - - 2 1 2 - 1 1 1 3 1 6 - 1 2 - 2 5 - 2 12 11 2 - 5 - - - - 1 1 5 5 6 10 10 31 Cleveland Las Vegas Louisville Indianapolis Boston Long-Term Care SNFs (Including Alzheimer's, Hospice and Palliative Care) T

Slide 19: Specific Growth Initiatives
19 SPECIFIC GROWTH INITIATIVES

Slide 20: Health Services Division Growth Initiatives
20 HEALTH SERVICES DIVISION GROWTH INITIATIVES • Organic growth driven by improving quality, enhancing clinical capabilities and improving customer service • Improving productivity and accountability of sales and marketing team • Improved contracting and relationship management with managed care org
Slide 21: Health Services Facility Comparison
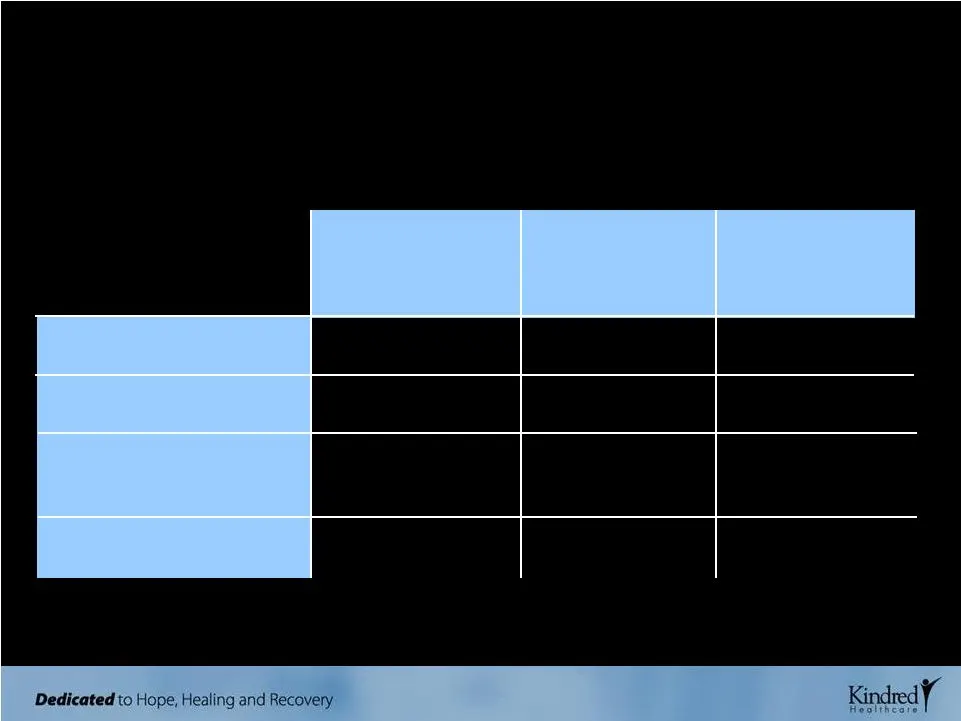
21 HEALTH SERVICES FACILITY COMPARISON 16% to 18% 92% 44% to 52% $25 million 14% to 16% 90% 31% to 35% $23 million 12% to 14% 90% 23% to 28% $12 million Comparison does not include data for four managed facilities. EBITDARM Margin % Occupancy % Medicare & Managed Care Census % Capital Investment Tra

Slide 22: Hospital Division Growth Initiatives
22 HOSPITAL DIVISION GROWTH INITIATIVES • Organic opportunities – Deepen relationships with referral sources and physician groups – Increase admissions through managed care contracting – Use new technology to increase speed of referrals/admissions – electronic referral software, automate patient ass
Slide 23: Hospital Development 2008-2011
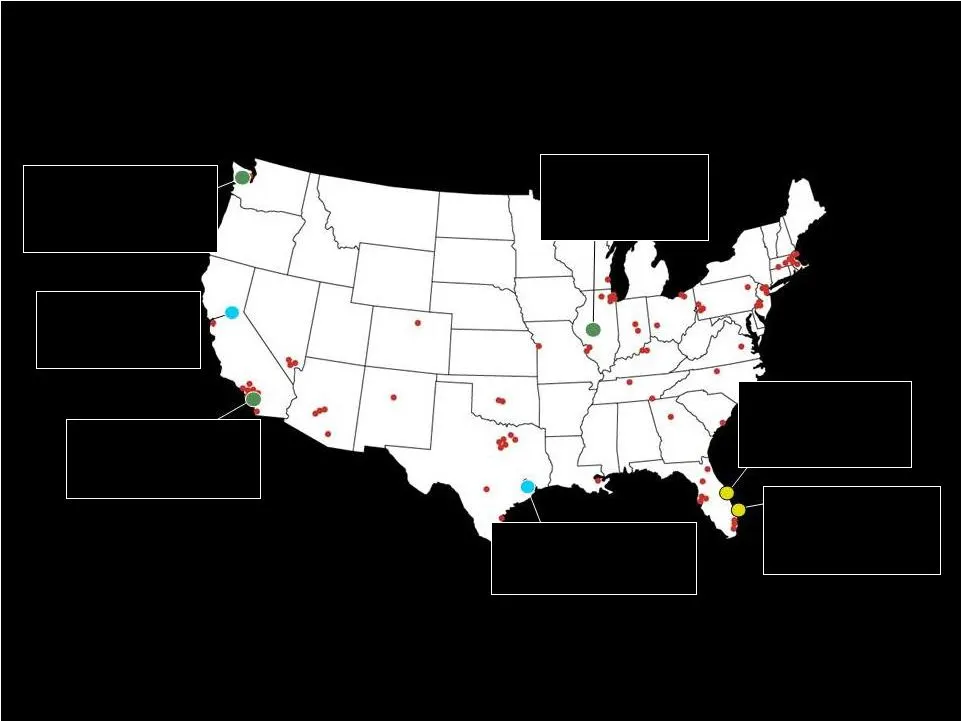
23 HOSPITAL DEVELOPMENT 2008 - 2011 The Palm Beaches 70-bed LTAC Opened: Aug. 2008 Total Capital: $31 Million Melbourne 60-bed LTAC Opened: Dec. 2009 Total Capital: $31 Million Springfield 50-bed LTAC Opening date: Q4 2010 Total Capital: $24 Million Torrance 50-bed HIH Opening date: Q4 2010 Total Ca
Slide 24: Hospital-Based Subacute Unit Development 2009-2012
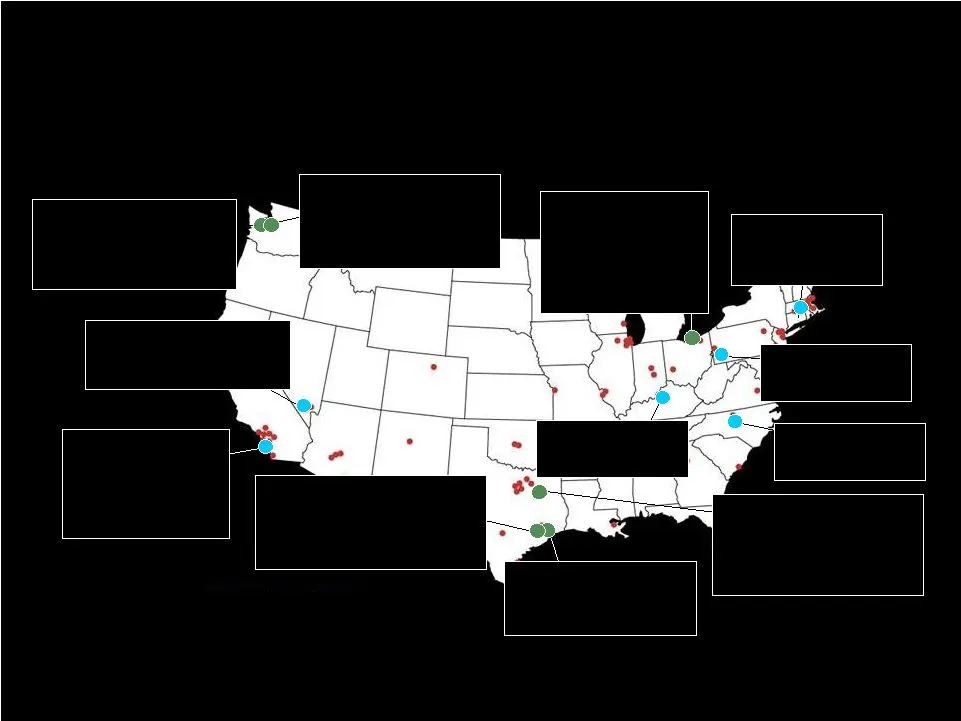
24 HOSPITAL-BASED SUBACUTE UNIT DEVELOPMENT 2009 - 2012 Pittsburgh 39-bed unit Springfield - Parkview 28-bed unit Louisville 47-bed unit Greensboro 23-bed unit Las Vegas - Flamingo 50-bed unit Brea 38-bed co-located subacute unit Opened: Mar. 2009 Total Capital: $3 Million Cleveland Expanding 40-bed

Slide 25: People First Rehabilitation Growth Initiatives
25 PEOPLE FIRST REHABILITATION GROWTH INITIATIVES • New Contract Growth and Customer Marketing Program • New Patient Case Management Initiative • Services Expansion (Cardio-Pulmonary Rehab, Wound Care, Stroke Recovery) • RehabMax – Operational and capital program ($10 million) to refurbish and expan

Slide 26: Financial Review
26 FINANCIAL REVIEW
Slide 27: Q4 Highlights Continuing Operations
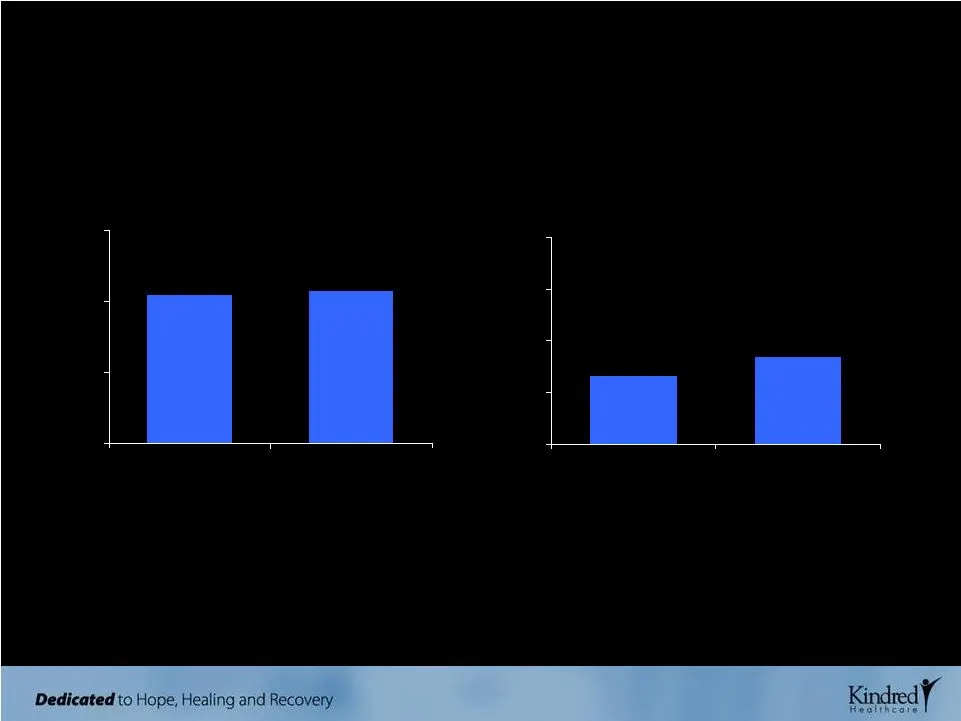
27 Q4 HIGHLIGHTS CONTINUING OPERATIONS CONSOLIDATED REVENUES ($ millions) $1,037 $1,070 $0 $500 $1,000 $1,500 Q4 '08 Q4 '09 DILUTED EPS Diluted EPS reported at $0.42, exceeding our guidance of $0.30 to $0.35 $0.33 $0.42 $0.00 $0.25 $0.50 $0.75 $1.00 Midpoint of Q4 '09 Guidance Q4 '09 Consolidated re
Slide 28: Q4 Highlights: Hospital Admissions and People First Operating Income
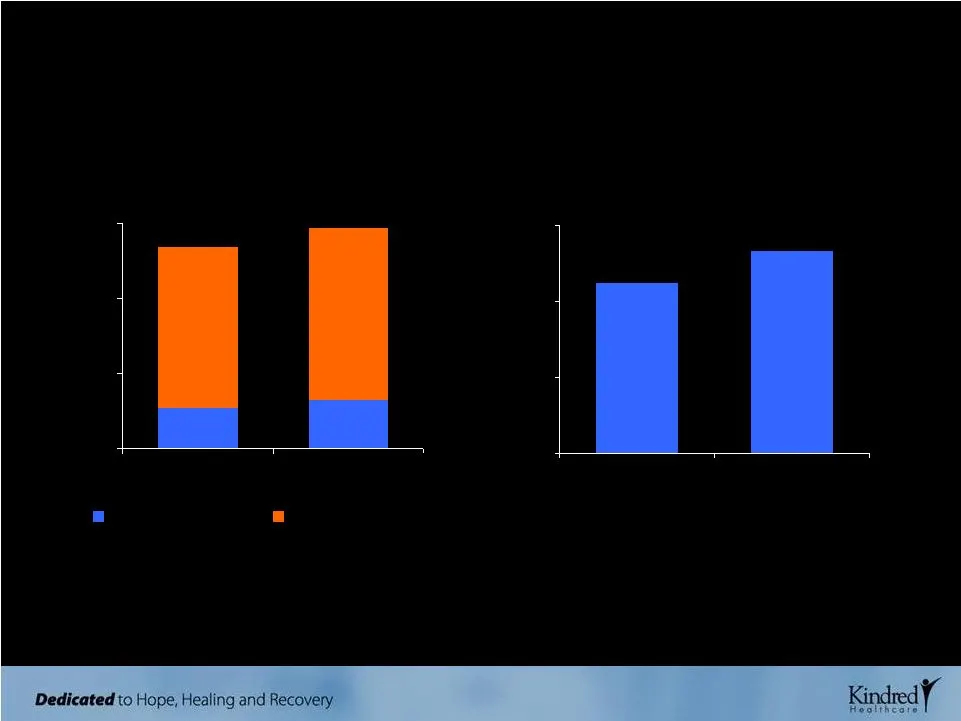
28 Q4 HIGHLIGHTS CONTINUING OPERATIONS HOSPITAL ADMISSIONS PEOPLE FIRST OPERATING INCOME People first Rehabilitation operating income grew 19% from last year’s fourth quarter. $8,959 $10,628 $0 $4,000 $8,000 $12,000 Q4 '08 Q4 '09 2,695 3,199 10,792 11,466 0 5,000 10,000 15,000 Q4 '08 Q4 '09 Non-Gove
Slide 29: 2009 Full Year Highlights Continuing Operations
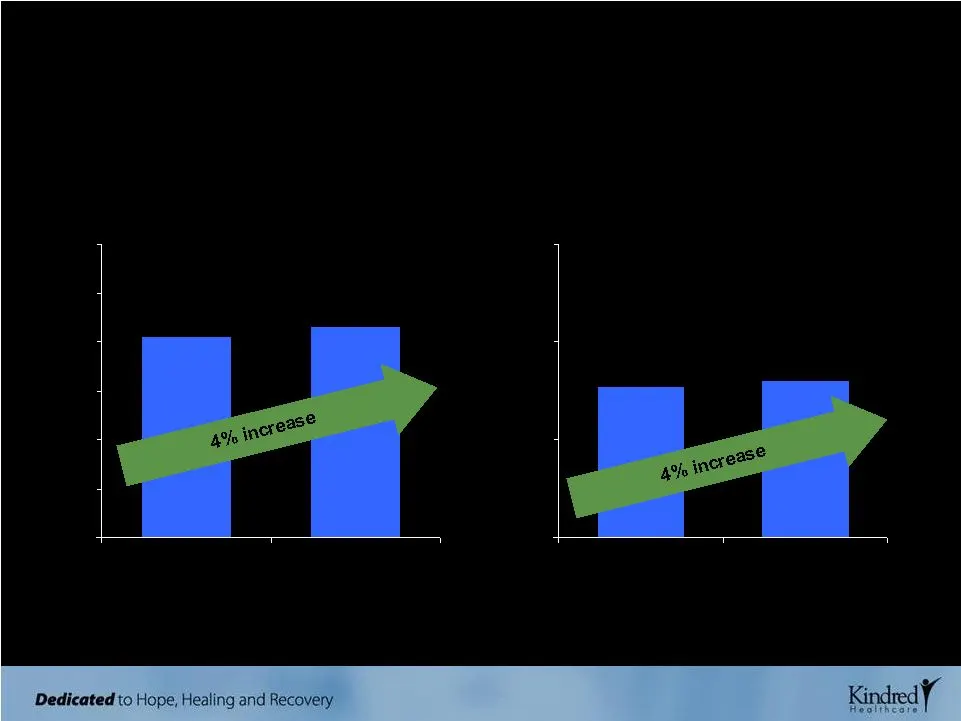
29 2009 FULL YEAR HIGHLIGHTS CONTINUING OPERATIONS CONSOLIDATED REVENUES ($ billions) $4.1 $4.3 $0.0 $1.0 $2.0 $3.0 $4.0 $5.0 $6.0 2008 2009 DILUTED EPS $1.54 $1.60 $0.00 $1.00 $2.00 $3.00 2008 2009
Slide 30: 2009 Financial Highlights
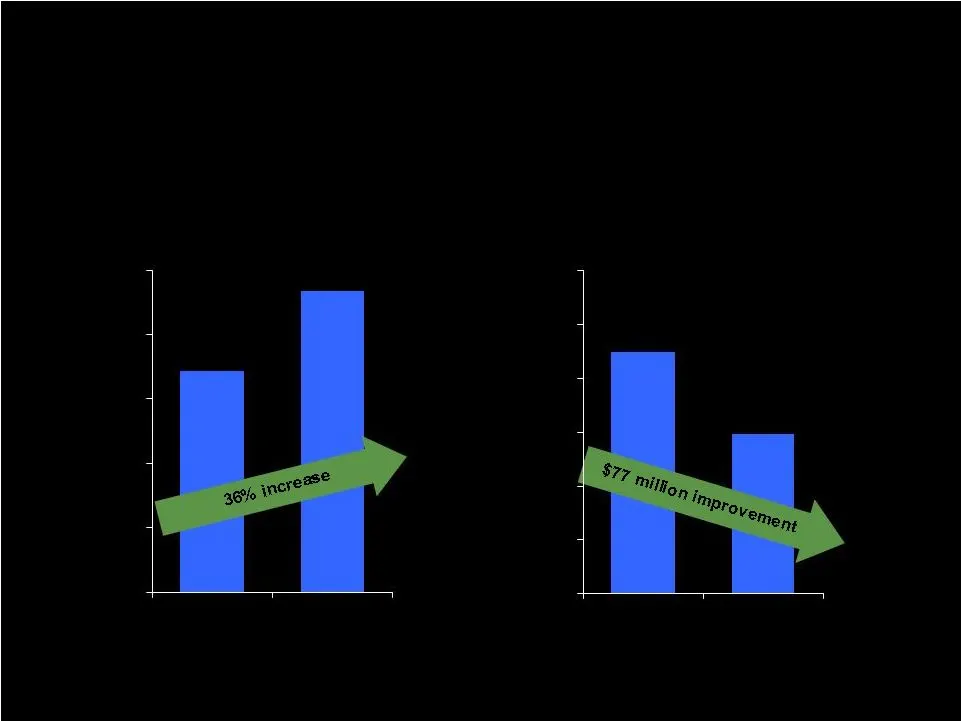
30 2009 FINANCIAL HIGHLIGHTS ($ IN MILLIONS) OPERATING CASH FLOWS LONG-TERM DEBT, NET OF EXCESS CASH $172 $234 $0 $50 $100 $150 $200 $250 2008 2009 $225 $148 $0 $50 $100 $150 $200 $250 $300 Dec. '08 Dec. '09

Slide 31: 2010 Earnings Guidance as Issued on February 22, 2010
31 • Consolidated revenues are expected to approximate $4.5 billion • Operating income is expected to range from $571 million to $579 million • Rent expense is expected to approximate $360 million, while depreciation, amortization and net interest expense are expected to approximate $128 million • I
Slide 32: Capital Investments
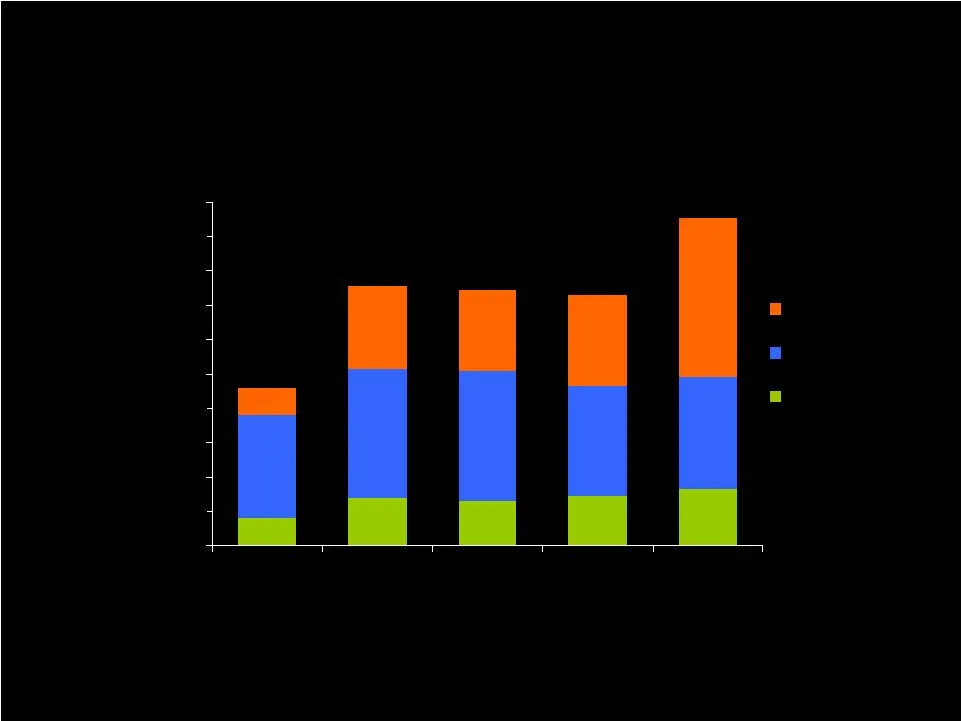
32 CAPITAL INVESTMENTS ($ millions) CONSOLIDATED CAPITAL INITIATIVES $16 $28 $26 $29 $33 $60 $75 $76 $64 $65 $16 $48 $47 $53 $93 $0 $20 $40 $60 $80 $100 $120 $140 $160 $180 $200 2004 2006 2008 2009 Projected '10 Organic Growth & Development Routine Commitments Information Systems $92 $151 $149 $146
Slide 33: 2009 and Projected 2010 Growth and Development Capital Initiatives
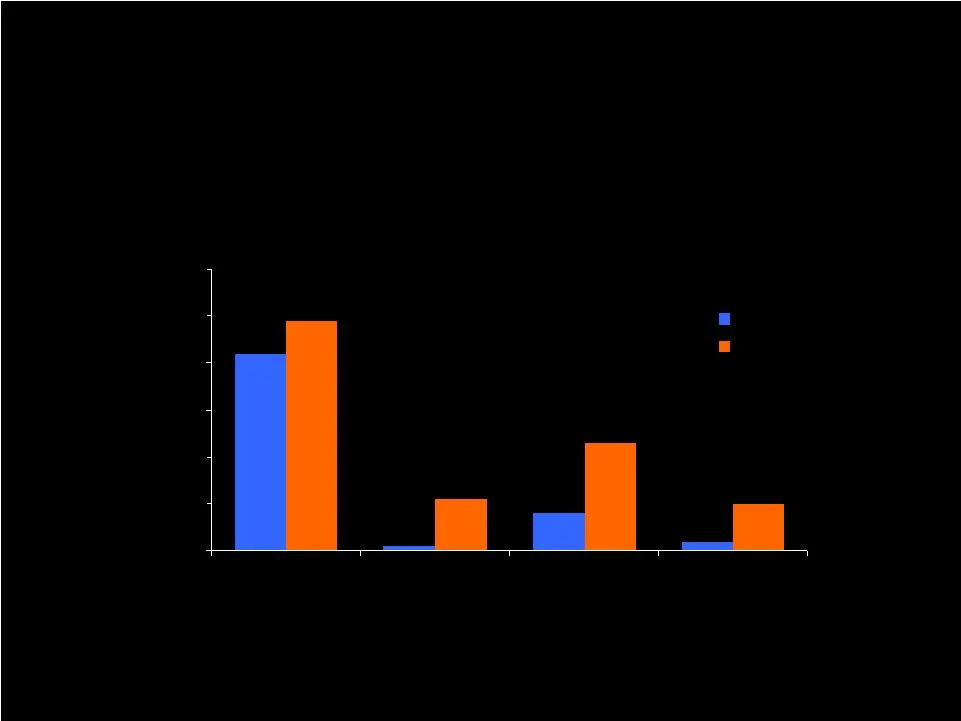
33 $42 $1 $8 $2 $49 $11 $23 $10 $0 $10 $20 $30 $40 $50 $60 Hospital Development Hospital-Based Subacute Units and Other Projects TCC/TCU Development Peoplefirst Rehab MAX 2009 2010 2009 AND PROJECTED 2010 GROWTH AND DEVELOPMENT CAPITAL INITIATIVES CAPITAL INVESTMENTS ($ millions)

Slide 34: Capital Structure, Financial Capacity and Operational Flexibility
34 • $500 million asset-based revolver – Expiration - July 2012 – Thirteen member lender group – Pricing determined by average daily borrowings – Current level priced at LIBOR + 150 basis points – $353 million of revolver capacity at December 2009 • Operational flexibility in Master Leases facilitat

Slide 35: Investment Considerations
35 • Track record for operational success based on commitment to quality, service excellence and a disciplined approach to the business • Experience management team, robust technology platform, processes and systems, and a demonstrated ability to adapt to change • Growing businesses through discipli

Slide 36: Appendix
36 APPENDIX

Slide 37: Reconciliation of Non-GAAP Measures
RECONCILIATION OF NON-GAAP MEASURES Year ended December 31, Operating income (loss): 2005 2006 2007 2008 Hospital division Health services division Rehabilitation division Pharmacy division Corporate: Overhead Insurance subsidiary Reorganization items Operating income Rent Depreciation and amortizat

Slide 38: 2010 Earnings Guidance Ranges
38 2010 EARNINGS GUIDANCE RANGES (a) (IN MILLIONS, EXCEPT PER SHARE AMOUNTS) Low High Operating income $ 571 $ 579 Rent 360 360 Depr. & amort. 123 123 Interest, net 5 5 Income from continuing operations before income taxes 83 91 Provision for income taxes 35 37 Income from continuing operations 48 5
Slide 39: Professional Liability Expense
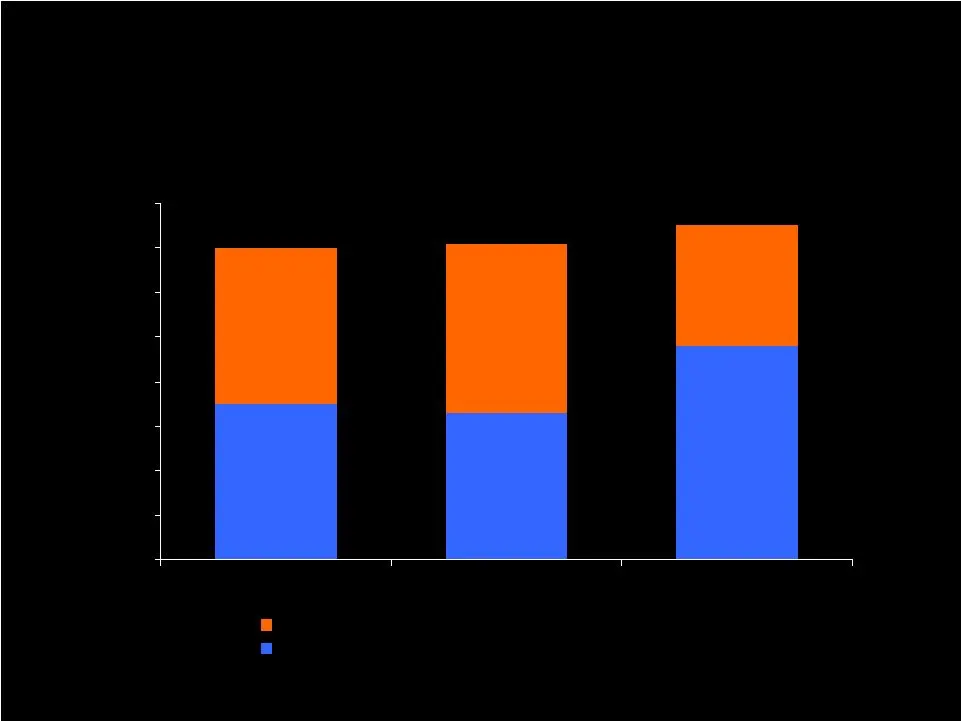
39 PROFESSIONAL LIABILITY EXPENSE ($ IN MILLIONS) $35 $33 $48 $35 $38 $27 $0 $10 $20 $30 $40 $50 $60 $70 $80 2007 2008 2009 Reduction of expense after changes in prior years' estimates Final net expense
Slide 40: 2009 Balanced Scorecard Health Services Division
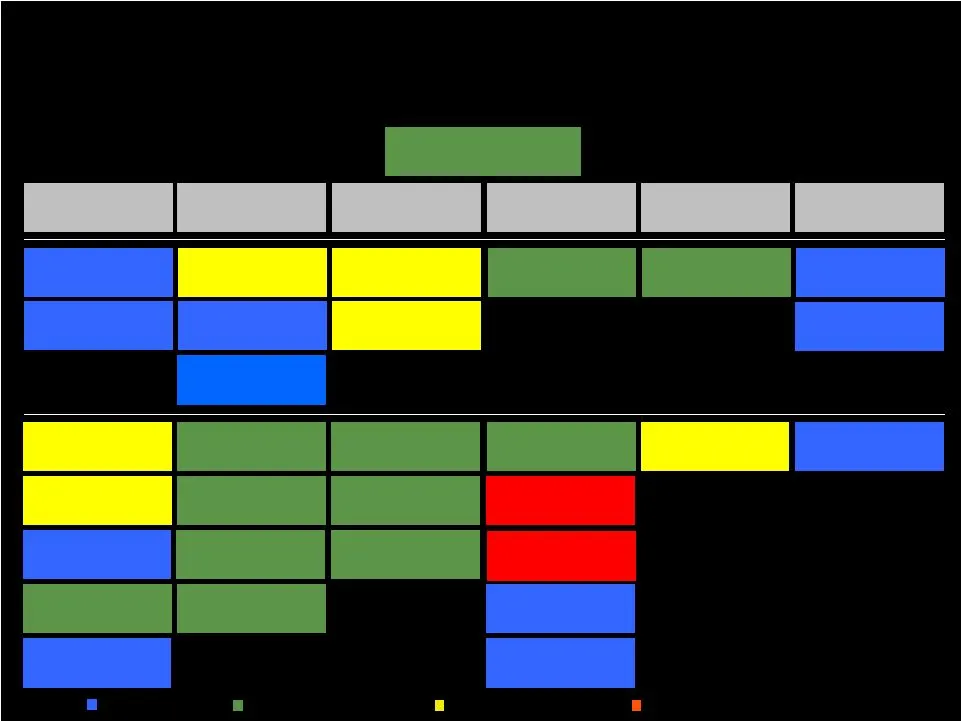
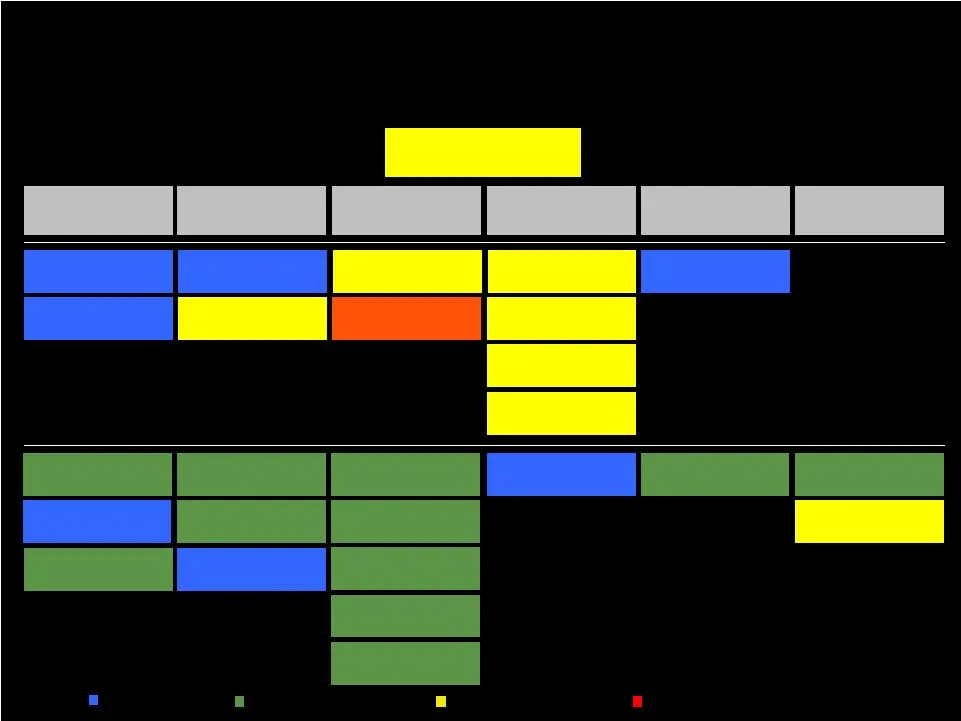
40 Employee Turnover ADR Acceptance Clearing Tags on First Follow-up Customer Service Satisfaction Nursing Turnover Average Wage Rate Overtime & Contract Labor 2009 BALANCED SCORECARD HEALTH SERVICES DIVISION - YEAR RESULTS Legend: Maximum Achieved Between Maximum & Target Between Target & Minimum B
Slide 41: 2009 Balanced Scorecard Hospital Division
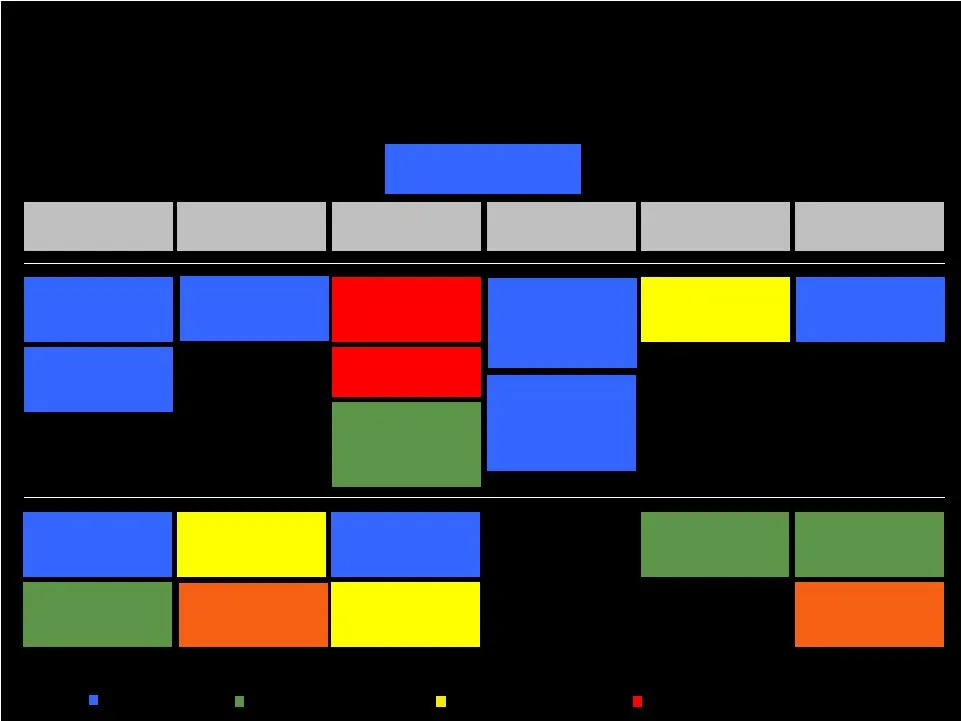
41 Employee Turnover Clinical Quality Index A/R Days (Non-Medicare) CEO & CCO Turnover Wound Care Improvement Contract Labor 2009 BALANCED SCORECARD HOSPITAL DIVISION - YEAR RESULTS Legend: Maximum Achieved Between Maximum & Target Between Target & Minimum Below Minimum Nursing & Resp. Therapist Tur
Slide 42: 2009 Balanced Scorecard People First Rehabilitation
Therapist Turnover Functional Outcome Measurement (FOM) Data Entry Manager Turnover Employee Satisfaction Legend: Maximum Achieved Between Maximum & Target Between Target & Minimum Below Minimum 2009 BALANCED SCORECARD PEOPLE FIRST REHABILITATION - YEAR RESULTS Acute Direct Labor % of Revenue Custom

Slide 43: Kindred Healthcare
NYSE:KND Investor Presentation March 2010 Kindred Healthcare
Source: SEC EDGAR · 8-K filed Mar 24, 2010
More decks from Kindred Healthcare Inc
 Investor Presentation (June 2018)9 slides · Jun 1, 2018
 Merger or Acquisition (February 2018)26 slides · Feb 21, 2018
 Merger or Acquisition (February 2018)24 slides · Feb 5, 2018
 Merger or Acquisition (November 2014)23 slides · Nov 12, 2014
 Q2 2014 Earnings Presentation28 slides · Aug 7, 2014
 Debt Investor Presentation (March 2014)46 slides · Mar 12, 2014