TPG Inc. · NASDAQ:TPG
TPG — EVBox Group — SPAC Merger (March 2021)
30 slides from TPG's SPAC merger presentation, March 2021
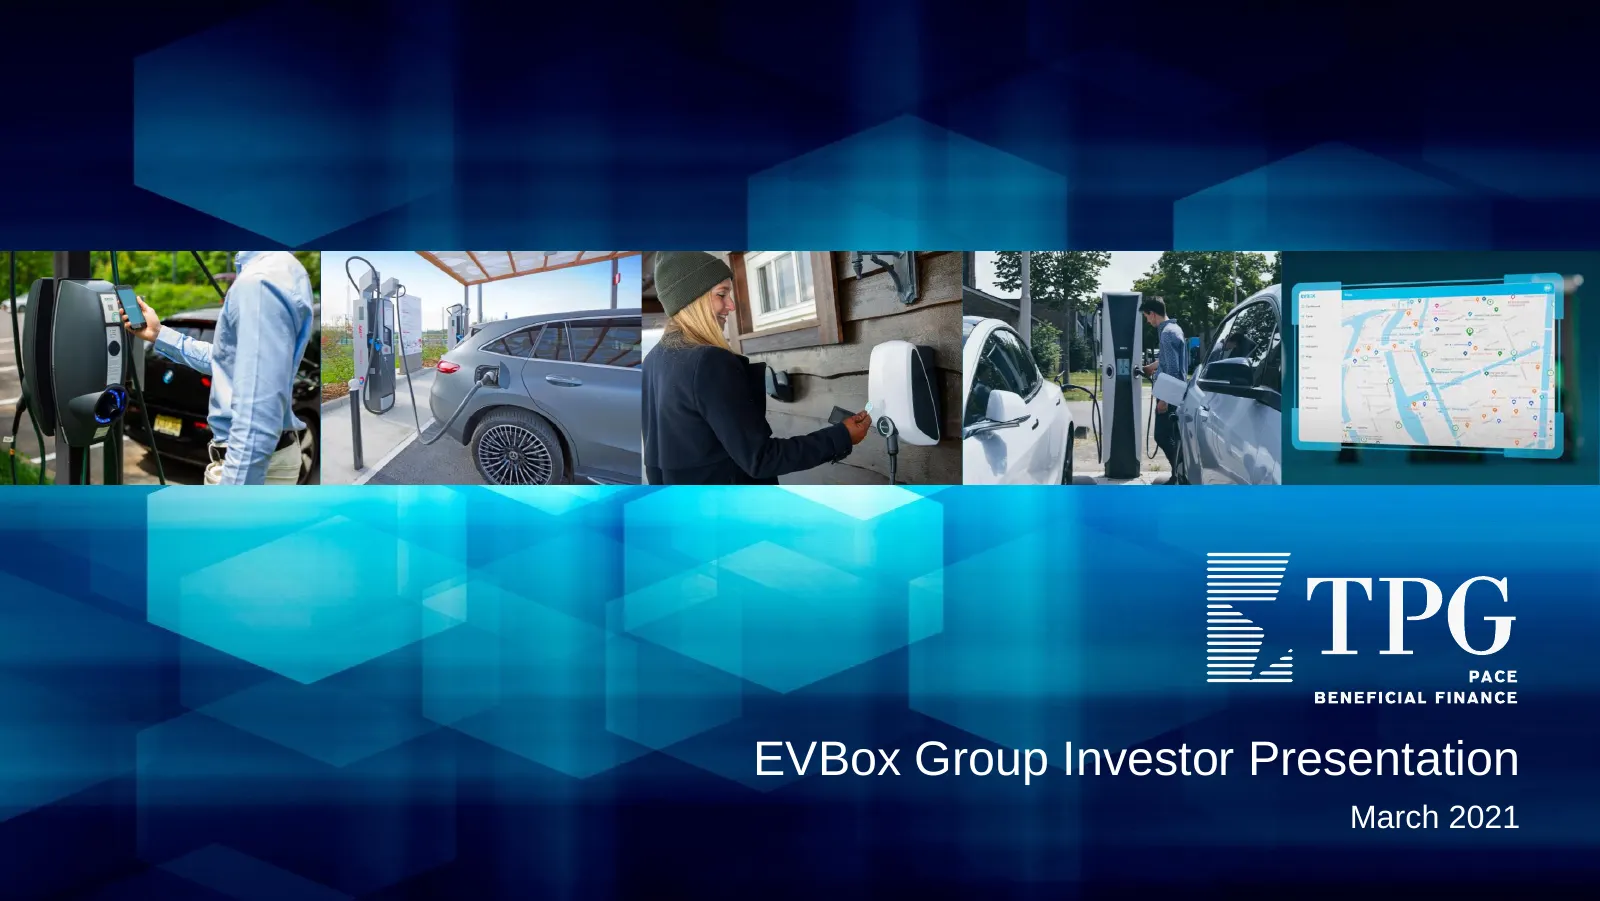
Slide 1: EVBox Group Investor Presentation
EVBox Group Investor Presentation March 2021
Slide 2: Important Information
Important Information Use of Projections This presentation contains financial forecasts prepared by TPG Pace Beneficial Finance Corp. (“TPG Pace”) with respect to certain financial metrics of EV Charged B.V., a Dutch private limited liability company (besloten vennootschap met beperkte aansprakelijk
Slide 3: Important Information (Continued)
Important Information (Continued) Use of Non-GAAP Financial Measures This presentation includes non-GAAP financial measures, including EBITDA and adjusted gross margin. EBITDA is calculated as Revenue less cost of goods sold, and operating expenses. Adjusted gross margin is calculated as gross profi
Slide 4: Important Information (Continued)
Important Information (Continued) Additional Information About the Business Combination and Where to Find It In connection with the proposed business combination, Dutch Holdco has confidentially submitted a draft registration statement on Form F 4 and the related proxy statement/prospectus with the
Slide 5: Transaction Summary
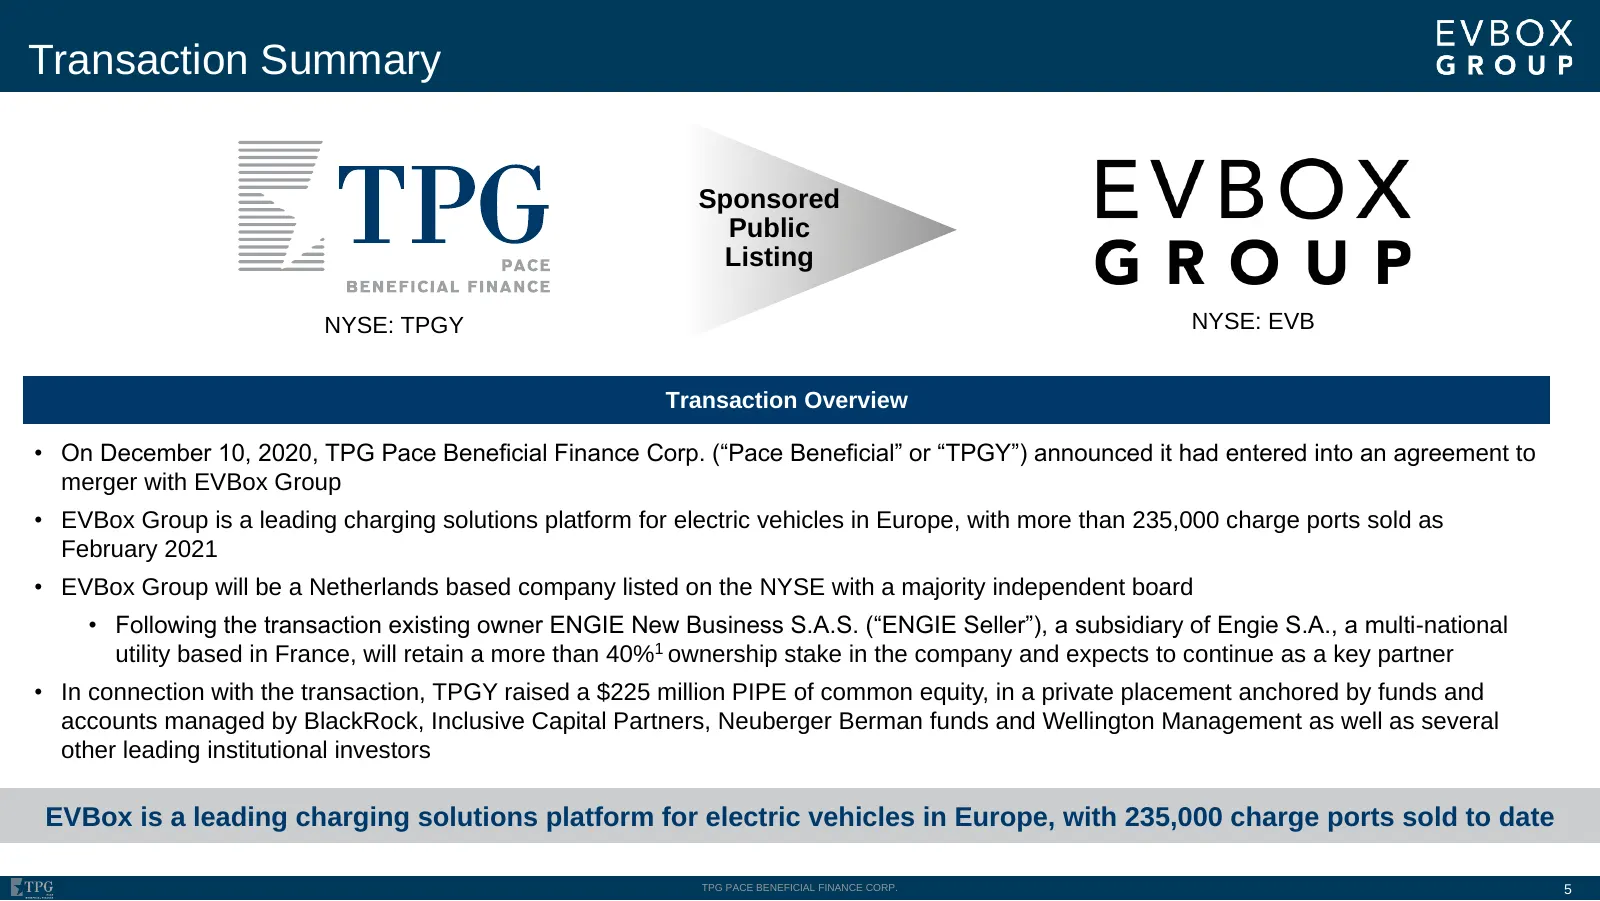
Transaction Summary Sponsored Public Listing NYSE: TPGY NYSE: EVB Transaction Overview • On December 10, 2020, TPG Pace Beneficial Finance Corp. (“Pace Beneficial” or “TPGY”) announced it had entered into an agreement to merger with EVBox Group • EVBox Group is a leading charging solutions platform
Slide 6: Investment Highlights
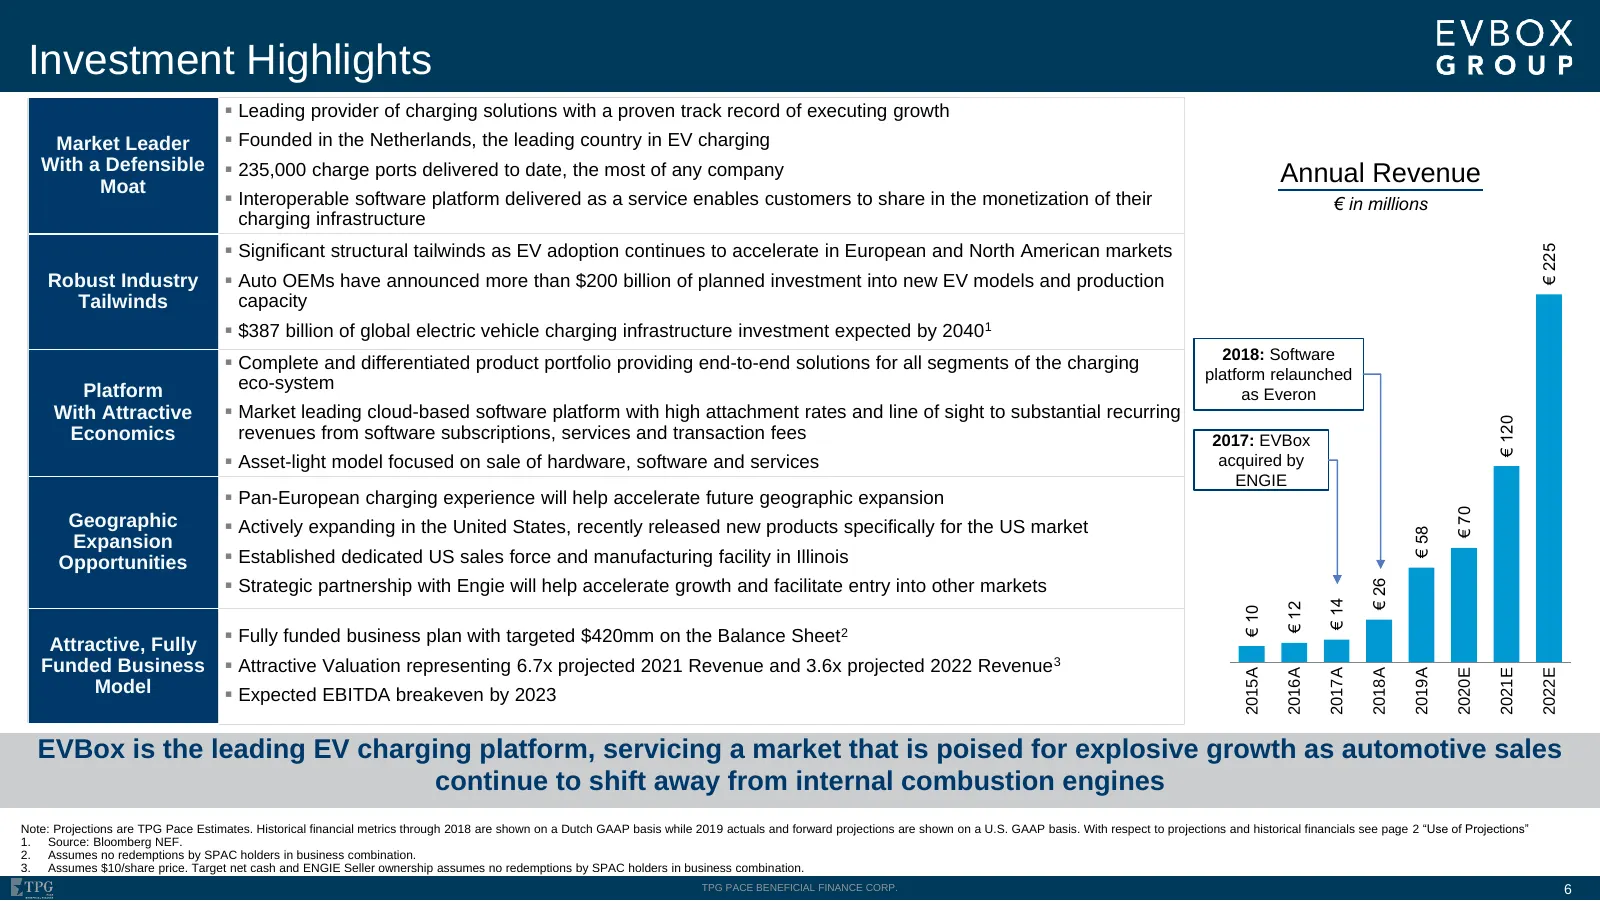
Investment Highlights ▪ Leading provider of charging solutions with a proven track record of executing growth Market Leader ▪ Founded in the Netherlands, the leading country in EV charging With a Defensible ▪ 235,000 charge ports delivered to date, the most of any company Moat Annual Revenue ▪ Inter
Slide 7: Business Combination Update
Business Combination Update • EVBox Group recently completed the re-audit of the 2019 financials on a U.S. GAAP basis (existing 2019 audit was done on a Dutch GAAP basis) • 2019 Revenue was consistent with expectations • 2019 Aggregate Cost of Goods Sold and Operating Expenses were consistent with e
Slide 8: Integrated Charging Platform
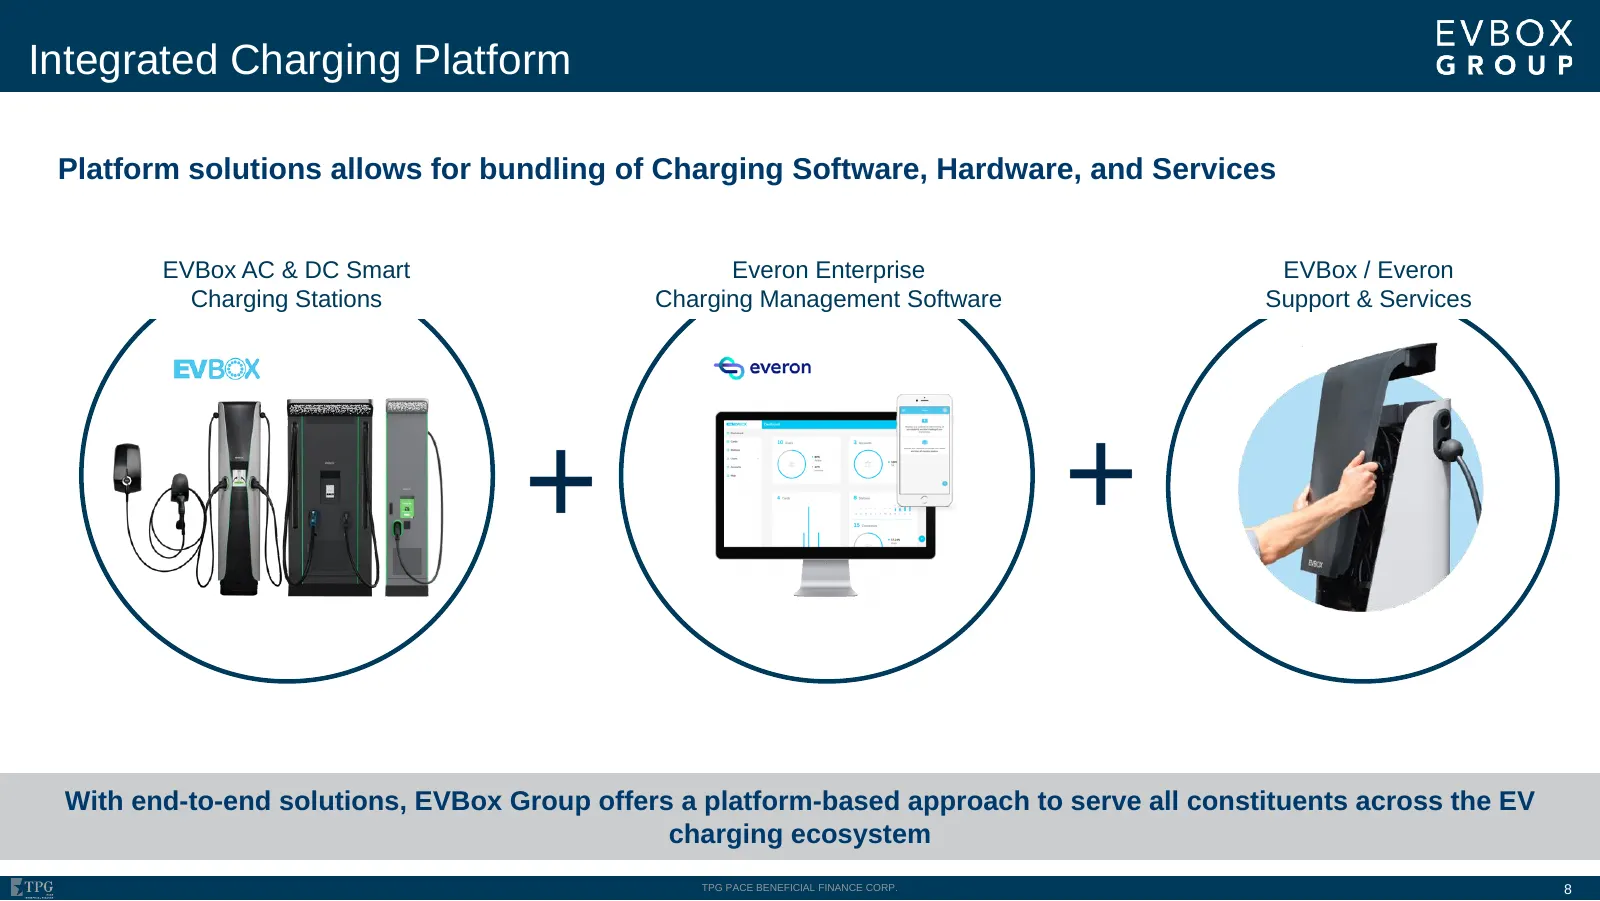
Integrated Charging Platform Platform solutions allows for bundling of Charging Software, Hardware, and Services EVBox AC & DC Smart Everon Enterprise EVBox / Everon Charging Stations Charging Management Software Support & Services With end-to-end solutions, EVBox Group offers a platform-based appro
Slide 9: EVBox Group Products and Solutions
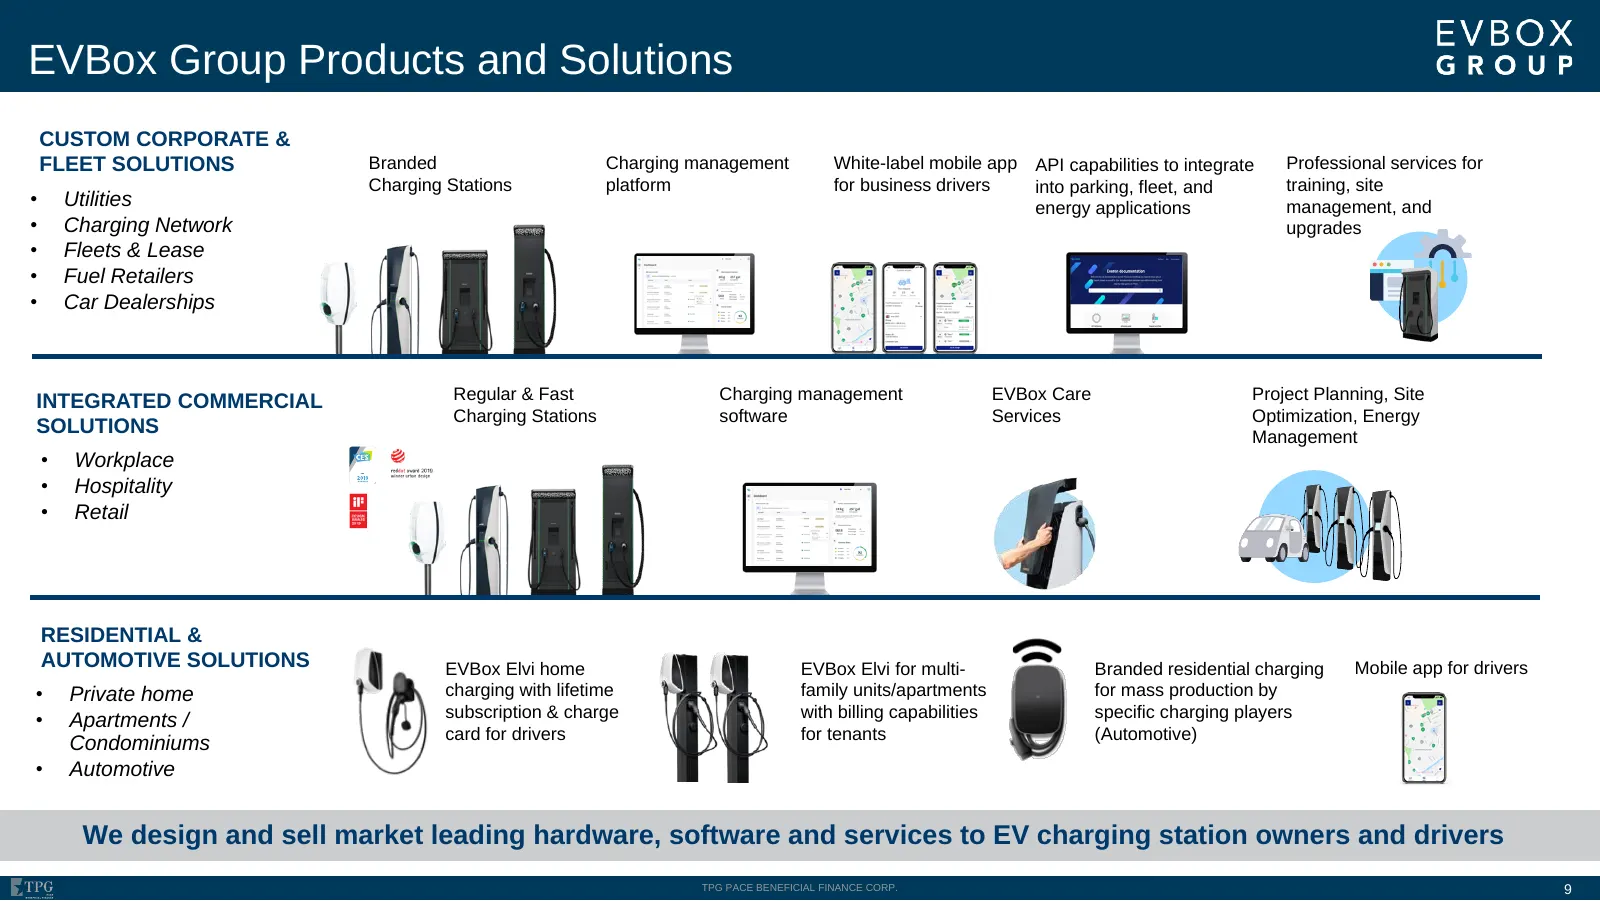
EVBox Group Products and Solutions CUSTOM CORPORATE & FLEET SOLUTIONS Branded Charging management White-label mobile app API capabilities to integrate Professional services for Charging Stations platform for business drivers into parking, fleet, and training, site • Utilities energy applications man
Slide 10: Diversified Customer Base
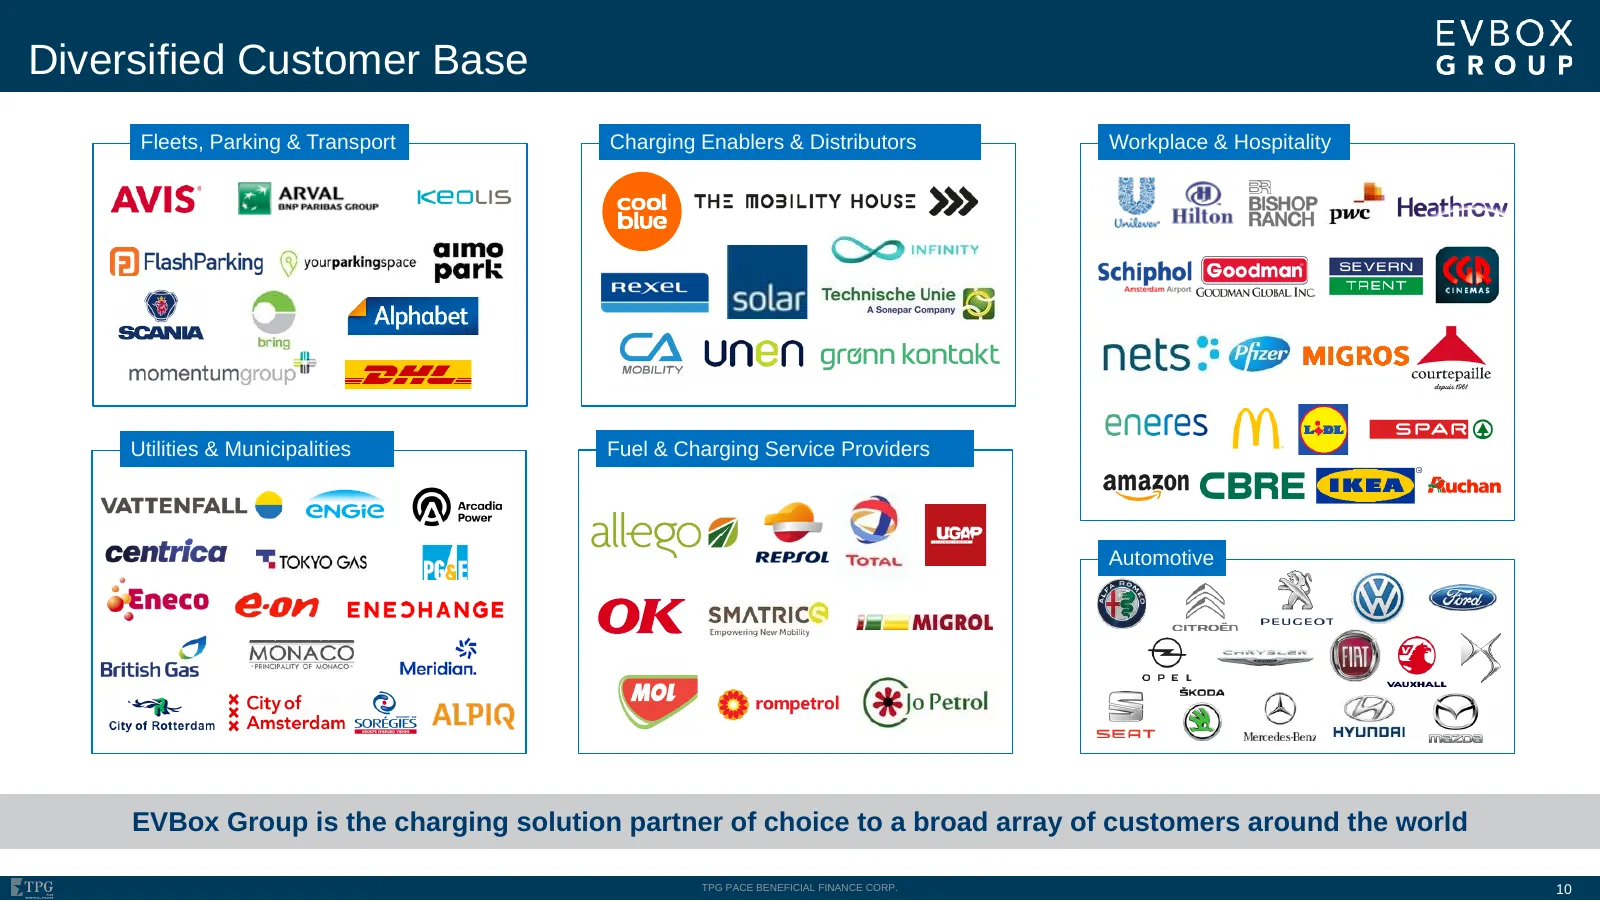
Diversified Customer Base Fleets, Parking & Transport Charging Enablers & Distributors Workplace & Hospitality Utilities & Municipalities Fuel & Charging Service Providers Automotive EVBox Group is the charging solution partner of choice to a broad array of customers around the world TPG PACE BENEFI
Slide 11: Platform Model Drives Substantial Recurring Revenue
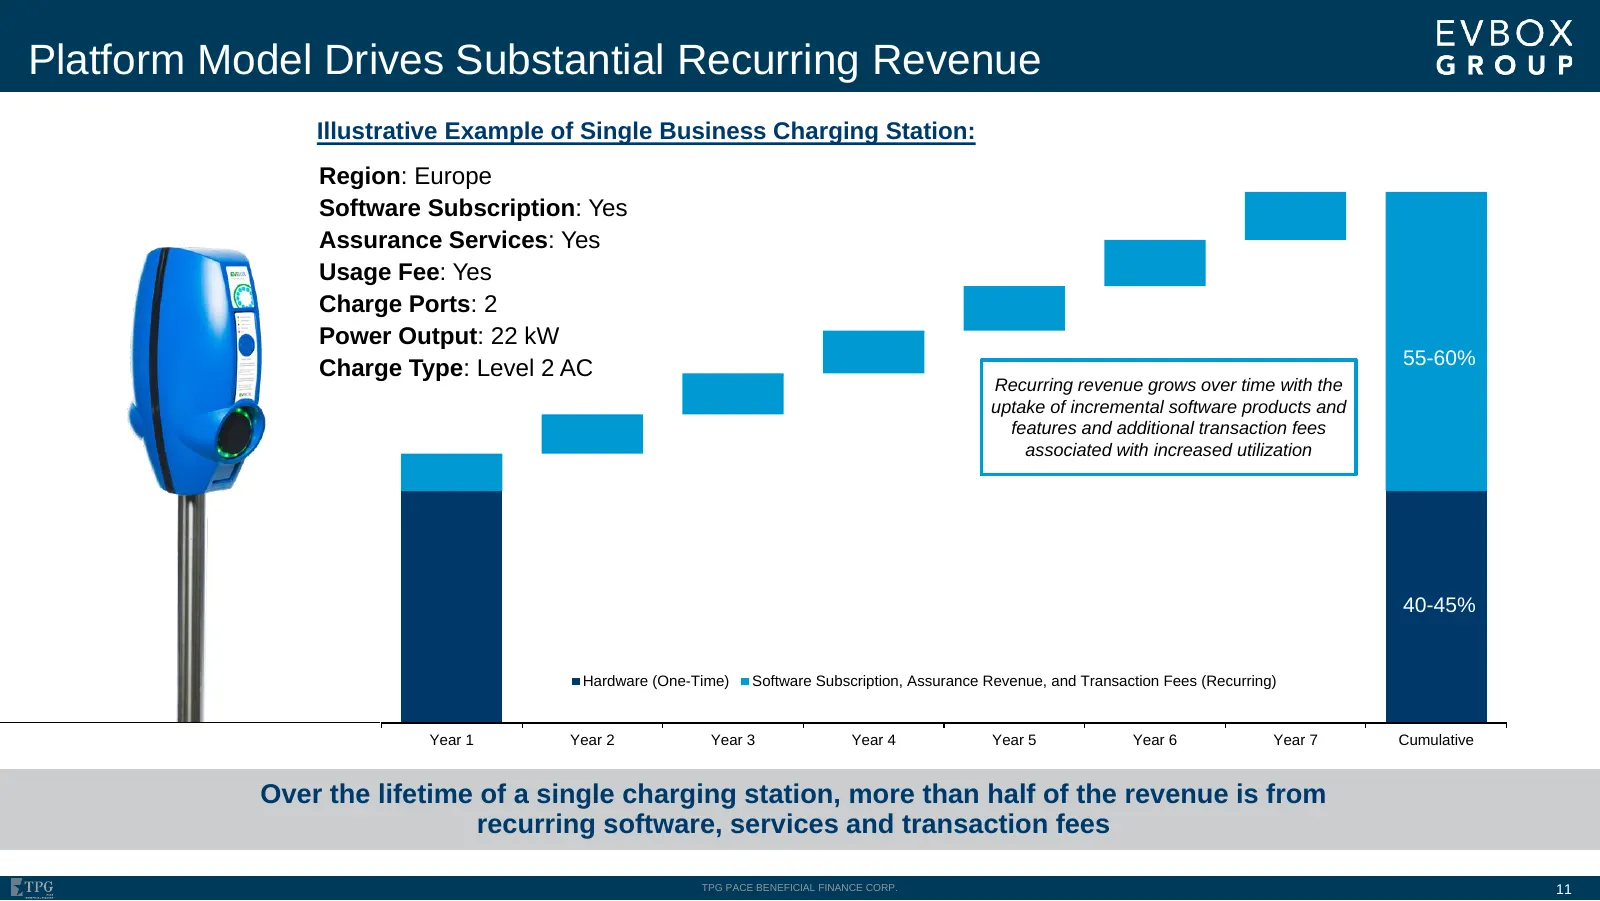
Platform Model Drives Substantial Recurring Revenue Illustrative Example of Single Business Charging Station: Region: Europe Software Subscription: Yes Assurance Services: Yes Usage Fee: Yes Charge Ports: 2 Power Output: 22 kW 55-60% Charge Type: Level 2 AC Recurring revenue grows over time with the
Slide 12: European Policy Tailwinds
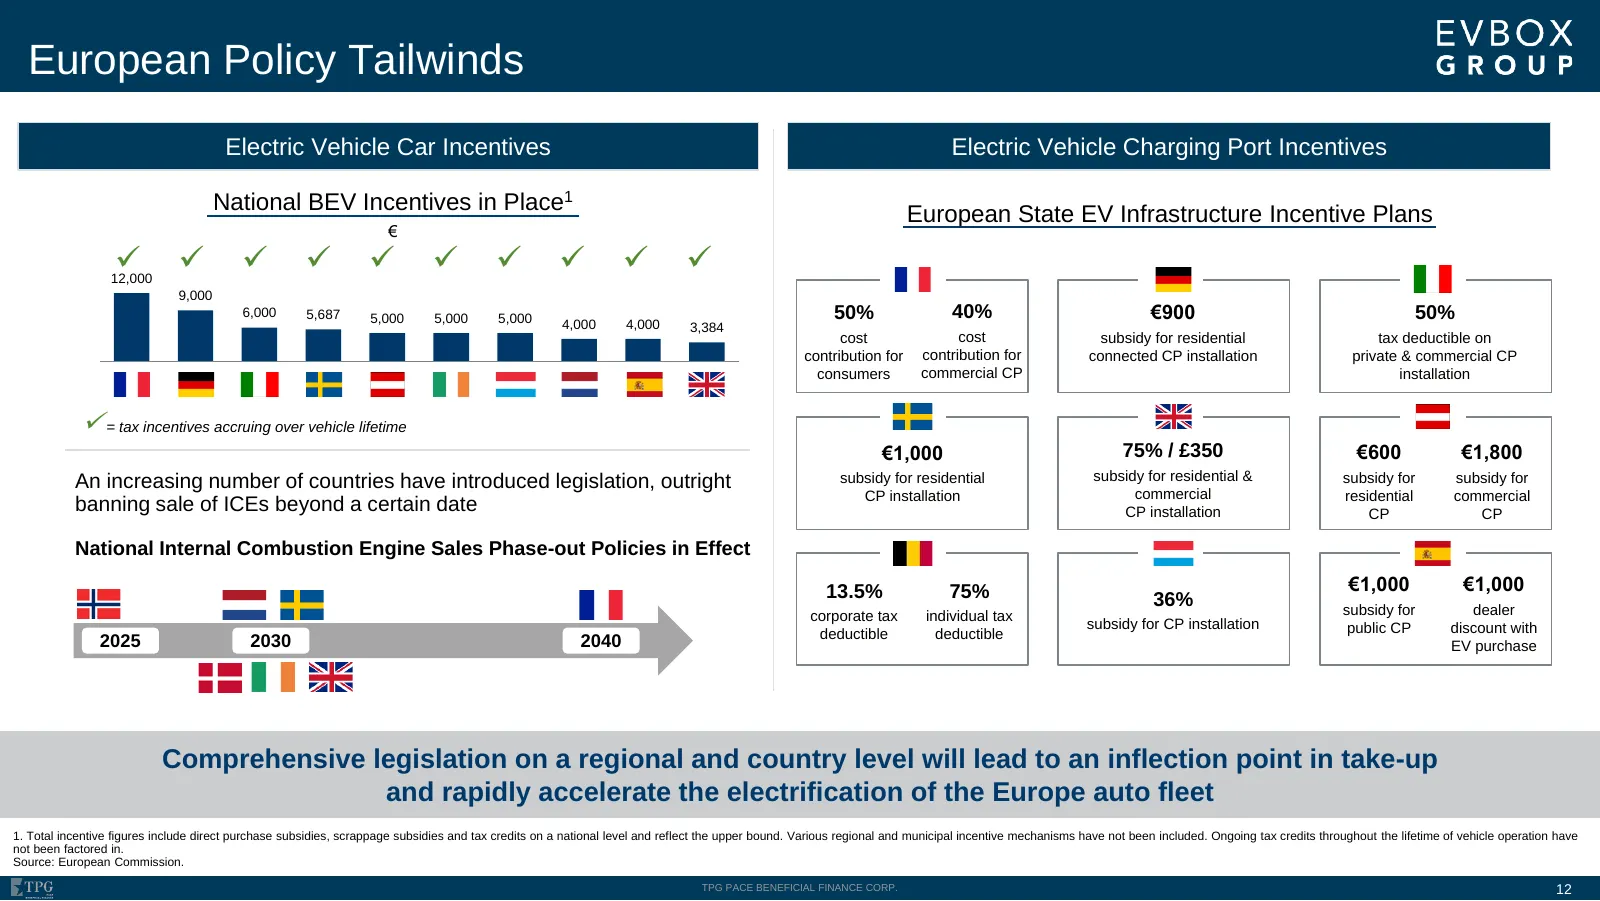
European Policy Tailwinds Electric Vehicle Car Incentives Electric Vehicle Charging Port Incentives National BEV Incentives in Place1 European State EV Infrastructure Incentive Plans € ✓ 12,000 ✓ ✓ ✓ ✓ ✓ ✓ ✓ ✓ ✓ 9,000 6,000 5,687 5,000 5,000 5,000 4,000 4,000 50% 40% €900 50% 3,384 cost cost subsidy
Slide 13: EVBox's European Leadership Position Enables Global Expansion
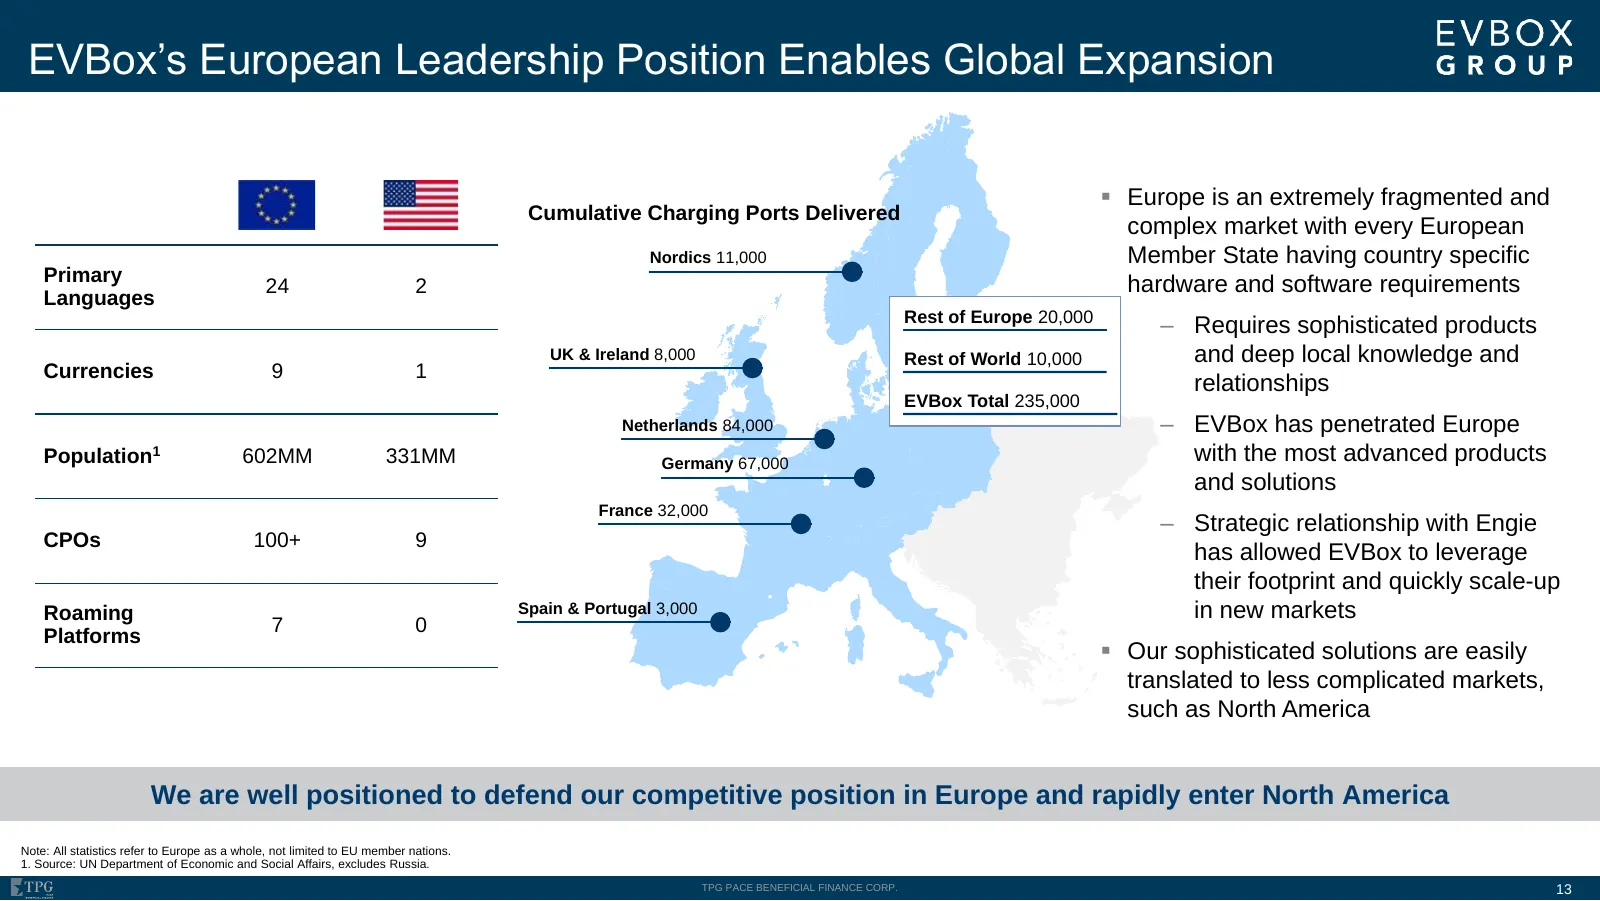
EVBox’s European Leadership Position Enables Global Expansion ▪ Europe is an extremely fragmented and Cumulative Charging Ports Delivered complex market with every European Nordics 11,000 Member State having country specific Primary hardware and software requirements 24 2 Languages Rest of Europe 20
Slide 14: Europe is Now the Largest and Fastest Growing EV Market
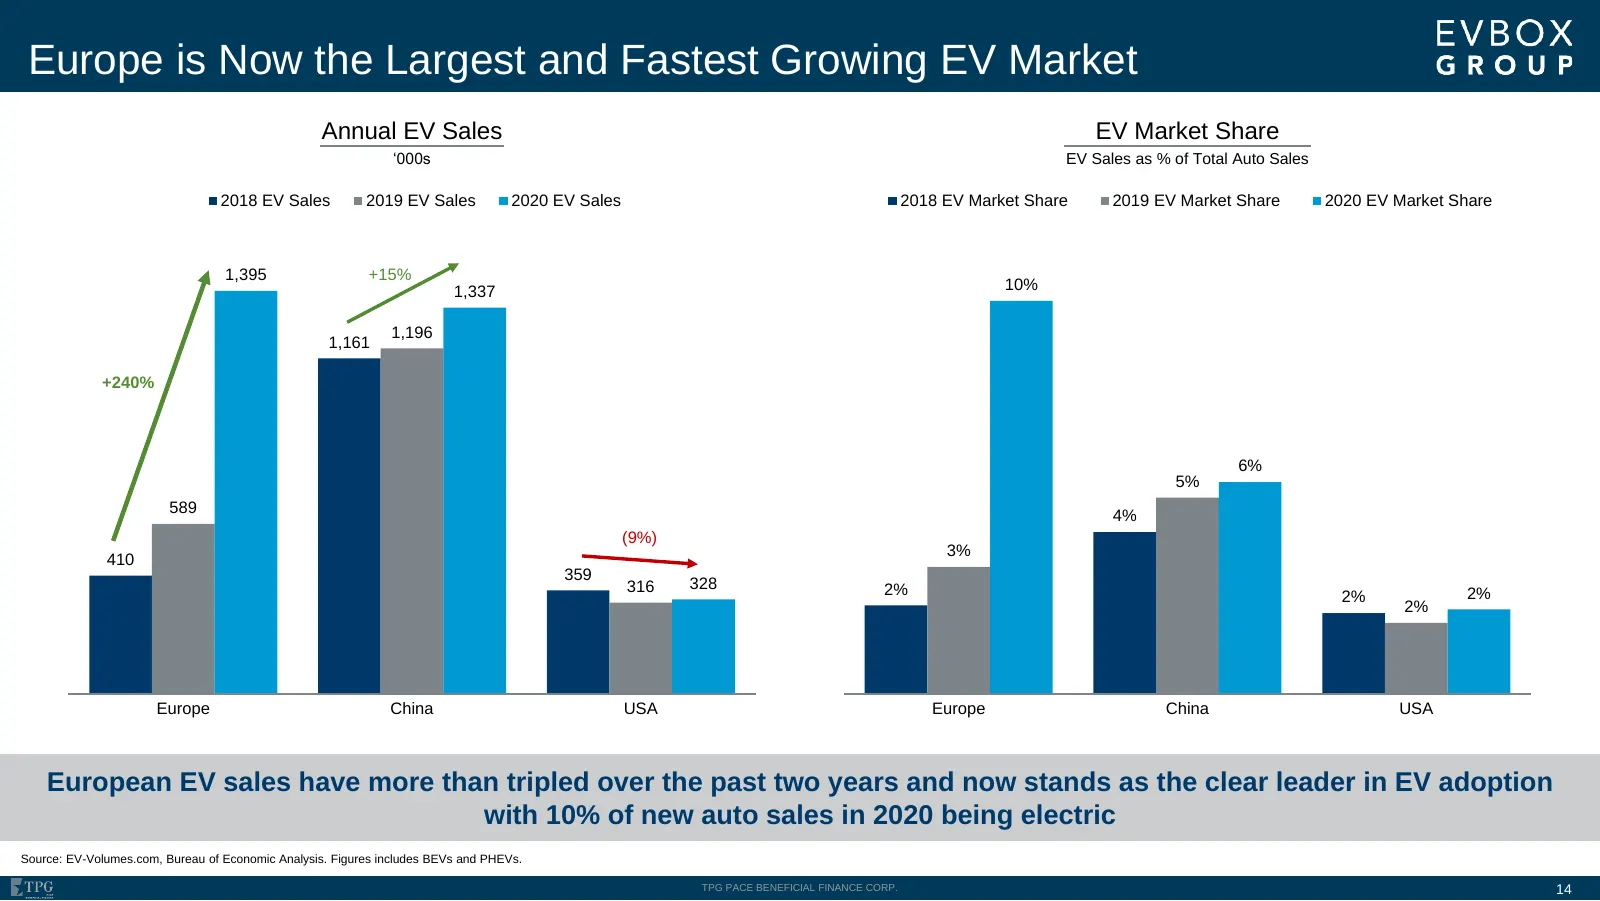
Europe is Now the Largest and Fastest Growing EV Market Annual EV Sales EV Market Share ‘000s EV Sales as % of Total Auto Sales 2018 EV Sales 2019 EV Sales 2020 EV Sales 2018 EV Market Share 2019 EV Market Share 2020 EV Market Share 1,395 +15% 1,337 10% 1,196 1,161 +240% 6% 5% 589 4% (9%) 3% 410 359
Slide 15: Evolution of EV Charging Solutions – Illustrative Hospitality Case Study
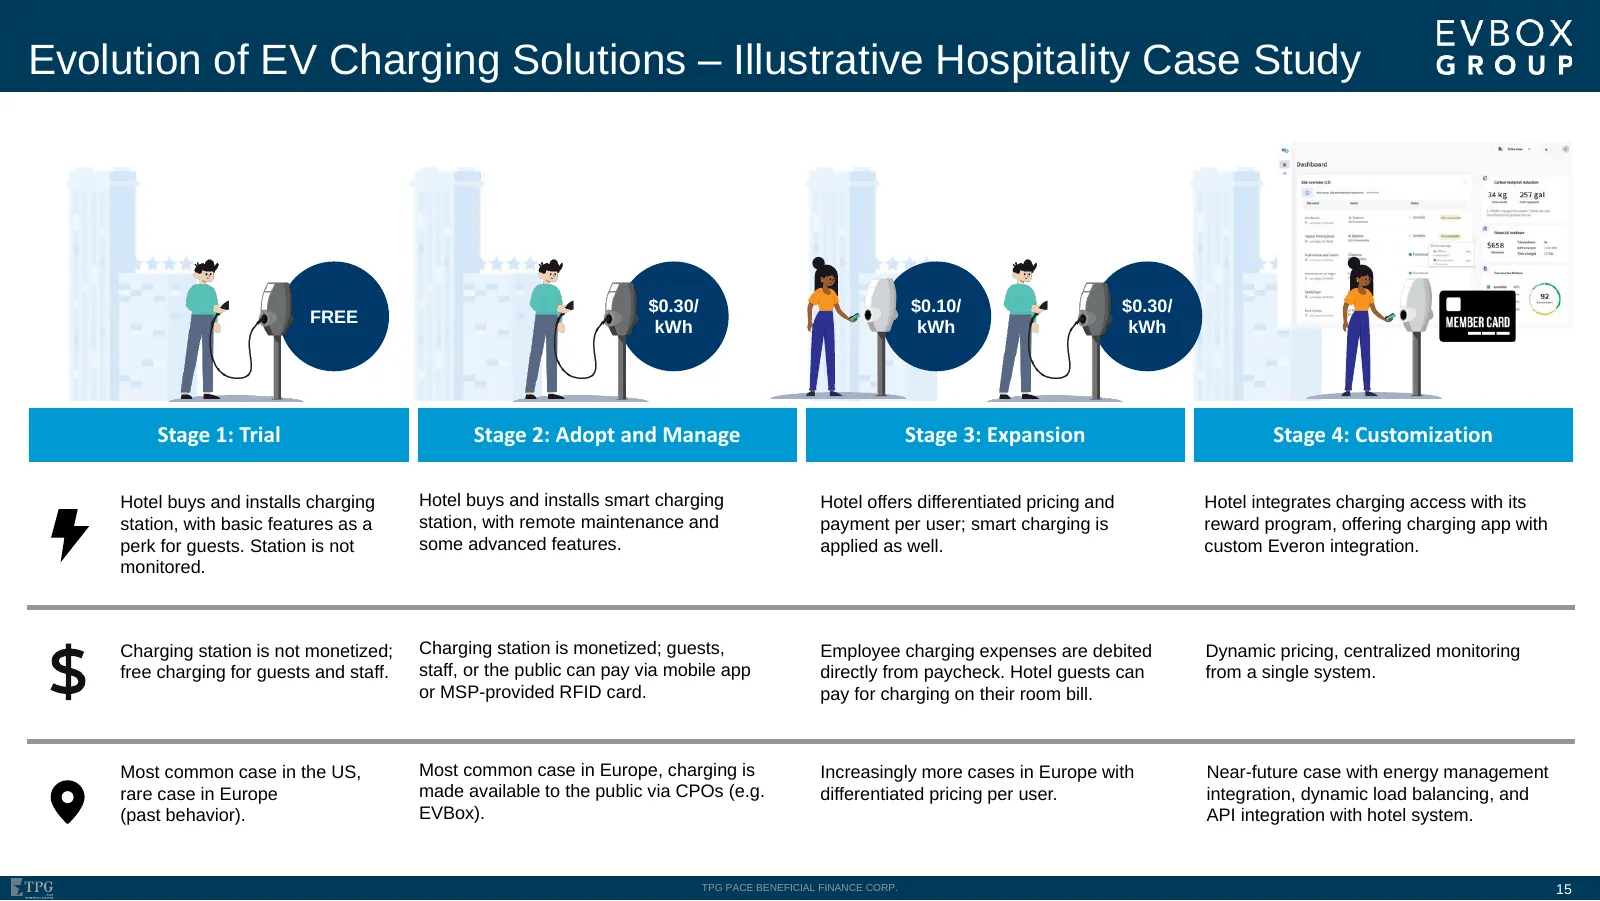
Evolution of EV Charging Solutions – Illustrative Hospitality Case Study $0.30/ $0.10/ $0.30/ FREE kWh kWh kWh Stage 1: Trial Stage 2: Adopt and Manage Stage 3: Expansion Stage 4: Customization Hotel buys and installs charging Hotel buys and installs smart charging Hotel offers differentiated pricin
Slide 16: EVBox Smart Charging Stations
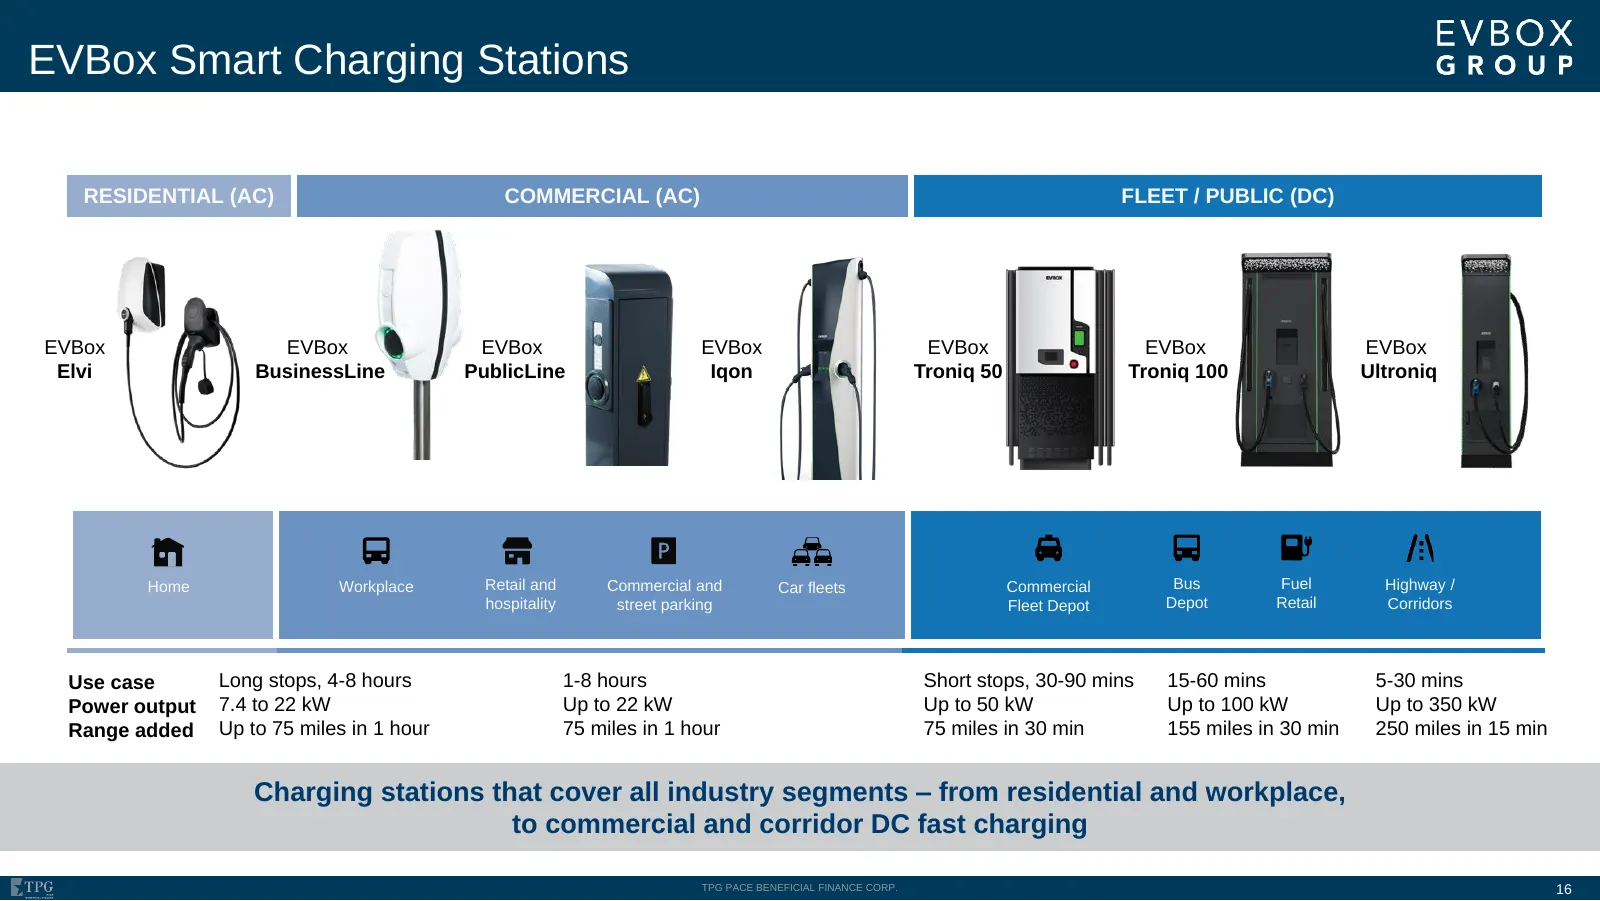
EVBox Smart Charging Stations RESIDENTIAL (AC) COMMERCIAL (AC) FLEET / PUBLIC (DC) EVBox EVBox EVBox EVBox EVBox EVBox EVBox Elvi BusinessLine PublicLine Iqon Troniq 50 Troniq 100 Ultroniq Home Workplace Retail and Commercial and Car fleets Commercial Bus Fuel Highway / hospitality street parking Fl
Slide 17: EVBox Embedded Software Technology
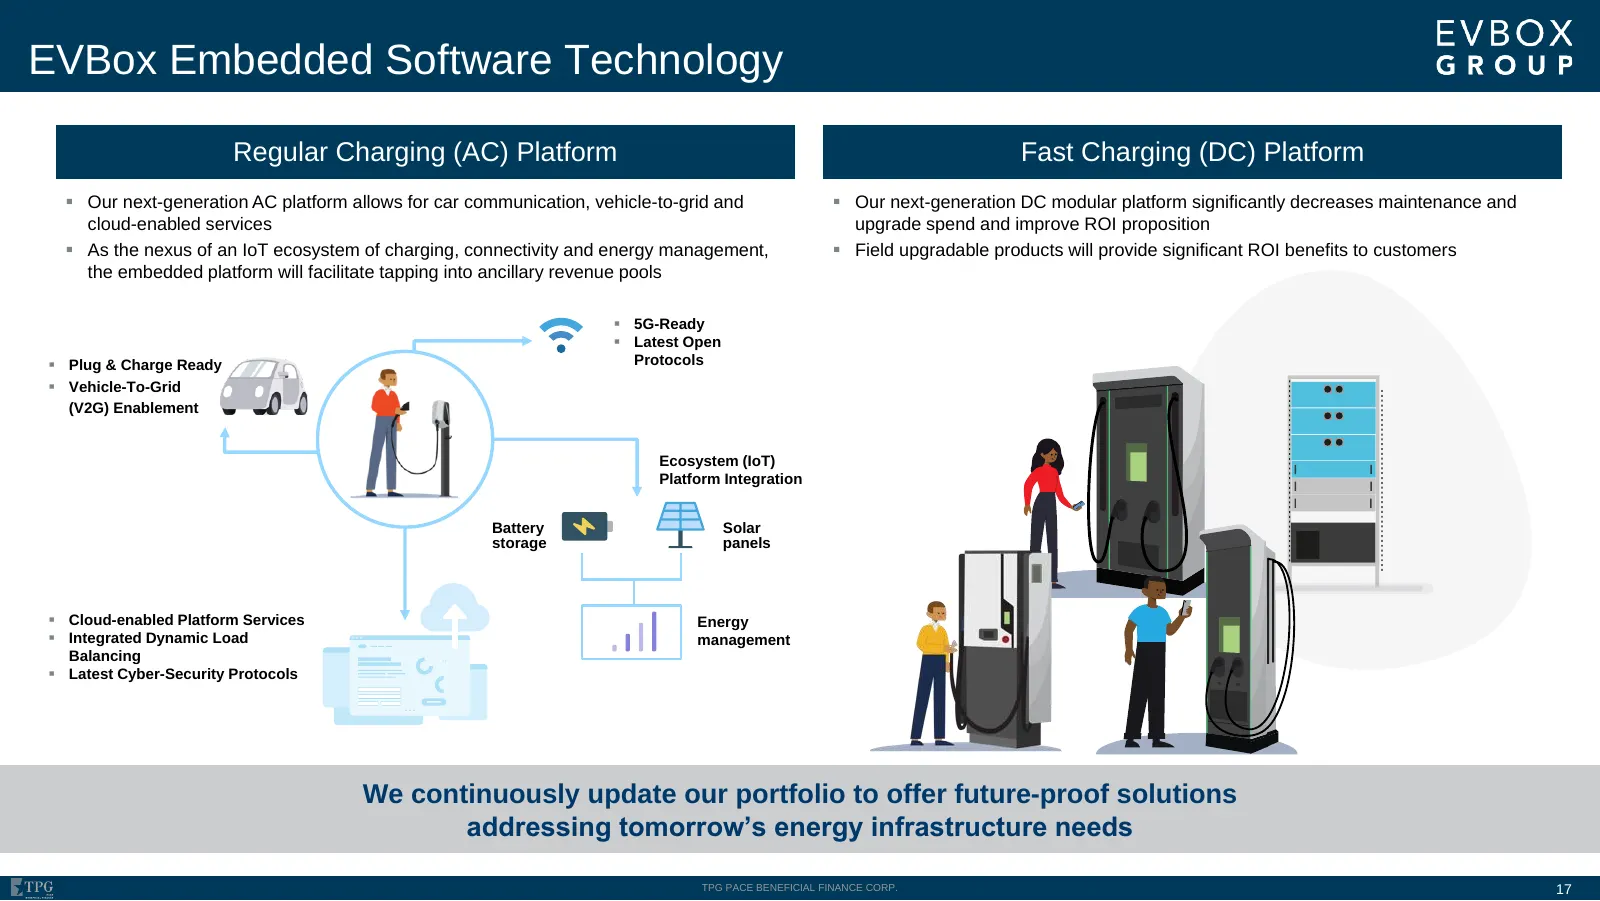
EVBox Embedded Software Technology Regular Charging (AC) Platform Fast Charging (DC) Platform ▪ Our next-generation AC platform allows for car communication, vehicle-to-grid and ▪ Our next-generation DC modular platform significantly decreases maintenance and cloud-enabled services upgrade spend and
Slide 18: Everon Platform Approach
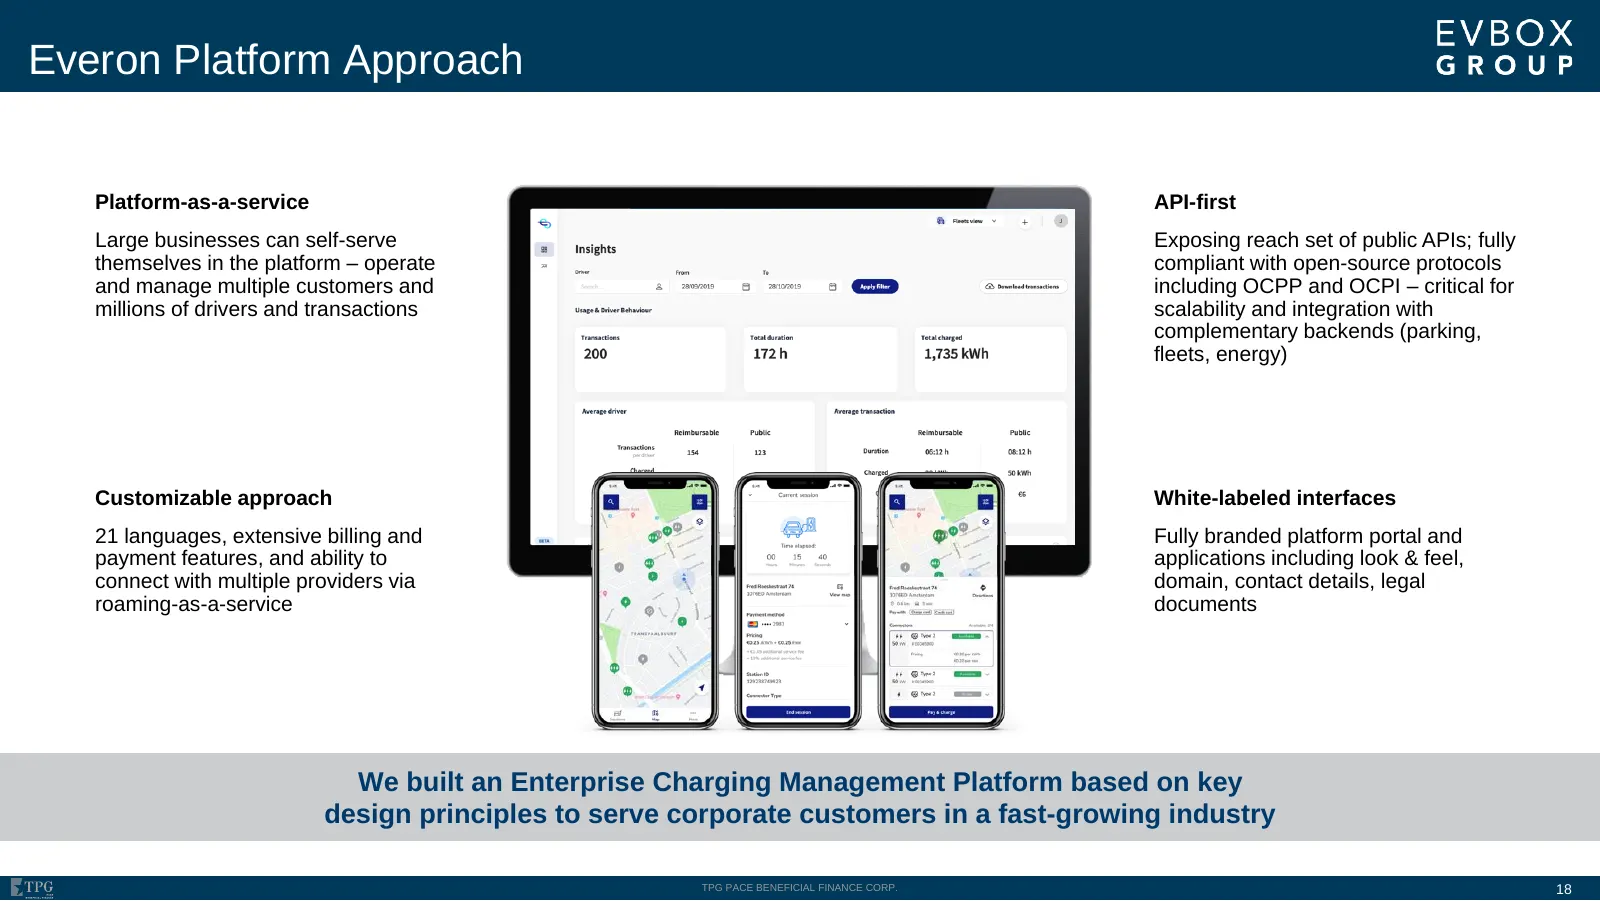
Everon Platform Approach Platform-as-a-service API-first Large businesses can self-serve Exposing reach set of public APIs; fully themselves in the platform – operate compliant with open-source protocols and manage multiple customers and including OCPP and OCPI – critical for millions of drivers and
Slide 19: Exponential Shipment Growth
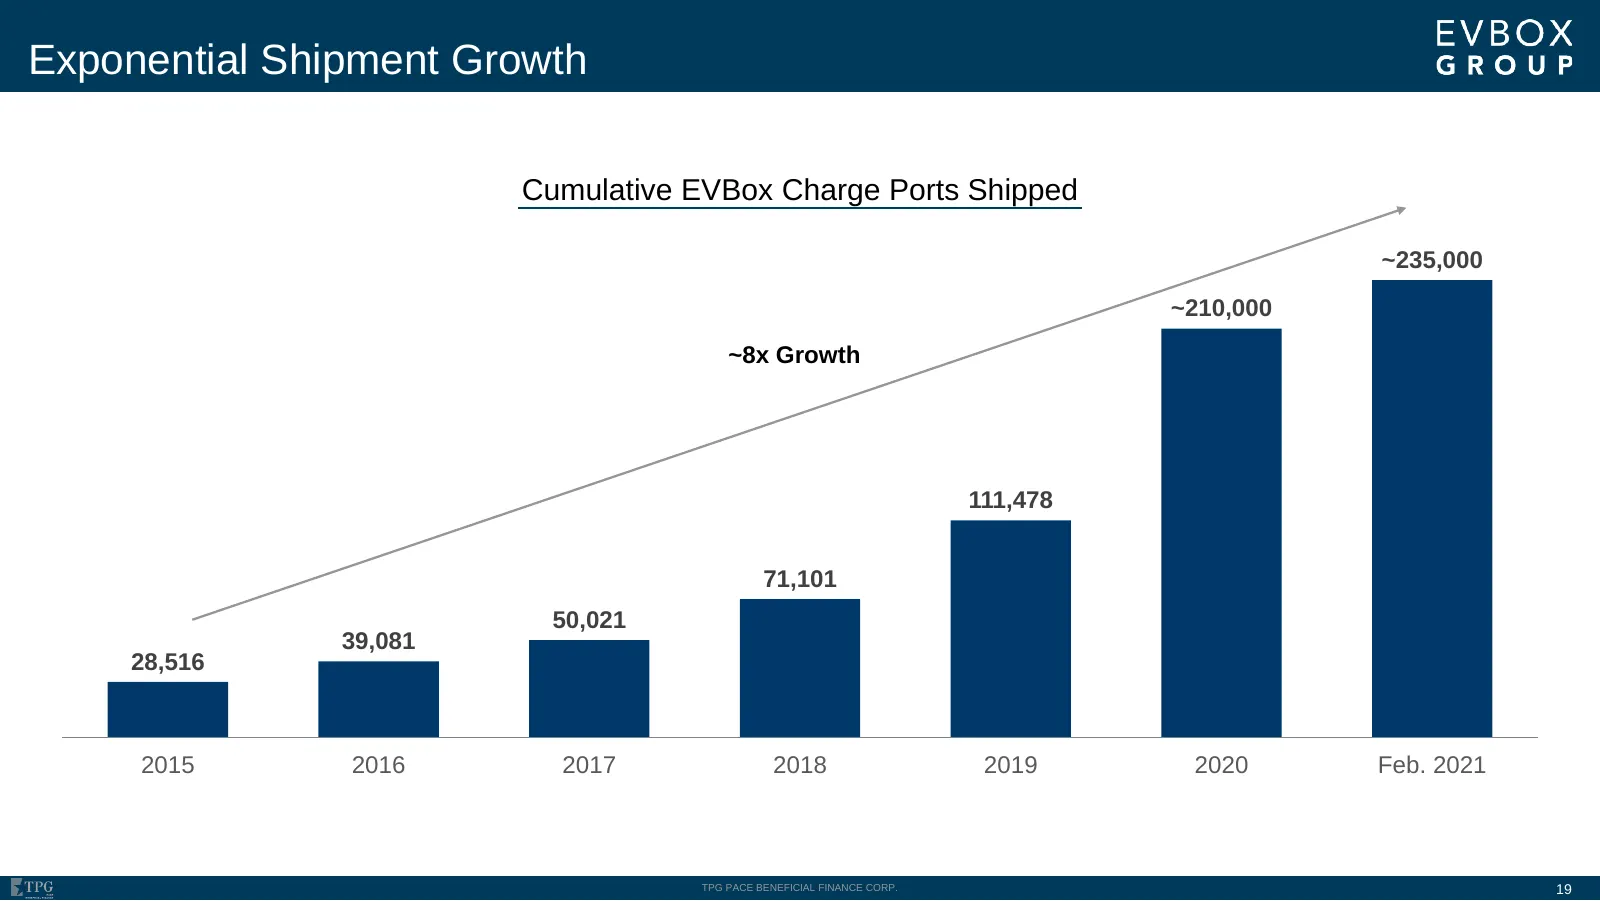
Exponential Shipment Growth Cumulative EVBox Charge Ports Shipped ~235,000 ~210,000 ~8x Growth 111,478 71,101 50,021 39,081 28,516 2015 2016 2017 2018 2019 2020 Feb. 2021 TPG PACE BENEFICIAL FINANCE CORP. 19
Slide 20: Potential for Robust Growth as Revenue Diversifies
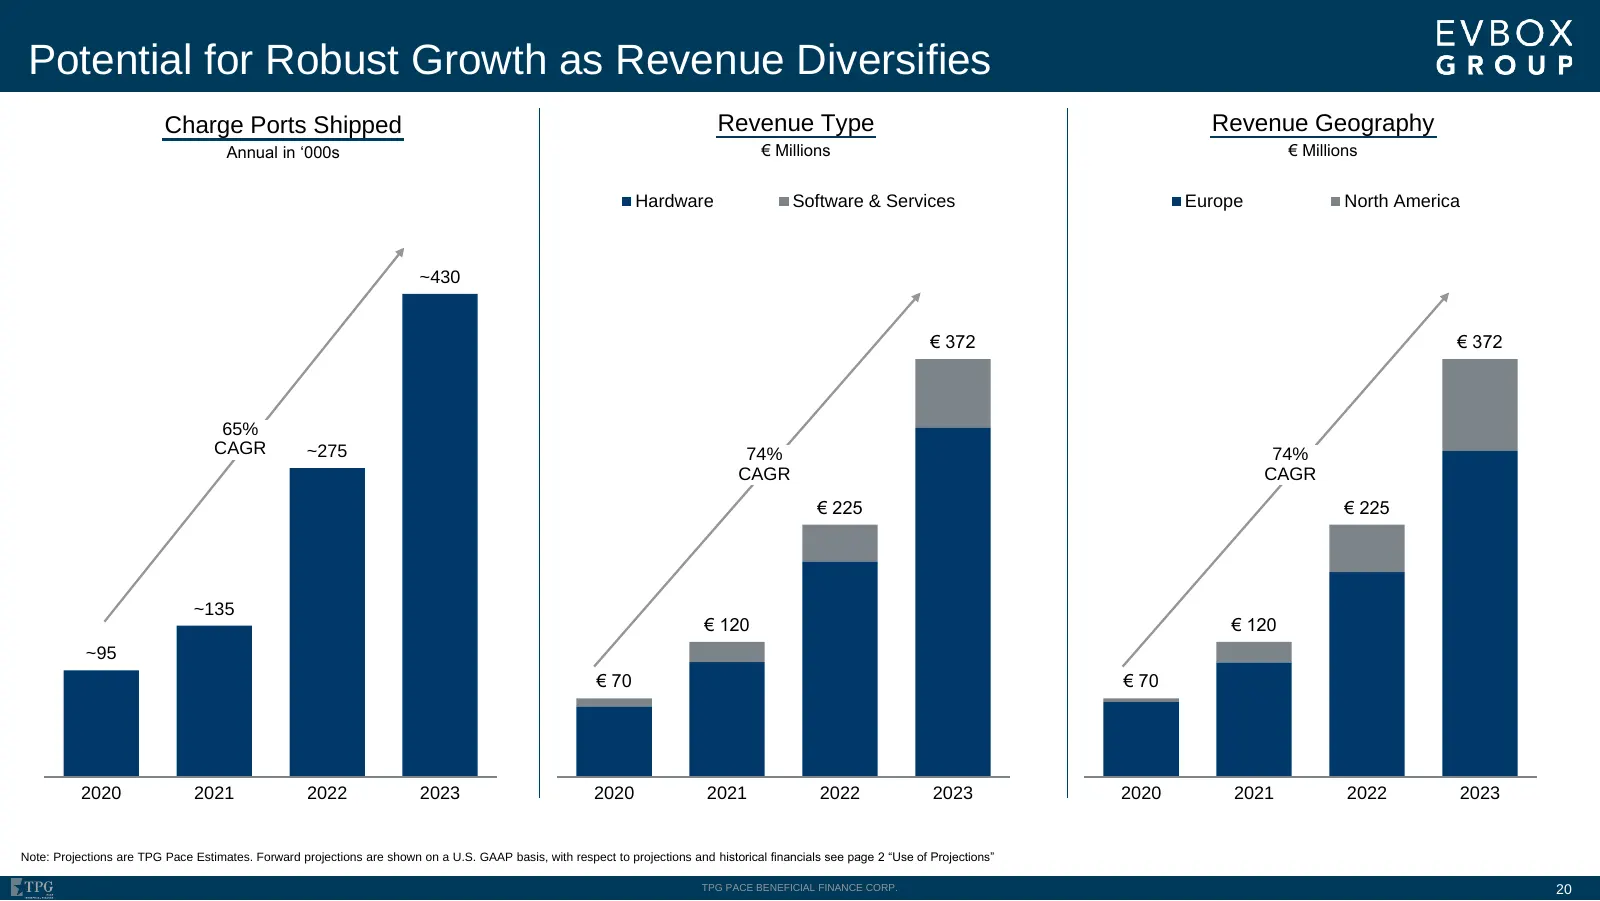
Potential for Robust Growth as Revenue Diversifies Charge Ports Shipped Revenue Type Revenue Geography Annual in ‘000s € Millions € Millions Hardware Software & Services Europe North America ~430 € 372 € 372 65% CAGR ~275 74% 74% CAGR CAGR € 225 € 225 ~135 € 120 € 120 ~95 € 70 € 70 2020 2021 2022 20
Slide 21: Consolidated Financial Projections
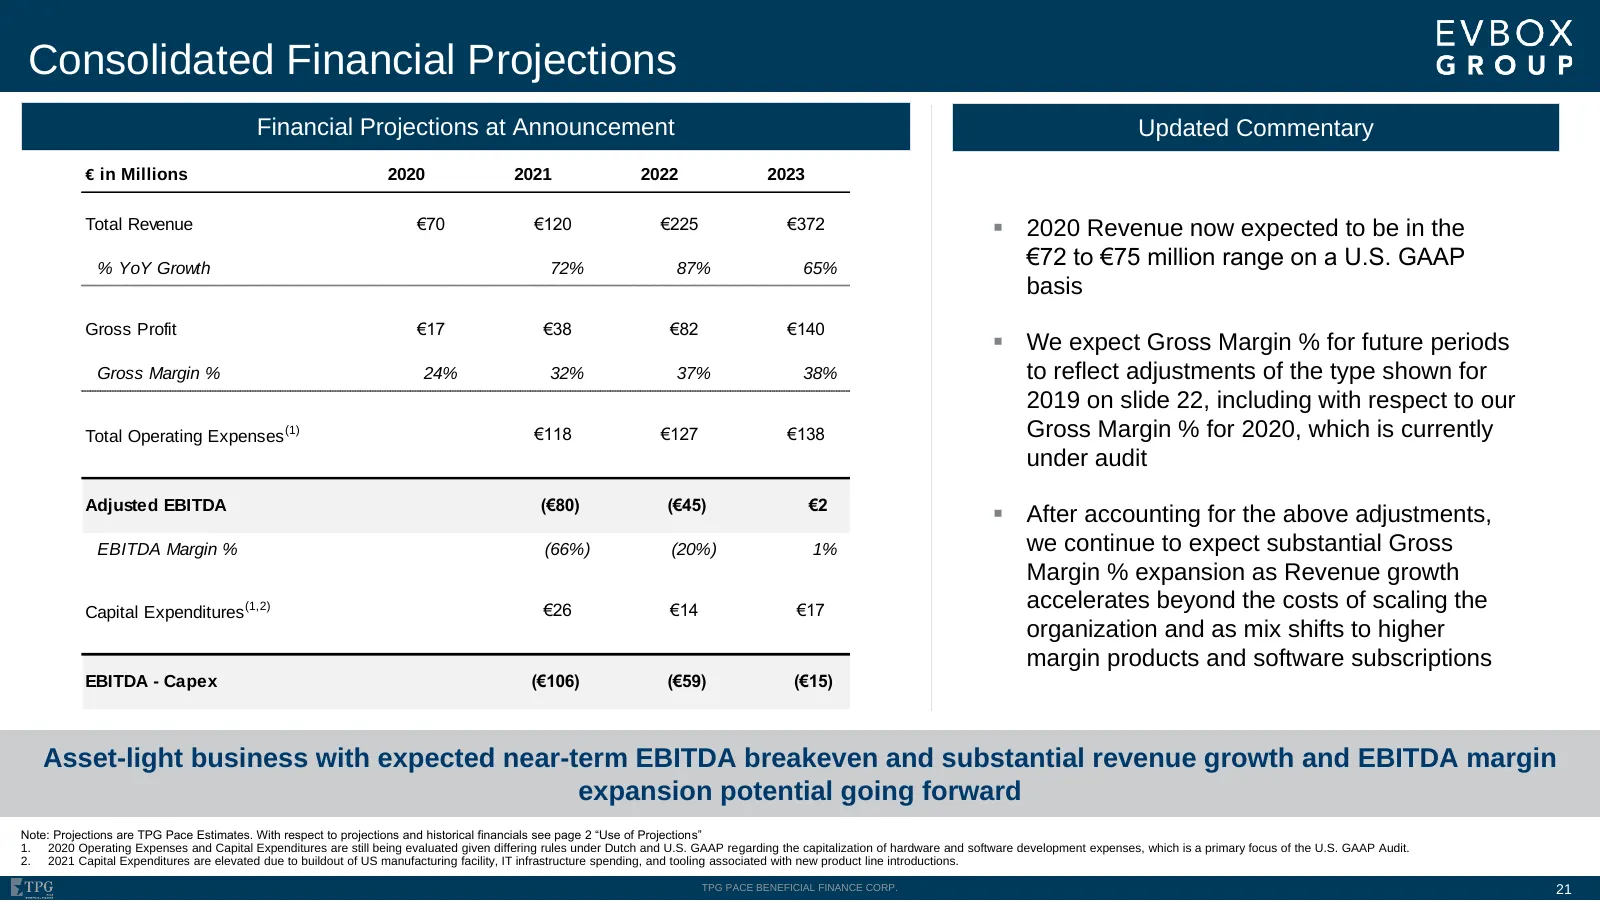
Consolidated Financial Projections Financial Projections at Announcement Updated Commentary € in Millions 2020 2021 2022 2023 Total Revenue €70 €120 €225 €372 ▪ 2020 Revenue now expected to be in the % YoY Growth 72% 87% 65% €72 to €75 million range on a U.S. GAAP basis Gross Profit €17 €38 €82 €140
Slide 22: 2019 Gross Margin Reconciliation
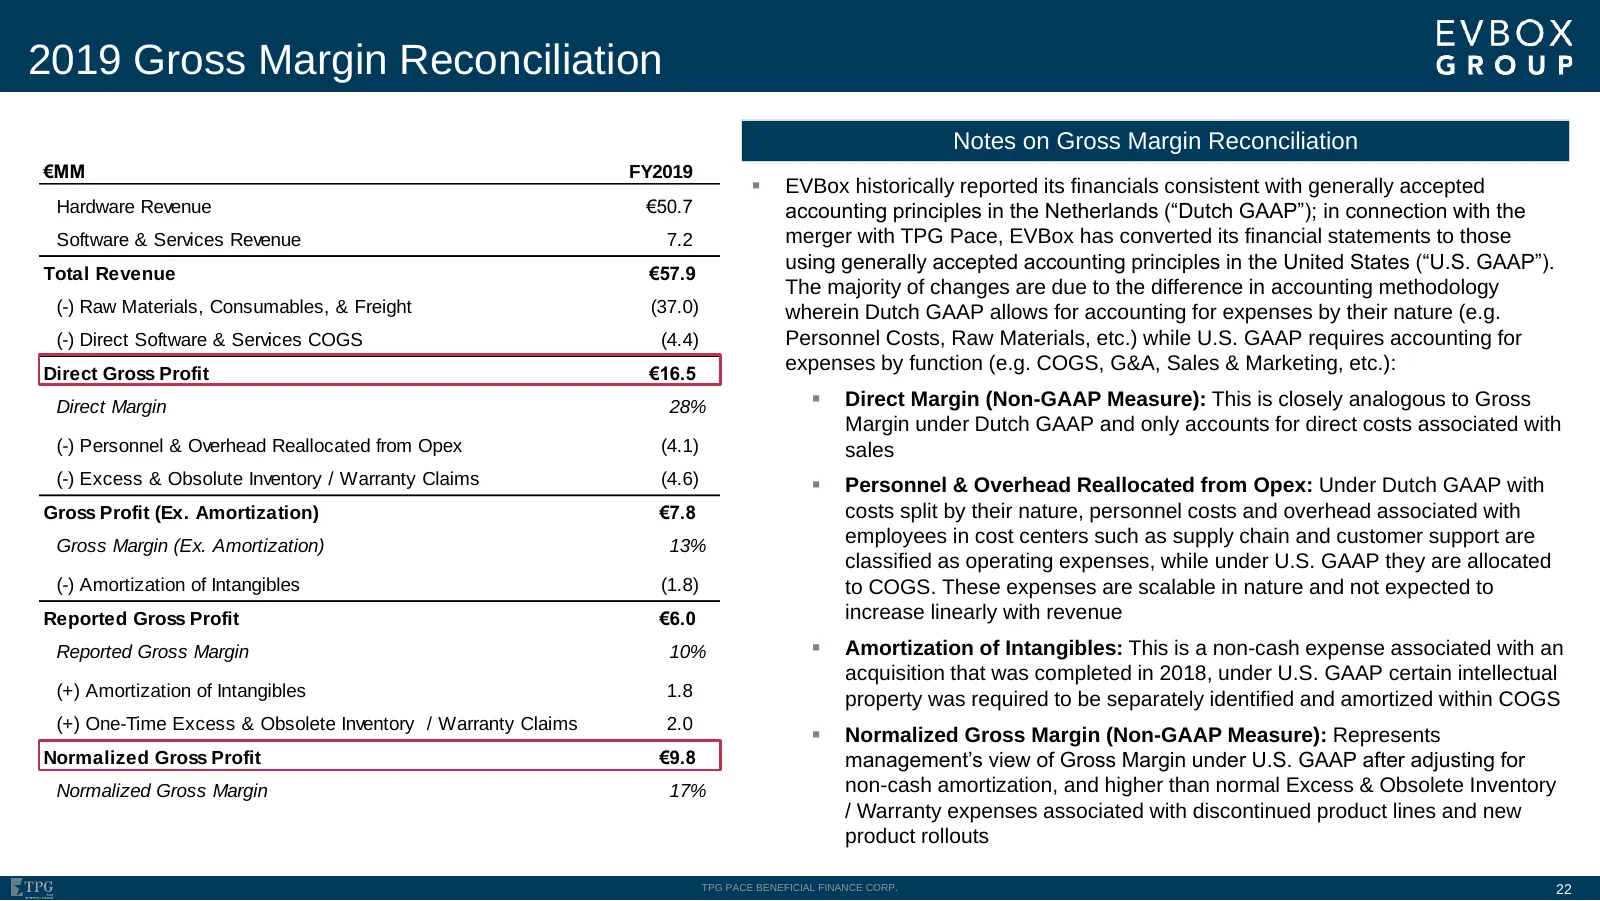
2019 Gross Margin Reconciliation Notes on Gross Margin Reconciliation €MM FY2019 ▪ EVBox historically reported its financials consistent with generally accepted Hardware Revenue €50.7 accounting principles in the Netherlands (“Dutch GAAP”); in connection with the Software & Services Revenue 7.2 merg
Slide 23: Sources & Uses / Pro-Forma Valuation
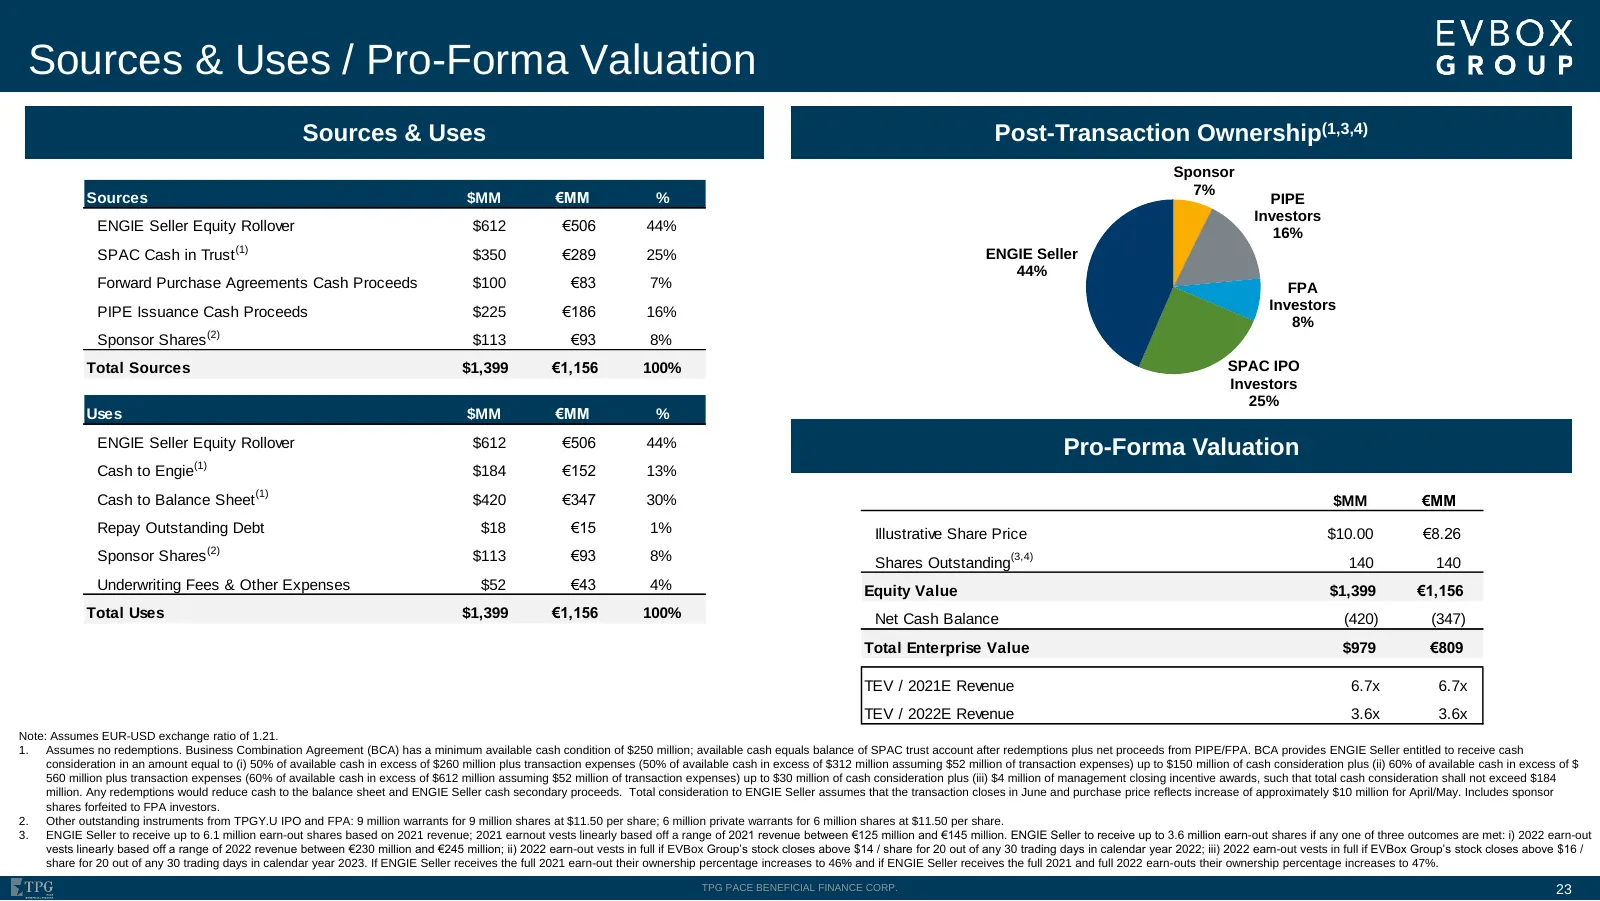
Sources & Uses / Pro-Forma Valuation Sources & Uses Post-Transaction Ownership(1,3,4) Sponsor 7% Sources $MM €MM % PIPE Investors ENGIE Seller Equity Rollover $612 €506 44% 16% (1) SPAC Cash in Trust $350 €289 25% ENGIE Seller 44% Forward Purchase Agreements Cash Proceeds $100 €83 7% FPA PIPE Issuan
Slide 24: Defining EVBox's Comparables
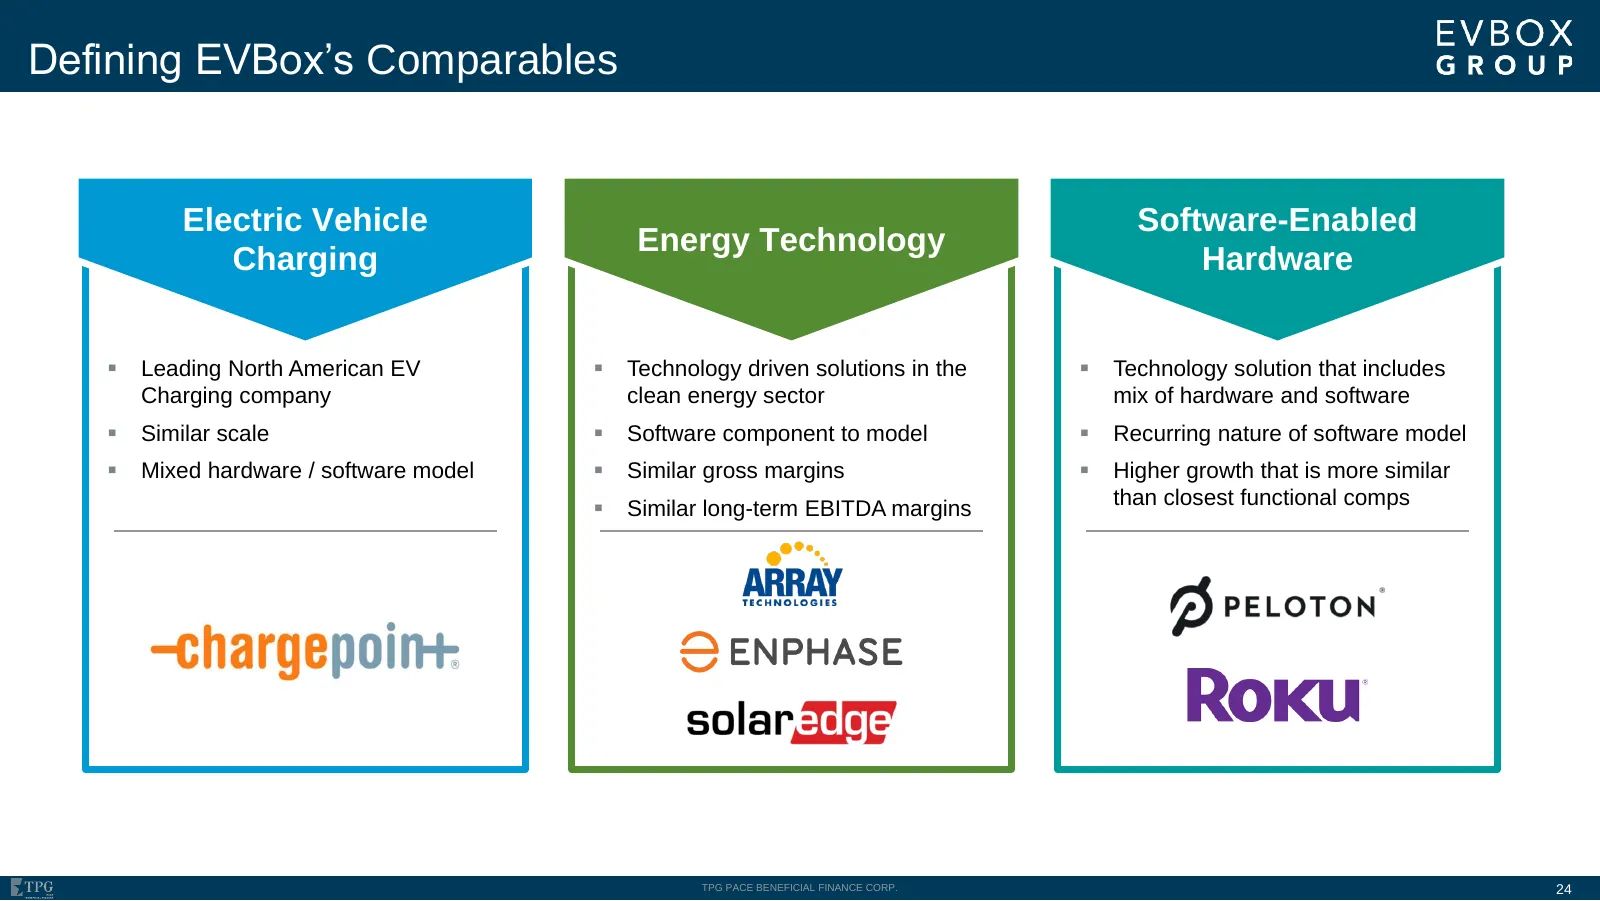
Defining EVBox’s Comparables Electric Vehicle Software-Enabled Energy Technology Charging Hardware ▪ Leading North American EV ▪ Technology driven solutions in the ▪ Technology solution that includes Charging company clean energy sector mix of hardware and software ▪ Similar scale ▪ Software compone
Slide 25: EVBox Investment Opportunity
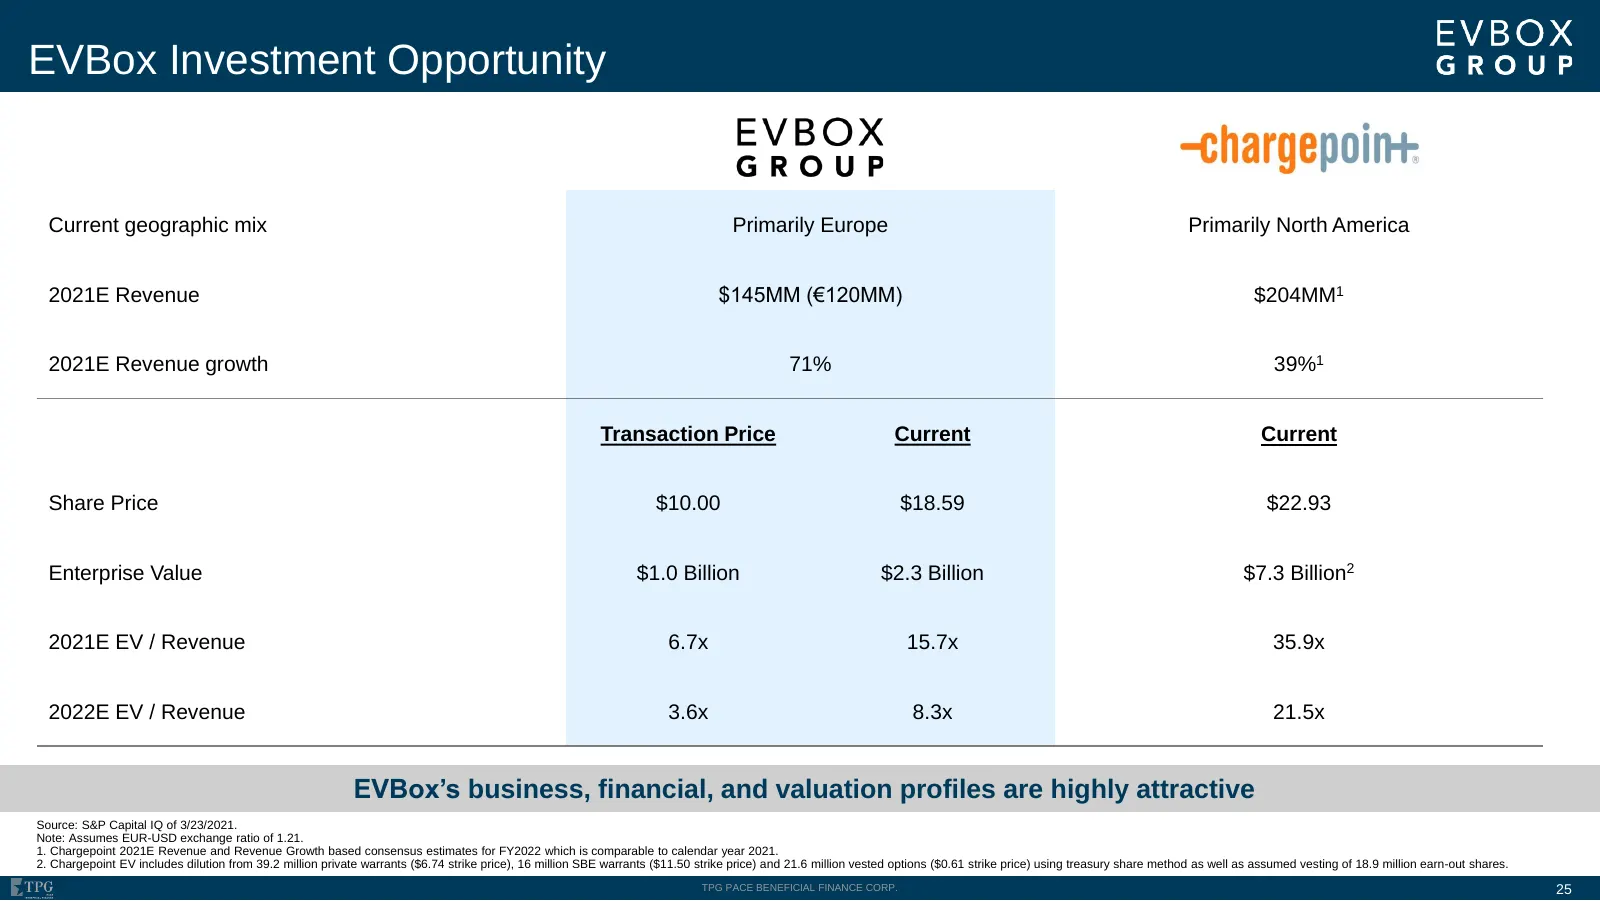
EVBox Investment Opportunity Current geographic mix Primarily Europe Primarily North America 2021E Revenue $145MM (€120MM) $204MM1 2021E Revenue growth 71% 39%1 Transaction Price Current Current Share Price $10.00 $18.59 $22.93 Enterprise Value $1.0 Billion $2.3 Billion $7.3 Billion2 2021E EV / Reve
Slide 26: Key Takeaways
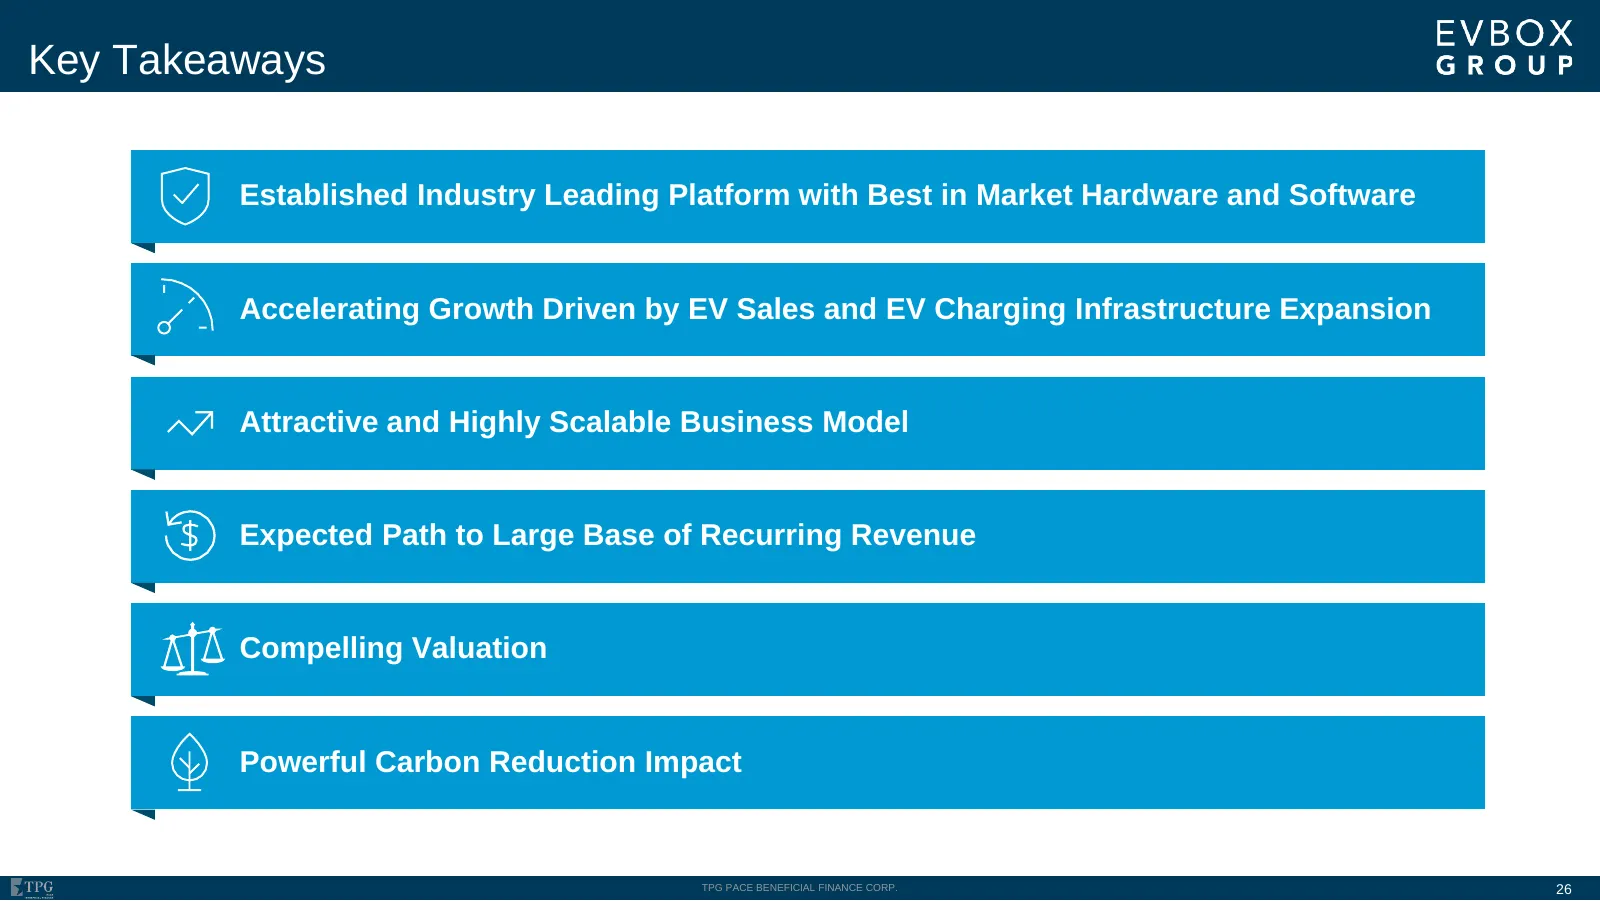
Key Takeaways Established Industry Leading Platform with Best in Market Hardware and Software Accelerating Growth Driven by EV Sales and EV Charging Infrastructure Expansion Attractive and Highly Scalable Business Model Expected Path to Large Base of Recurring Revenue Compelling Valuation Powerful C
Slide 27: 2019 Audited Income Statement (U.S. GAAP)
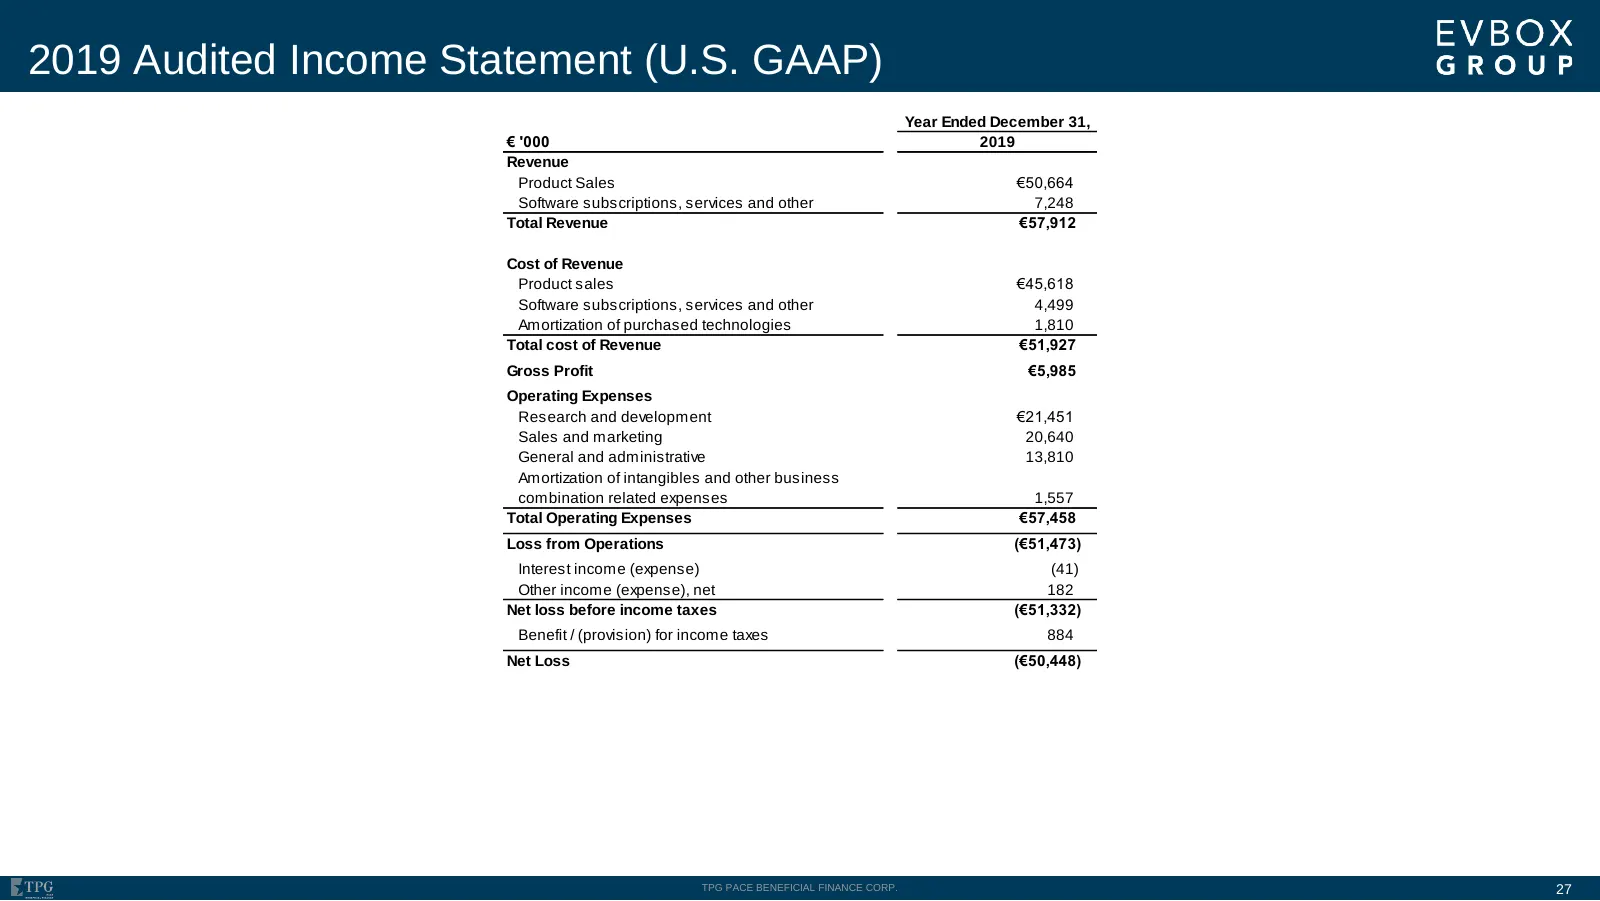
2019 Audited Income Statement (U.S. GAAP) Year Ended December 31, € '000 2019 Revenue Product Sales €50,664 Software subscriptions, services and other 7,248 Total Revenue €57,912 Cost of Revenue Product sales €45,618 Software subscriptions, services and other 4,499 Amortization of purchased technolo
Slide 28: 2019 Audited Balance Sheet (U.S. GAAP)
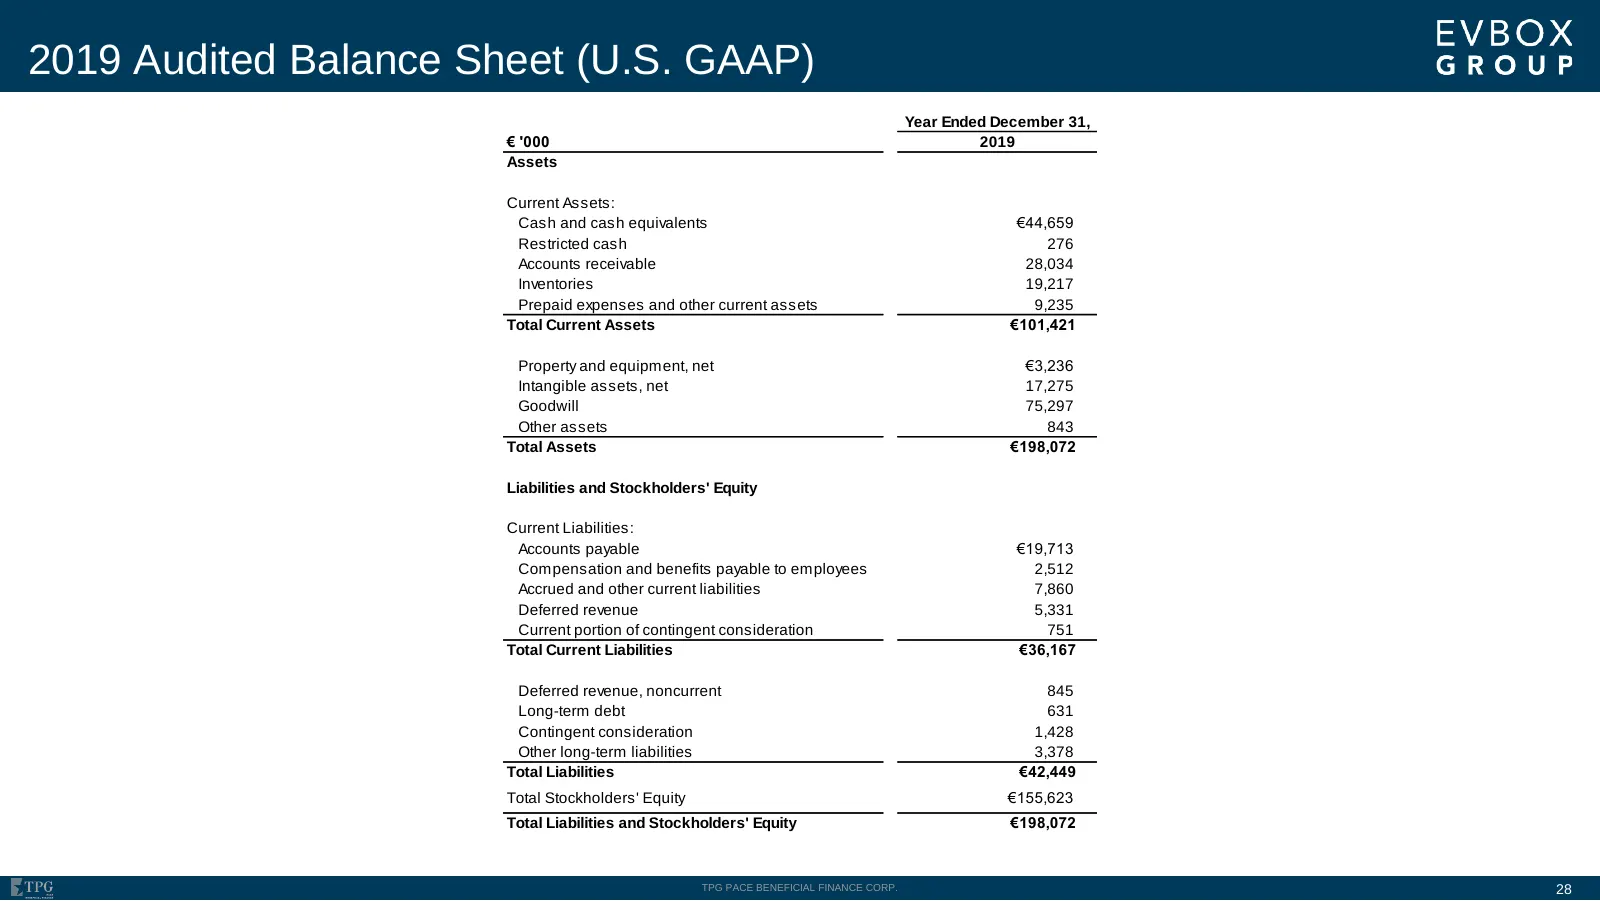
2019 Audited Balance Sheet (U.S. GAAP) Year Ended December 31, € '000 2019 Assets Current Assets: Cash and cash equivalents €44,659 Restricted cash 276 Accounts receivable 28,034 Inventories 19,217 Prepaid expenses and other current assets 9,235 Total Current Assets €101,421 Property and equipment,
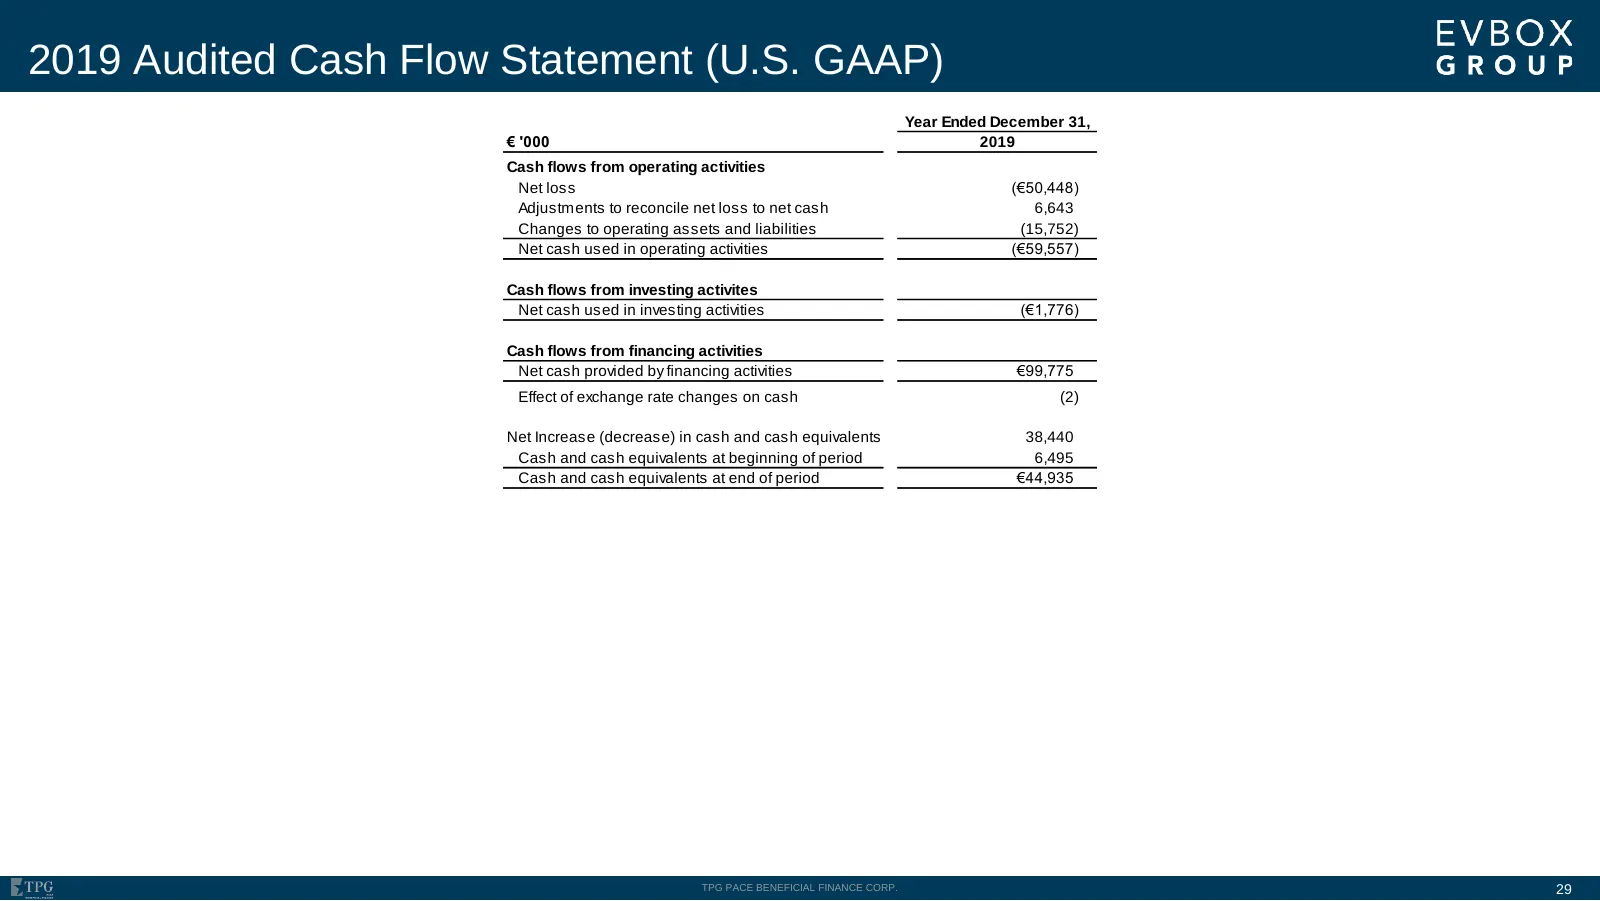
Slide 29: 2019 Audited Cash Flow Statement (U.S. GAAP)
2019 Audited Cash Flow Statement (U.S. GAAP) Year Ended December 31, € '000 2019 Cash flows from operating activities Net loss (€50,448) Adjustments to reconcile net loss to net cash 6,643 Changes to operating assets and liabilities (15,752) Net cash used in operating activities (€59,557) Cash flows
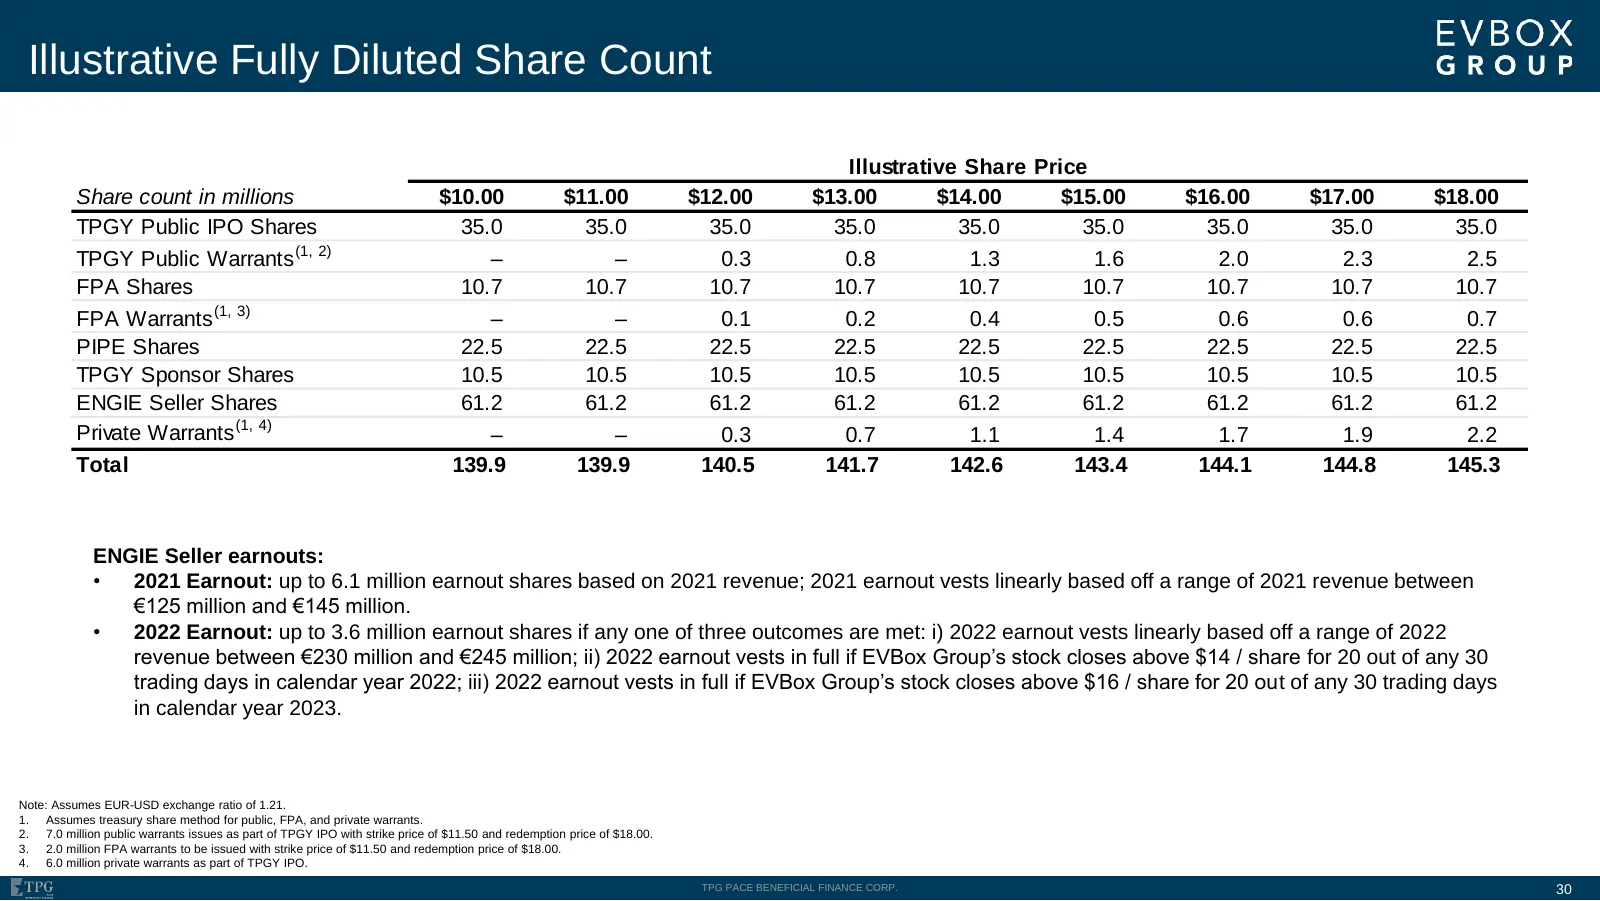
Slide 30: Illustrative Fully Diluted Share Count
Illustrative Fully Diluted Share Count Illustrative Share Price Share count in millions $10.00 $11.00 $12.00 $13.00 $14.00 $15.00 $16.00 $17.00 $18.00 TPGY Public IPO Shares 35.0 35.0 35.0 35.0 35.0 35.0 35.0 35.0 35.0 TPGY Public Warrants (1, 2) – – 0.3 0.8 1.3 1.6 2.0 2.3 2.5 FPA Shares 10.7 10.7
Source: Internet Archive copy of tpg.com
More decks from TPG Inc.
 Q2 2026 Earnings Presentation44 slides · Aug 4, 2026
 Q1 2026 Earnings Presentation44 slides · May 1, 2026
 Q4 2025 Earnings Presentation45 slides · Feb 5, 2026
 Merger or Acquisition (January 2026)14 slides · Jan 6, 2026
 Q2 2025 Earnings Presentation44 slides · Aug 6, 2025
 Q1 2025 Earnings Presentation44 slides · May 7, 2025