WellCare Health Plans — Investor Presentation (January 2017)
14 slides from WellCare Health Plans's investor presentation, Jan 11, 2017

Slide 1: Kenneth A. Burdick, CEO and Drew Asher, CFO - January 11, 2017
Kenneth A. Burdick, Chief Executive Officer Drew Asher, Chief Financial Officer January 11, 2017
Slide 2: Forward-looking statements
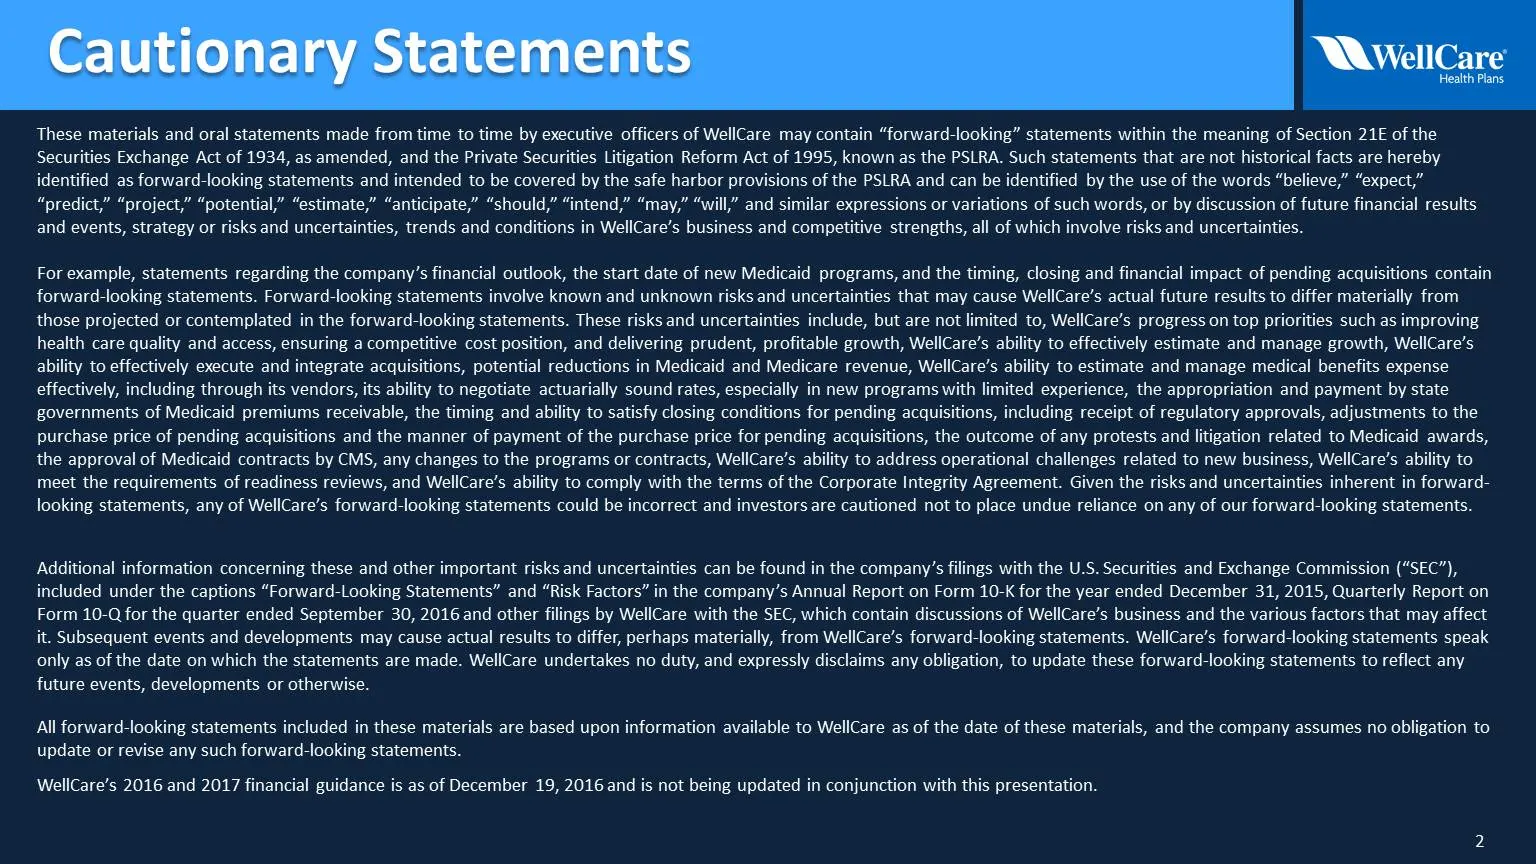
These materials and oral statements made from time to time by executive officers of WellCare may contain “forward-looking” statements within the meaning of Section 21E of the Securities Exchange Act of 1934, as amended, and the Private Securities Litigation Reform Act of 1995, known as the PSLRA. Su
Slide 3: Diversified Government Programs Portfolio
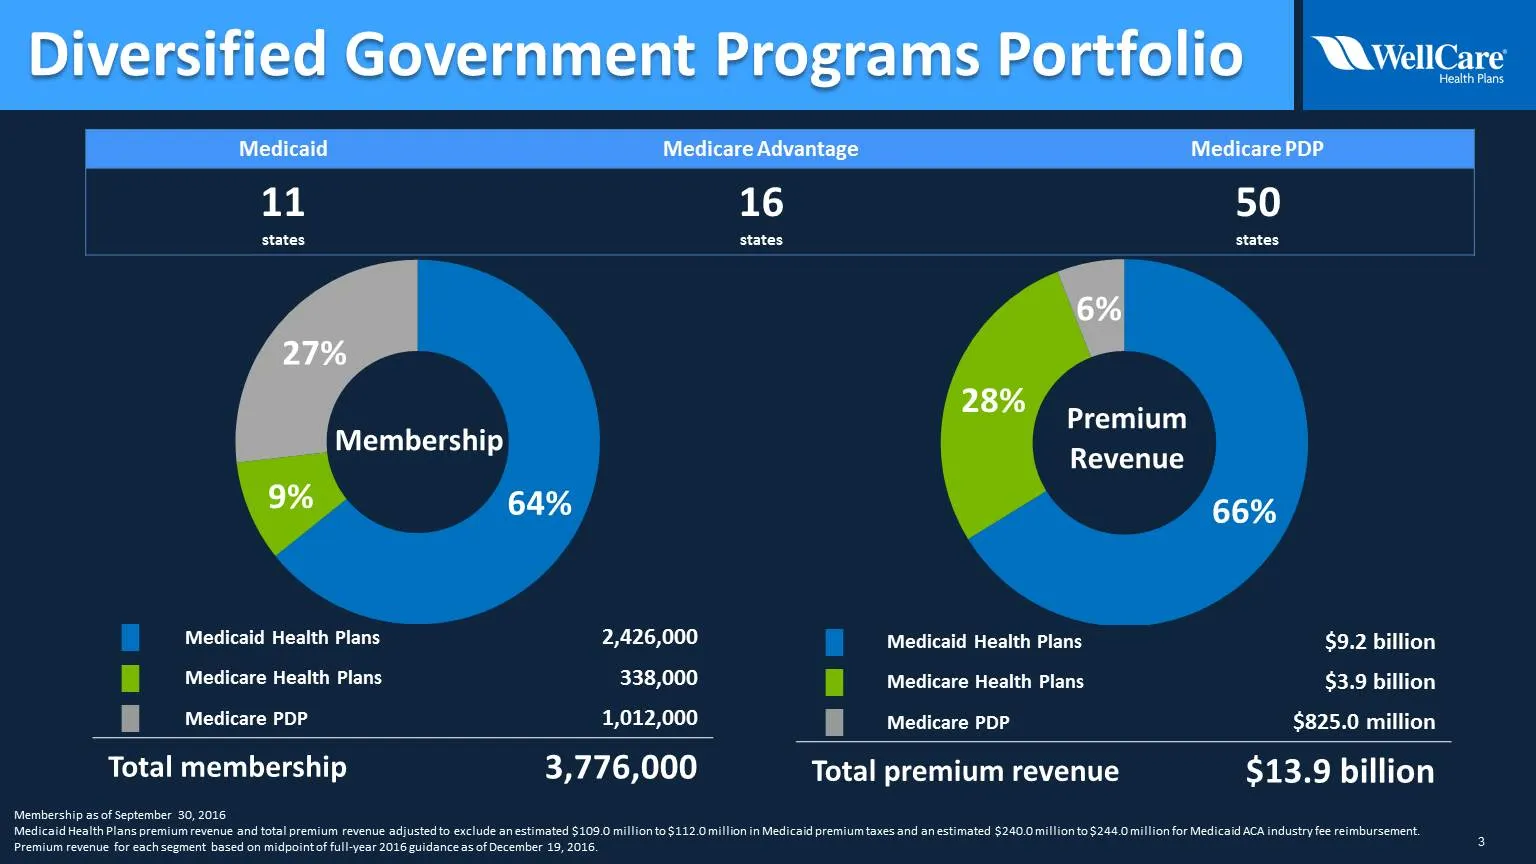
Diversified Government Programs Portfolio Wveicare Health Plans Medicaid Medicare Advantage Medicare PDP 11 16 50 states states states Premium Membership Revenue 64% 66% Medicaid Health Plans 2,426,000 Medicaid Health Plans $9.2 billion [J Medicare Health Plans 338,000 {) Medicare Health Plans $3.9
Slide 4: Medicaid Health Plans
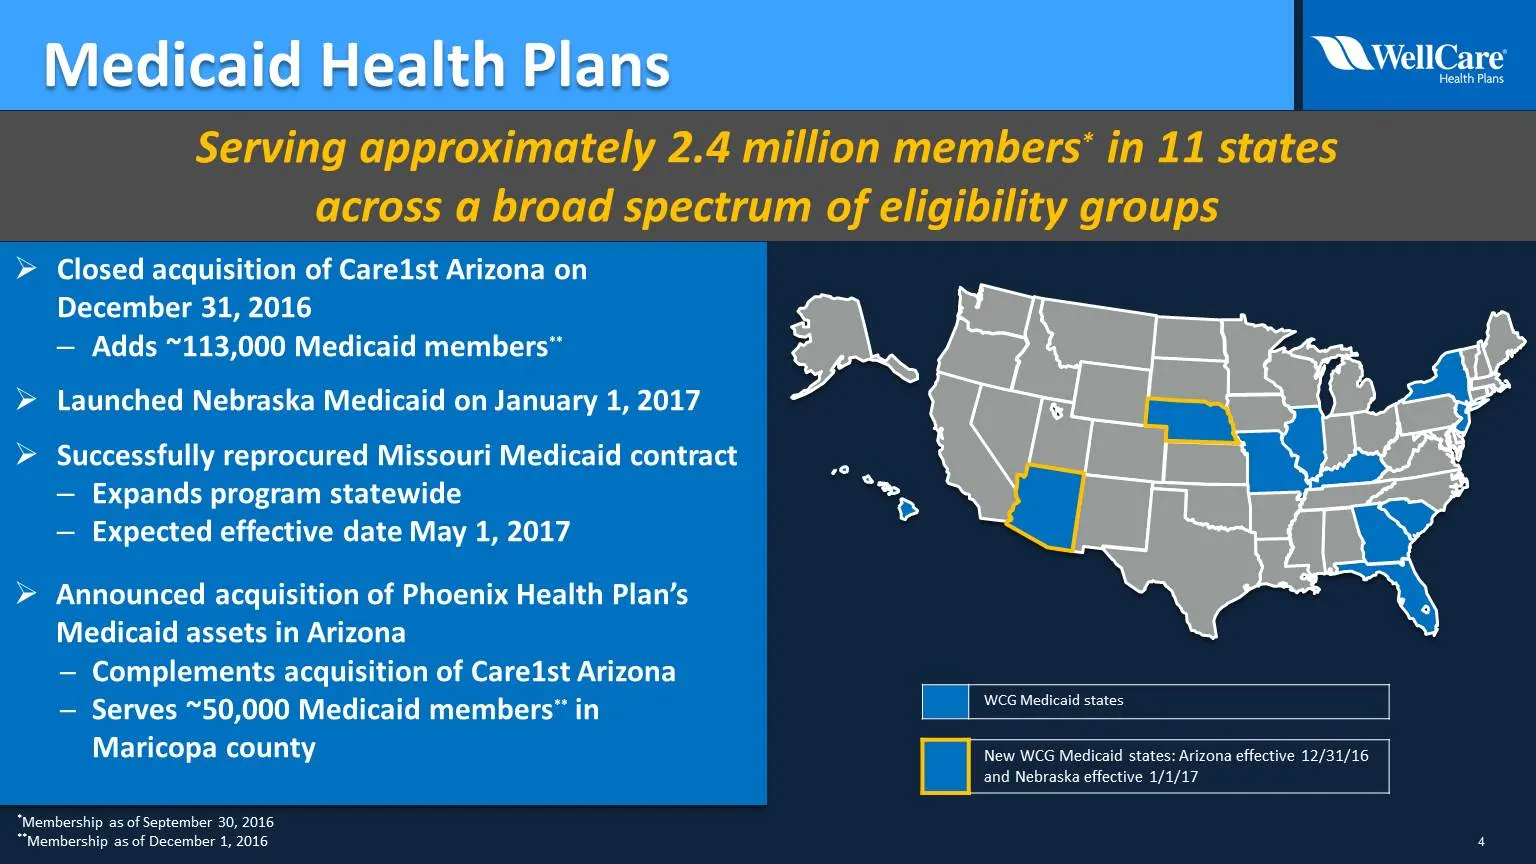
Medicaid Health Plans NAweliCare Serving approximately 2.4 million members’ in 11 states across a broad spectrum of eligibility groups Closed acquisition of Care1st Arizona on December 31, 2016 — Adds ~113,000 Medicaid members” Vv Vv Launched Nebraska Medicaid on January 1, 2017 > Successfully repro
Slide 5: Medicare Health Plans
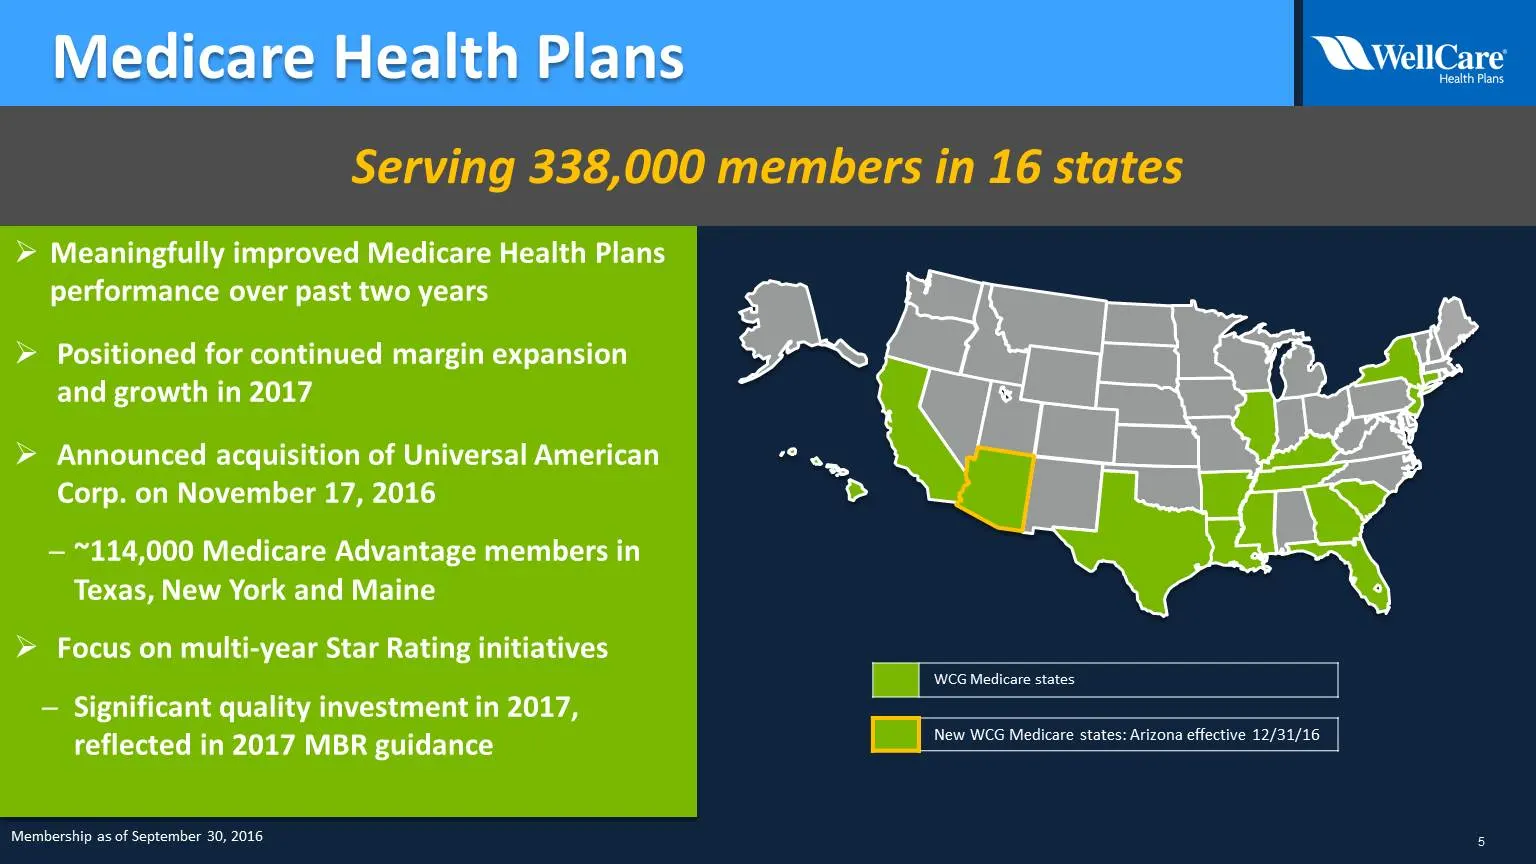
> Meaningfully improved Medicare Health Plans performance over past two years > Positioned for continued margin expansion and growth in 2017 > Announced acquisition of Universal American Corp. on November 17, 2016 — ~114,000 Medicare Advantage members in Texas, New York and Maine > Focus on multi-ye
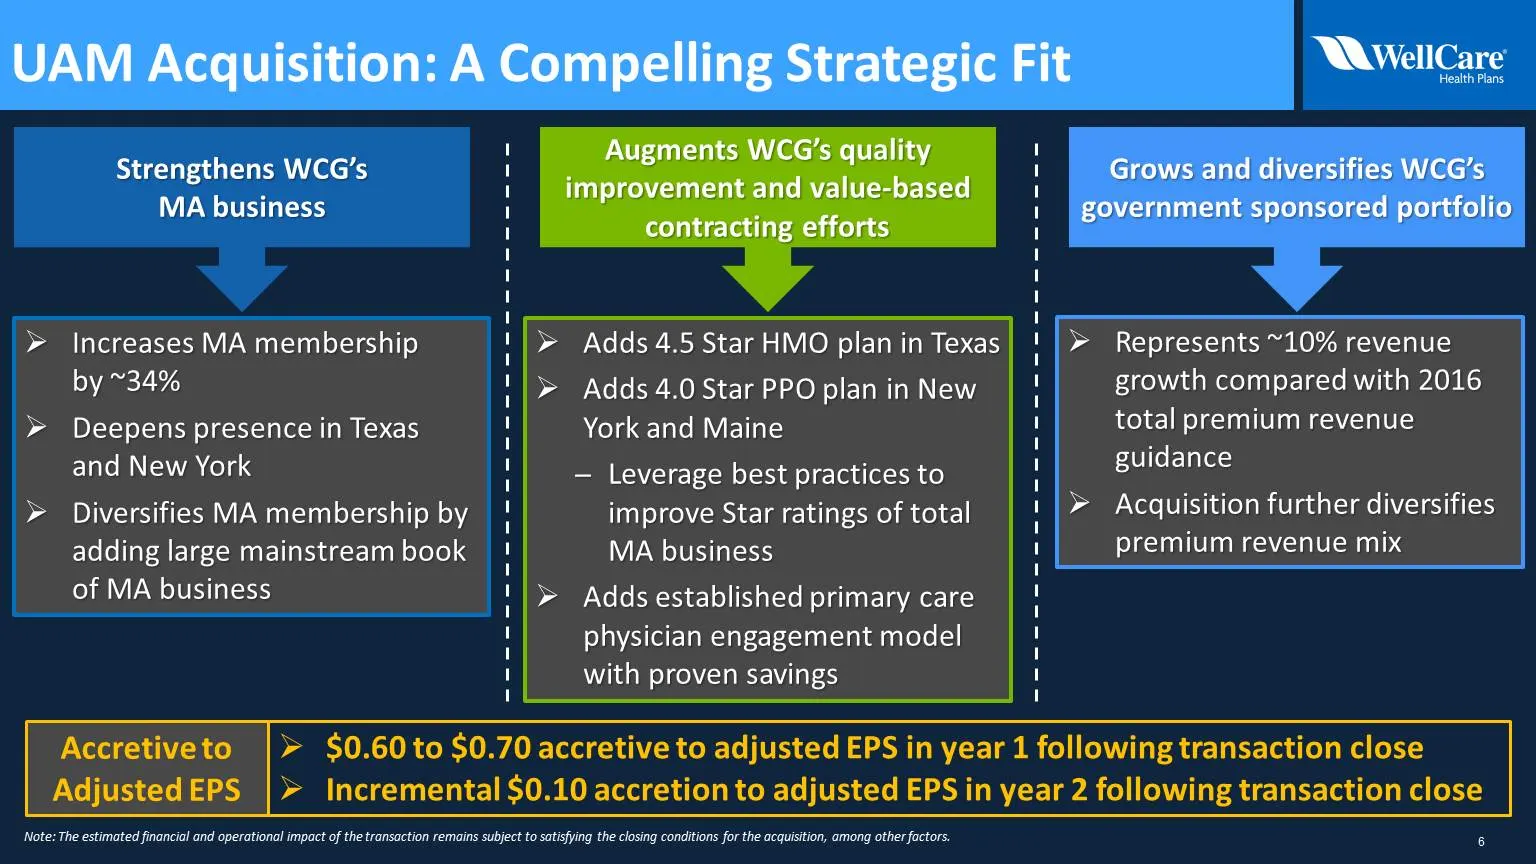
Slide 6: UAM Acquisition: A Compelling Strategic Fit
UAM Acquisition: A Compelling Strategic Fit WawllCare 7 7 Strengthens WCG’s : AU Sul ESS sh 2) Grows and diversifies WCG’s MA business Inuotamensase) lio 133 ‘overnment sponsored portfolio contracting efforts 8 B P > Increases MA membership > Adds 4.5 Star HMO plan in Texas by ~34% > Adds 4.0 Star P
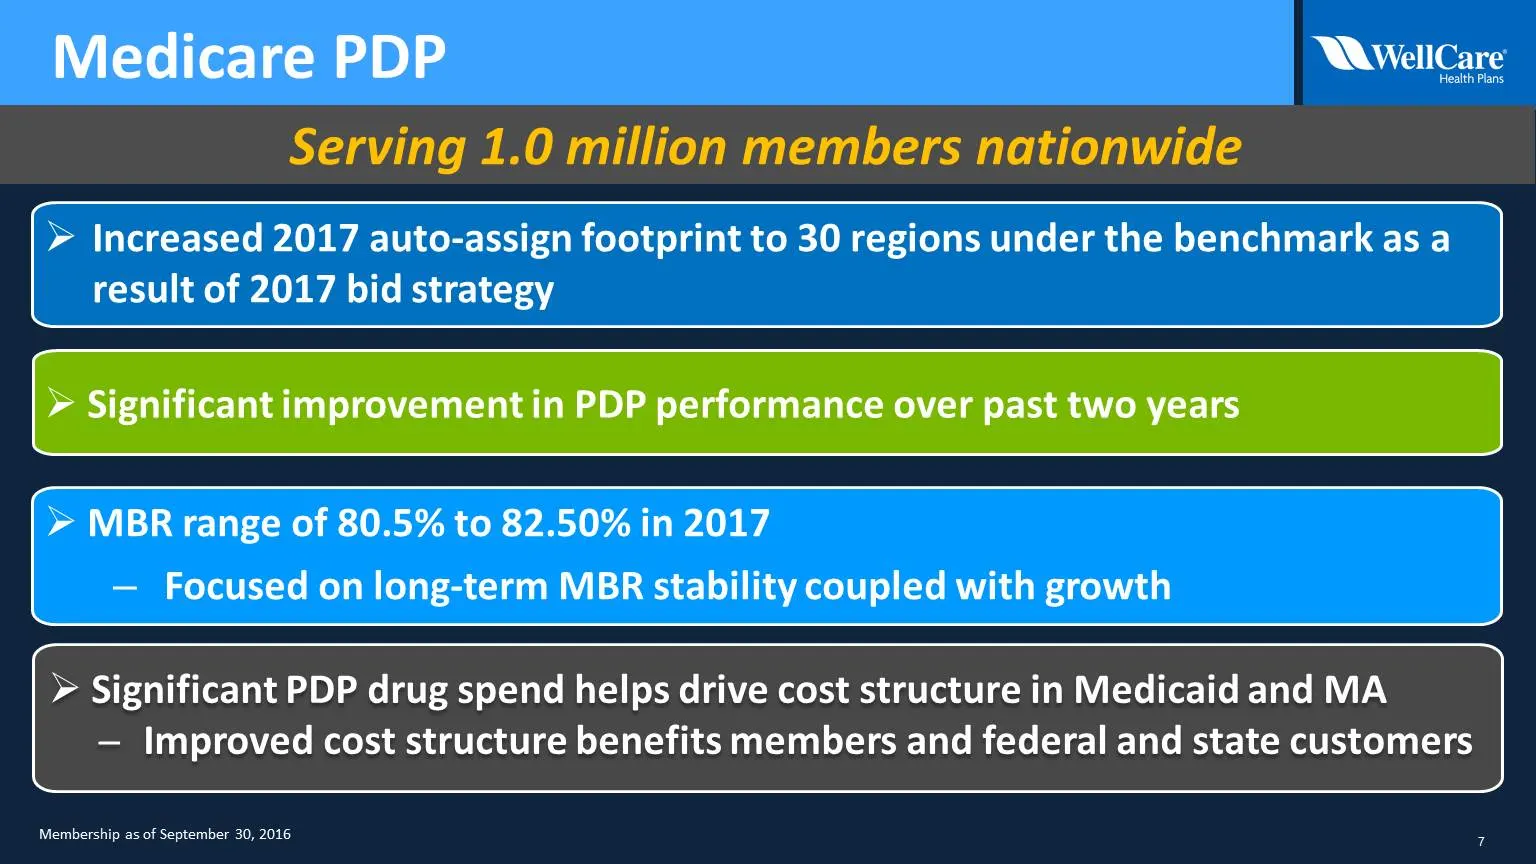
Slide 7: Medicare PDP
Medicare PDP Wawelicare 6 Serving 1.0 million members nationwide result of 2017 bid strategy i‘ MBR range of 80.5% to 82.50% in 2017 | a Increased 2017 auto-assign footprint to 30 regions under the benchmark as a — Focused on long-term MBR stability coupled with growth > Significant PDP drug spend h
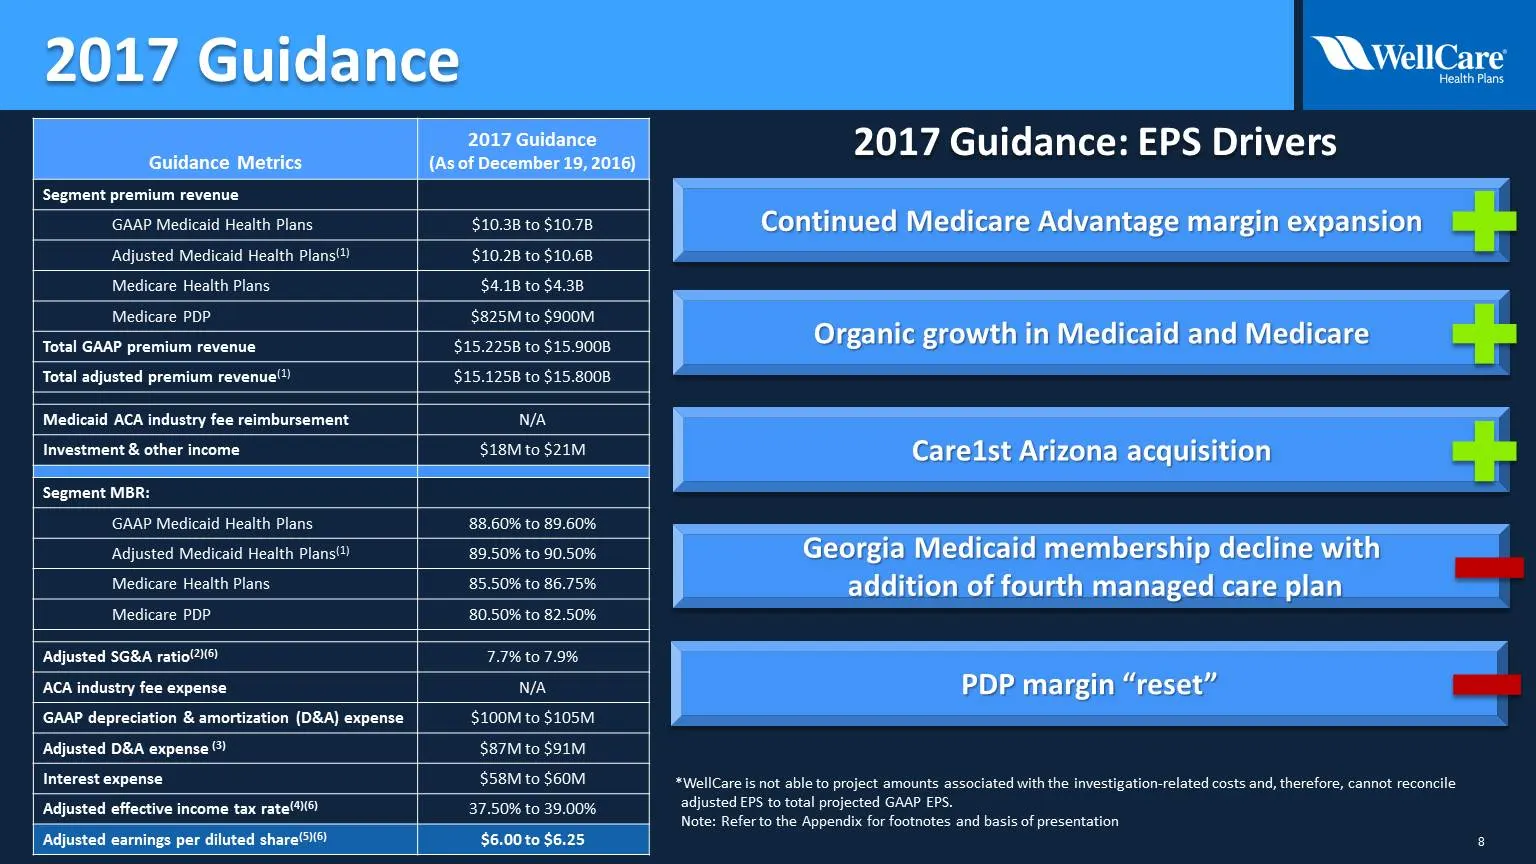
Slide 8: 2017 Guidance
2017 Guidance Guidance Metrics 2017 Guidance {As of December 19, 2016) WAwellCare Health Plans 2017 Guidance: EPS Drivers Segment premium revenue GAAP Medicaid Health Plans $10.3B to $10.7B Adjusted Medicaid Health Plans!) $10.2B to $10.6B Medicare Health Plans $4.1B to $4.3B Medicare PDP $825M to $
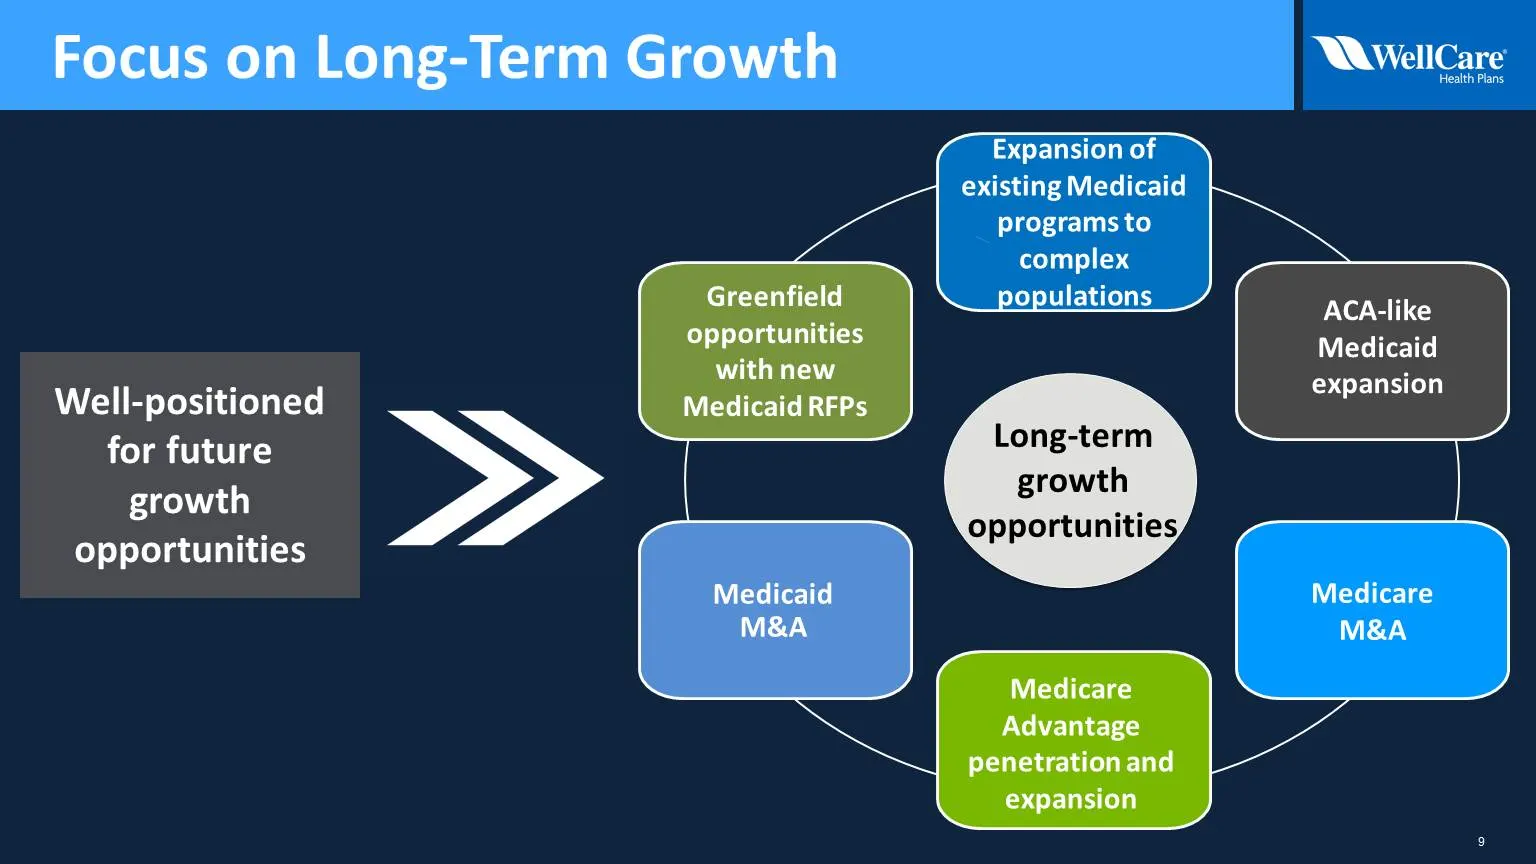
Slide 9: Focus on Long-Term Growth
Focus on Long-Term Growth WawellCare Expansion of existing Medicaid programs to complex populations ACA-like Medicaid Well-positioned expansion for future none row growth g a + opportunities opportunities Medicare M&A
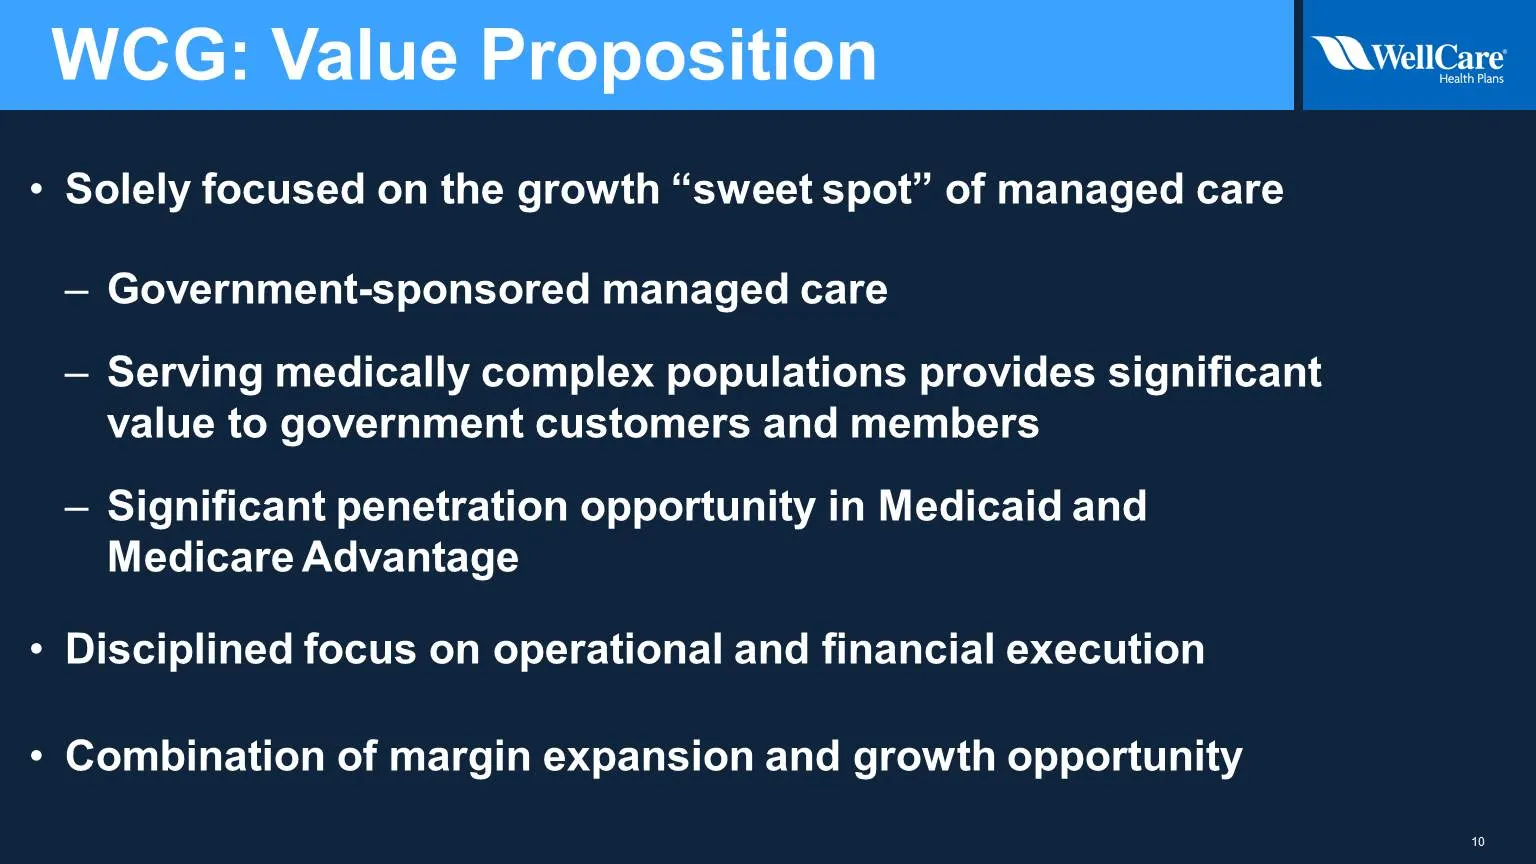
Slide 10: Solely focused on the growth sweet spot of managed care
* Solely focused on the growth “sweet spot” of managed care — Government-sponsored managed care — Serving medically complex populations provides significant value to government customers and members — Significant penetration opportunity in Medicaid and Medicare Advantage ¢ Disciplined focus on opera
Slide 11: Appendix
Appendix
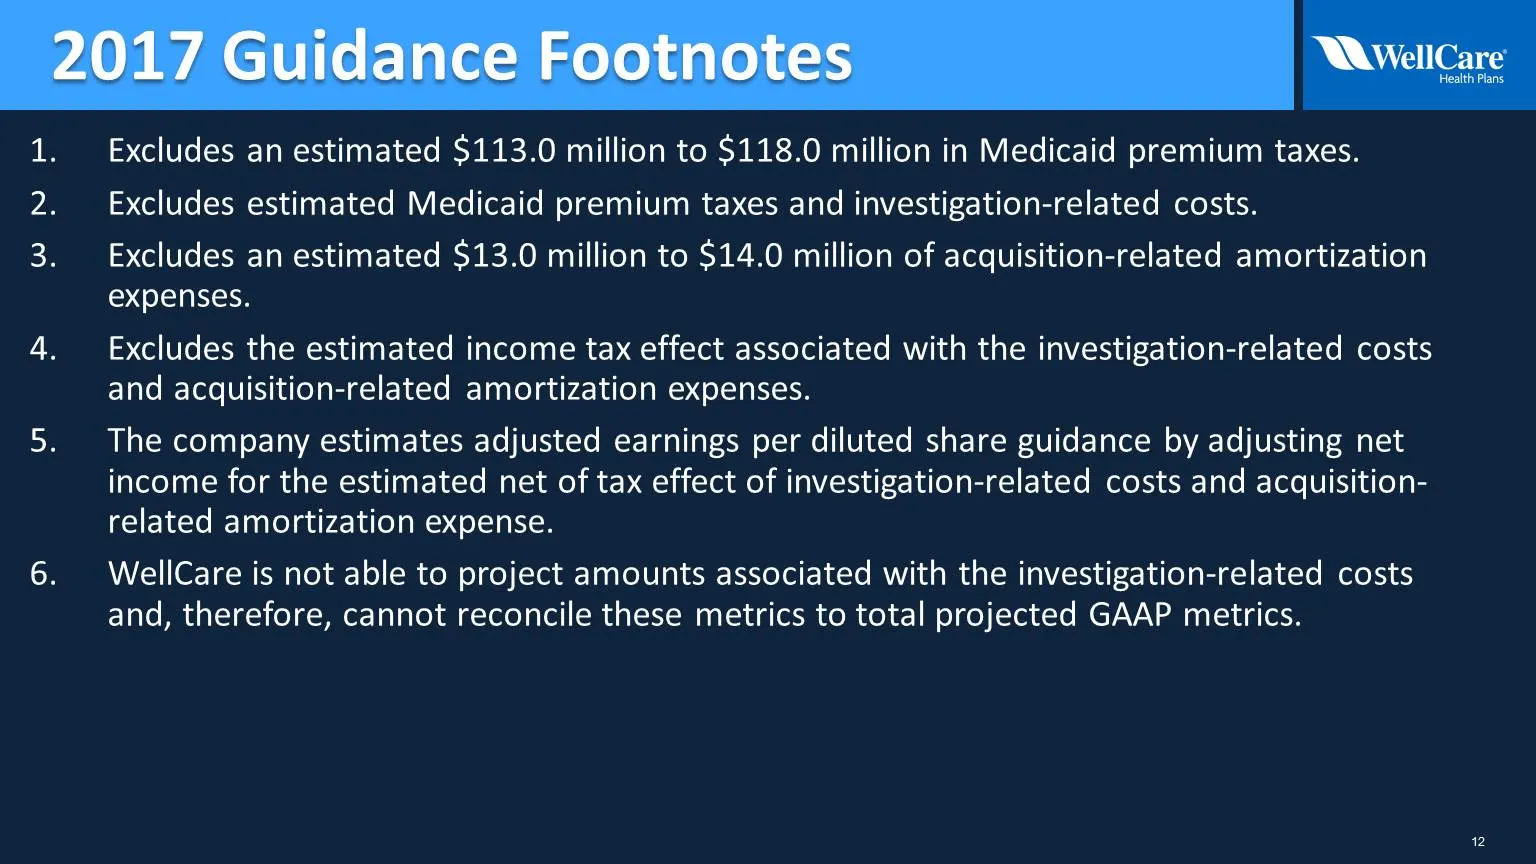
Slide 12: Guidance footnotes: exclusions and adjustments
Excludes an estimated $113.0 million to $118.0 million in Medicaid premium taxes. Excludes estimated Medicaid premium taxes and investigation-related costs. Excludes an estimated $13.0 million to $14.0 million of acquisition-related amortization expenses. Excludes the estimated income tax effect ass
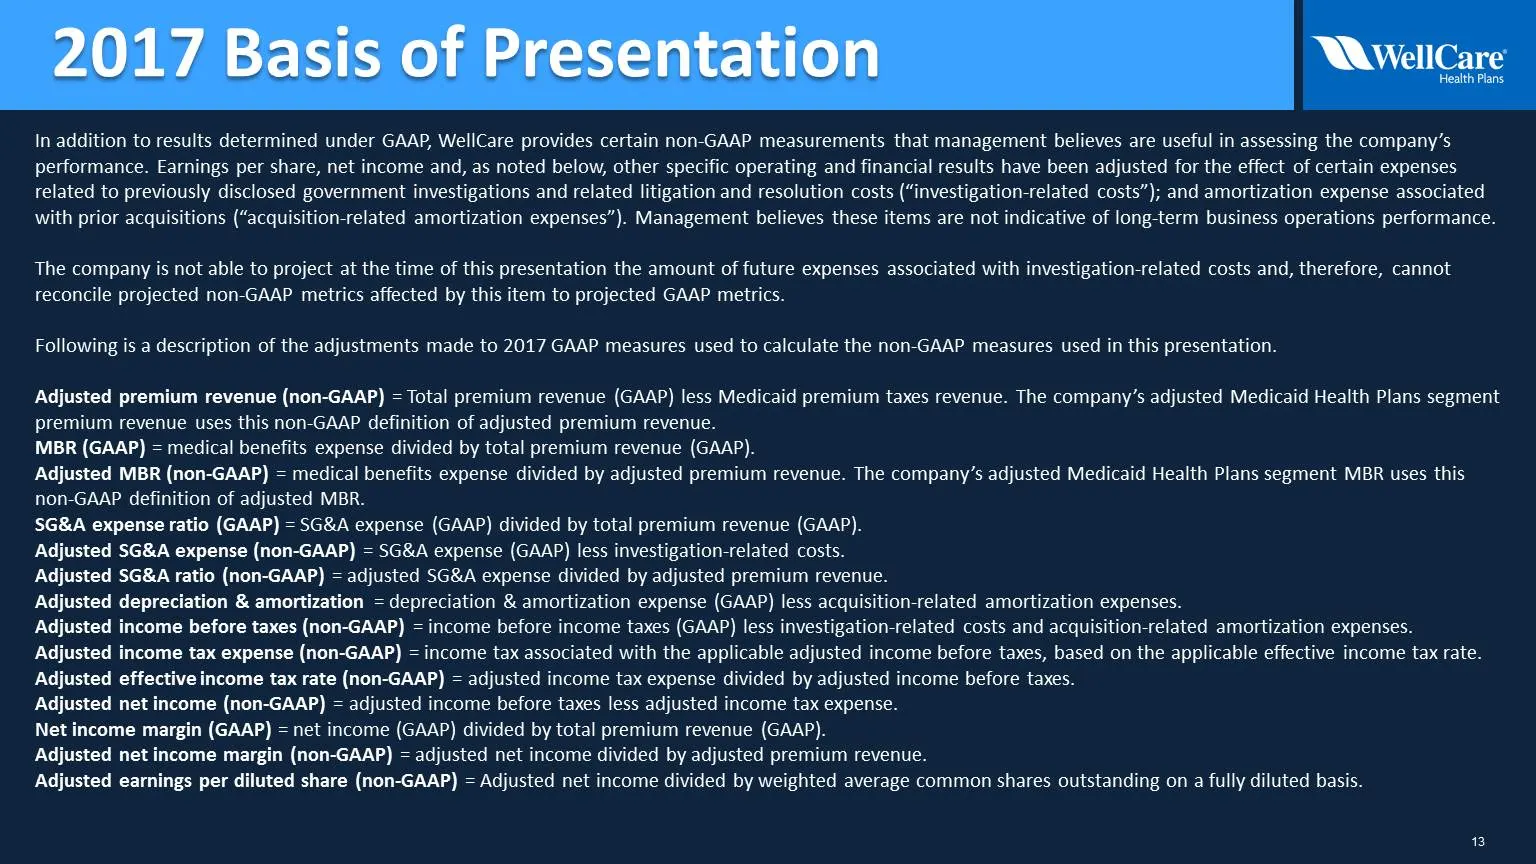
Slide 13: Non-GAAP measures explanation
In addition to results determined under GAAP, WellCare provides certain non-GAAP measurements that management believes are useful in assessing the company’s performance. Earnings per share, net income and, as noted below, other specific operating and financial results have been adjusted for the effe
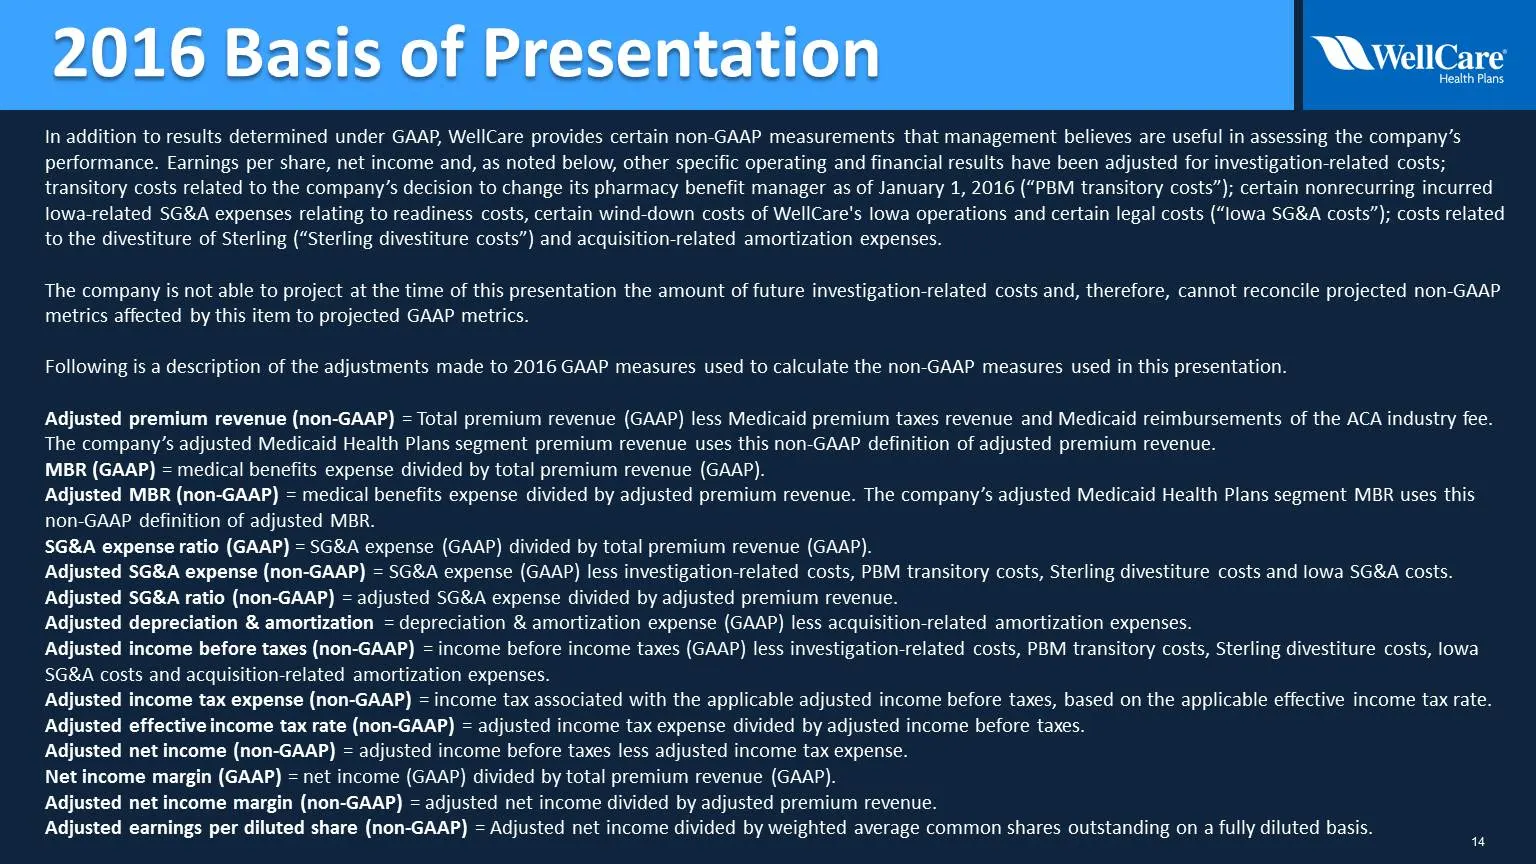
Slide 14: Non-GAAP measures explanation
In addition to results determined under GAAP, WellCare provides certain non-GAAP measurements that management believes are useful in assessing the company’s performance. Earnings per share, net income and, as noted below, other specific operating and financial results have been adjusted for investig
Source: SEC EDGAR · 8-K filed Jan 11, 2017
More decks from WellCare Health Plans Inc
 Wellcare — Investor Presentation (2026)13 slides · Oct 29, 2026
 WellCare of Kentucky — Provider Summit 202618 slides · Apr 3, 2026
 Wellcare — Investor Presentation (September 2025)13 slides · September 2025
 Wellcare — Investor Presentation (2025)78 slides · Jun 12, 2025
 Wellcare — Investor Presentation (2025)13 slides · Feb 8, 2025
 Wellcare — Investor Presentation (2025)13 slides · 2025