Ascom Holding AG · SIX:ASCN
Ascom — Investor Presentation (October 2015)
40 slides from Ascom's investor presentation, October 2015
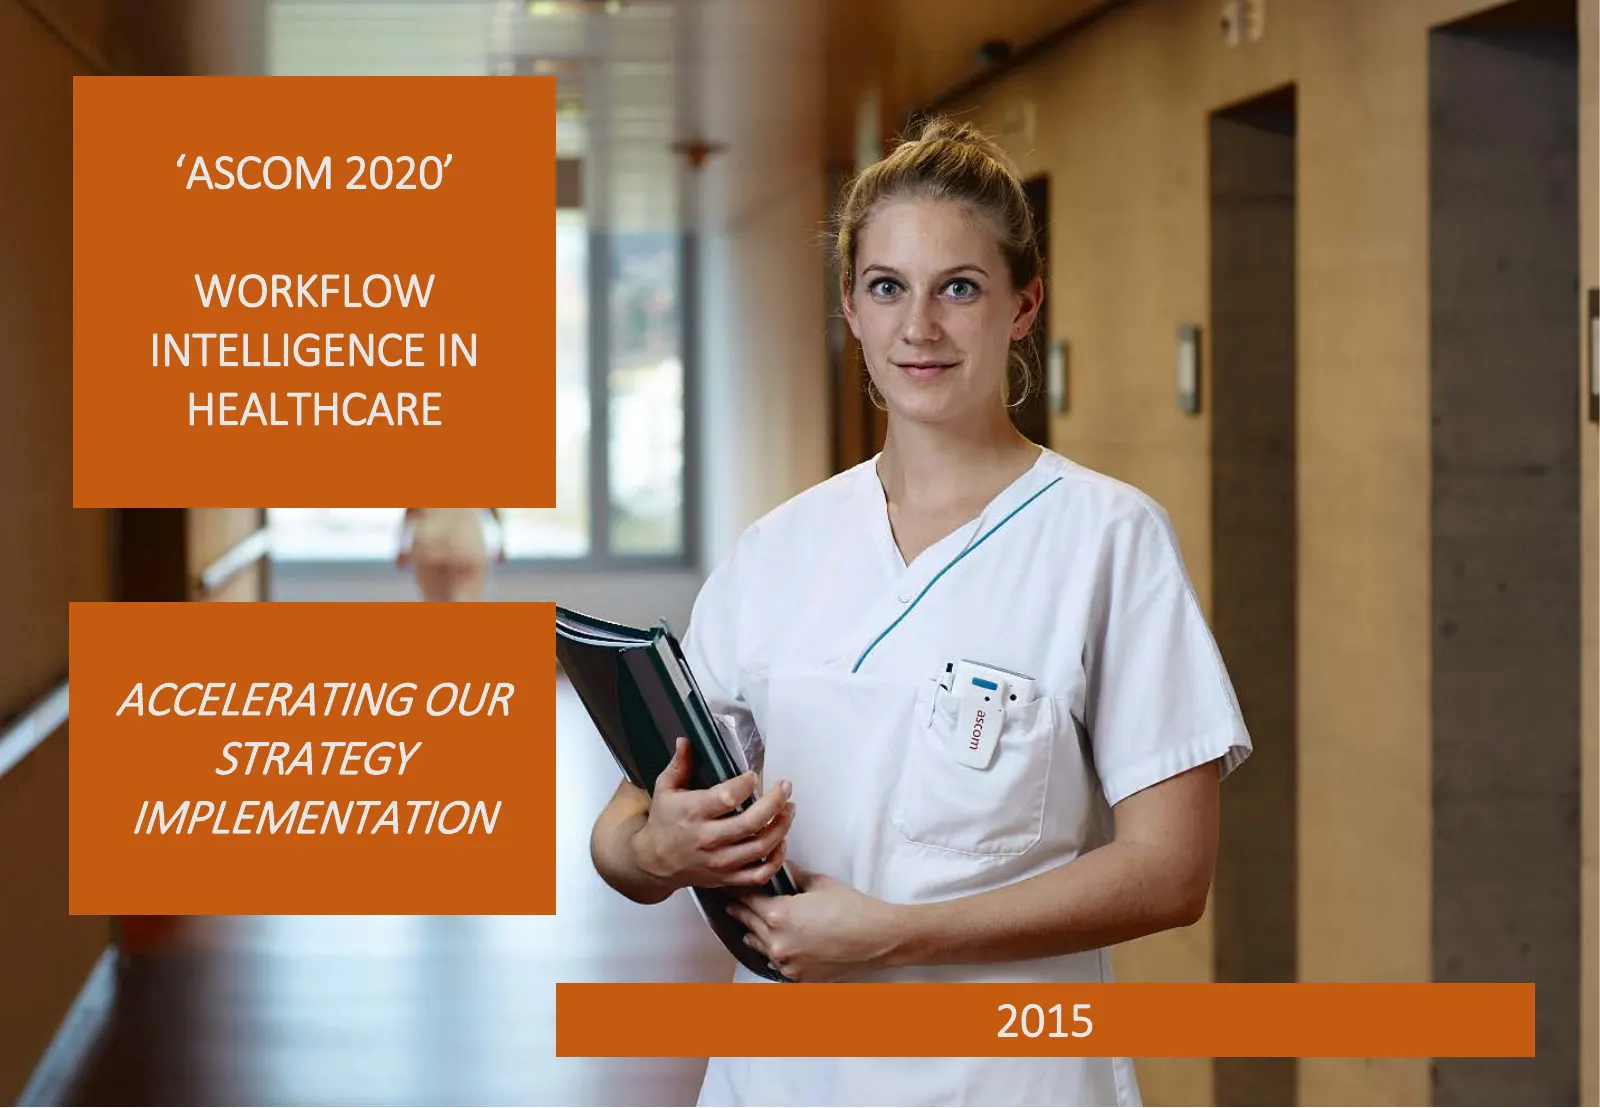
Slide 1: 'Ascom 2020' Workflow Intelligence in Healthcare
‘ASCOM 2020’ WORKFLOW INTELLIGENCE IN HEALTHCARE ACCELERATING OUR STRATEGY IMPLEMENTATION 2015
Slide 2: Legal Disclaimer
LEGAL DISCLAIMER This document contains specific forward-looking statements, e.g. statements including terms like “believe”, “expect” or similar expressions. Such forward-looking statements are subject to known and unknown risks, uncertainties and other factors which may result in a substantial dive
Slide 3: Strong Platform for Growth
STRONG PLATFORM FOR GROWTH Key figures - Strong Momentum in the core business Strategy „Ascom 2020“ – Workflow Intelligence in Healthcare Wireless Solutions – shift from products & systems to Healthcare workflow solutions Network Testing – solidify core business while accelerating Analytics
Slide 4: Ascom Group
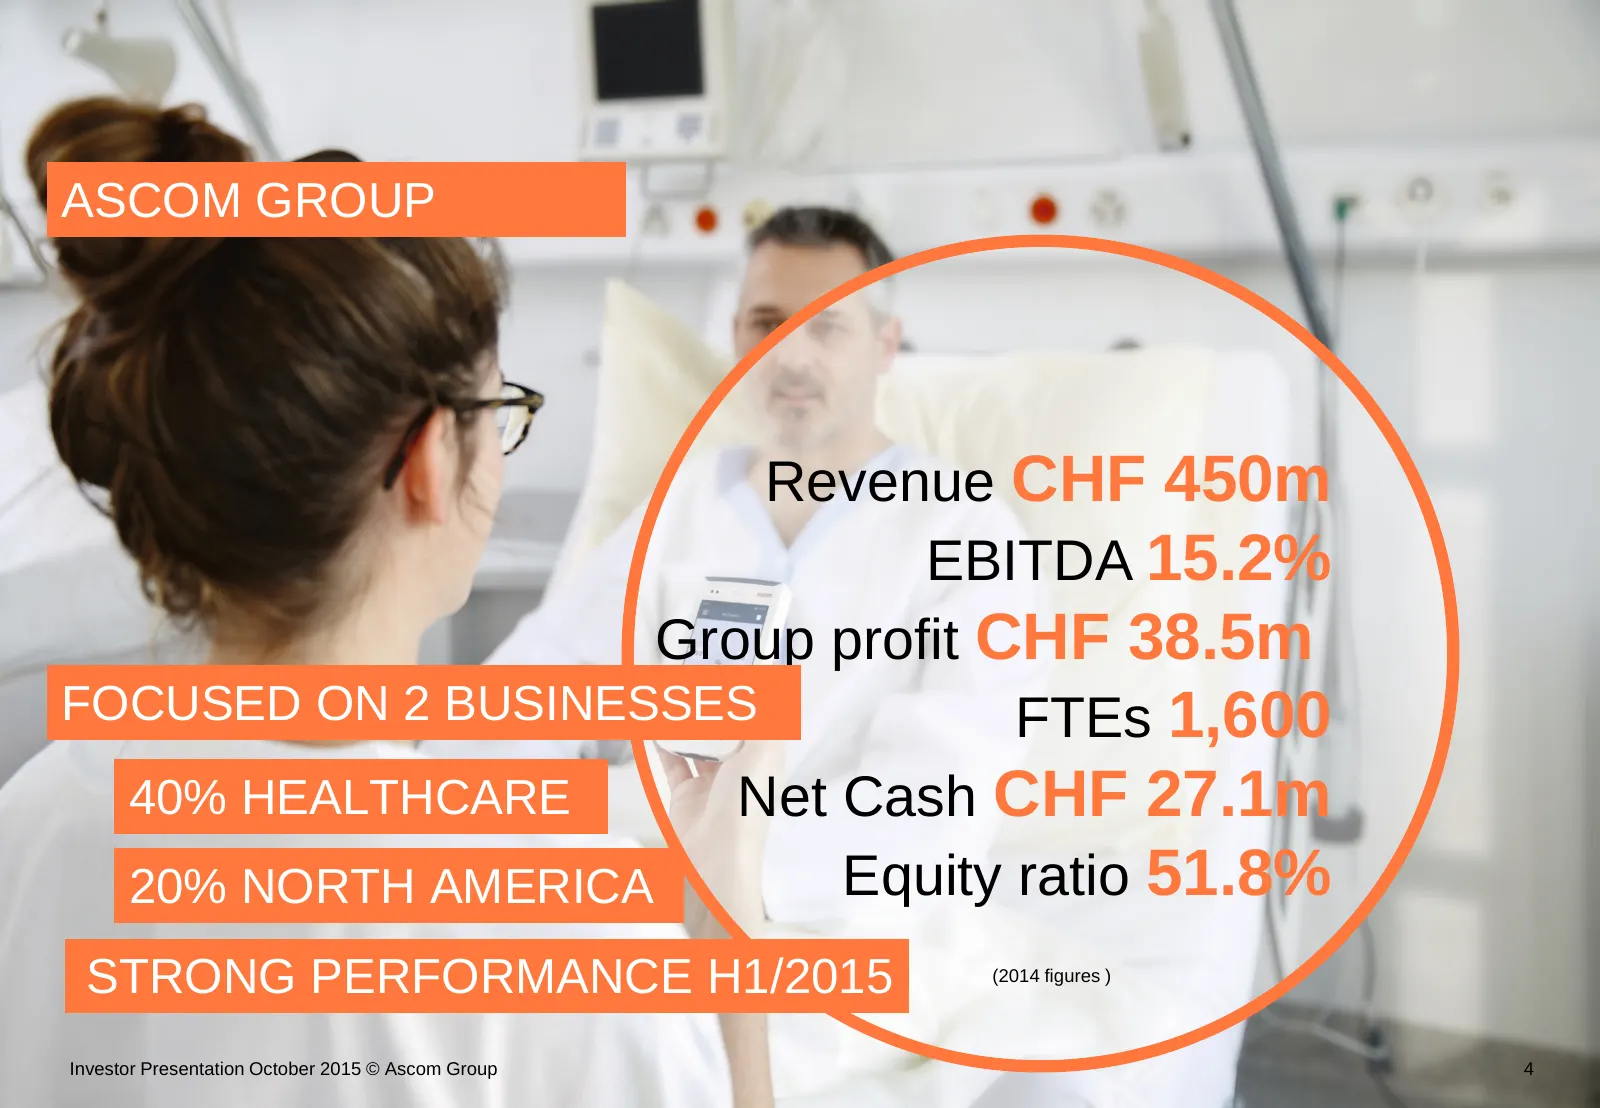
ASCOM GROUP Revenue CHF 450m EBITDA 15.2% Group profit CHF 38.5m FOCUSED ON 2 BUSINESSES FTEs 1,600 40% HEALTHCARE Net Cash CHF 27.1m 20% NORTH AMERICA Equity ratio 51.8% STRONG PERFORMANCE H1/2015 (2014 figures ) Investor Presentation October 2015 © Ascom Group 4
Slide 5: H1/2015 Highlights - Ascom Group
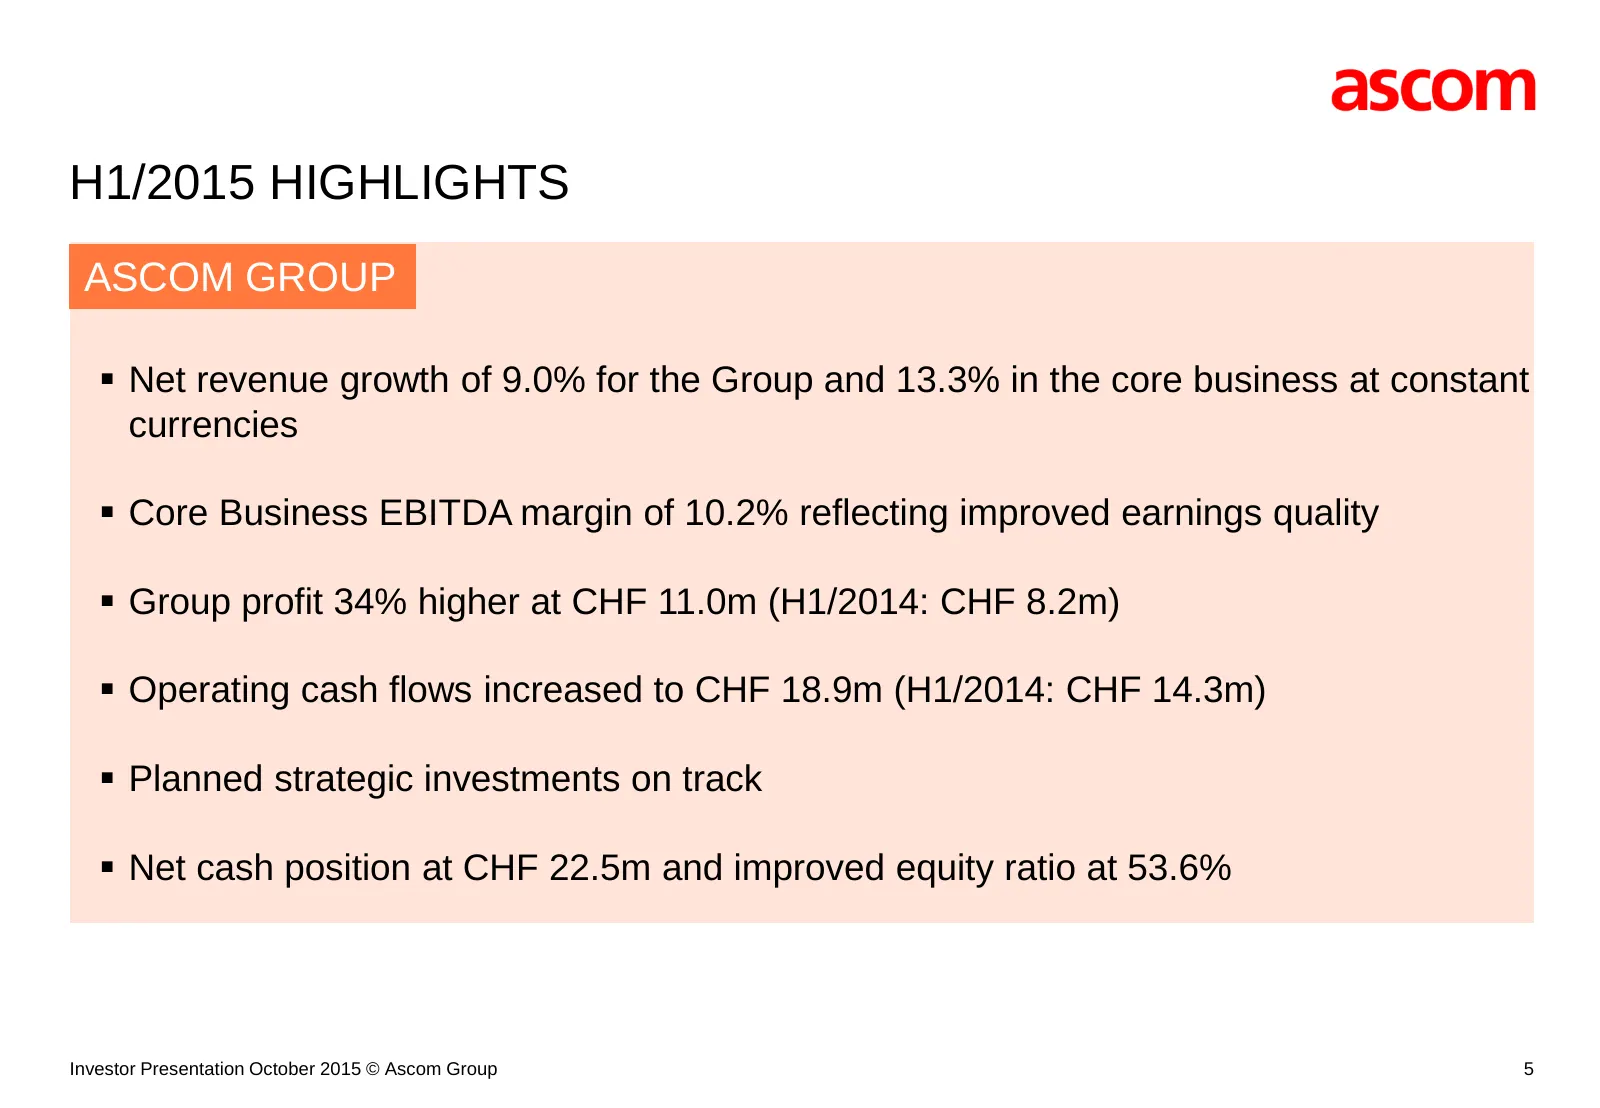
H1/2015 HIGHLIGHTS ASCOM GROUP Net revenue growth of 9.0% for the Group and 13.3% in the core business at constant currencies Core Business EBITDA margin of 10.2% reflecting improved earnings quality Group profit 34% higher at CHF 11.0m (H1/2014: CHF 8.2m) Operating cash flows increased to C
Slide 6: Improved Earnings Quality in H1/2015
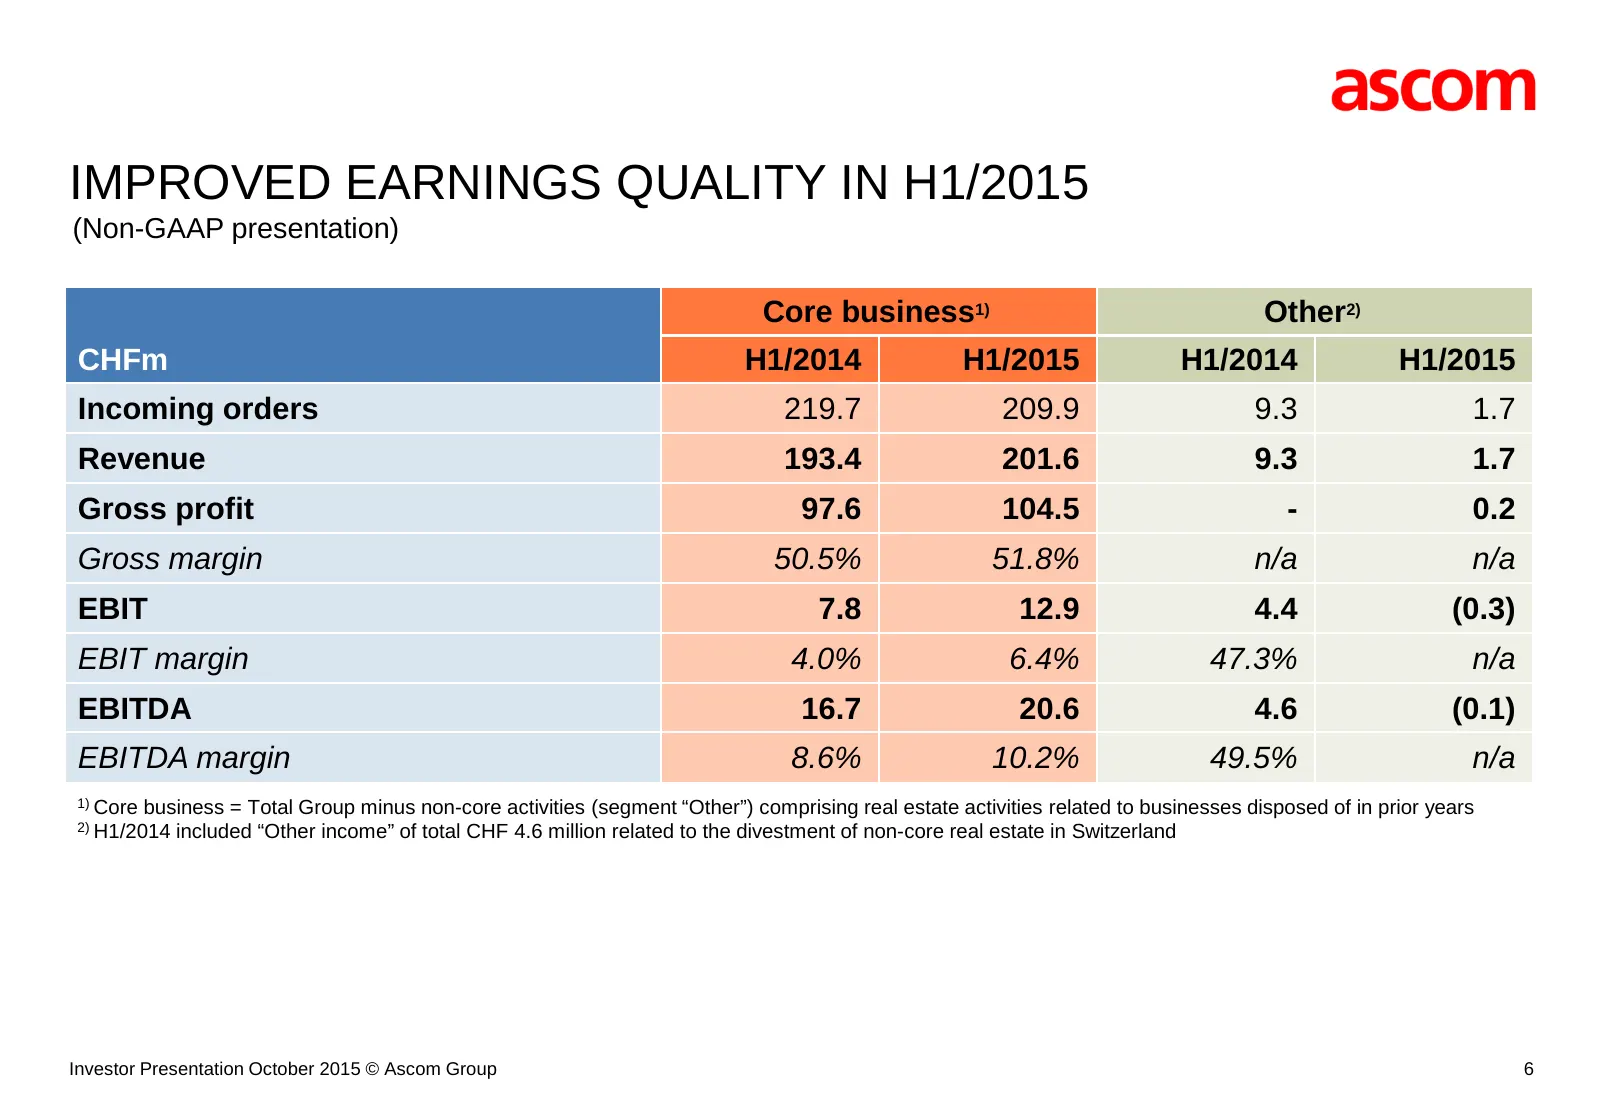
IMPROVED EARNINGS QUALITY IN H1/2015 (Non-GAAP presentation) Core business1) Other2) CHFm H1/2014 H1/2015 H1/2014 H1/2015 Incoming orders 219.7 209.9 9.3 1.7 Revenue 193.4 201.6 9.3 1.7 Gross profit 97.6 104.5 - 0.2 Gross margin 50.5% 51.8% n/a n/a EBIT 7.8 12.9 4.4 (0.3) EBIT margin 4.0% 6.4% 47.3%
Slide 7: H1/2015 Highlights - Wireless Solutions
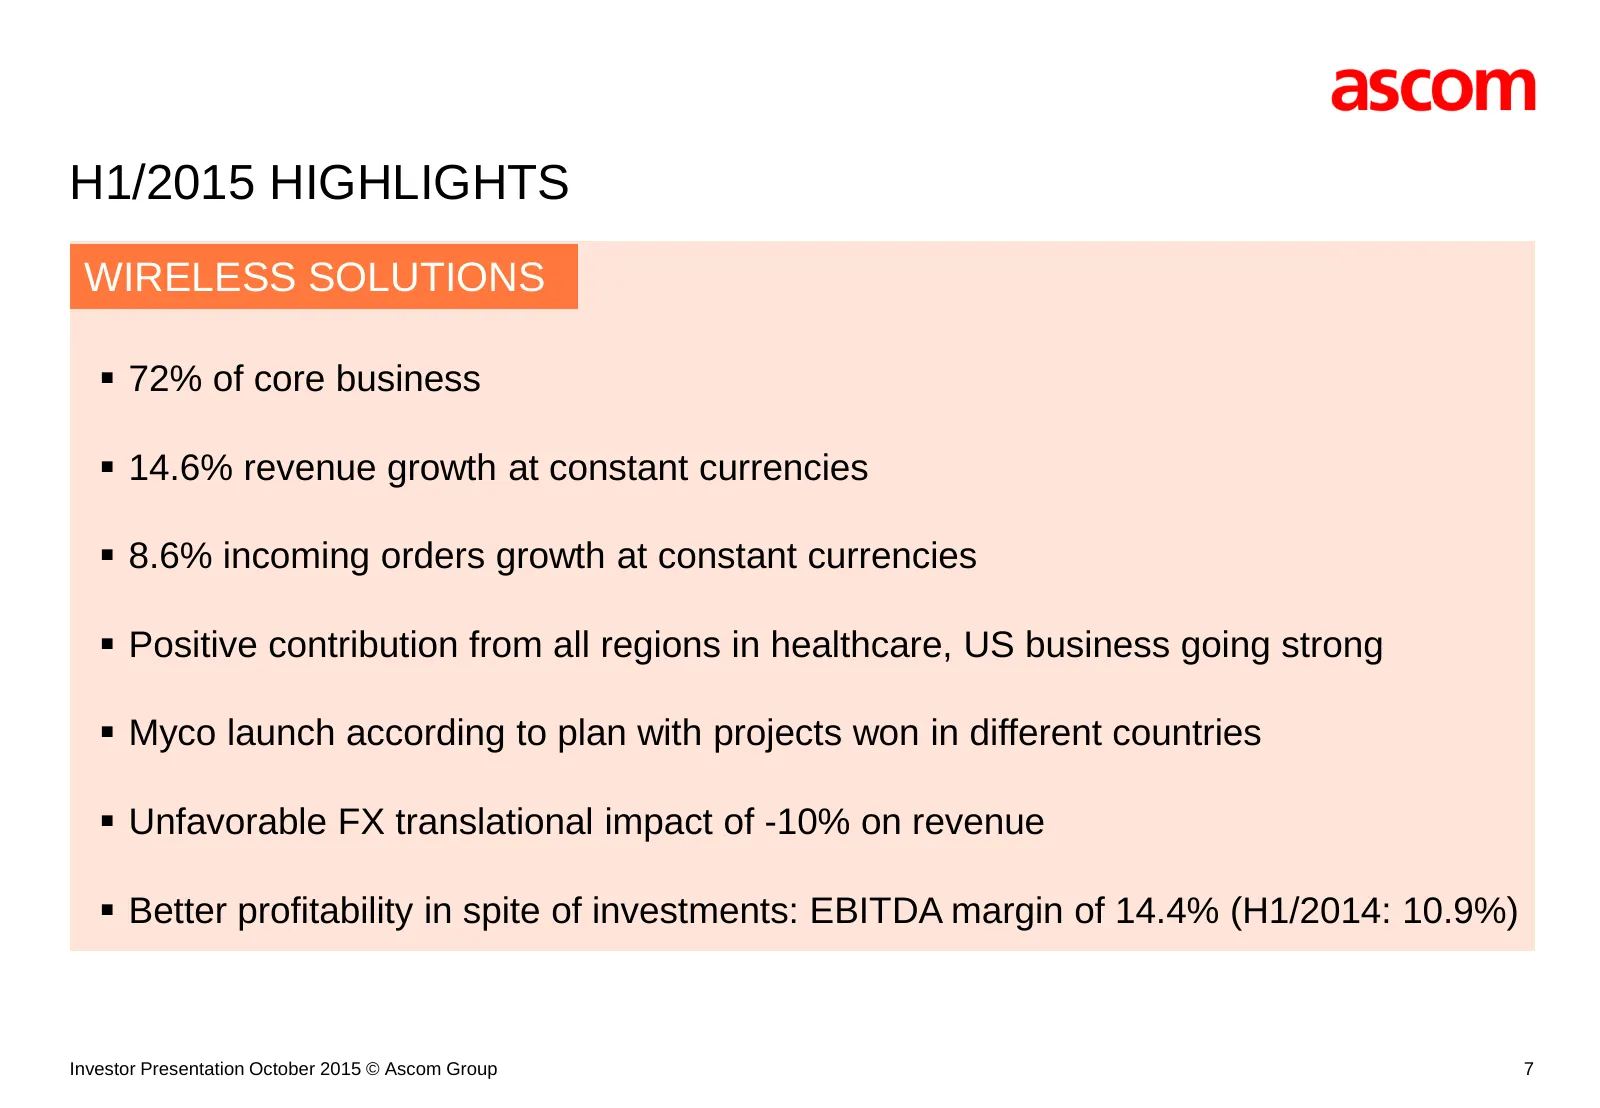
H1/2015 HIGHLIGHTS WIRELESS SOLUTIONS 72% of core business 14.6% revenue growth at constant currencies 8.6% incoming orders growth at constant currencies Positive contribution from all regions in healthcare, US business going strong Myco launch according to plan with projects won in differ
Slide 8: H1/2015 Highlights - Network Testing
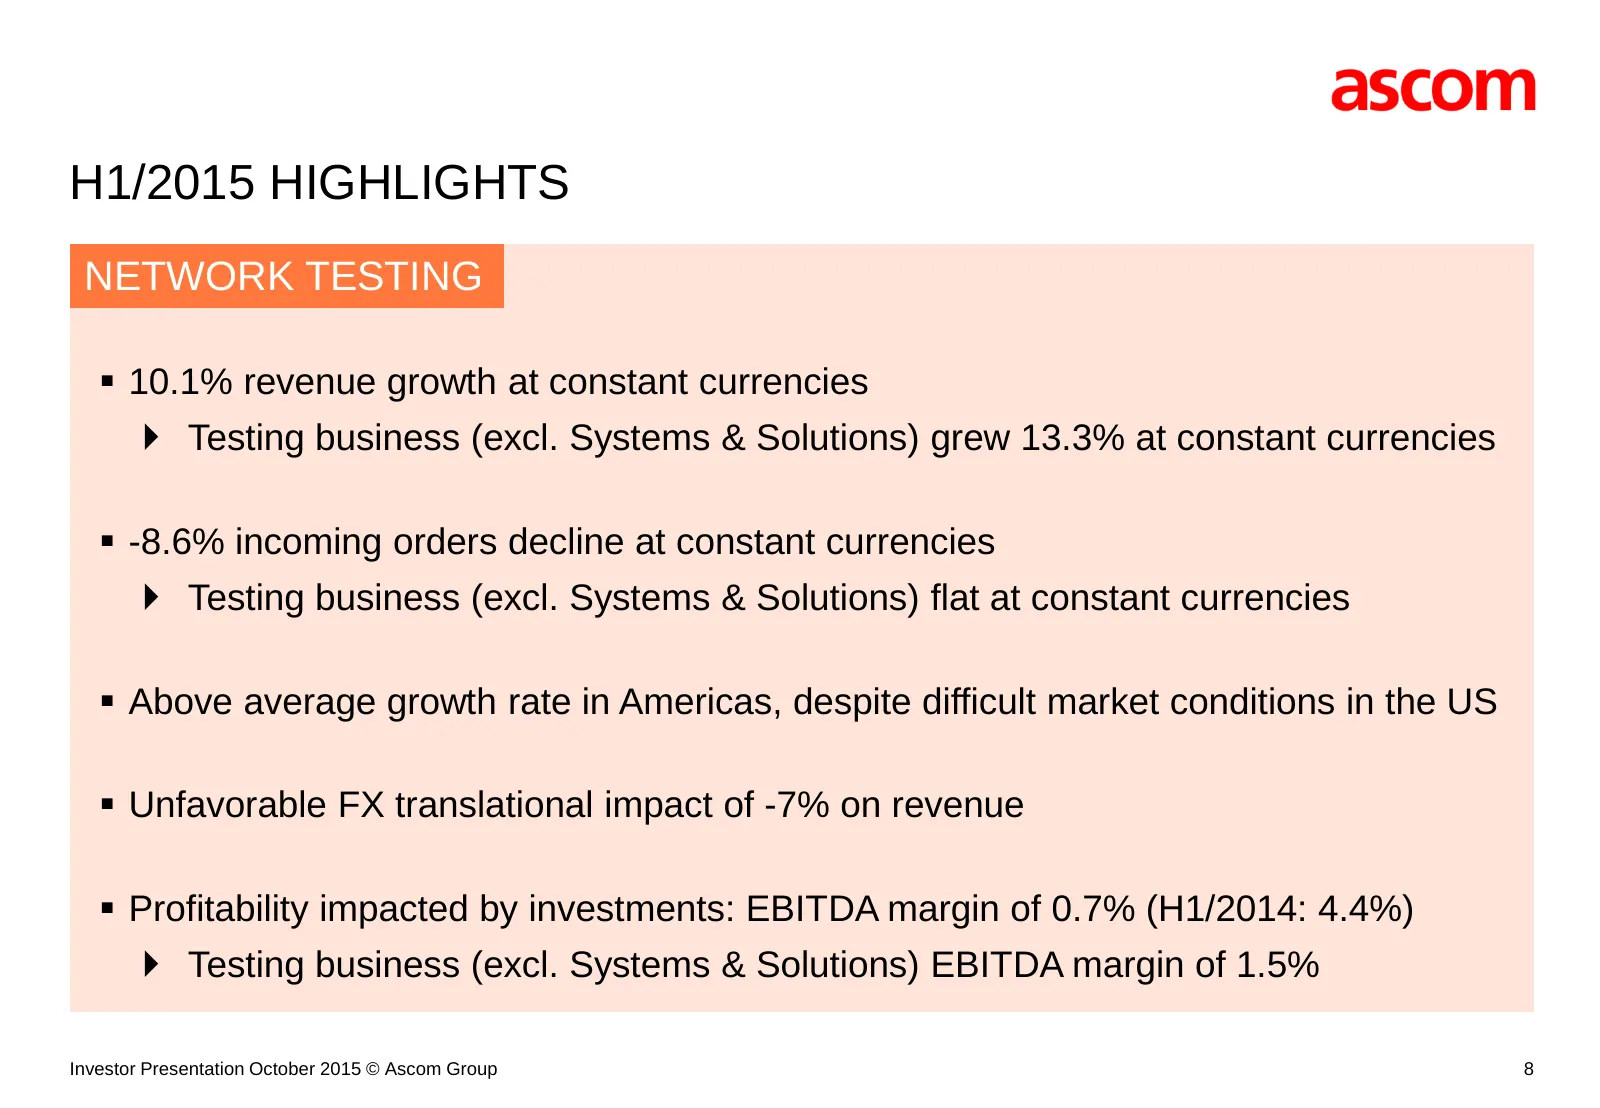
H1/2015 HIGHLIGHTS NETWORK TESTING 10.1% revenue growth at constant currencies Testing business (excl. Systems & Solutions) grew 13.3% at constant currencies -8.6% incoming orders decline at constant currencies Testing business (excl. Systems & Solutions) flat at constant currencies Above
Slide 9: Strategic Shift to Achieve Ascom 2020 Ambition
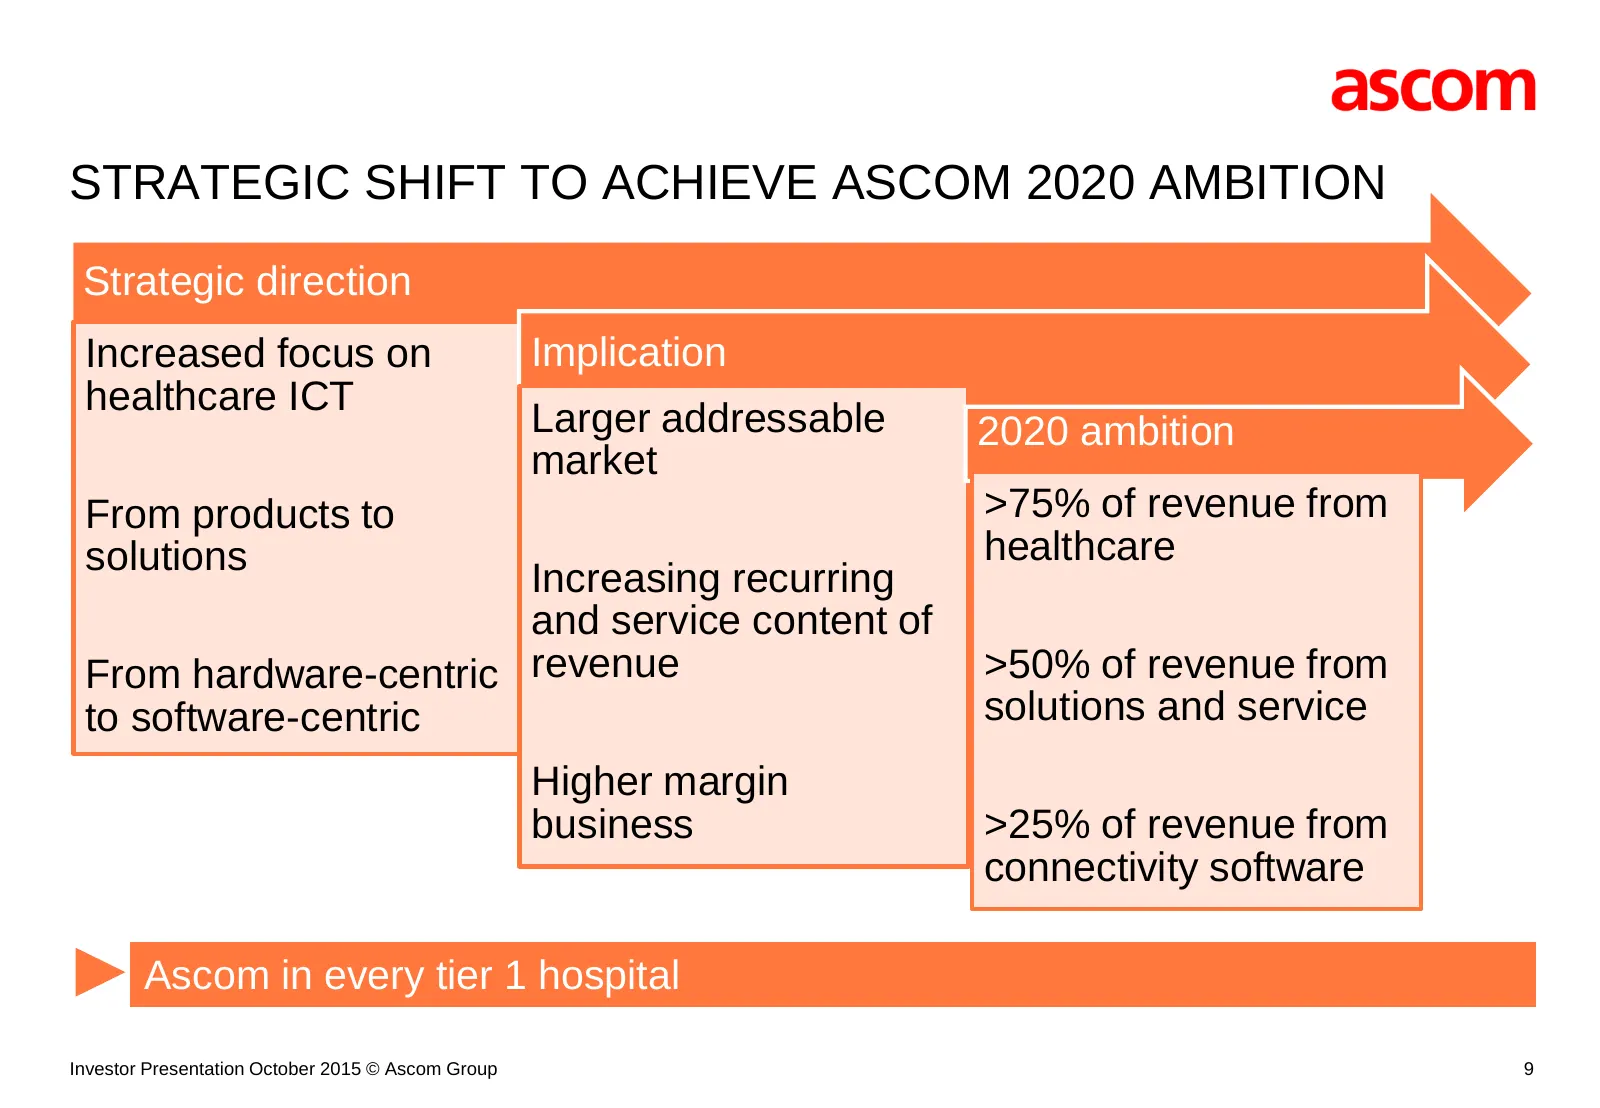
STRATEGIC SHIFT TO ACHIEVE ASCOM 2020 AMBITION Strategic direction Increased focus on Implication healthcare ICT Larger addressable 2020 ambition market From products to >75% of revenue from solutions healthcare Increasing recurring and service content of From hardware-centric revenue >50% of revenu
Slide 10: Ascom 2020 – Accelerate, Innovate, Deliver
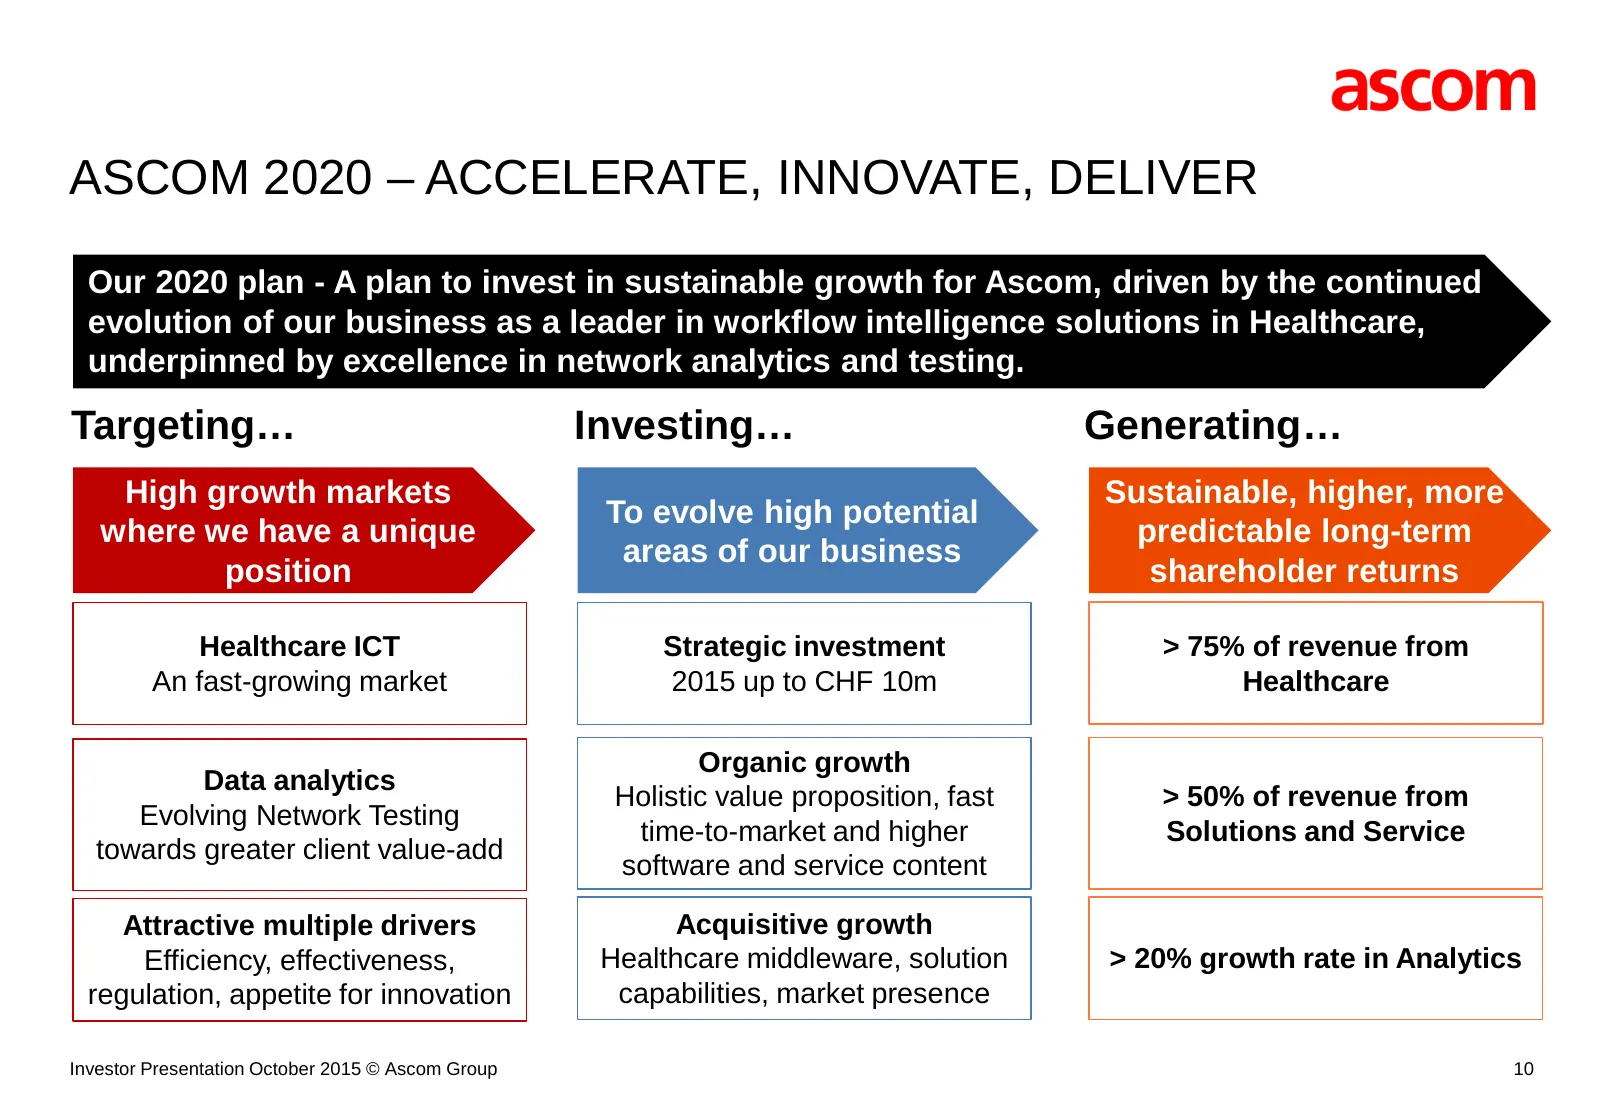
ASCOM 2020 – ACCELERATE, INNOVATE, DELIVER Our 2020 plan - A plan to invest in sustainable growth for Ascom, driven by the continued evolution of our business as a leader in workflow intelligence solutions in Healthcare, underpinned by excellence in network analytics and testing. Targeting… Investin
Slide 11: Wireless Solutions: Shift to Healthcare Workflow Solutions
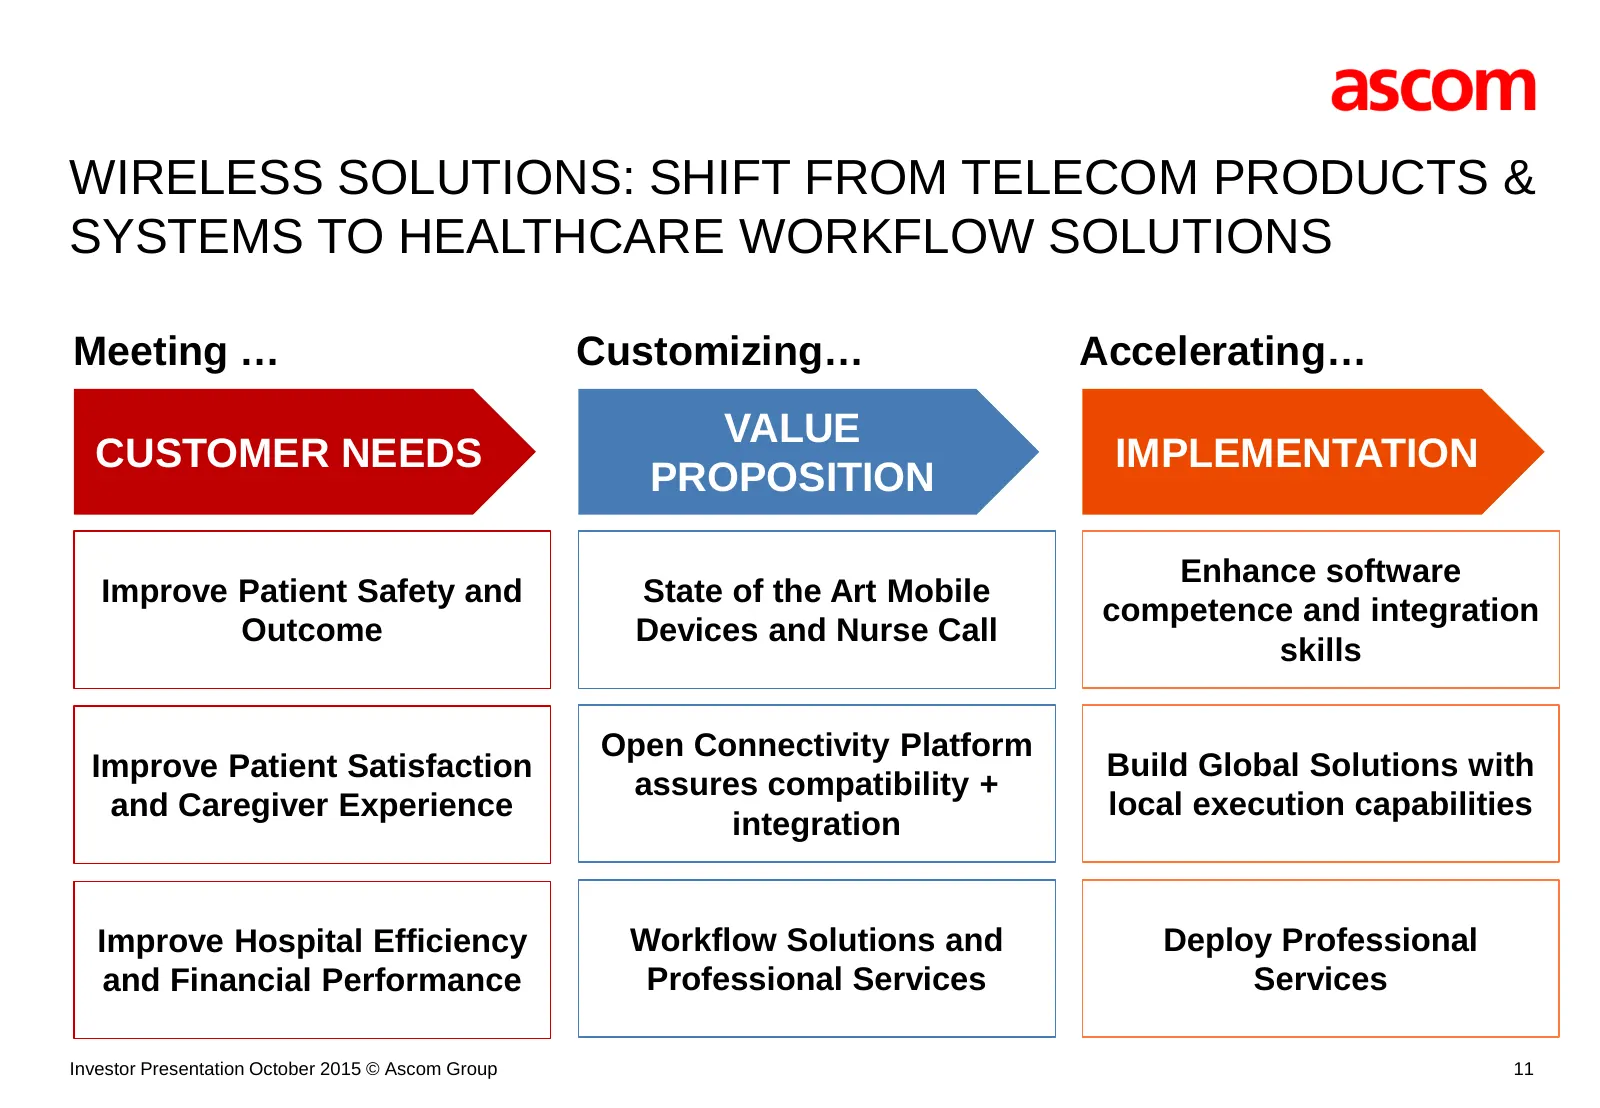
WIRELESS SOLUTIONS: SHIFT FROM TELECOM PRODUCTS & SYSTEMS TO HEALTHCARE WORKFLOW SOLUTIONS Meeting … Customizing… Accelerating… VALUE CUSTOMER NEEDS IMPLEMENTATION PROPOSITION Enhance software Improve Patient Safety and State of the Art Mobile competence and integration Outcome Devices and Nurse Cal
Slide 12: Network Testing: Solidify Core While Accelerating Analytics
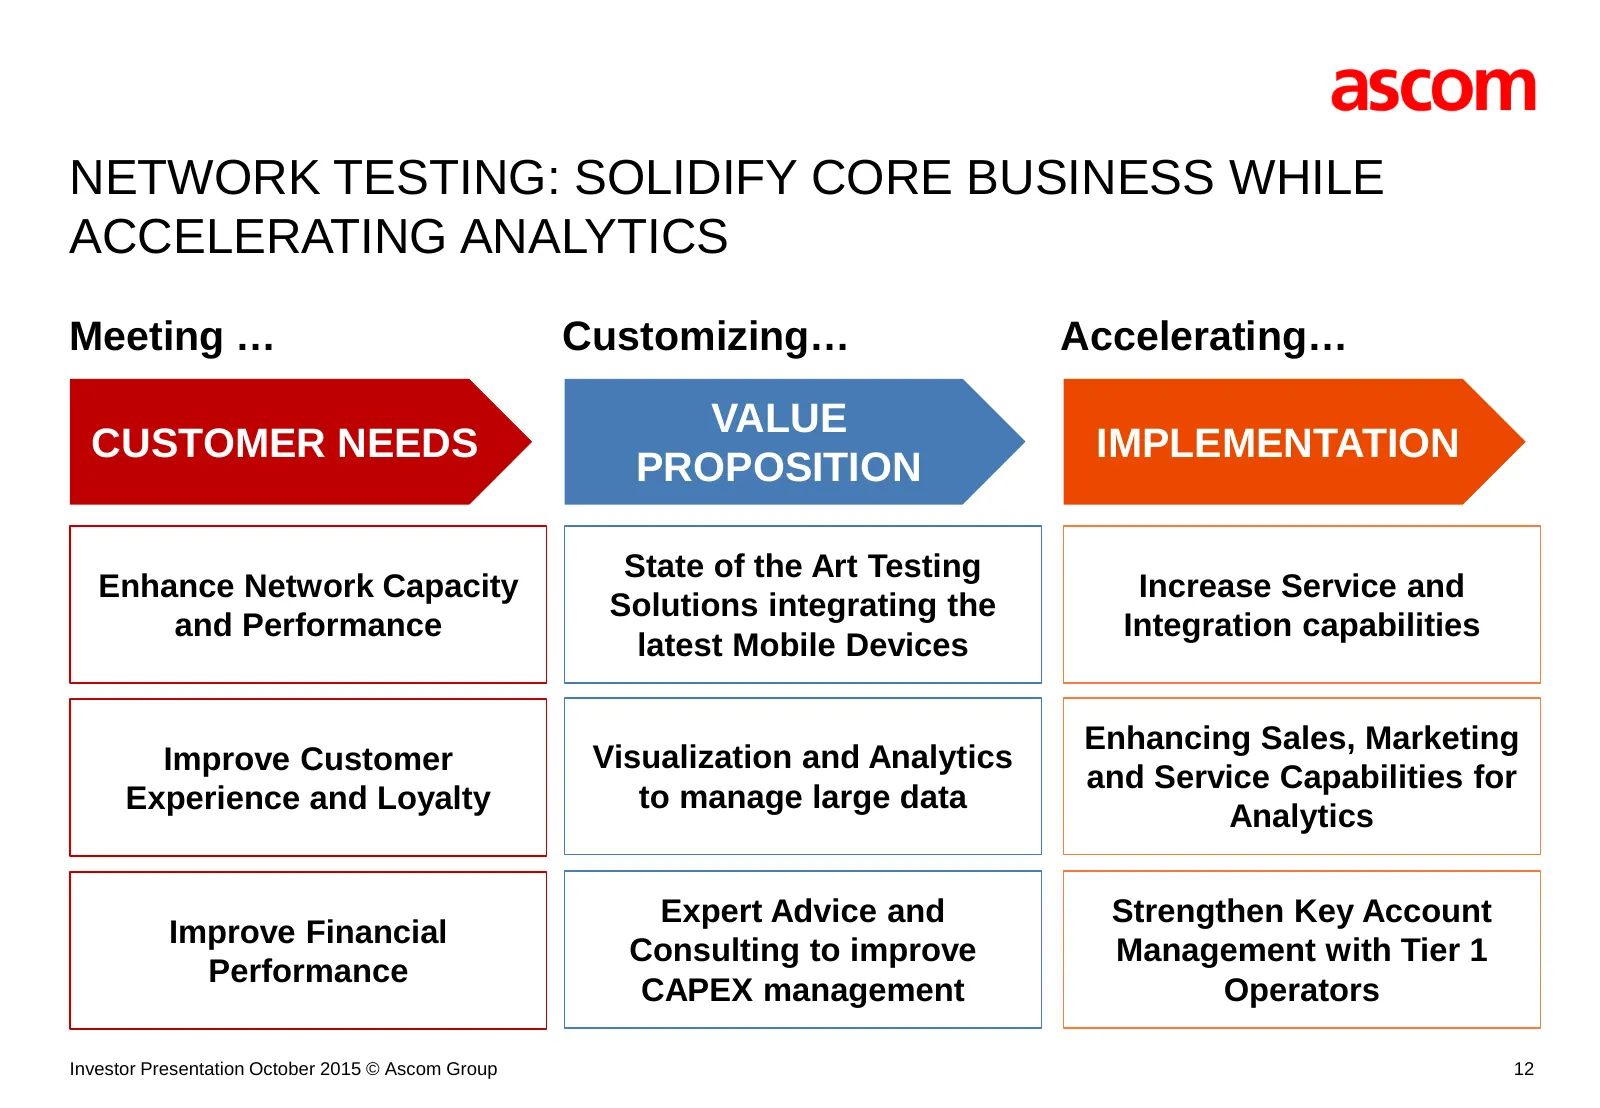
NETWORK TESTING: SOLIDIFY CORE BUSINESS WHILE ACCELERATING ANALYTICS Meeting … Customizing… Accelerating… VALUE CUSTOMER NEEDS IMPLEMENTATION PROPOSITION State of the Art Testing Enhance Network Capacity Increase Service and Solutions integrating the and Performance Integration capabilities latest M
Slide 13: Quick Return from Investments into Solutions, Software and Services
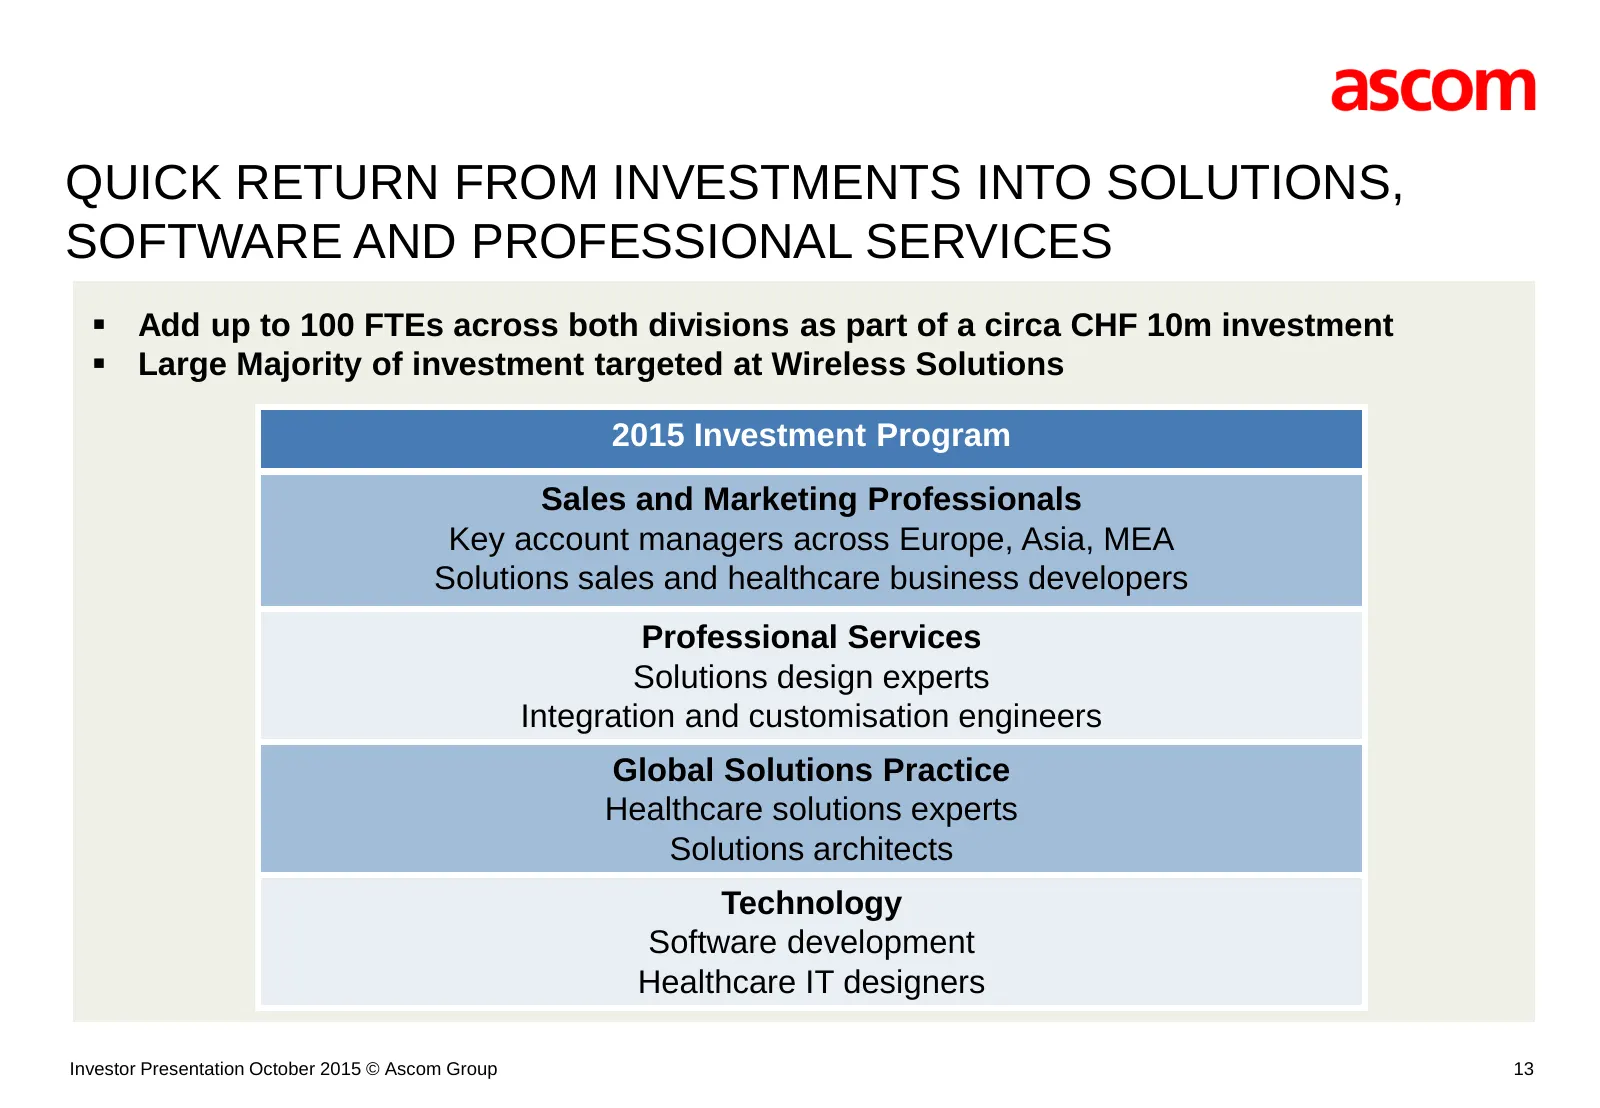
QUICK RETURN FROM INVESTMENTS INTO SOLUTIONS, SOFTWARE AND PROFESSIONAL SERVICES Add up to 100 FTEs across both divisions as part of a circa CHF 10m investment Large Majority of investment targeted at Wireless Solutions 2015 Investment Program Sales and Marketing Professionals Key account manage
Slide 14: Status of 2015 Investment Program
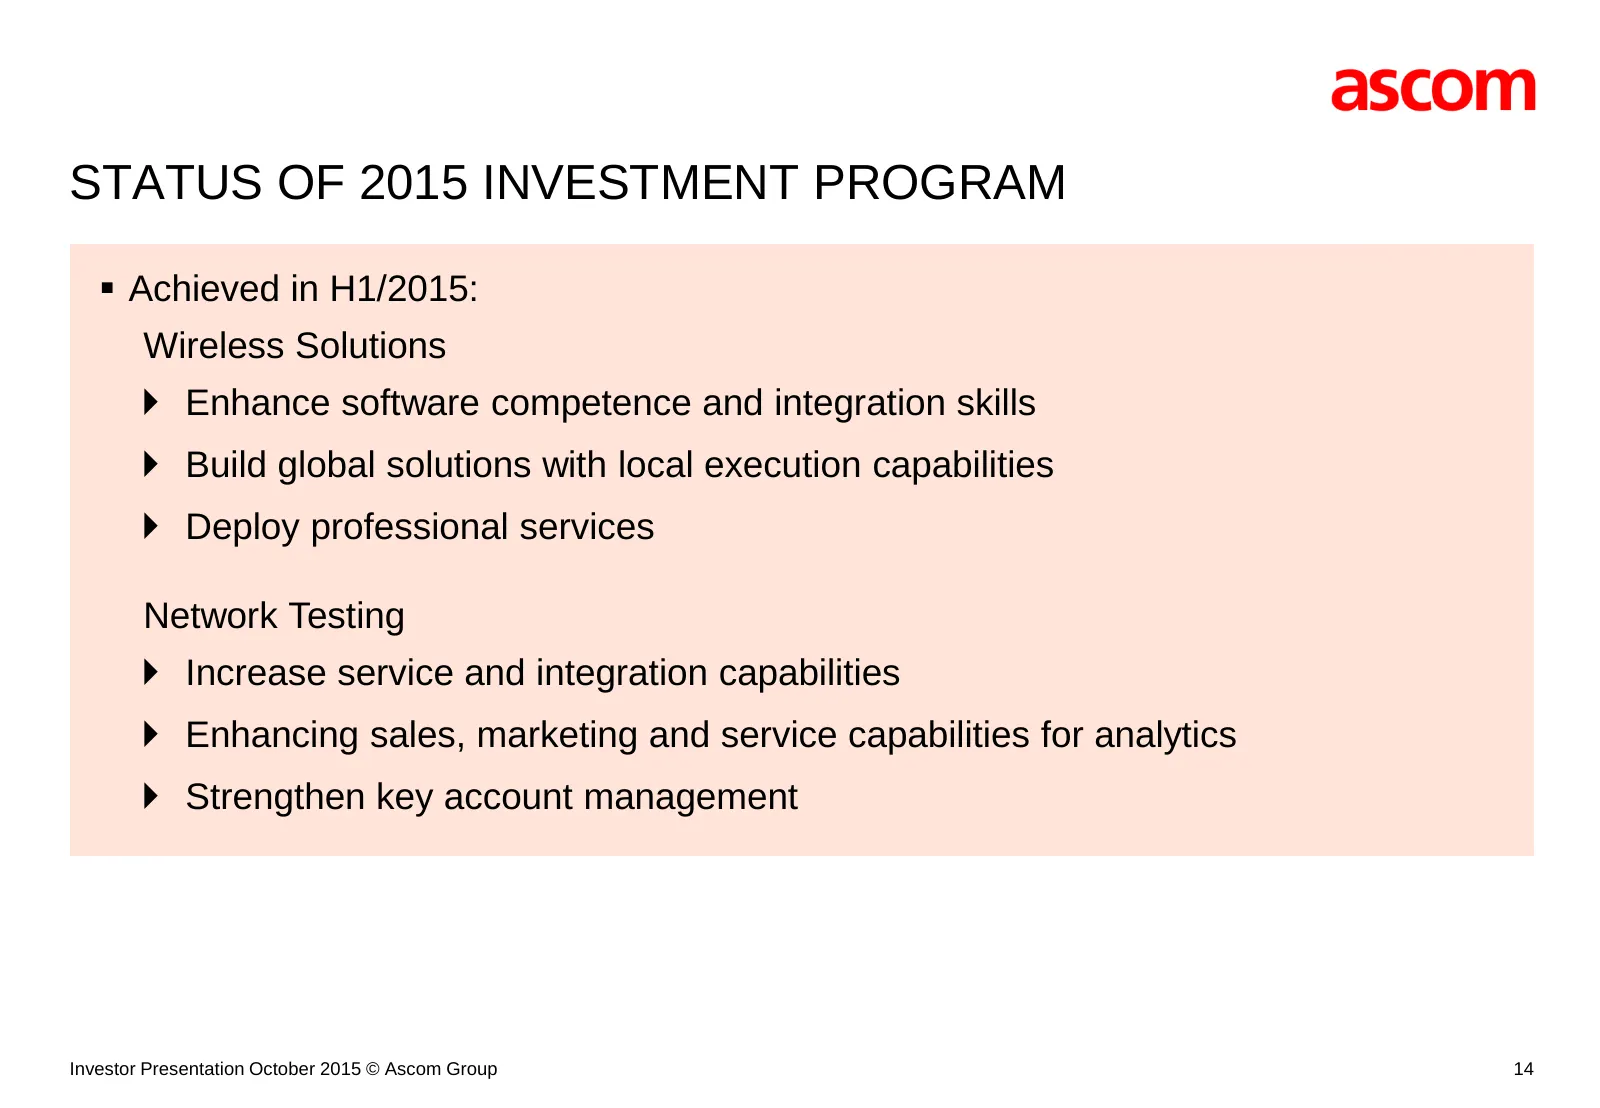
STATUS OF 2015 INVESTMENT PROGRAM Achieved in H1/2015: Wireless Solutions Enhance software competence and integration skills Build global solutions with local execution capabilities Deploy professional services Network Testing Increase service and integration capabilities Enhancing sales
Slide 15: Wireless Solutions Strategy Update
WIRELESS SOLUTIONS STRATEGY UPDATE 15
Slide 16: Ascom with Strong Momentum in Healthcare
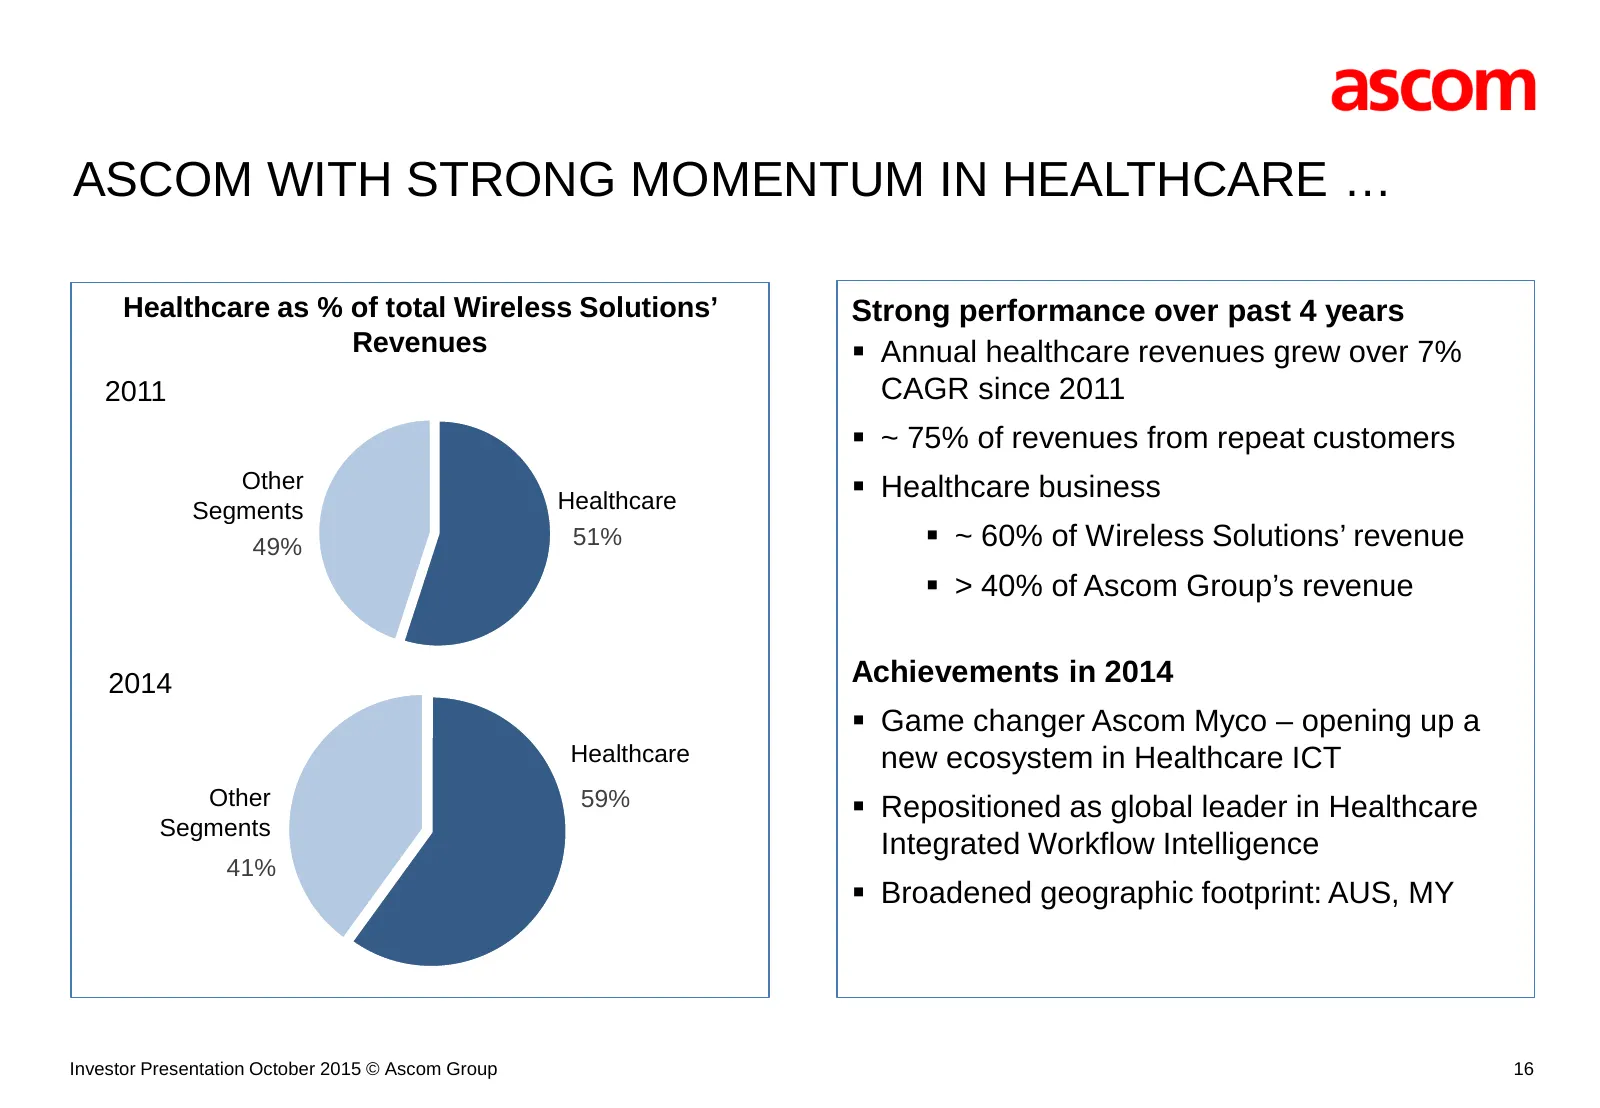
ASCOM WITH STRONG MOMENTUM IN HEALTHCARE … Healthcare as % of total Wireless Solutions’ Strong performance over past 4 years Revenues Annual healthcare revenues grew over 7% 2011 CAGR since 2011 ~ 75% of revenues from repeat customers Other Healthcare Healthcare business Segments 49% 51% ~ 6
Slide 17: ... As Well As in Software, Services and Solutions
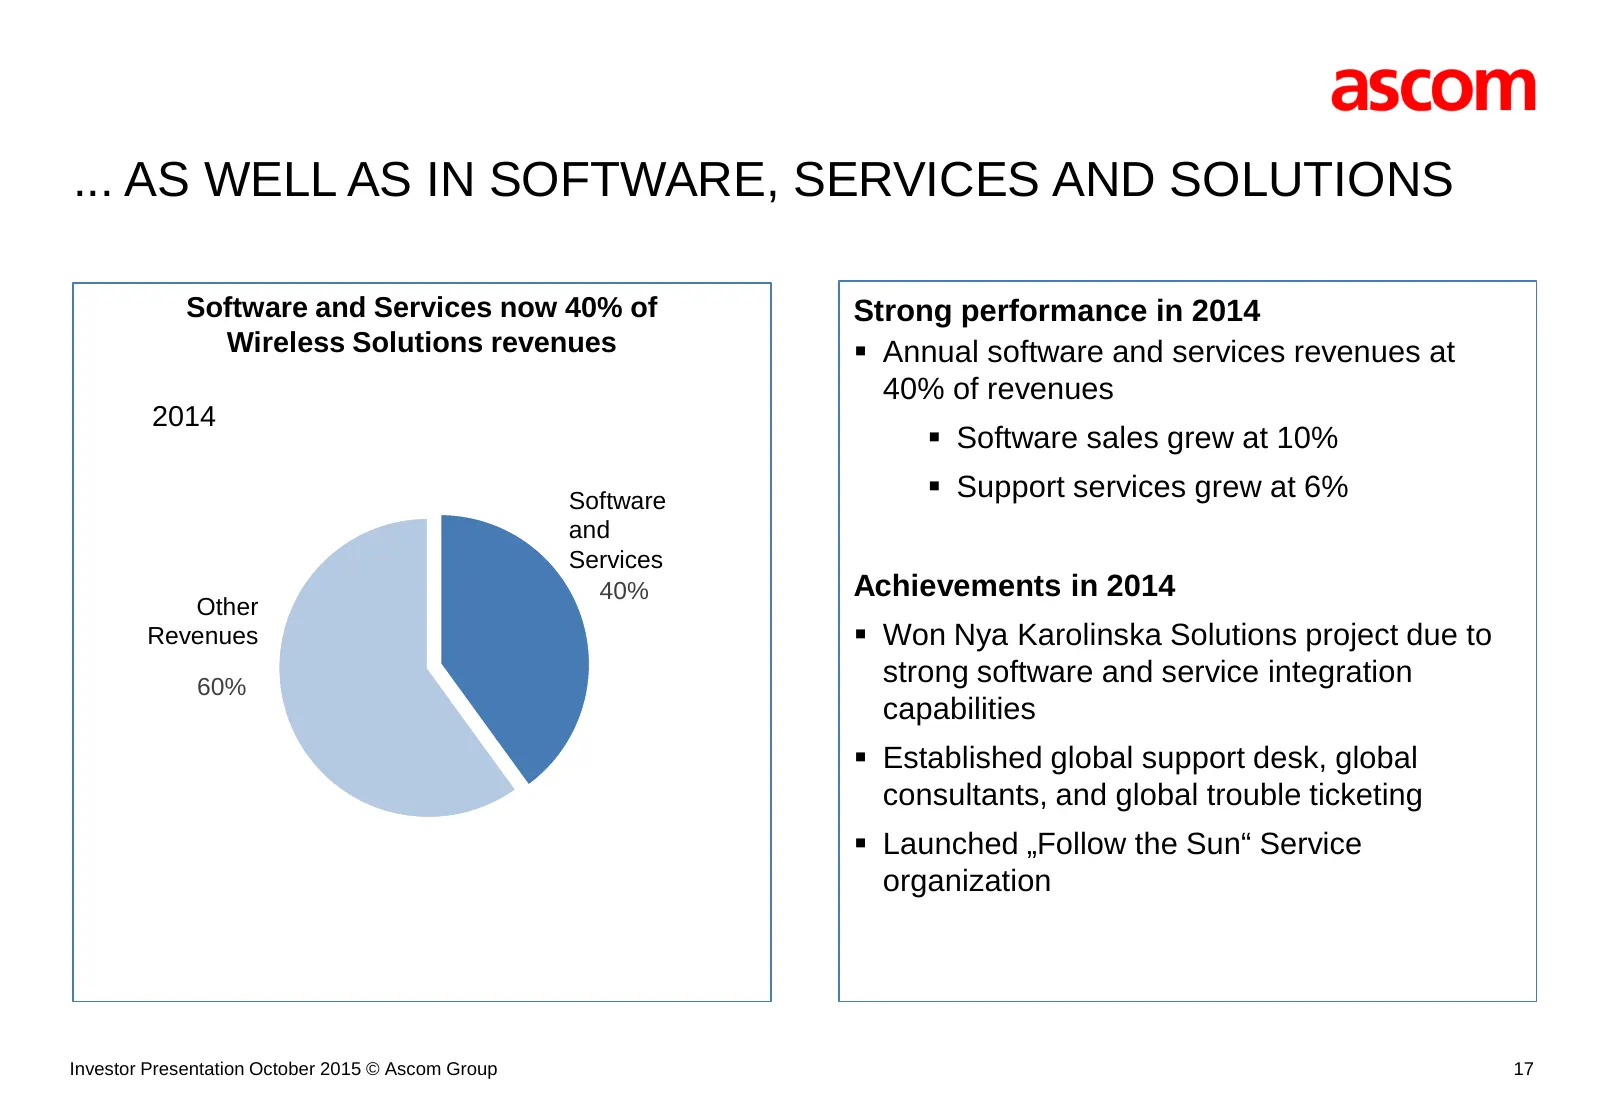
... AS WELL AS IN SOFTWARE, SERVICES AND SOLUTIONS Software and Services now 40% of Strong performance in 2014 Wireless Solutions revenues Annual software and services revenues at 40% of revenues 2014 Software sales grew at 10% Software Support services grew at 6% and Services 40% Achievements
Slide 18: Combination of Strong Trends Result in Emerging Hospital Needs
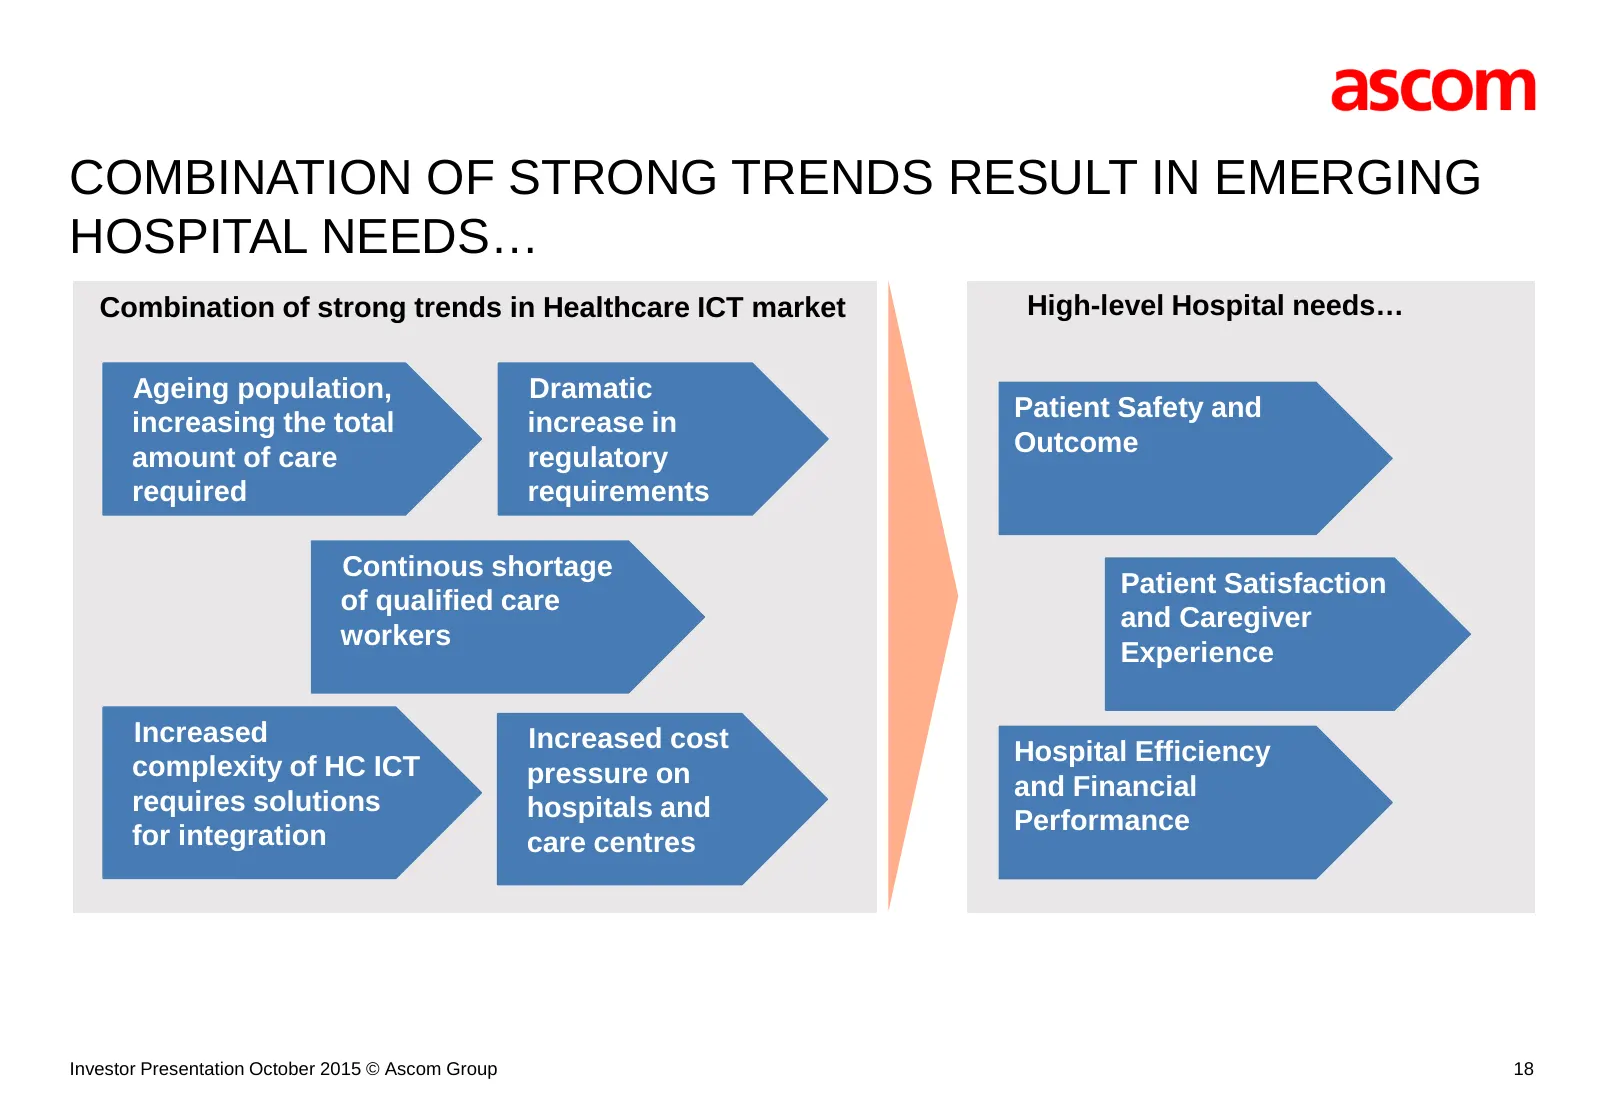
COMBINATION OF STRONG TRENDS RESULT IN EMERGING HOSPITAL NEEDS… Combination of strong trends in Healthcare ICT market High-level Hospital needs… Ageing population, Dramatic Patient Safety and increasing the total increase in Outcome amount of care regulatory required requirements Continous shortage
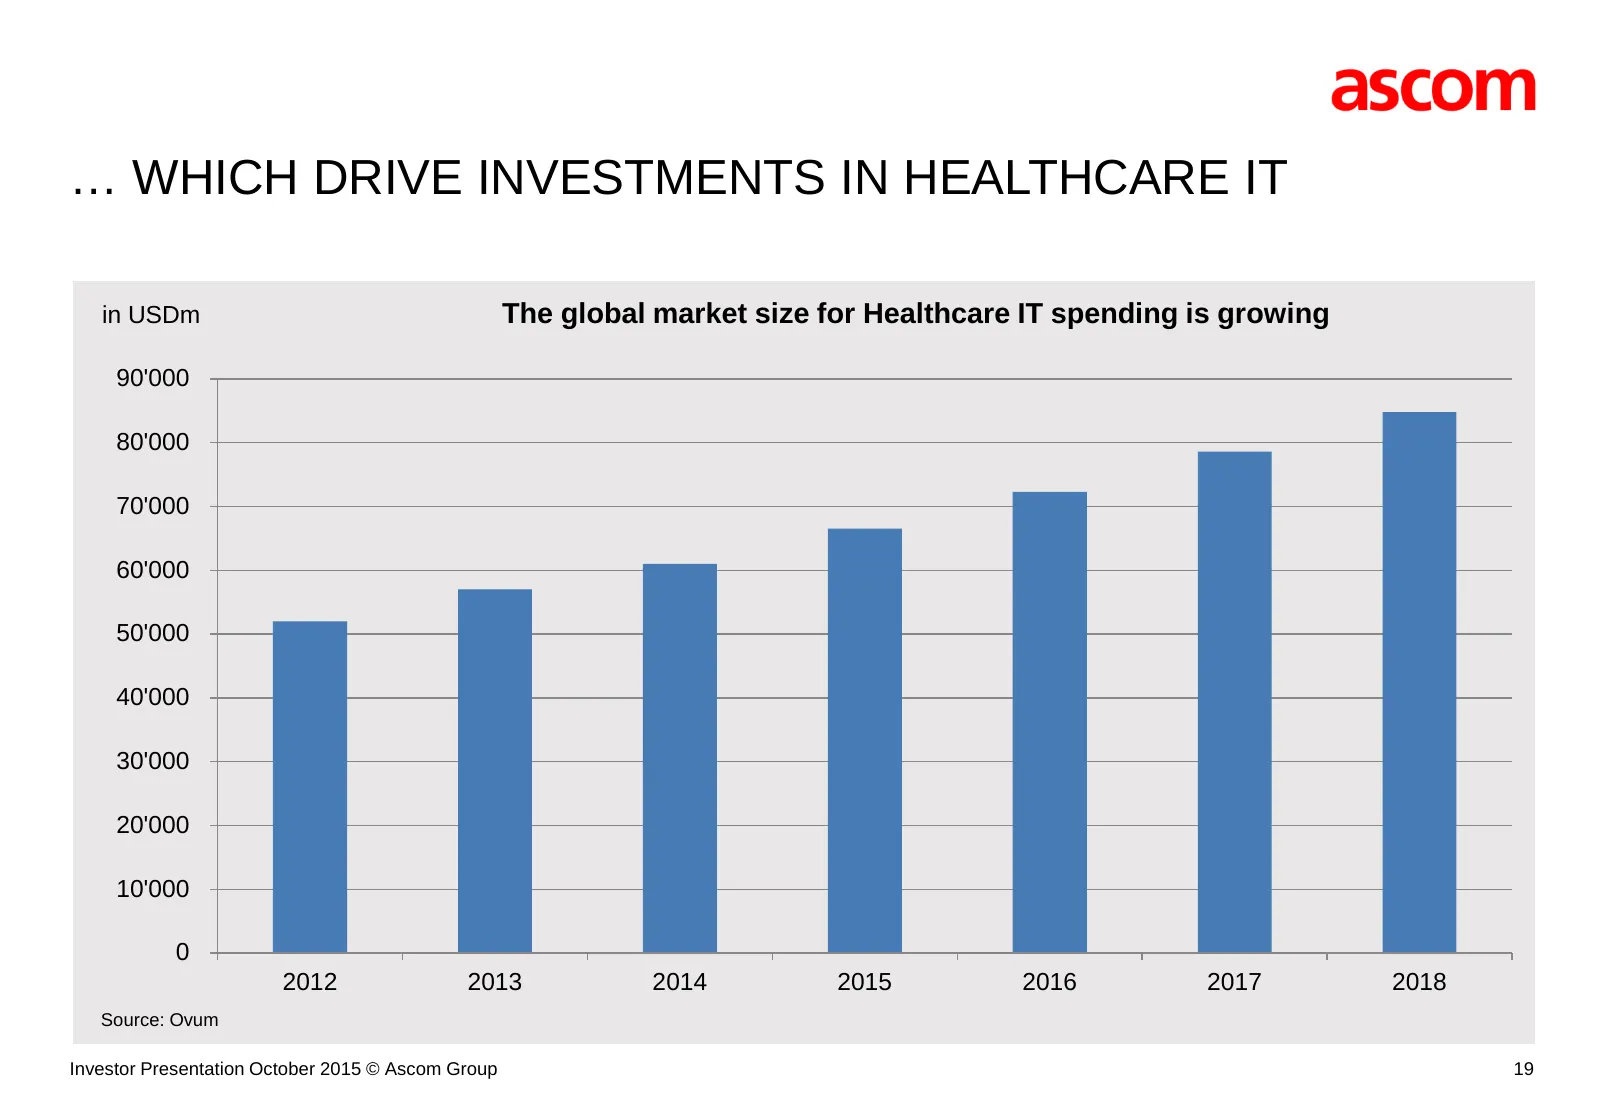
Slide 19: Which Drive Investments in Healthcare IT
… WHICH DRIVE INVESTMENTS IN HEALTHCARE IT in USDm The global market size for Healthcare IT spending is growing 90'000 80'000 70'000 60'000 50'000 40'000 30'000 20'000 10'000 0 2012 2013 2014 2015 2016 2017 2018 Source: Ovum Investor Presentation October 2015 © Ascom Group 19
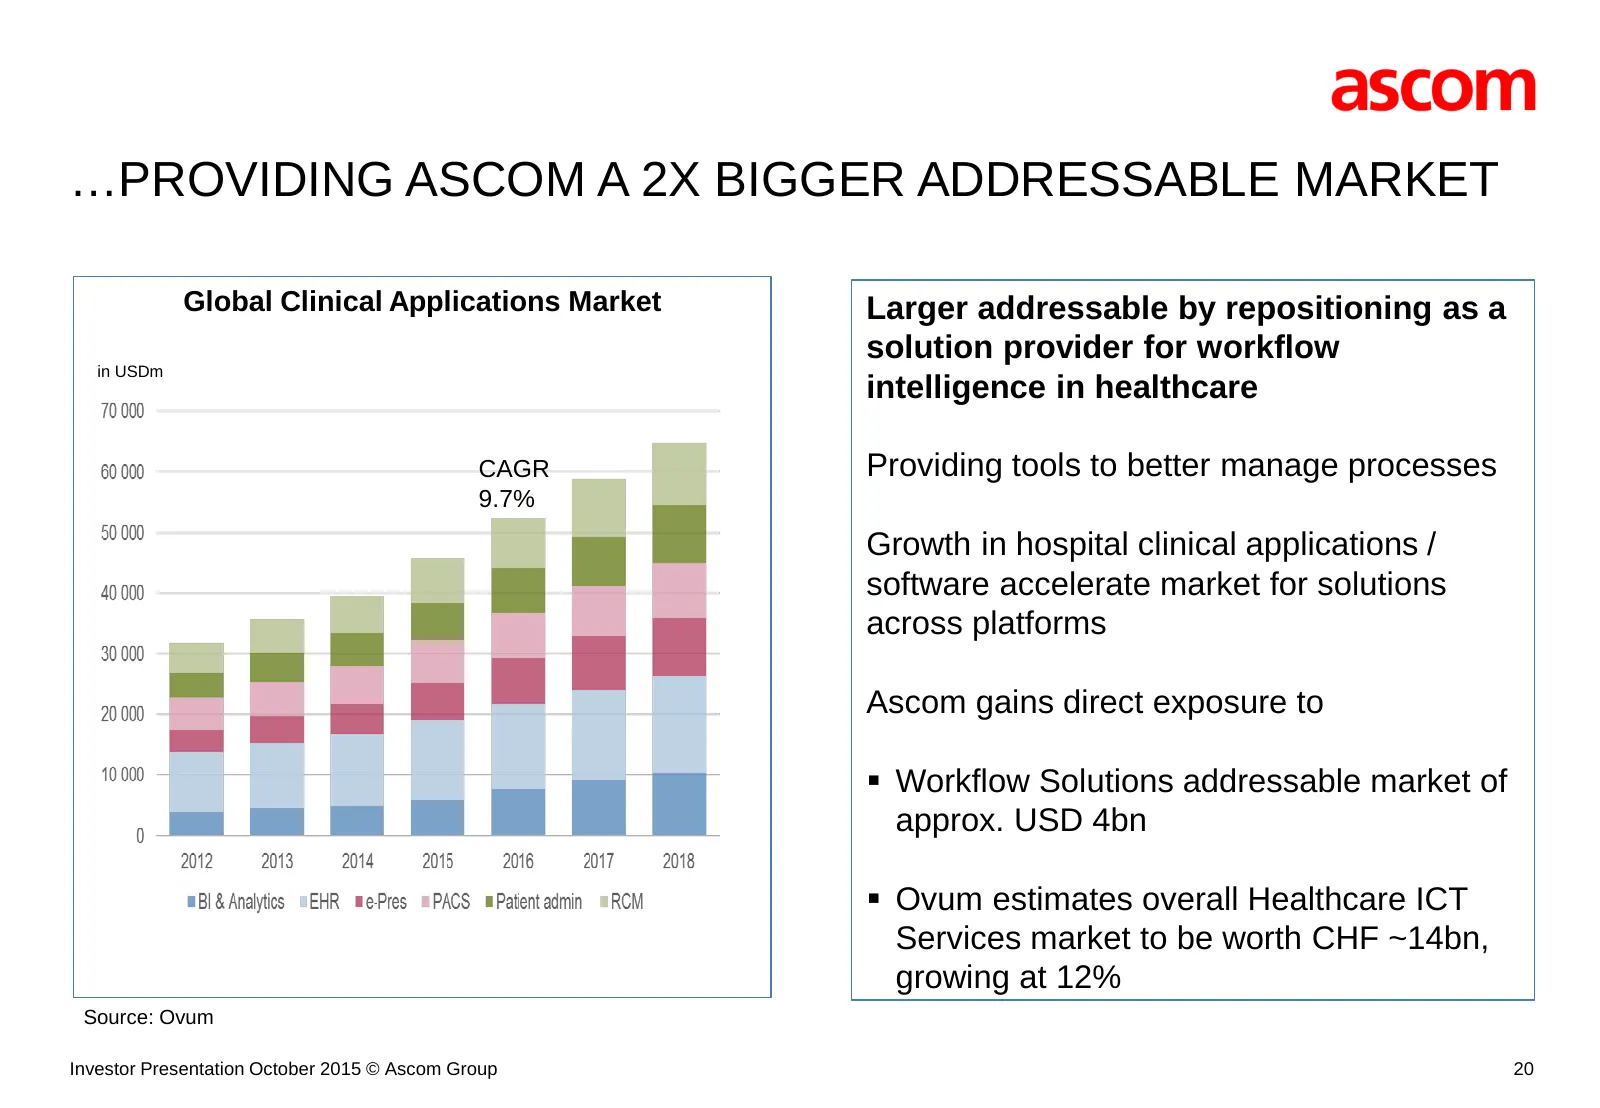
Slide 20: Providing Ascom a 2x Bigger Addressable Market
…PROVIDING ASCOM A 2X BIGGER ADDRESSABLE MARKET Global Clinical Applications Market Larger addressable by repositioning as a solution provider for workflow MUSD in USDm intelligence in healthcare CAGR Providing tools to better manage processes 9.7% Growth in hospital clinical applications / software
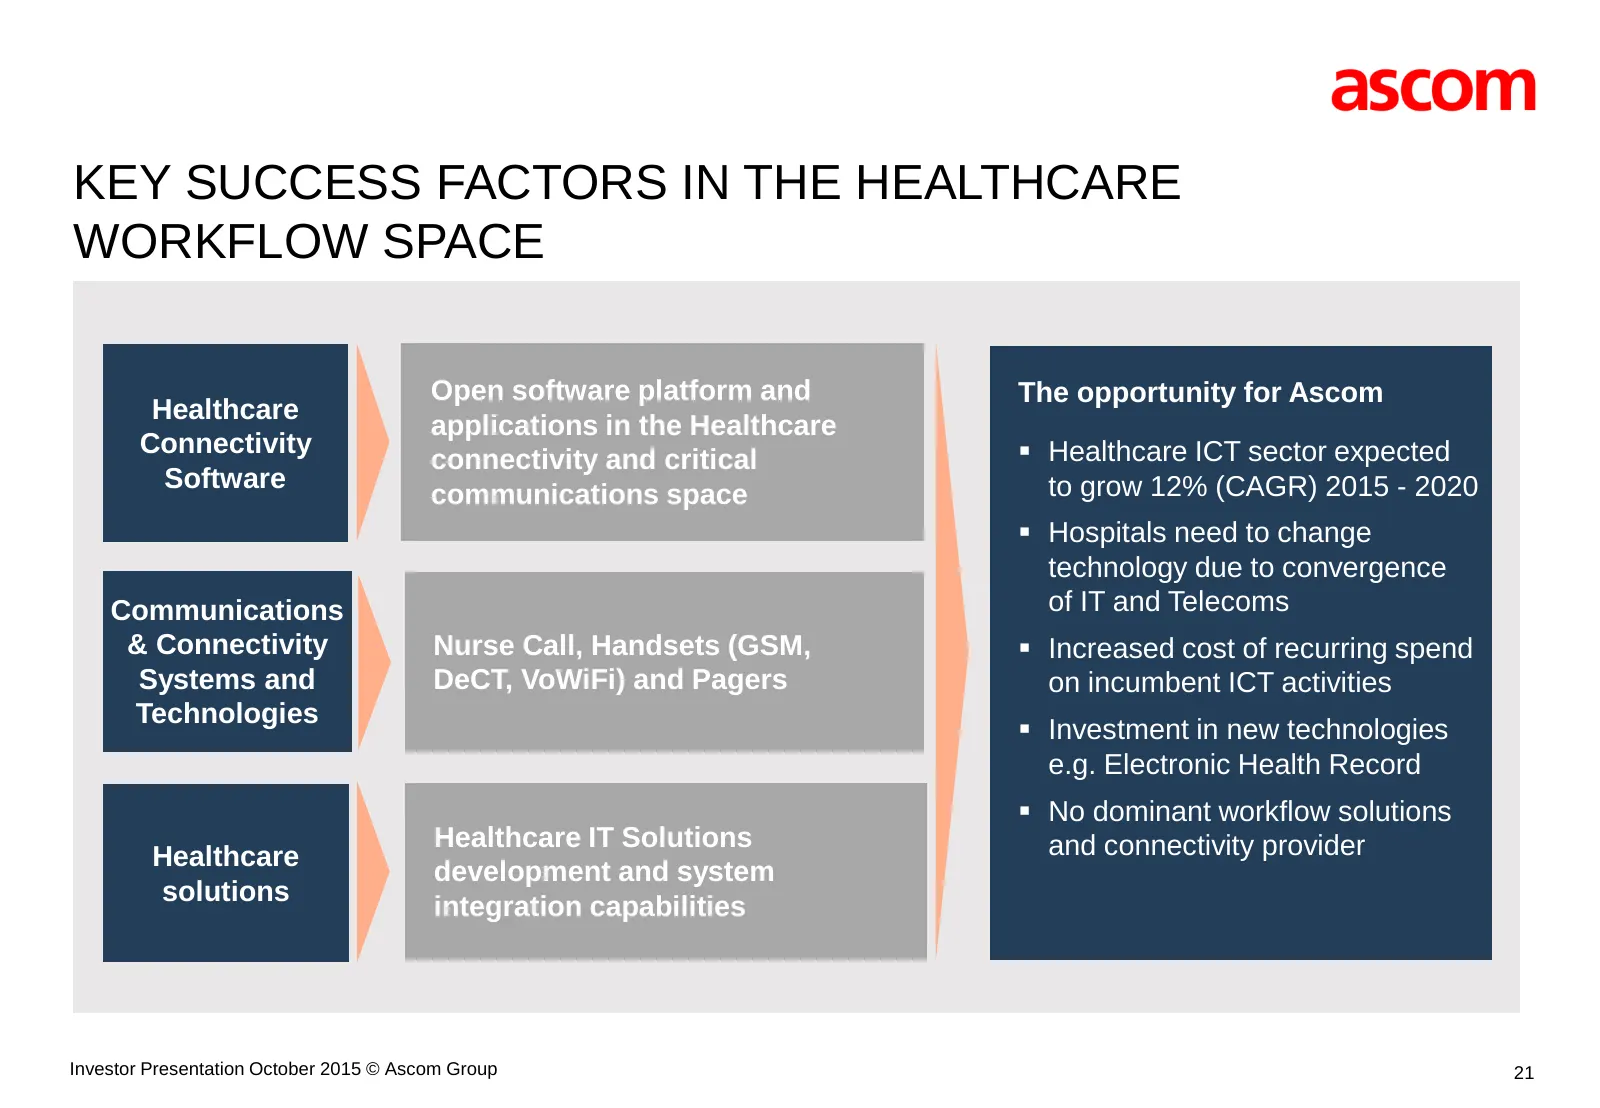
Slide 21: Key Success Factors in the Healthcare Workflow Space
KEY SUCCESS FACTORS IN THE HEALTHCARE WORKFLOW SPACE Open software platform and The opportunity for Ascom Healthcare applications in the Healthcare Connectivity Healthcare ICT sector expected connectivity and critical Software to grow 12% (CAGR) 2015 - 2020 communications space Hospitals need to
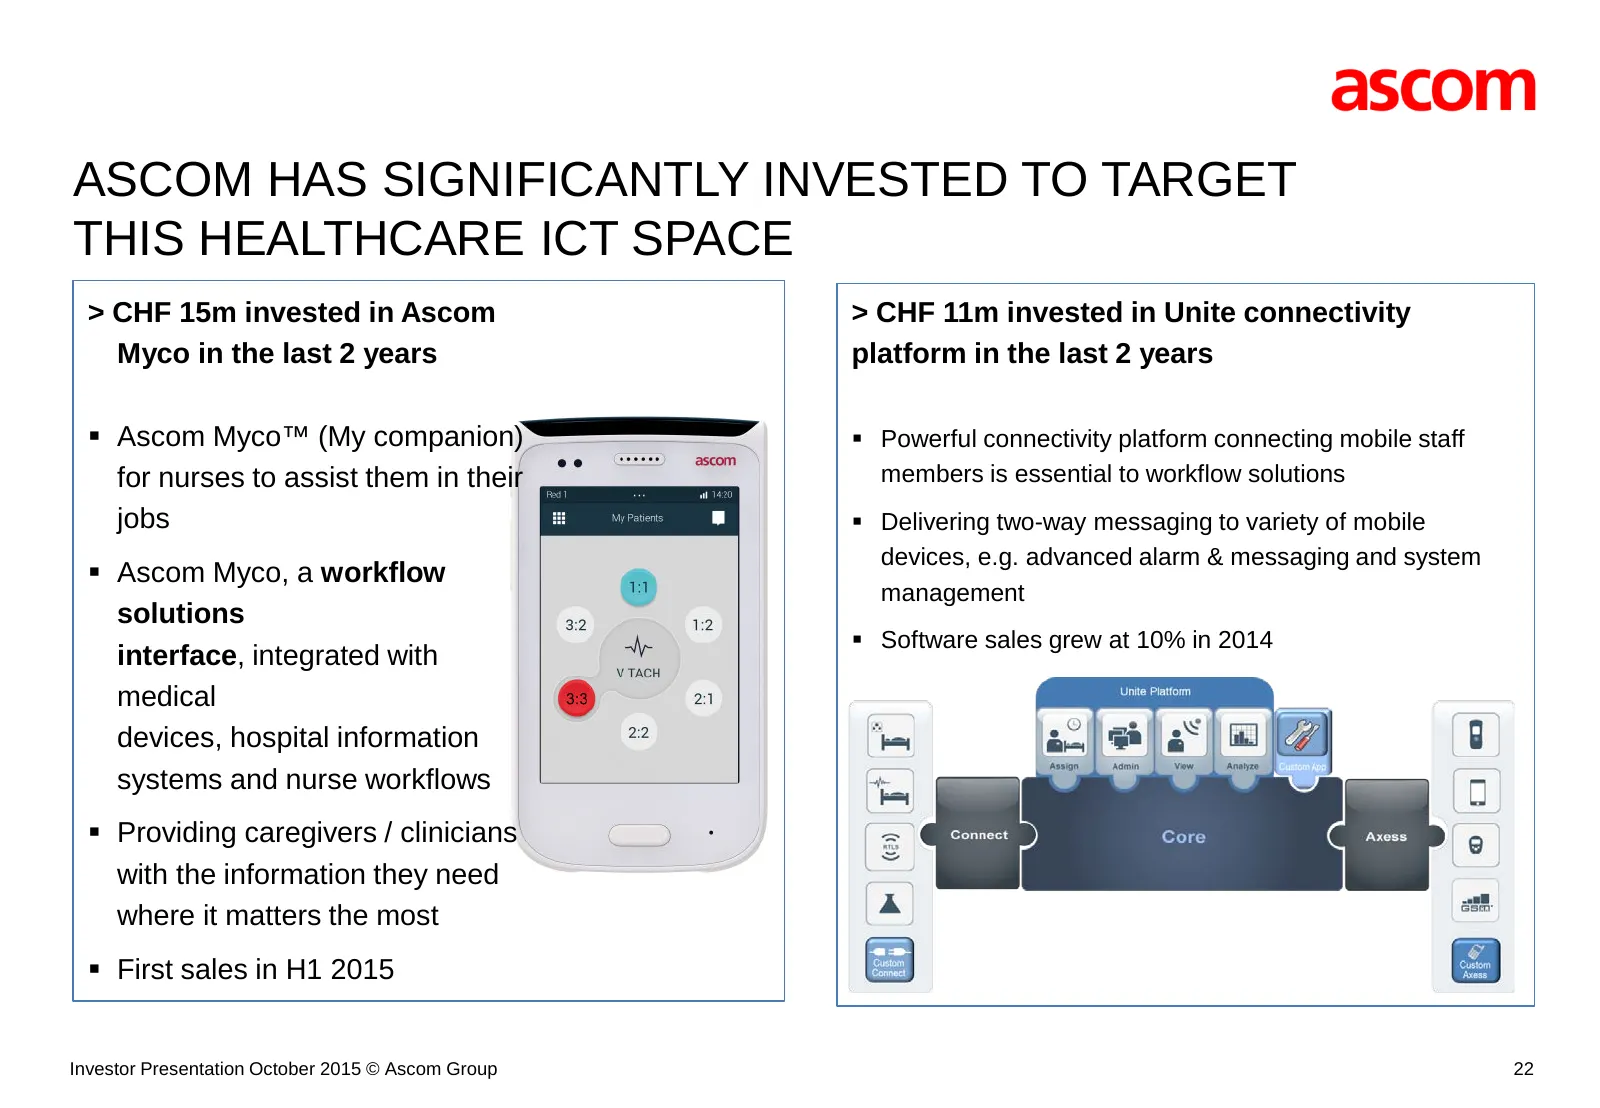
Slide 22: Ascom Has Significantly Invested to Target Healthcare ICT Space
ASCOM HAS SIGNIFICANTLY INVESTED TO TARGET THIS HEALTHCARE ICT SPACE > CHF 15m invested in Ascom > CHF 11m invested in Unite connectivity Myco in the last 2 years platform in the last 2 years Ascom Myco™ (My companion) Powerful connectivity platform connecting mobile staff for nurses to assist t
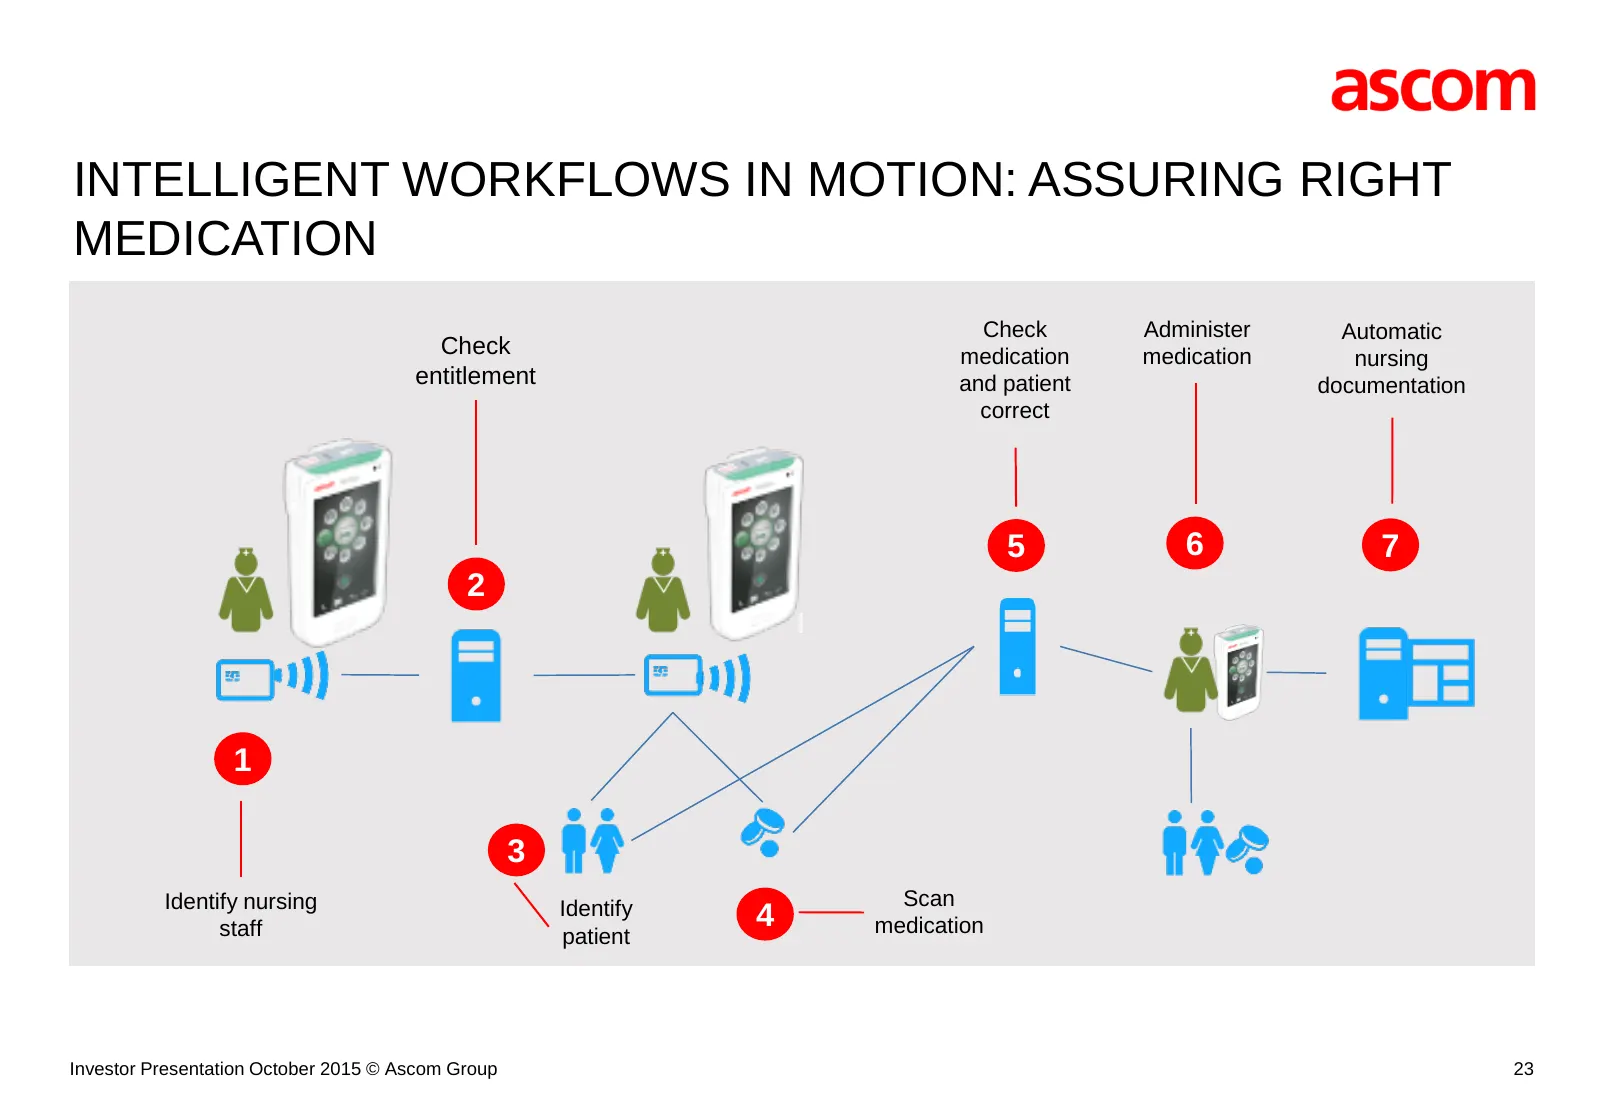
Slide 23: Intelligent Workflows in Motion: Assuring Right Medication
INTELLIGENT WORKFLOWS IN MOTION: ASSURING RIGHT MEDICATION Check Administer Automatic Check medication medication nursing entitlement and patient documentation correct 5 6 7 2 I 1 3 Identify nursing Identify Scan staff 4 medication patient Investor Presentation October 2015 © Ascom Group 23
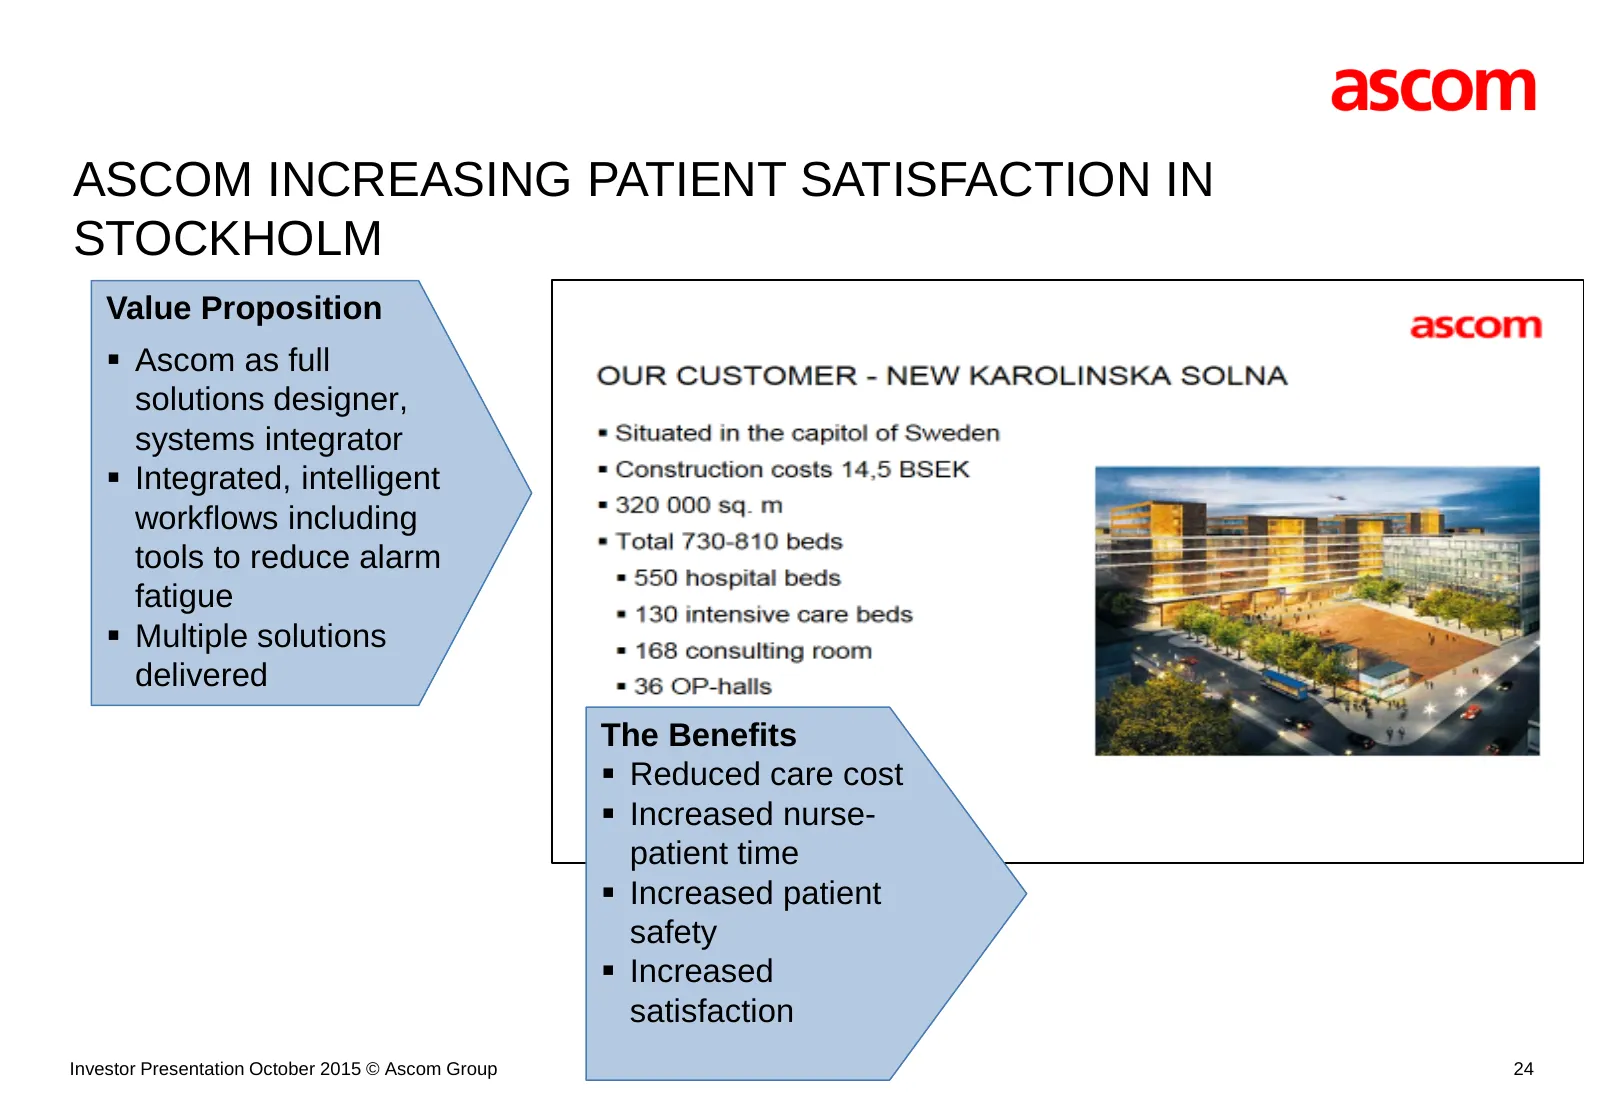
Slide 24: Ascom Increasing Patient Satisfaction in Stockholm
ASCOM INCREASING PATIENT SATISFACTION IN STOCKHOLM Value Proposition Ascom as full solutions designer, systems integrator Integrated, intelligent workflows including tools to reduce alarm fatigue Multiple solutions delivered The Benefits Reduced care cost Increased nurse- patient time In
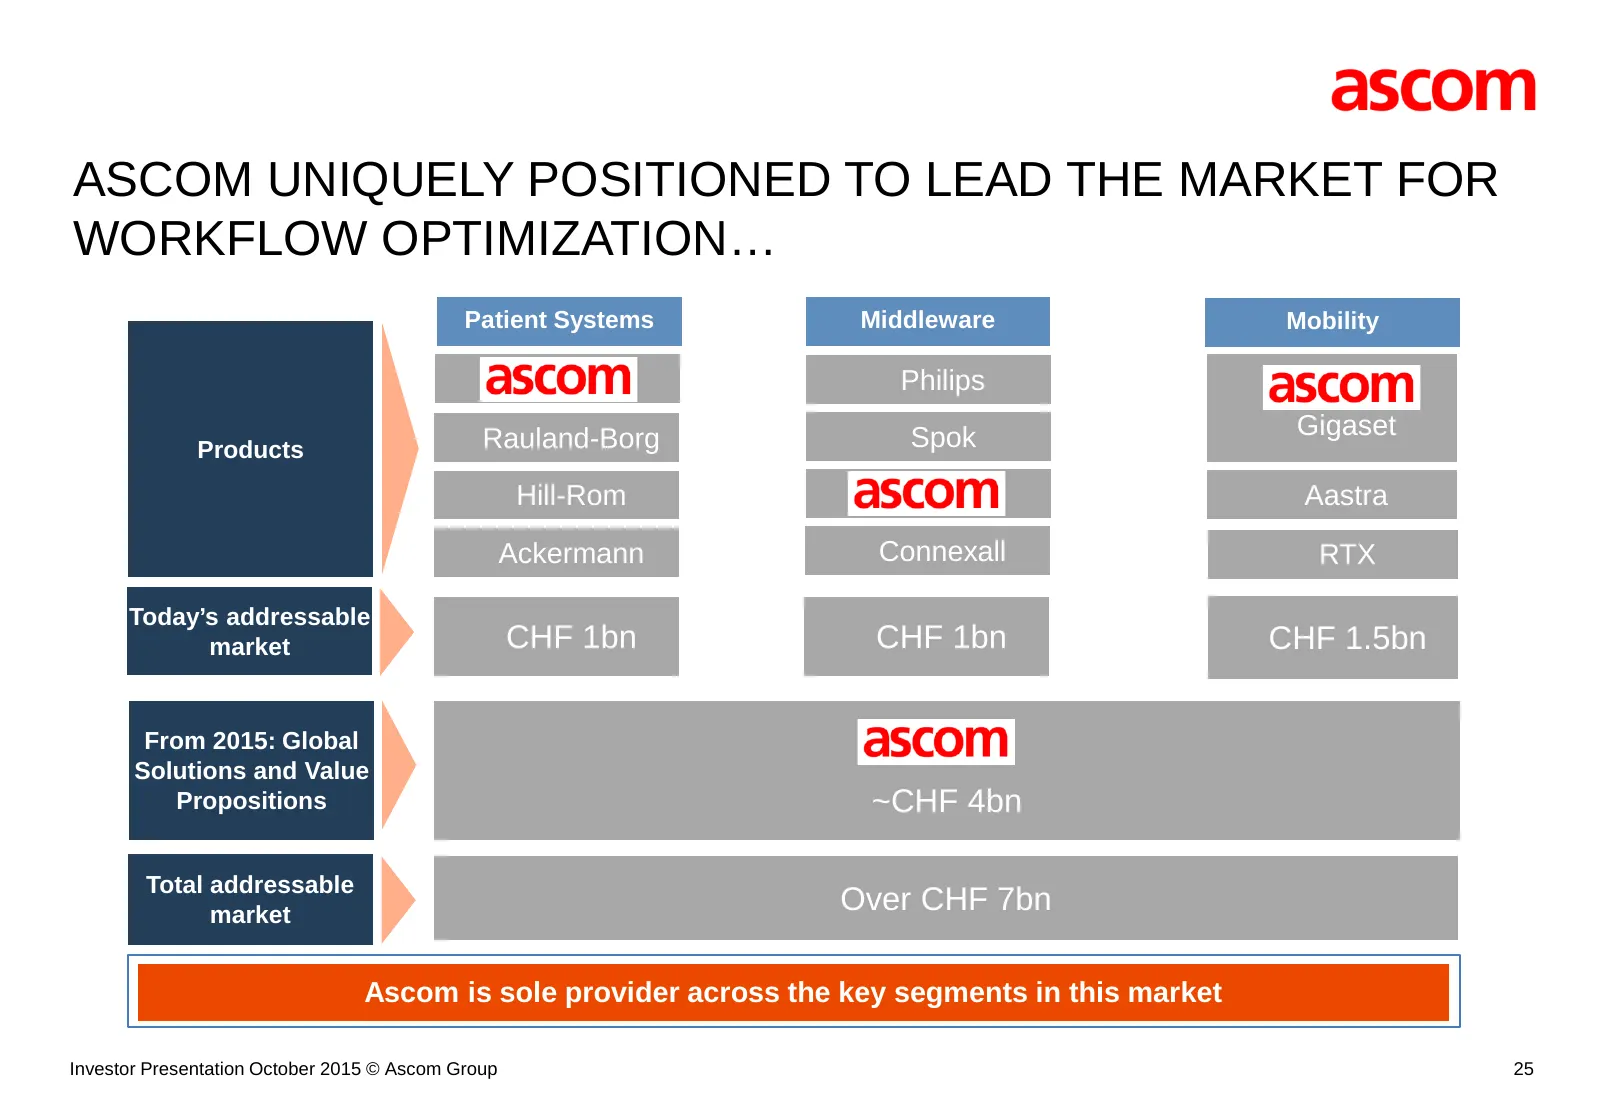
Slide 25: Ascom Uniquely Positioned to Lead Workflow Optimization
ASCOM UNIQUELY POSITIONED TO LEAD THE MARKET FOR WORKFLOW OPTIMIZATION… Patient Systems Middleware Mobility Philips Rauland-Borg Spok Gigaset Products Hill-Rom Aastra Ackermann Connexall RTX Today’s addressable market CHF 1bn CHF 1bn CHF 1.5bn From 2015: Global Solutions and Value Propositions ~CHF
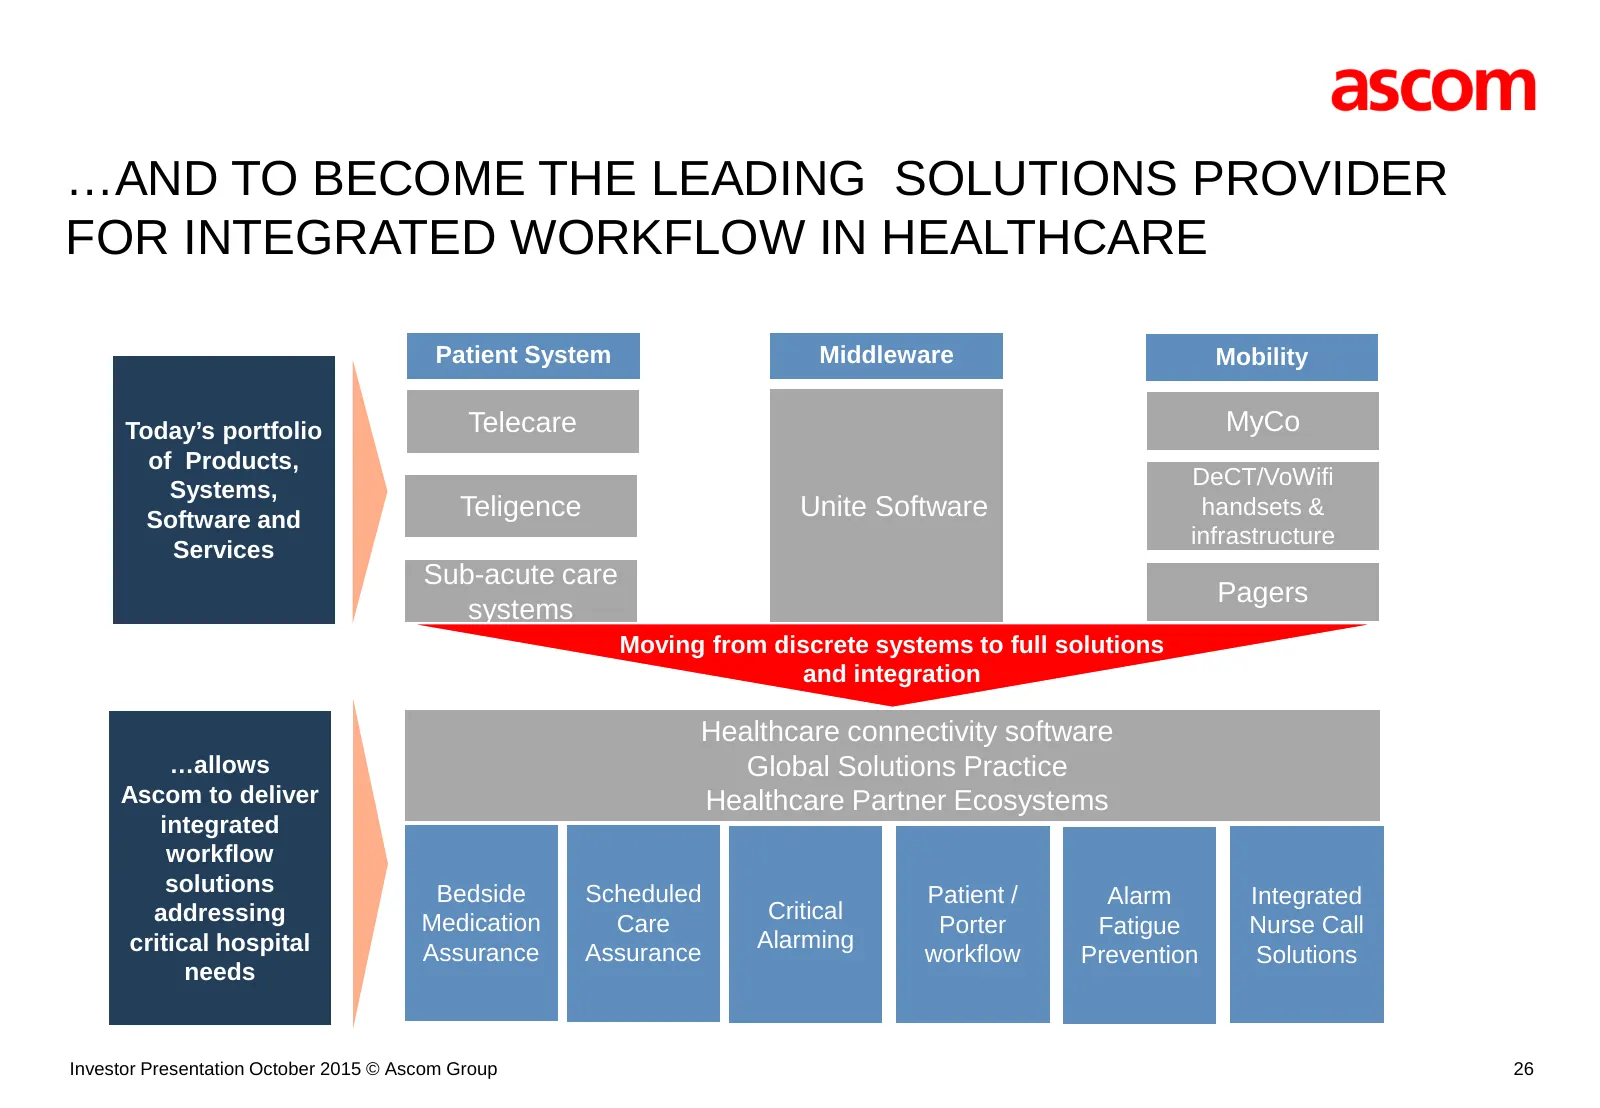
Slide 26: Becoming the Leading Solutions Provider for Integrated Healthcare Workflow
…AND TO BECOME THE LEADING SOLUTIONS PROVIDER FOR INTEGRATED WORKFLOW IN HEALTHCARE Patient System Middleware Mobility Today’s portfolio Telecare MyCo of Products, DeCT/VoWifi Systems, Software and Teligence Unite Software handsets & infrastructure Services Sub-acute care Pagers systems Moving from
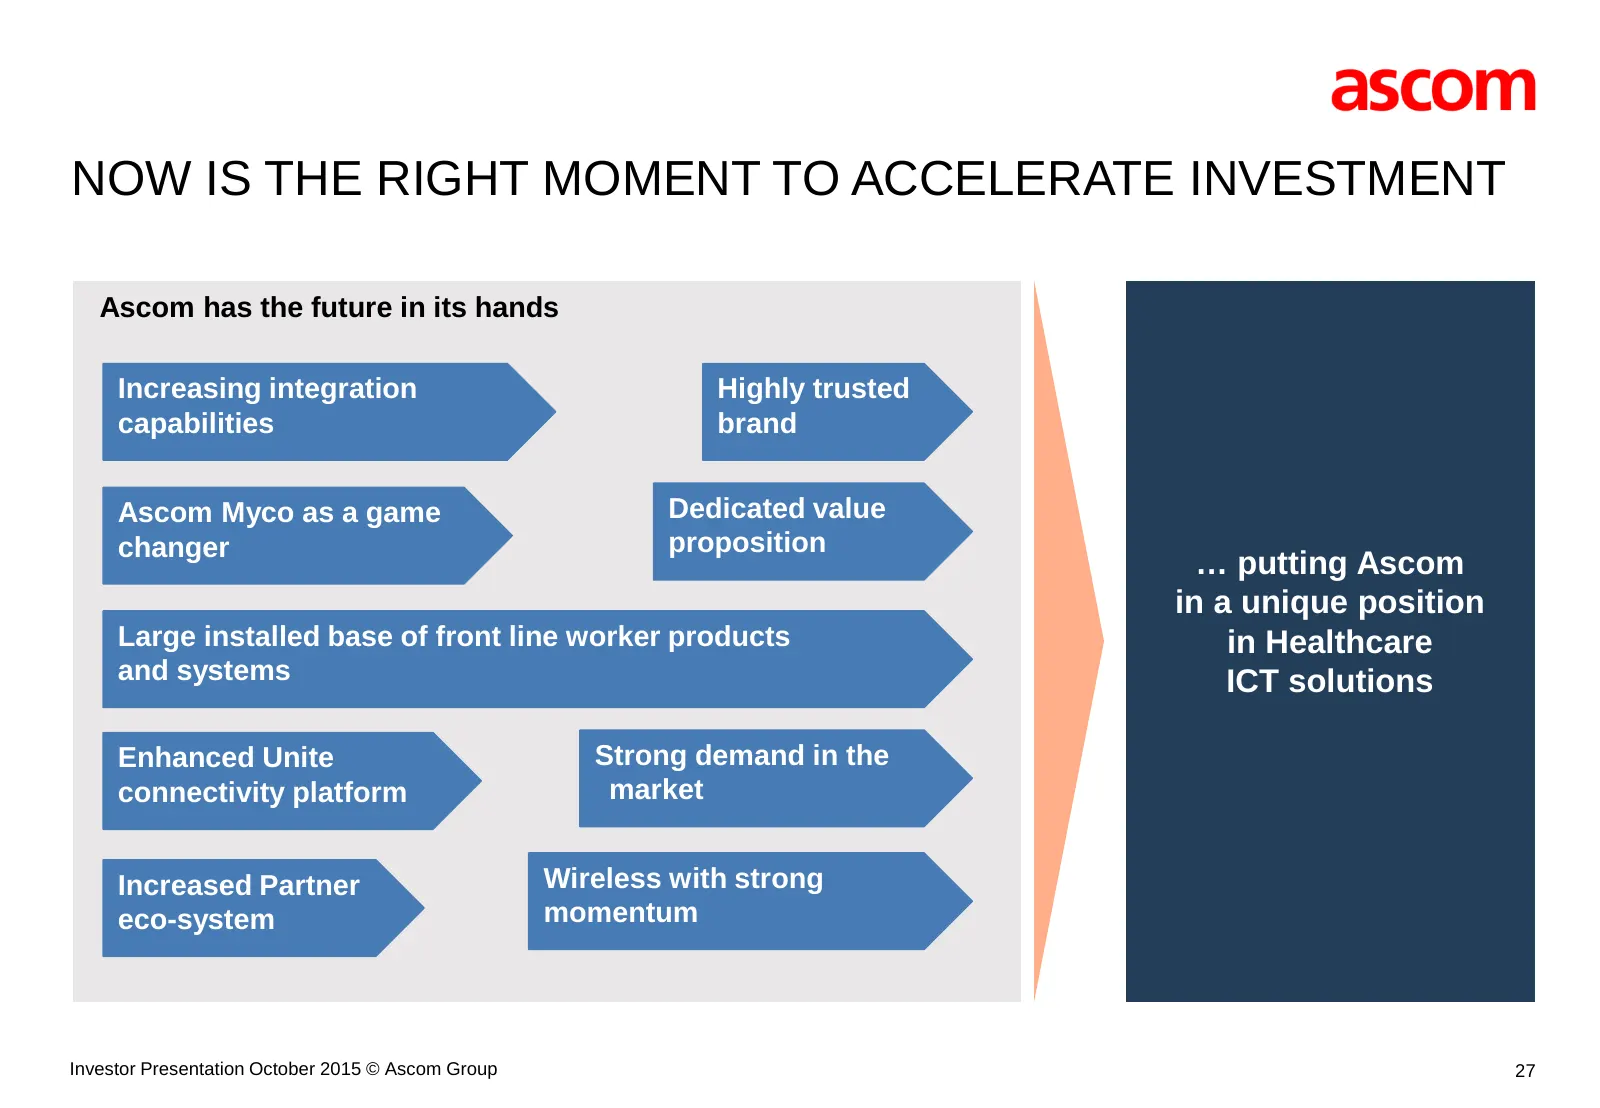
Slide 27: Now Is the Right Moment to Accelerate Investment
NOW IS THE RIGHT MOMENT TO ACCELERATE INVESTMENT Ascom has the future in its hands Increasing integration Highly trusted capabilities brand Ascom Myco as a game Dedicated value changer proposition … putting Ascom in a unique position Large installed base of front line worker products in Healthcare a
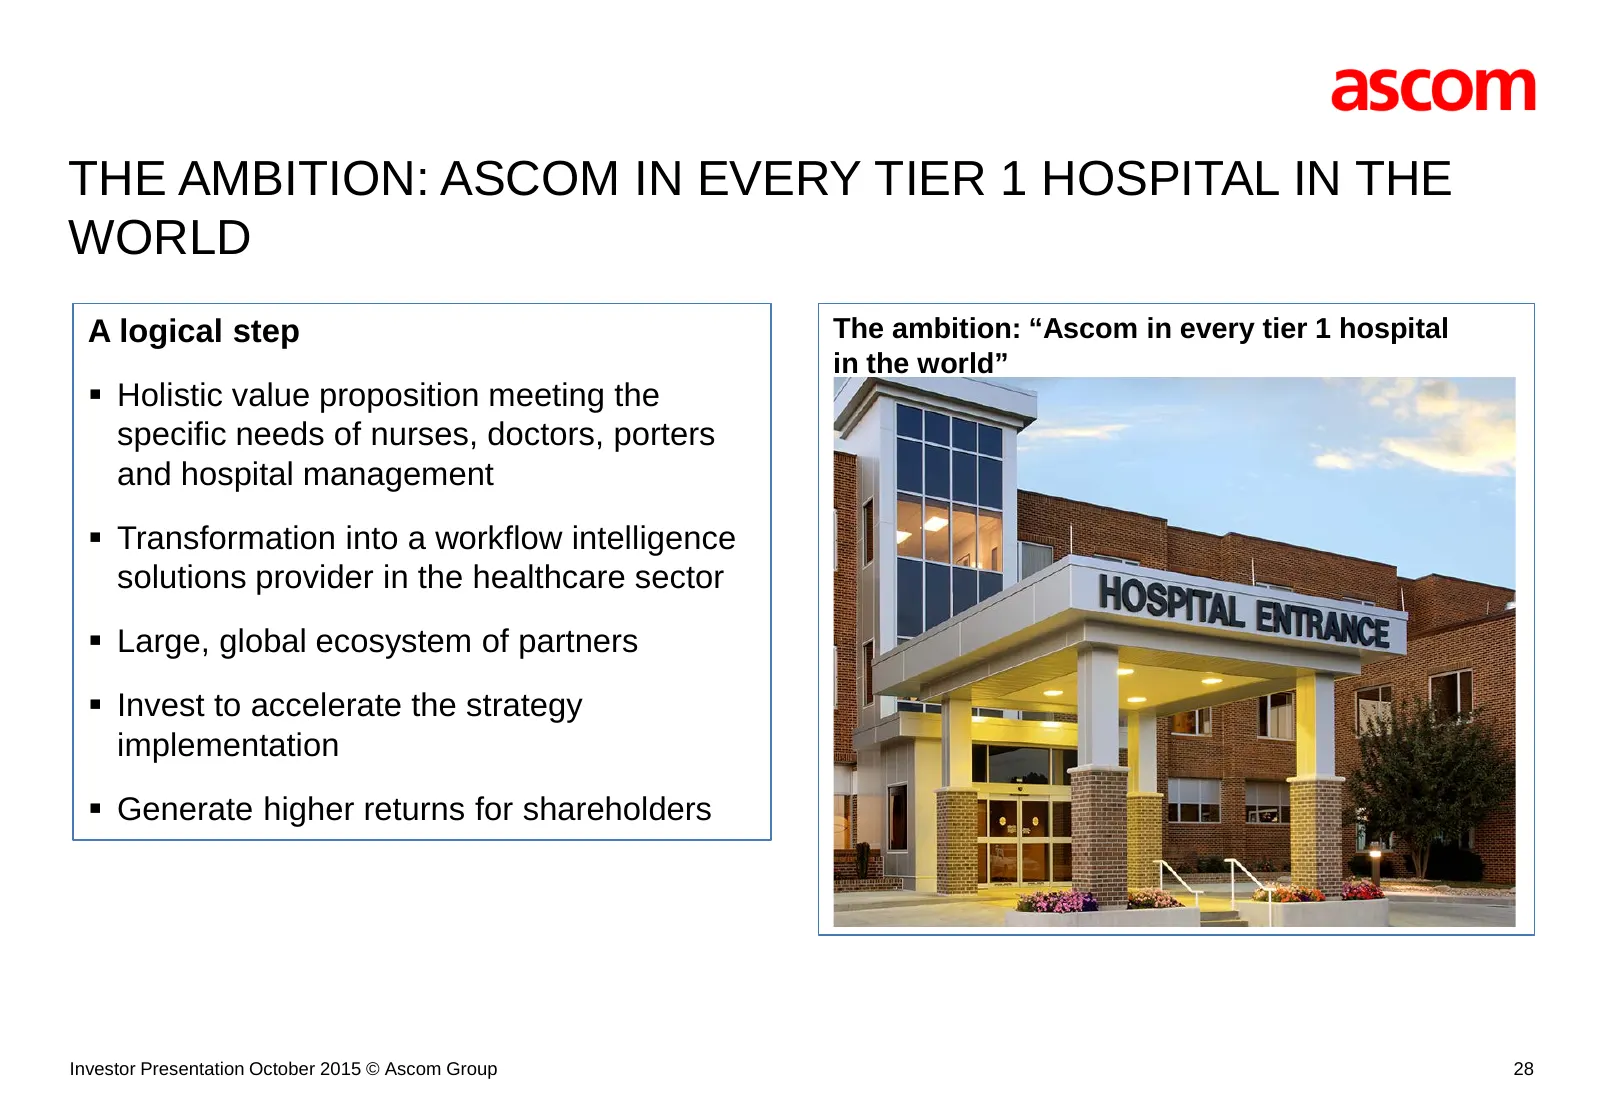
Slide 28: The Ambition: Ascom in Every Tier 1 Hospital in the World
THE AMBITION: ASCOM IN EVERY TIER 1 HOSPITAL IN THE WORLD A logical step The ambition: “Ascom in every tier 1 hospital in the world” Holistic value proposition meeting the specific needs of nurses, doctors, porters and hospital management Transformation into a workflow intelligence solutions pro

Slide 29: Network Testing Strategy Update
NETWORK TESTING STRATEGY UPDATE
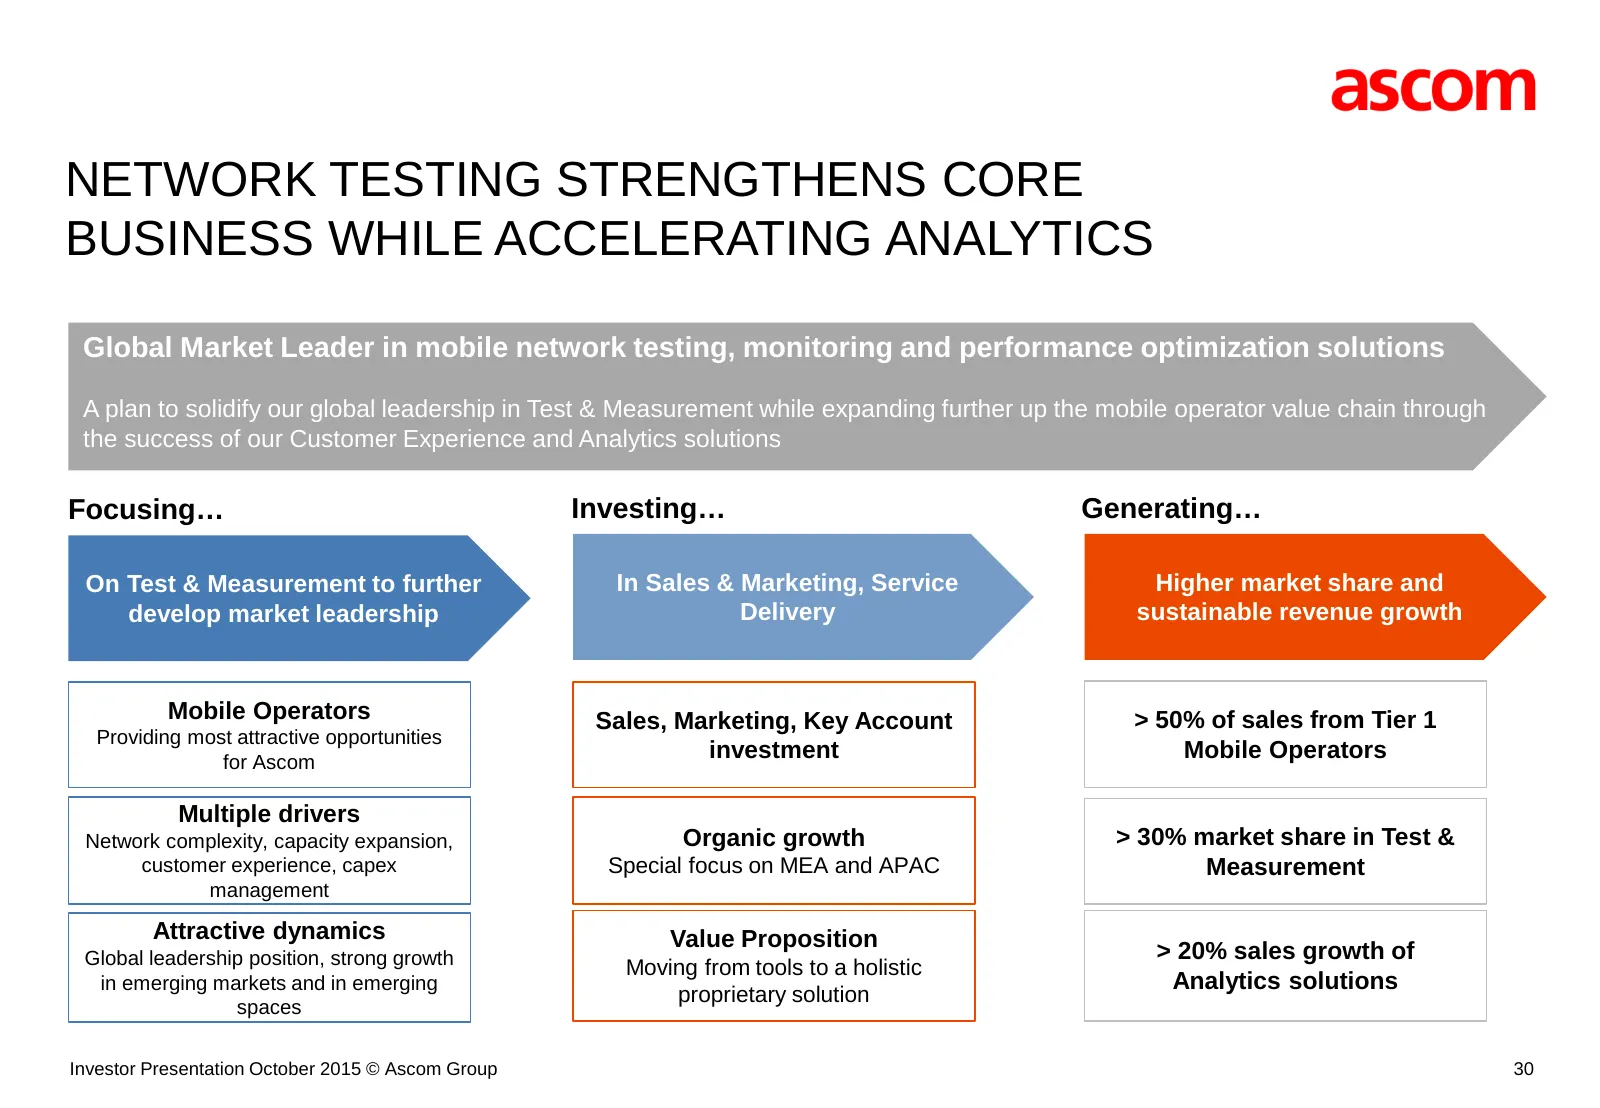
Slide 30: Network Testing Strengthens Core Business While Accelerating Analytics
NETWORK TESTING STRENGTHENS CORE BUSINESS WHILE ACCELERATING ANALYTICS Global Market Leader in mobile network testing, monitoring and performance optimization solutions A plan to solidify our global leadership in Test & Measurement while expanding further up the mobile operator value chain through t
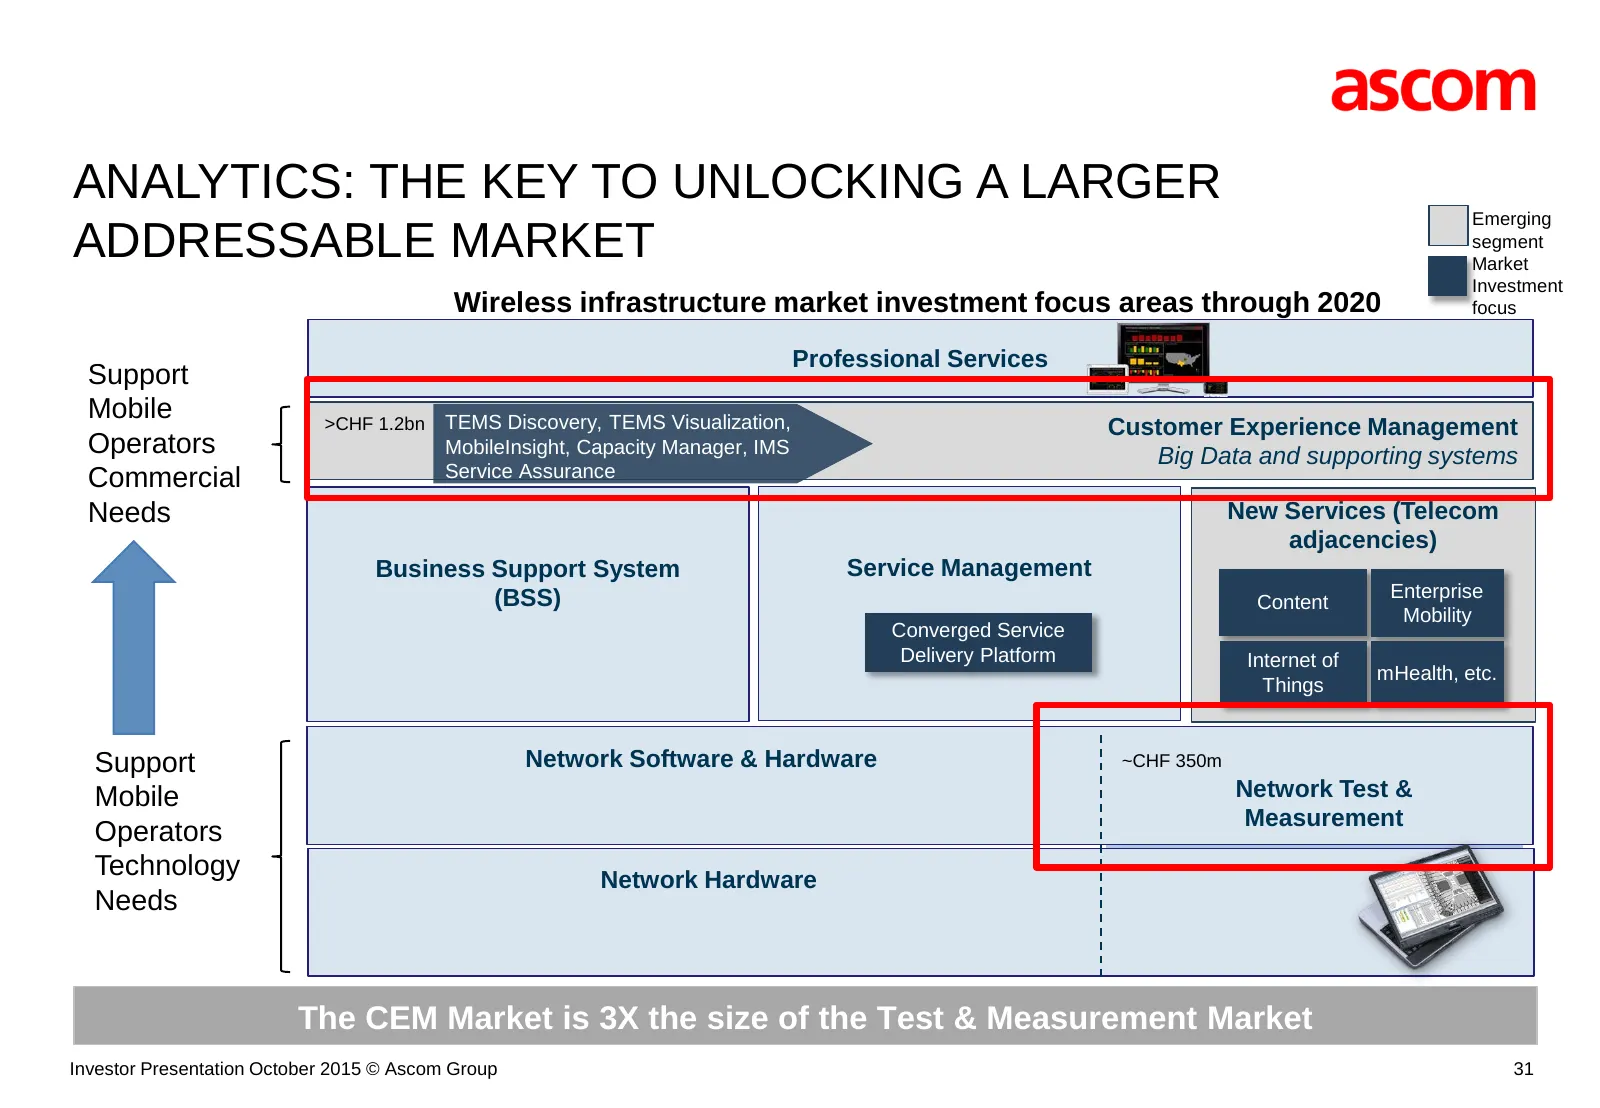
Slide 31: Analytics: The Key to Unlocking a Larger Addressable Market
ANALYTICS: THE KEY TO UNLOCKING A LARGER Emerging ADDRESSABLE MARKET segment Market Investment Wireless infrastructure market investment focus areas through 2020 focus Professional Services Support Mobile >CHF 1.2bn TEMS Discovery, TEMS Visualization, Customer Experience Management Operators MobileI
Slide 32: Network Analytics: Accelerating Traction
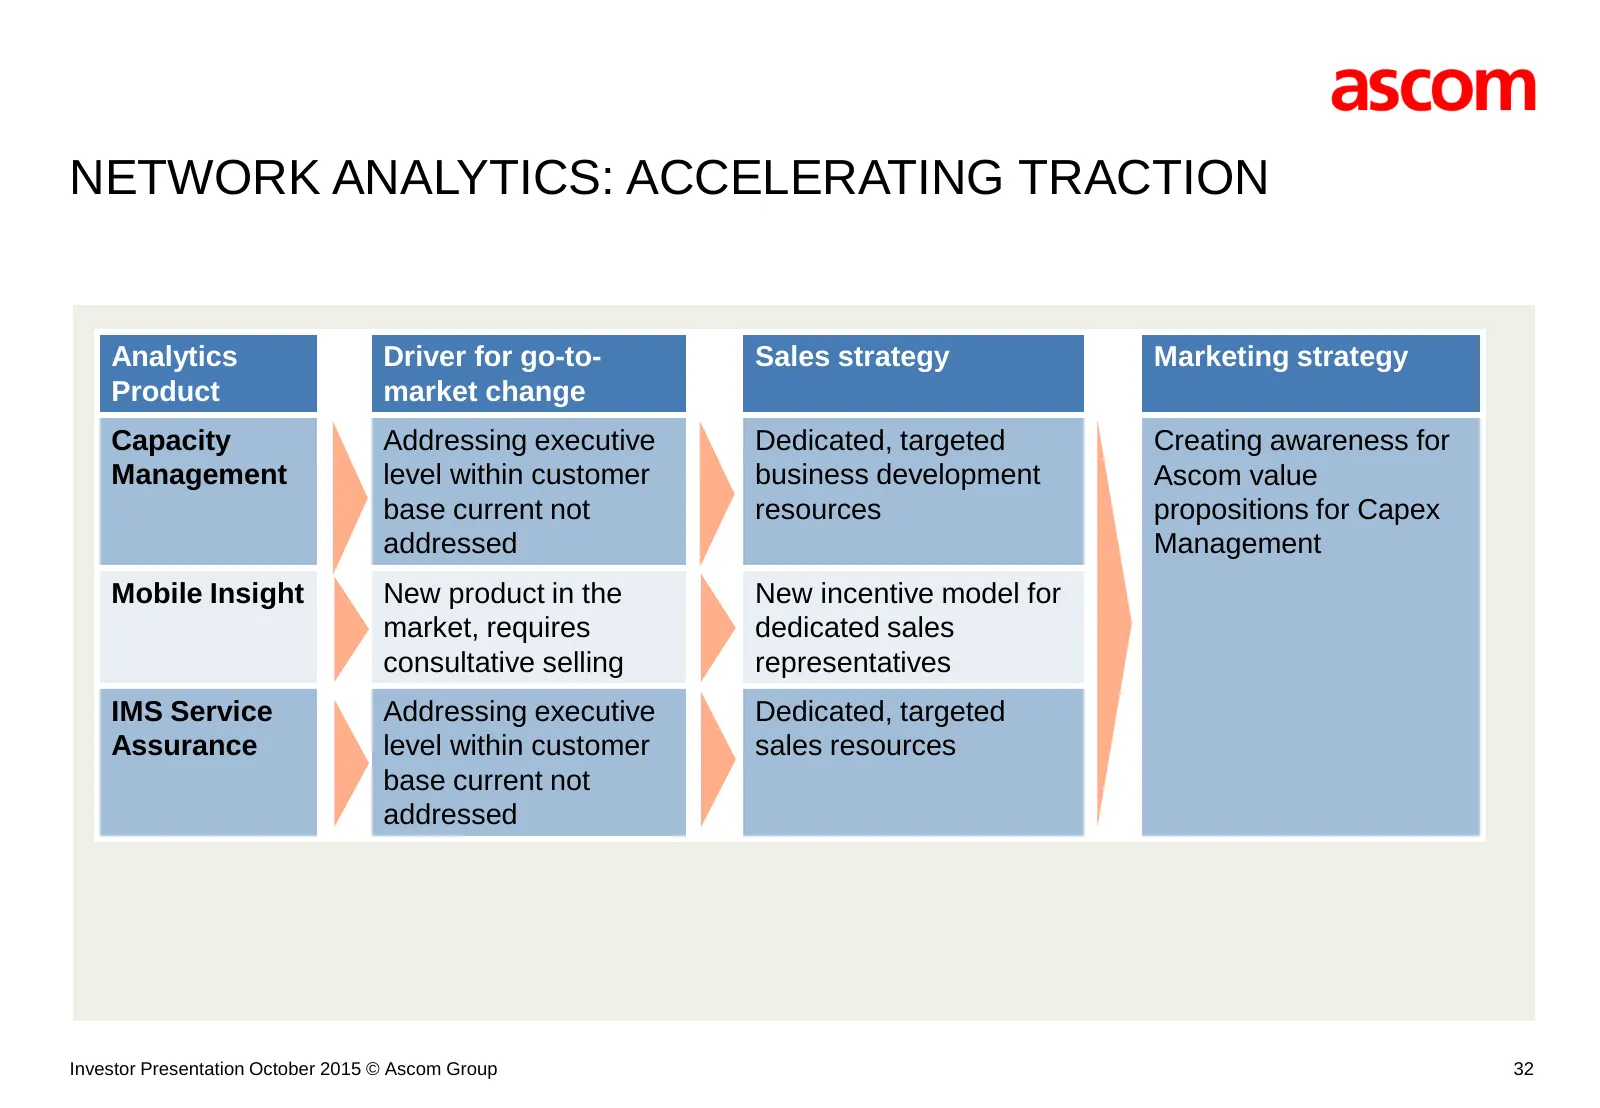
NETWORK ANALYTICS: ACCELERATING TRACTION Analytics Driver for go-to- Sales strategy Marketing strategy Product market change Capacity Addressing executive Dedicated, targeted Creating awareness for Management level within customer business development Ascom value base current not resources propositi
Slide 33: Network Testing with Clear Implementation Plan 2015
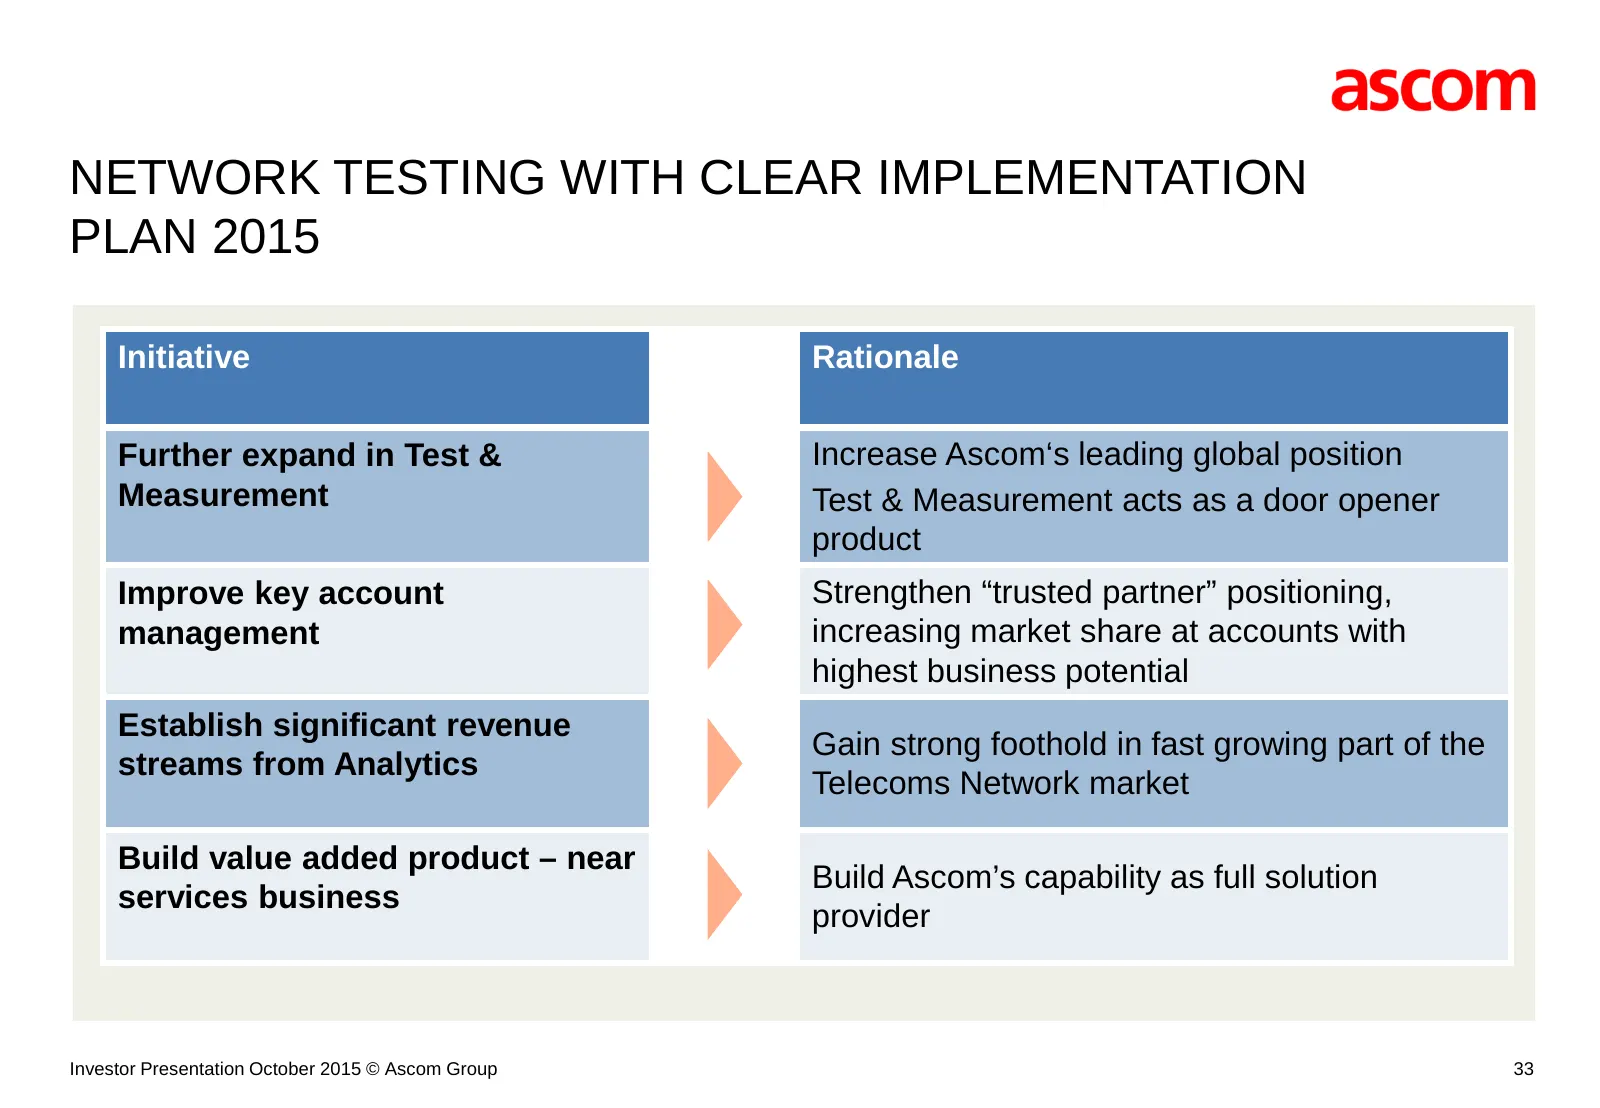
NETWORK TESTING WITH CLEAR IMPLEMENTATION PLAN 2015 Initiative Rationale Further expand in Test & Increase Ascom‘s leading global position Measurement Test & Measurement acts as a door opener product Improve key account Strengthen “trusted partner” positioning, management increasing market share at

Slide 34: Ascom Group Accelerating the Strategic Shift
ASCOM GROUP ACCELERATING THE STRATEGIC SHIFT 34
Slide 35: Strategic Shift to Achieve Ascom 2020 Ambition
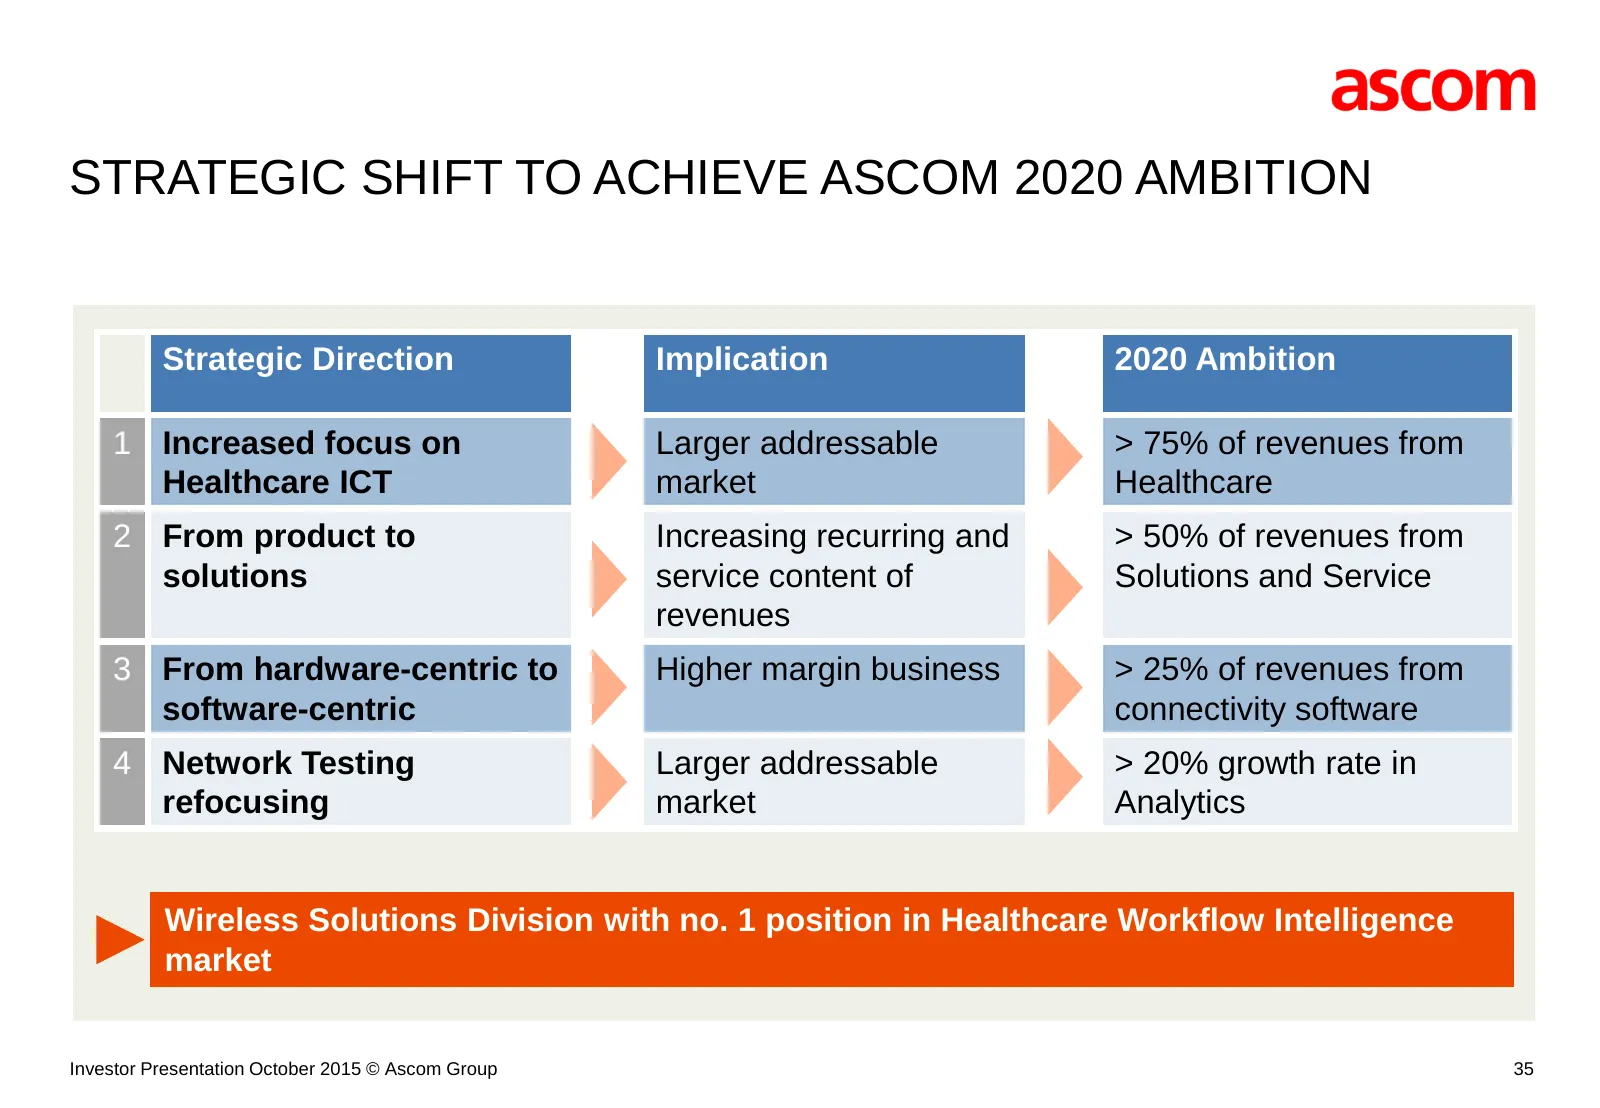
STRATEGIC SHIFT TO ACHIEVE ASCOM 2020 AMBITION Strategic Direction Implication 2020 Ambition 1 Increased focus on Larger addressable > 75% of revenues from Healthcare ICT market Healthcare 2 From product to Increasing recurring and > 50% of revenues from solutions service content of Solutions and Se
Slide 36: A Platform for Growth 2015+
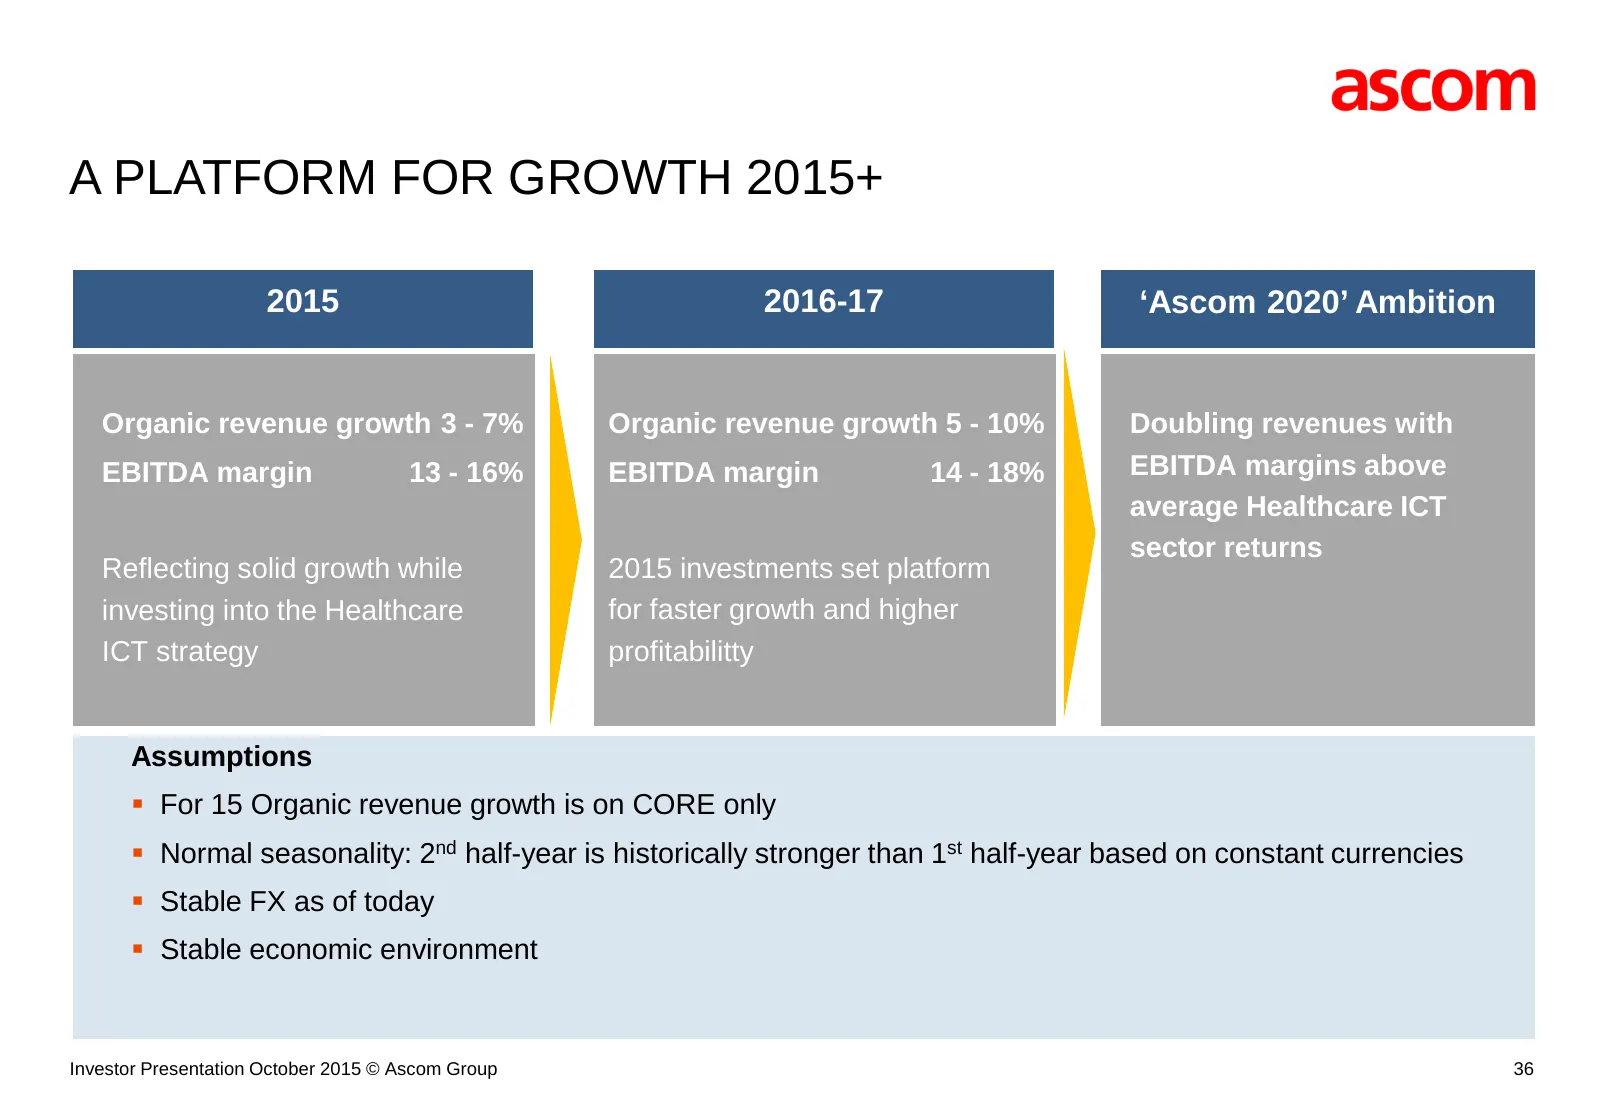
A PLATFORM FOR GROWTH 2015+ 2015 2016-17 ‘Ascom 2020’ Ambition Organic revenue growth 3 - 7% Organic revenue growth 5 - 10% Doubling revenues with EBITDA margin 13 - 16% EBITDA margin 14 - 18% EBITDA margins above average Healthcare ICT sector returns Reflecting solid growth while 2015 investments s
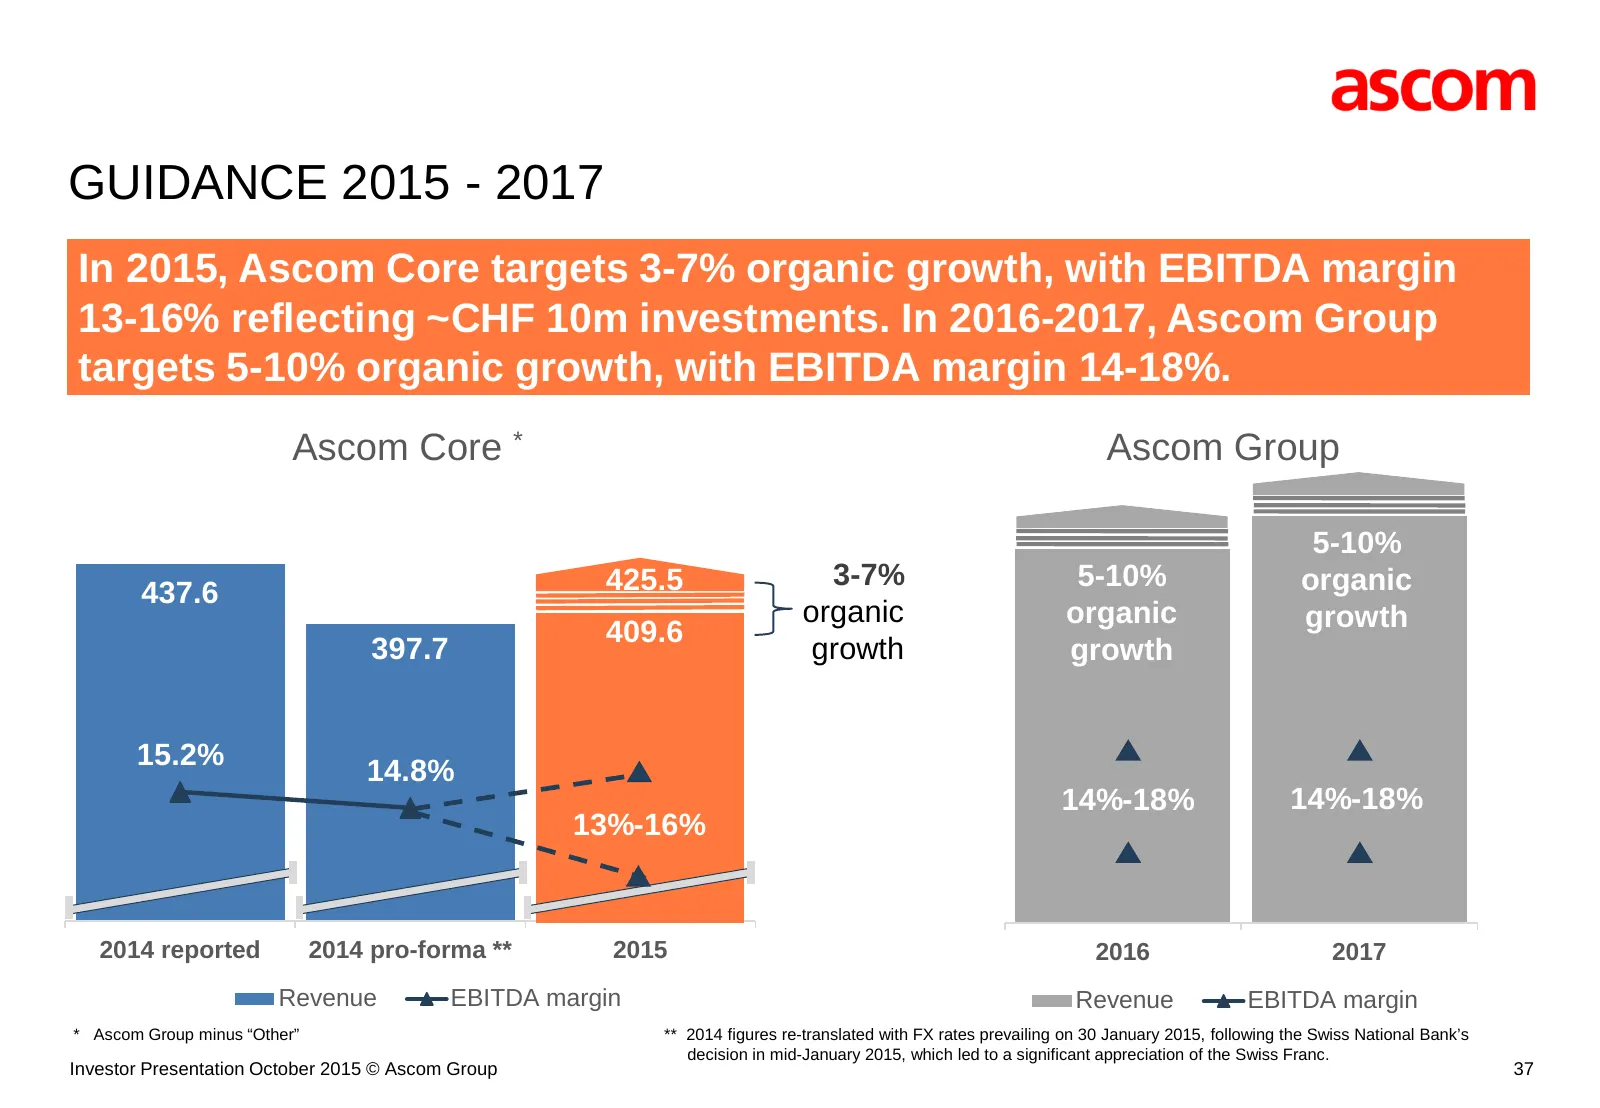
Slide 37: Guidance 2015 - 2017
GUIDANCE 2015 - 2017 In 2015, Ascom Core targets 3-7% organic growth, with EBITDA margin 13-16% reflecting ~CHF 10m investments. In 2016-2017, Ascom Group targets 5-10% organic growth, with EBITDA margin 14-18%. (CHFm) 550 24.0% 500 Ascom Core * Ascom Group 22.0% 450 5-10% 425.5 3-7% 5-10% organic 4
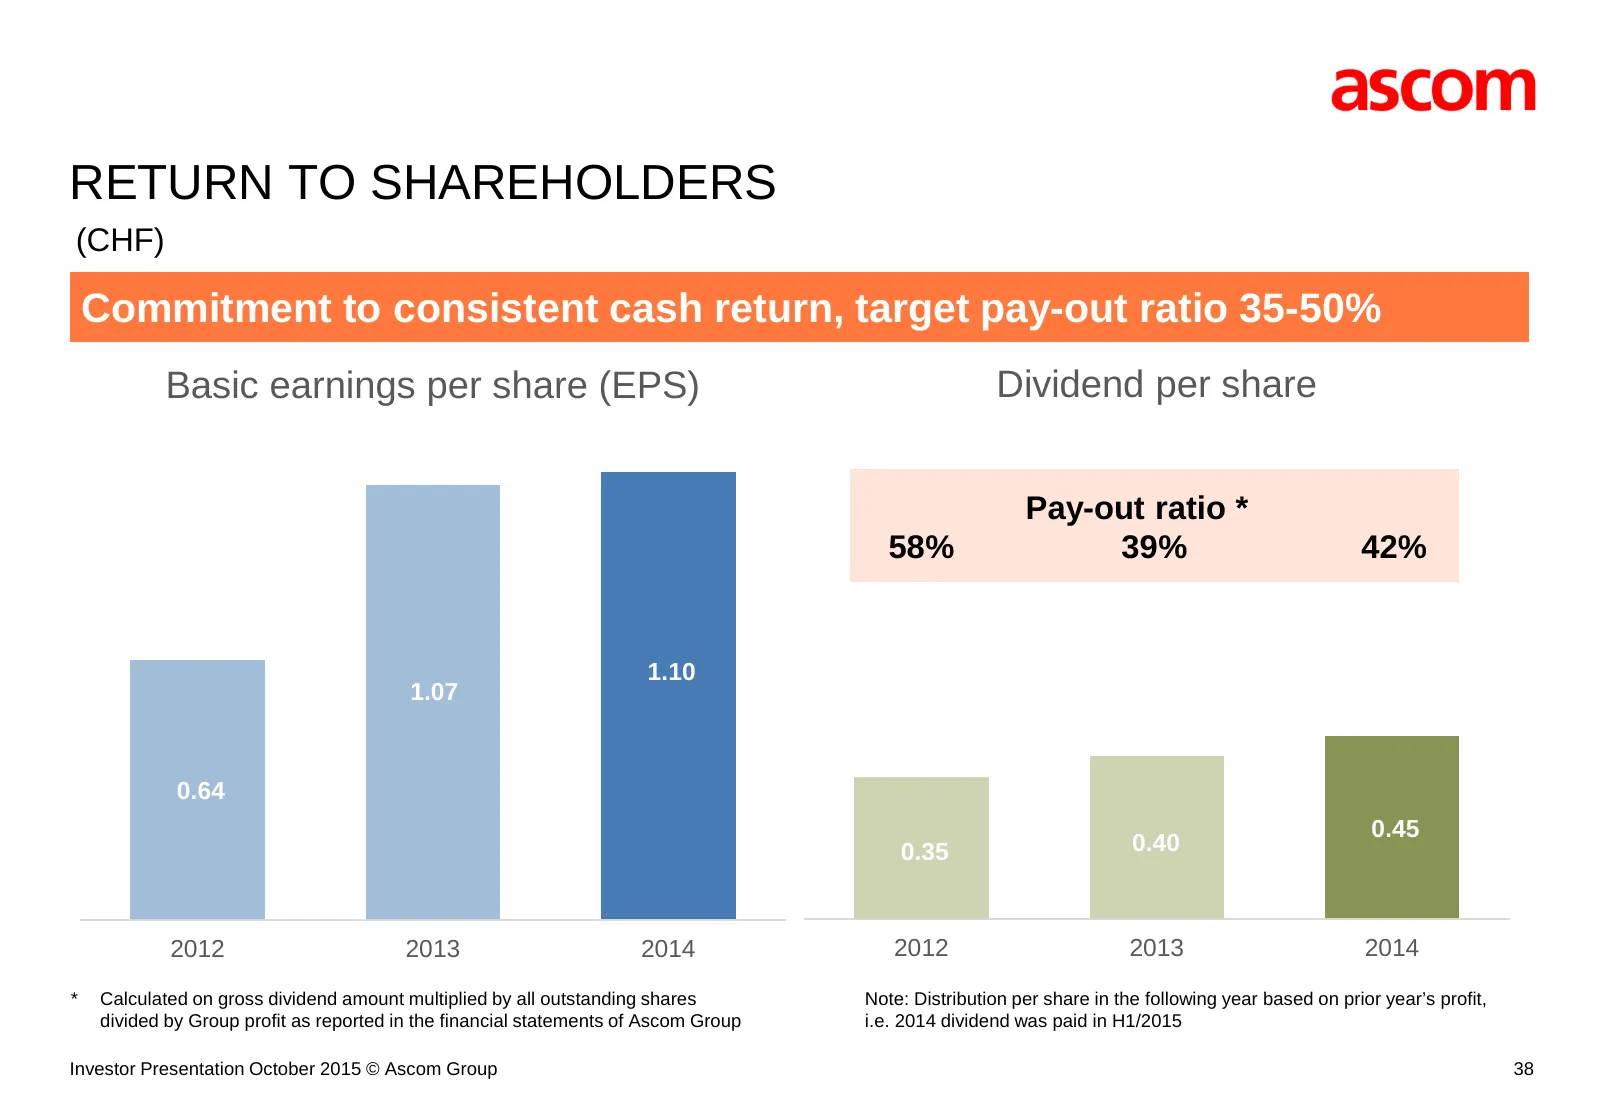
Slide 38: Return to Shareholders
RETURN TO SHAREHOLDERS (CHF) Commitment to consistent cash return, target pay-out ratio 35-50% Basic earnings per share (EPS) Dividend per share Pay-out ratio * 58% 39% 42% 1.10 1.07 0.64 0.45 0.35 0.40 2012 2013 2014 2012 2013 2014 * Calculated on gross dividend amount multiplied by all outstanding
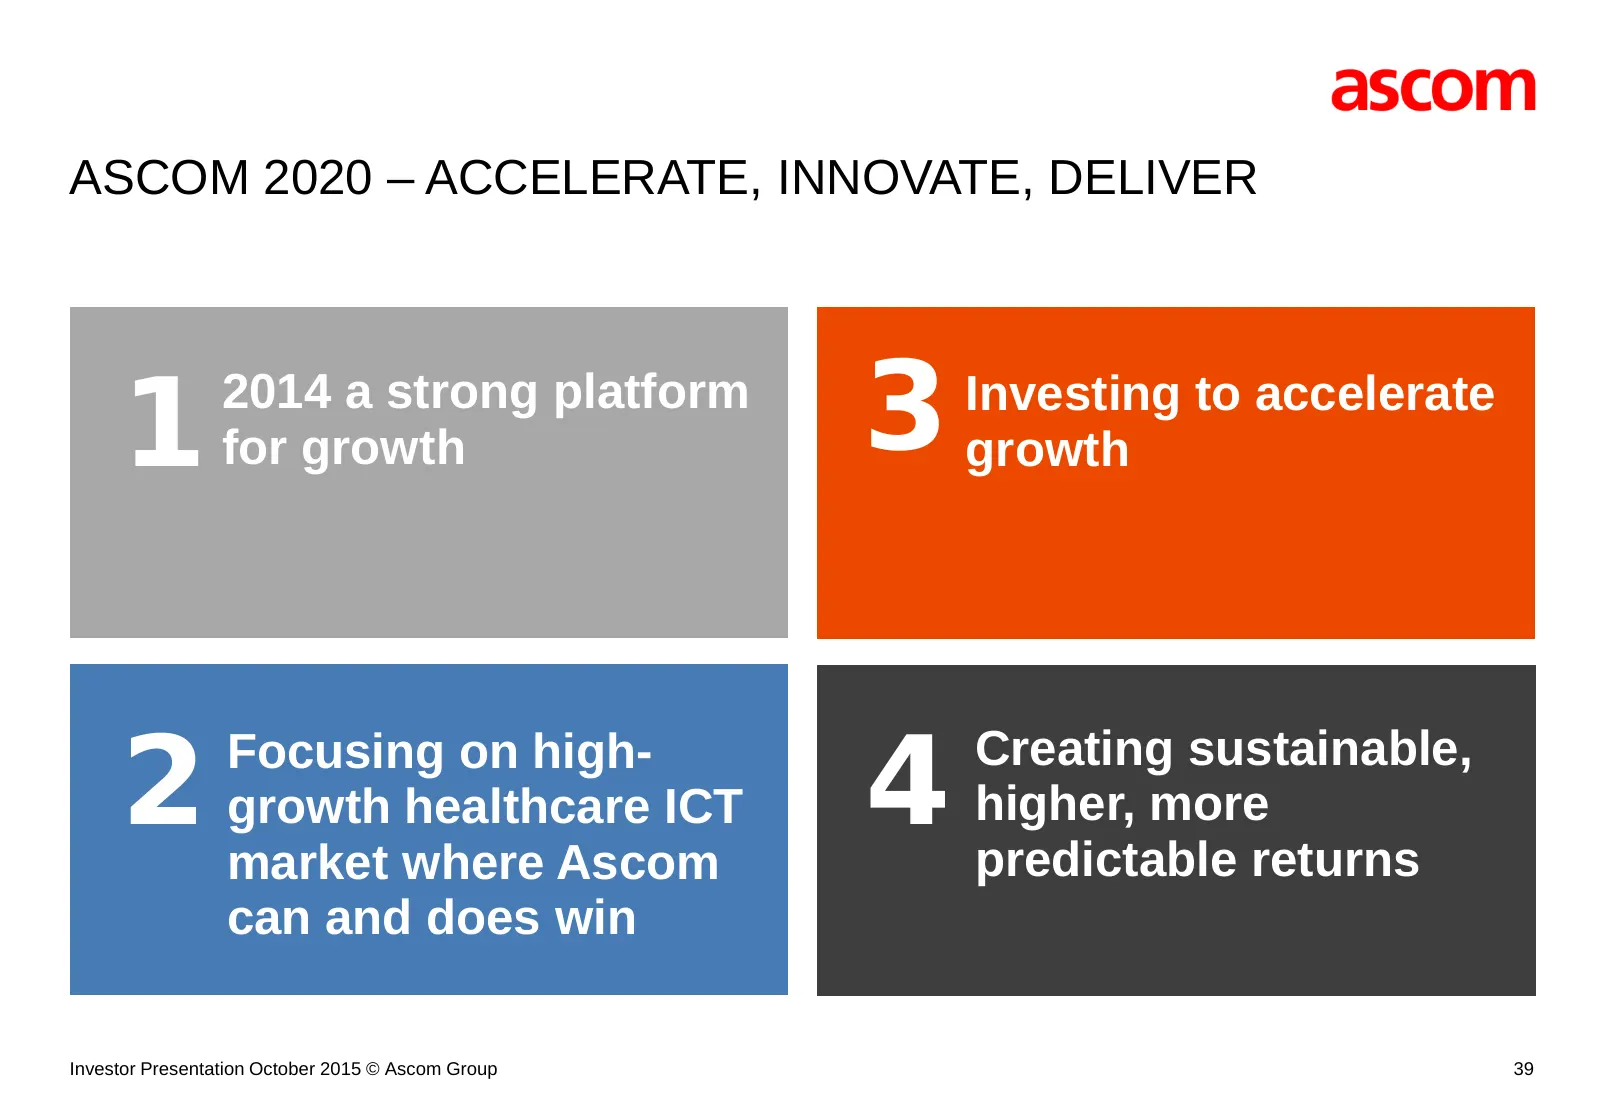
Slide 39: Ascom 2020 – Accelerate, Innovate, Deliver
ASCOM 2020 – ACCELERATE, INNOVATE, DELIVER 1 2014 a strong platform for growth 3 Investing to accelerate growth 2 Focusing on high- growth healthcare ICT market where Ascom 4 Creating sustainable, higher, more predictable returns can and does win Investor Presentation October 2015 © Ascom Group 39
Slide 40: Group Contact
[ ] GROUP CONTACT Ascom Holding AG Corp. Communications / IR Tel: + 41 41 544 78 00 Zugerstrasse 32 Fax: + 41 41 761 97 25 6340 Baar investor@ascom.com Investor Presentation October 2015 © Ascom Group 40
Source: Internet Archive copy of ascom.com