Newalliance Bancshares — Investor Presentation (May 2009)
38 slides from Newalliance Bancshares's investor presentation, May 6, 2009

Slide 1: NewAlliance Bancshares Investor Presentation
NewAlliance Bancshares Investor Presentation May 2009
Slide 2: Disclaimer & Forward-Looking Statements
Disclaimer & Forward-Looking Statements Statements in this document and presented orally at the conference, if any, concerning future results, performance, expectations or intentions are forward-looking statements. Actual results, performance or developments may differ materially from forward-lookin
Slide 3: Discussion Topics
Discussion Topics Company Profile and Business Focus Key 2009 Business Priorities Highlights of First Quarter 2009 Credit Quality Organizational Strengths Investor Presentation - May 2009 3
Slide 4: Company Profile
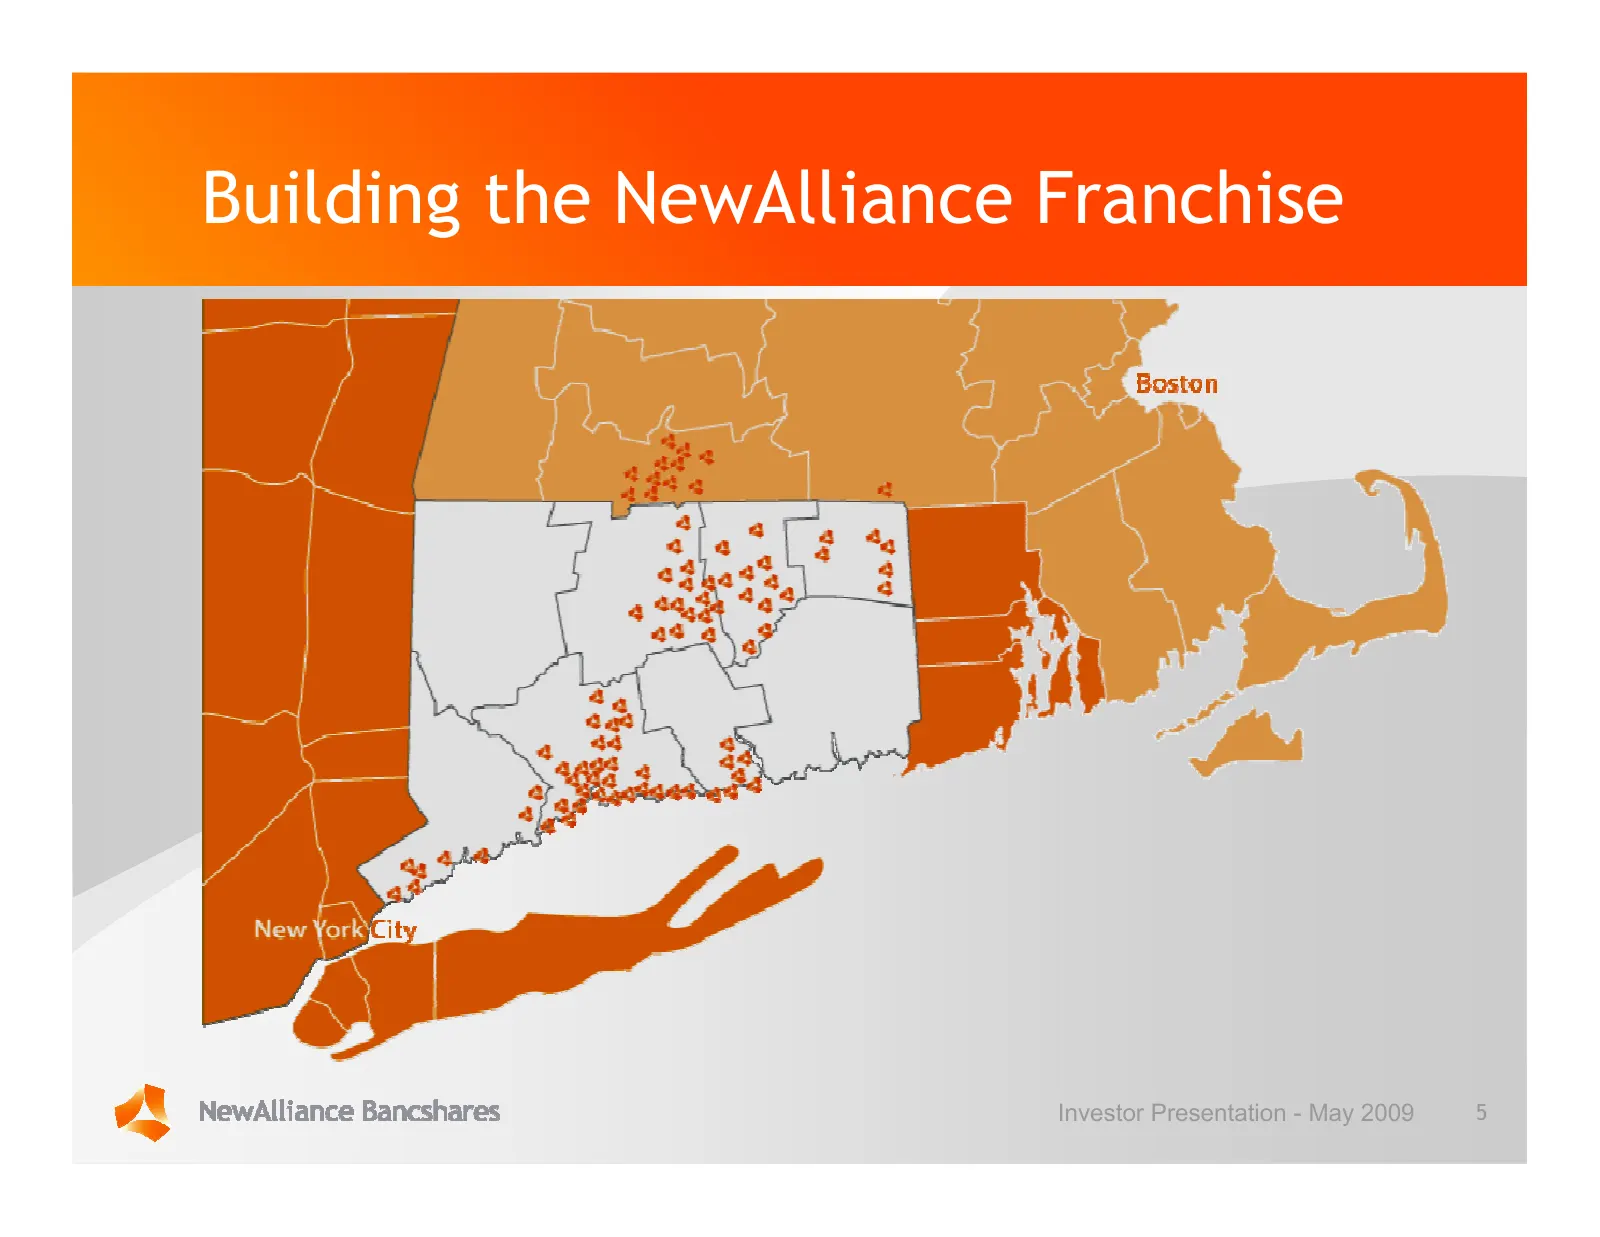
Company Profile NewAlliance is a regional community bank with a significant southern New England presence. As of March 31, 2009: Approximately $8.5 billion in assets and $4.7 billion in deposits; 89 branches in Connecticut and Massachusetts; Among banks headquartered in New England, ranked 4th by as
Slide 5: Building the NewAlliance Franchise
Building the NewAlliance Franchise Investor Presentation - May 2009 5
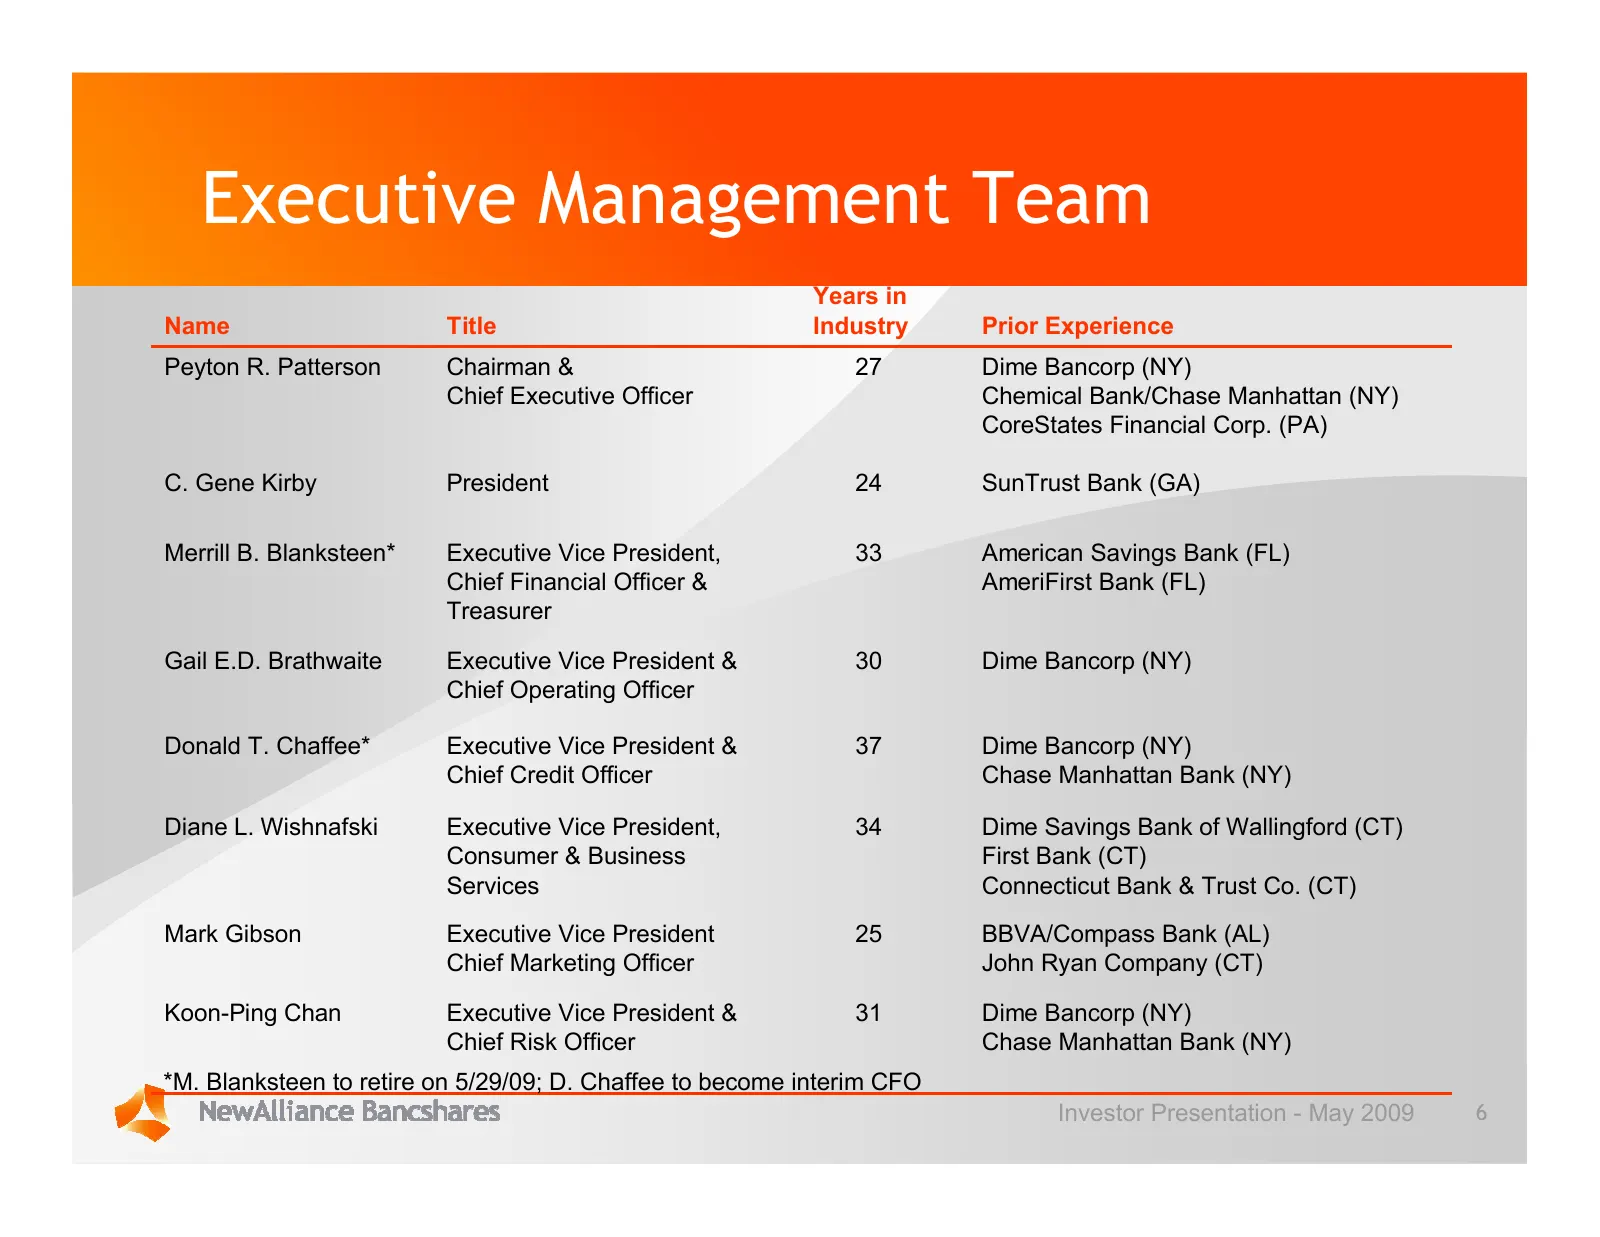
Slide 6: Executive Management Team
Executive Management Team Years in Name Title Industry Prior Experience Peyton R. Patterson Chairman & 27 Dime Bancorp (NY) Chief Executive Officer Chemical Bank/Chase Manhattan (NY) CoreStates Financial Corp. (PA) C. Gene Kirby President 24 SunTrust Bank (GA) Merrill B. Blanksteen* Executive Vice P
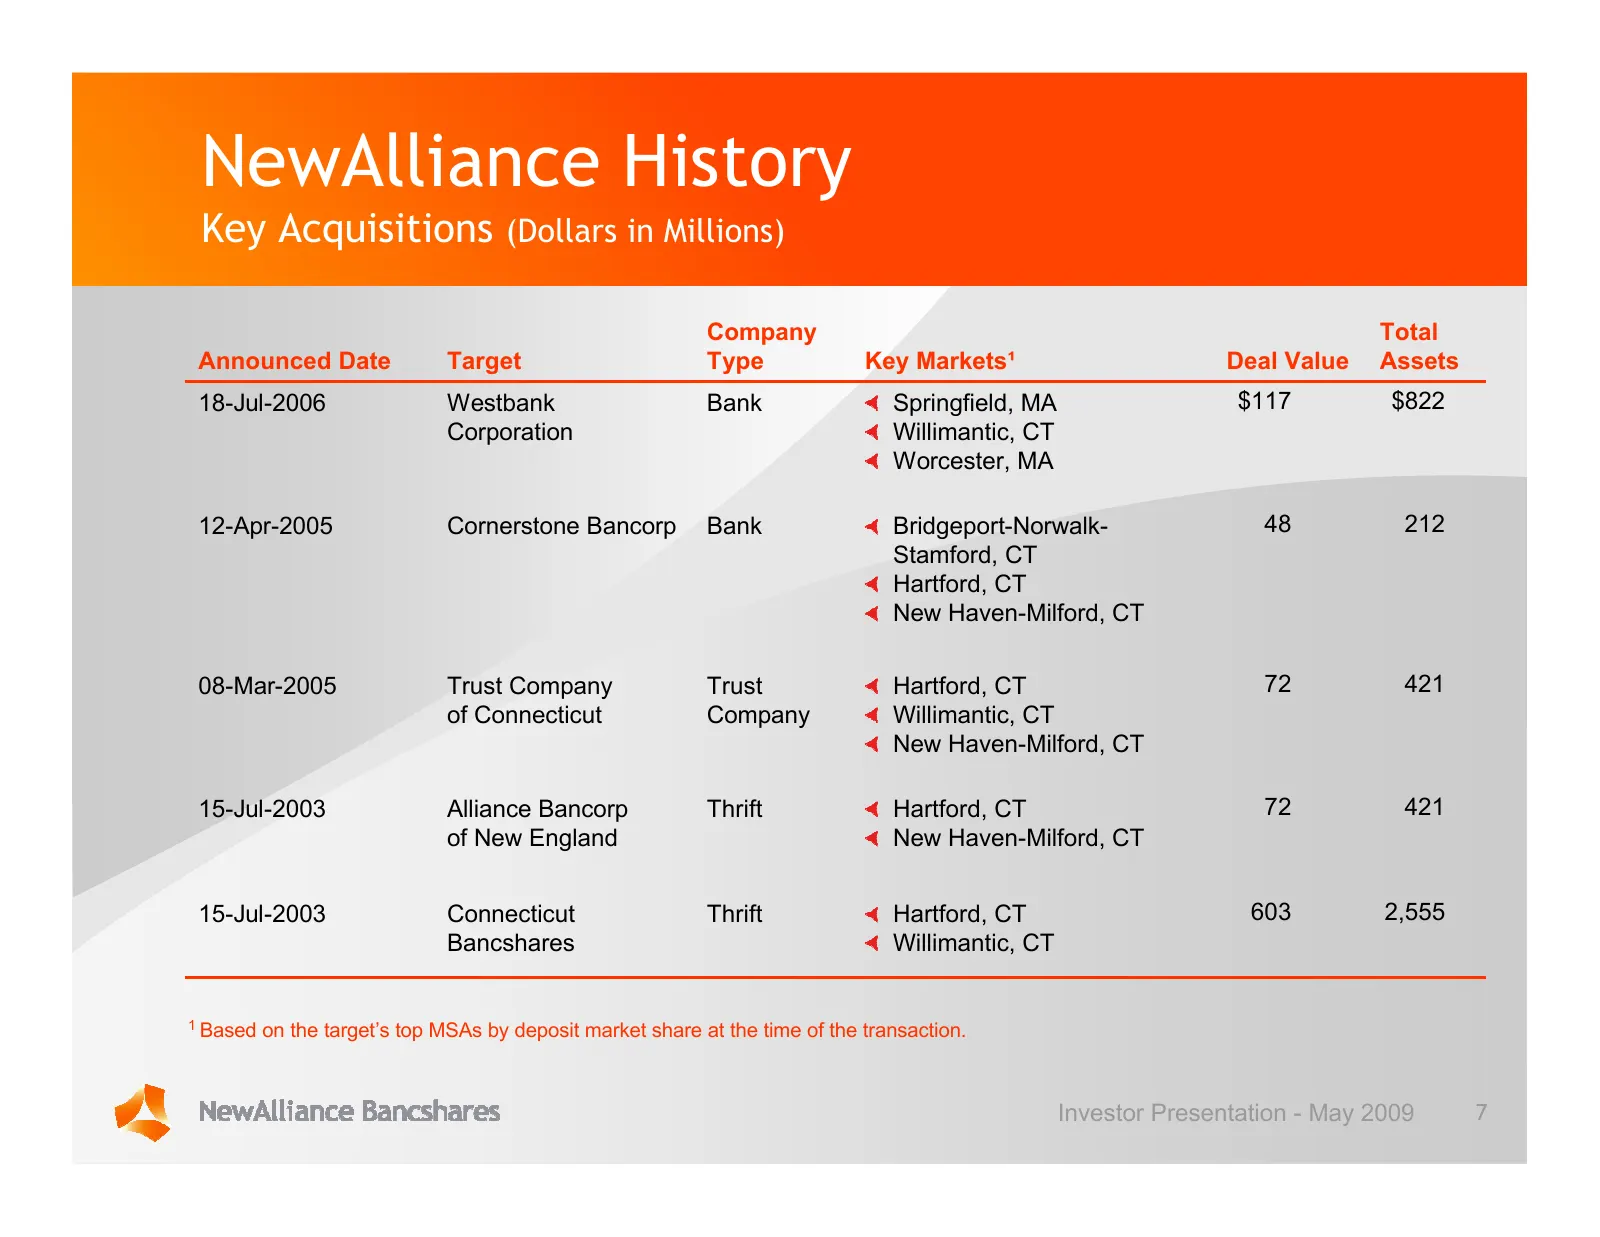
Slide 7: NewAlliance History
NewAlliance History Key Acquisitions (Dollars in Millions) Company Total Announced Date Target Type Key Markets¹ Deal Value Assets 18-Jul-2006 Westbank Bank Springfield, MA $117 $822 Corporation Willimantic, CT Worcester, MA 12-Apr-2005 Cornerstone Bancorp Bank Bridgeport-Norwalk- 48 212 Stamford, C
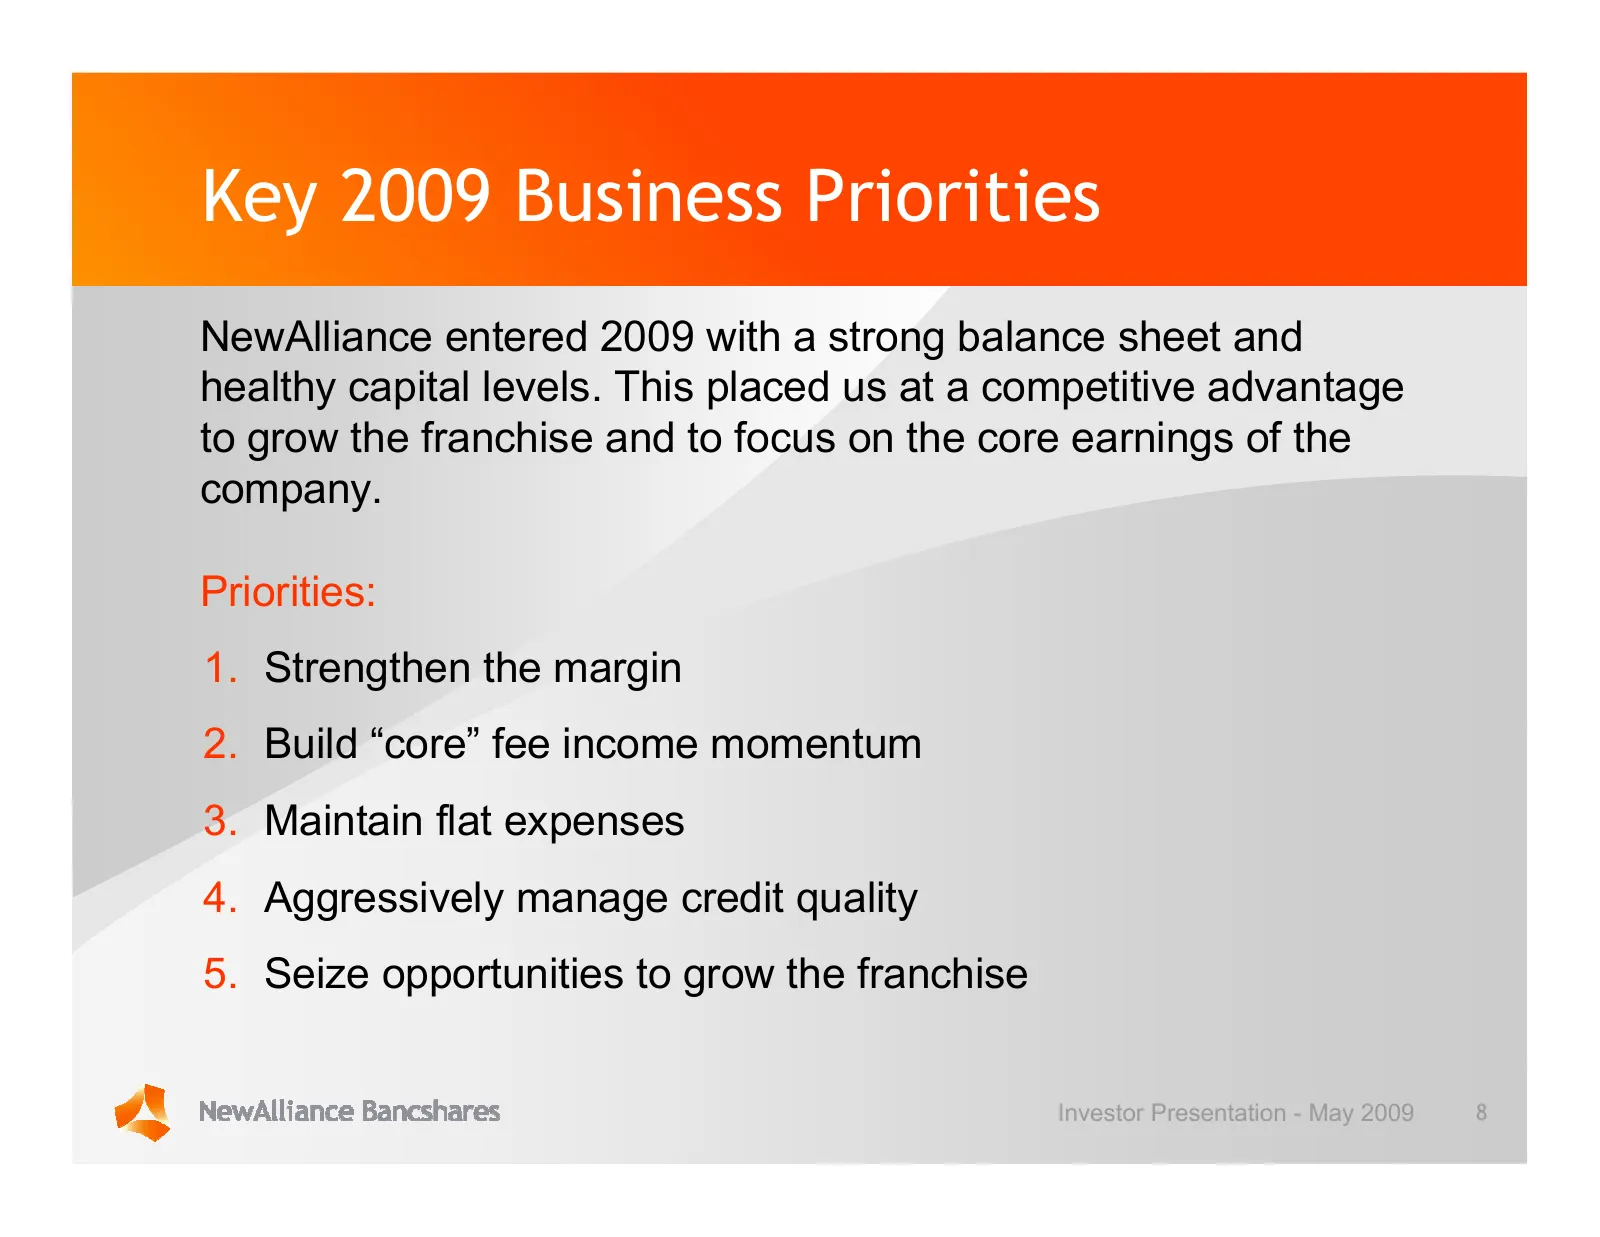
Slide 8: Key 2009 Business Priorities
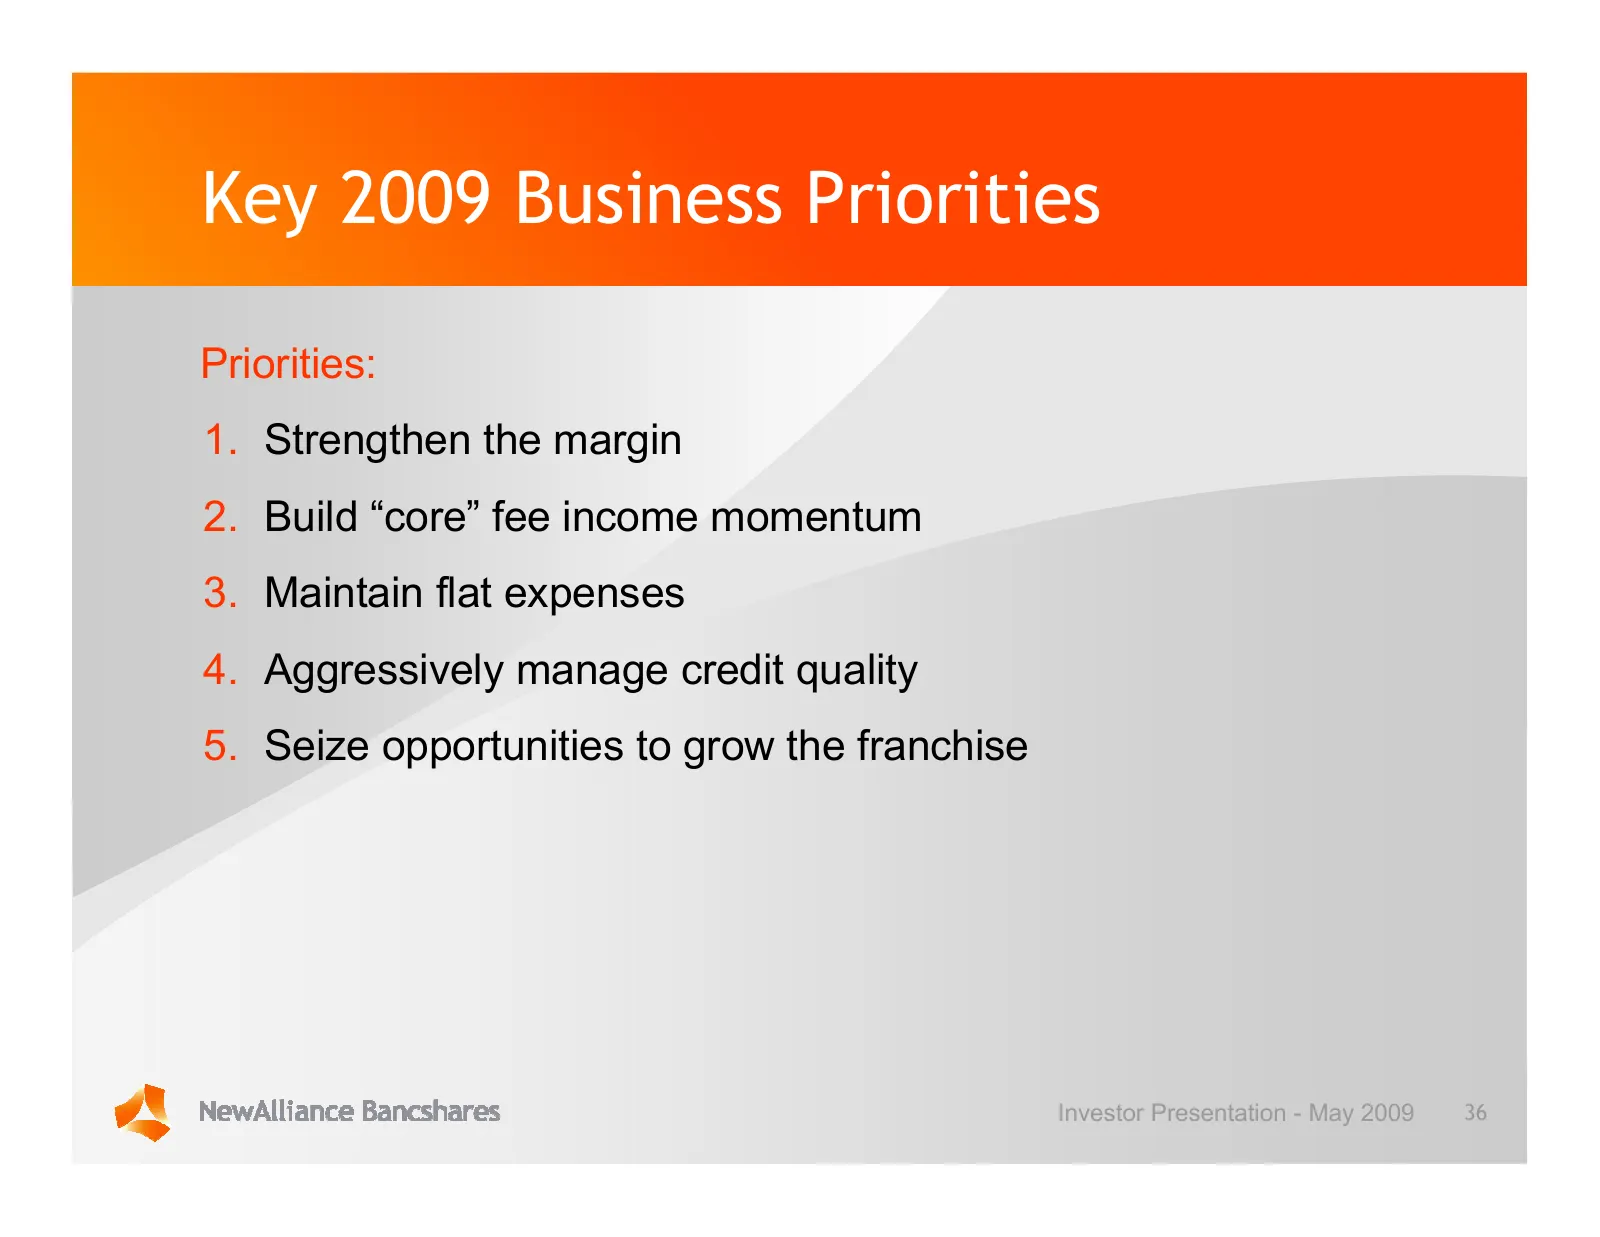
Key 2009 Business Priorities NewAlliance entered 2009 with a strong balance sheet and healthy capital levels. This placed us at a competitive advantage to grow the franchise and to focus on the core earnings of the company. Priorities: 1. Strengthen the margin 2. Build “core” fee income momentum 3.
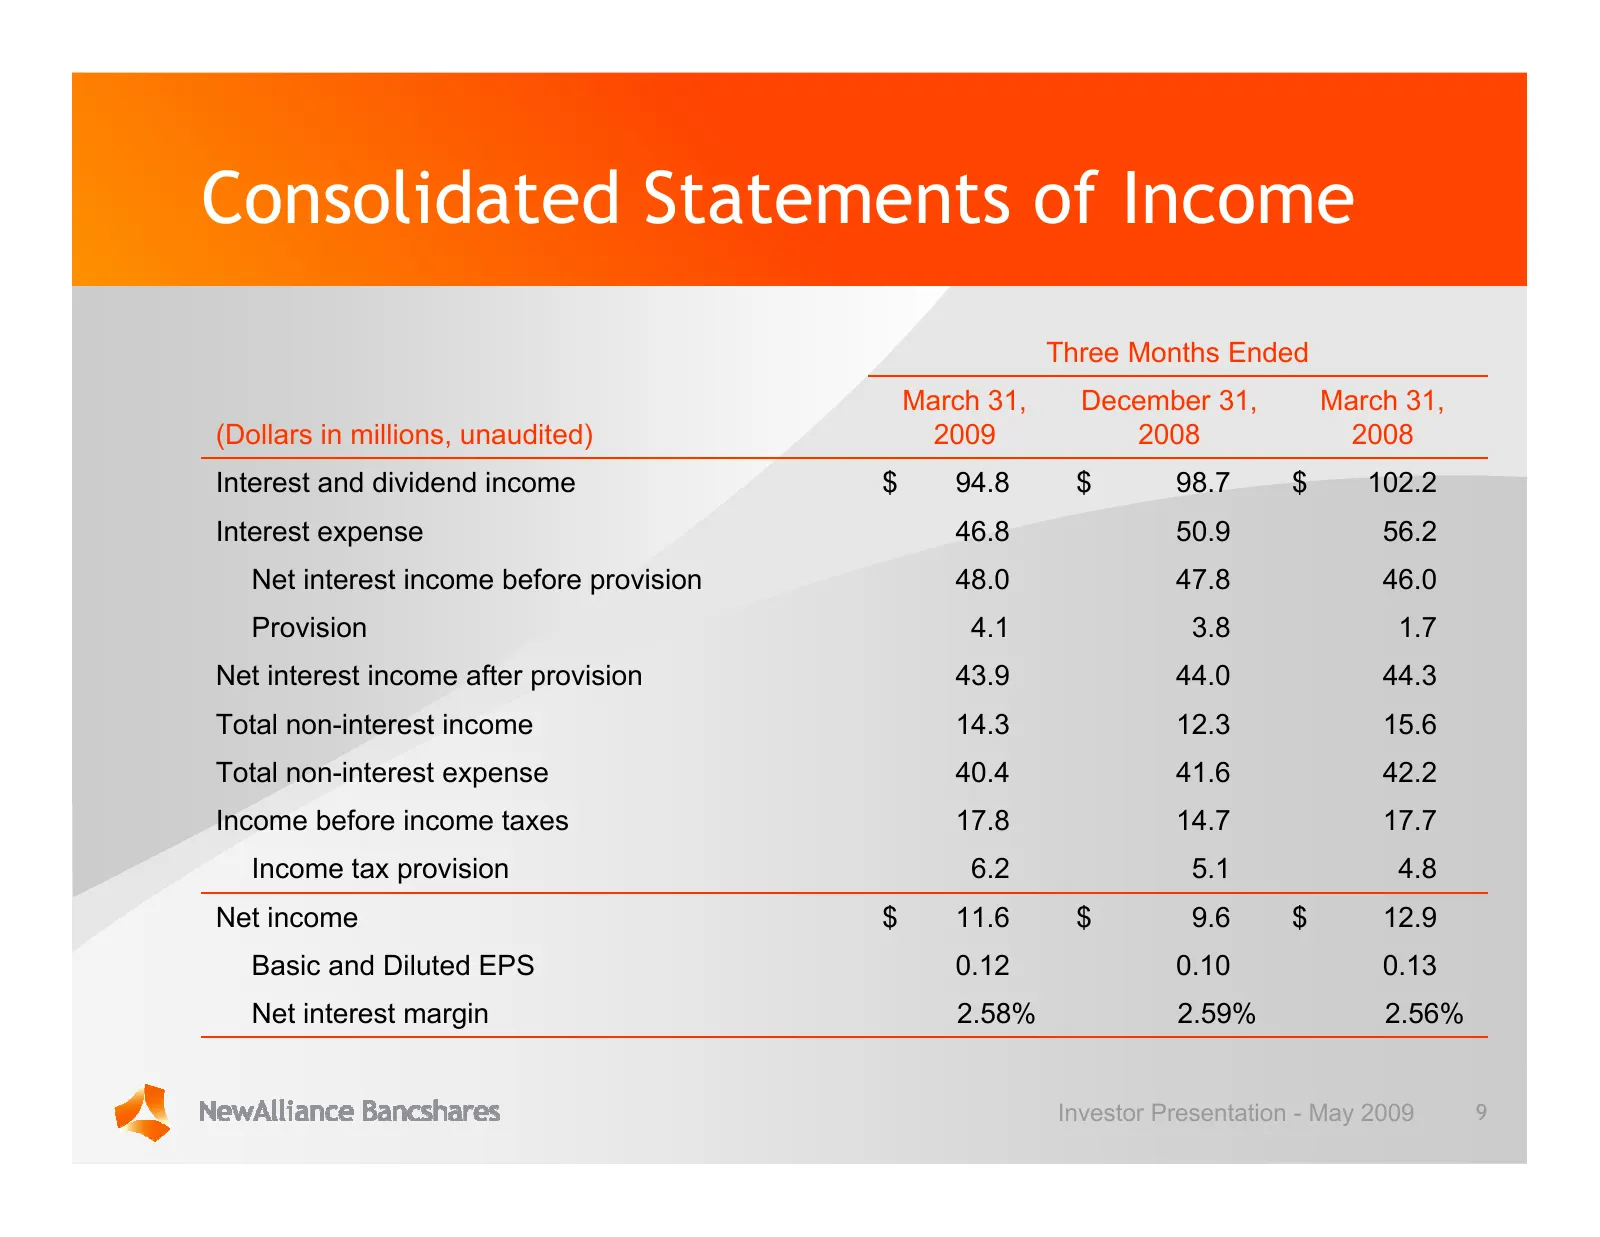
Slide 9: Consolidated Statements of Income
Consolidated Statements of Income Three Months Ended March 31, December 31, March 31, (Dollars in millions, unaudited) 2009 2008 2008 Interest and dividend income $ 94.8 $ 98.7 $ 102.2 Interest expense 46.8 50.9 56.2 Net interest income before provision 48.0 47.8 46.0 Provision 4.1 3.8 1.7 Net inter
Slide 10: Highlights of First Quarter 2009: Strengthen the Margin
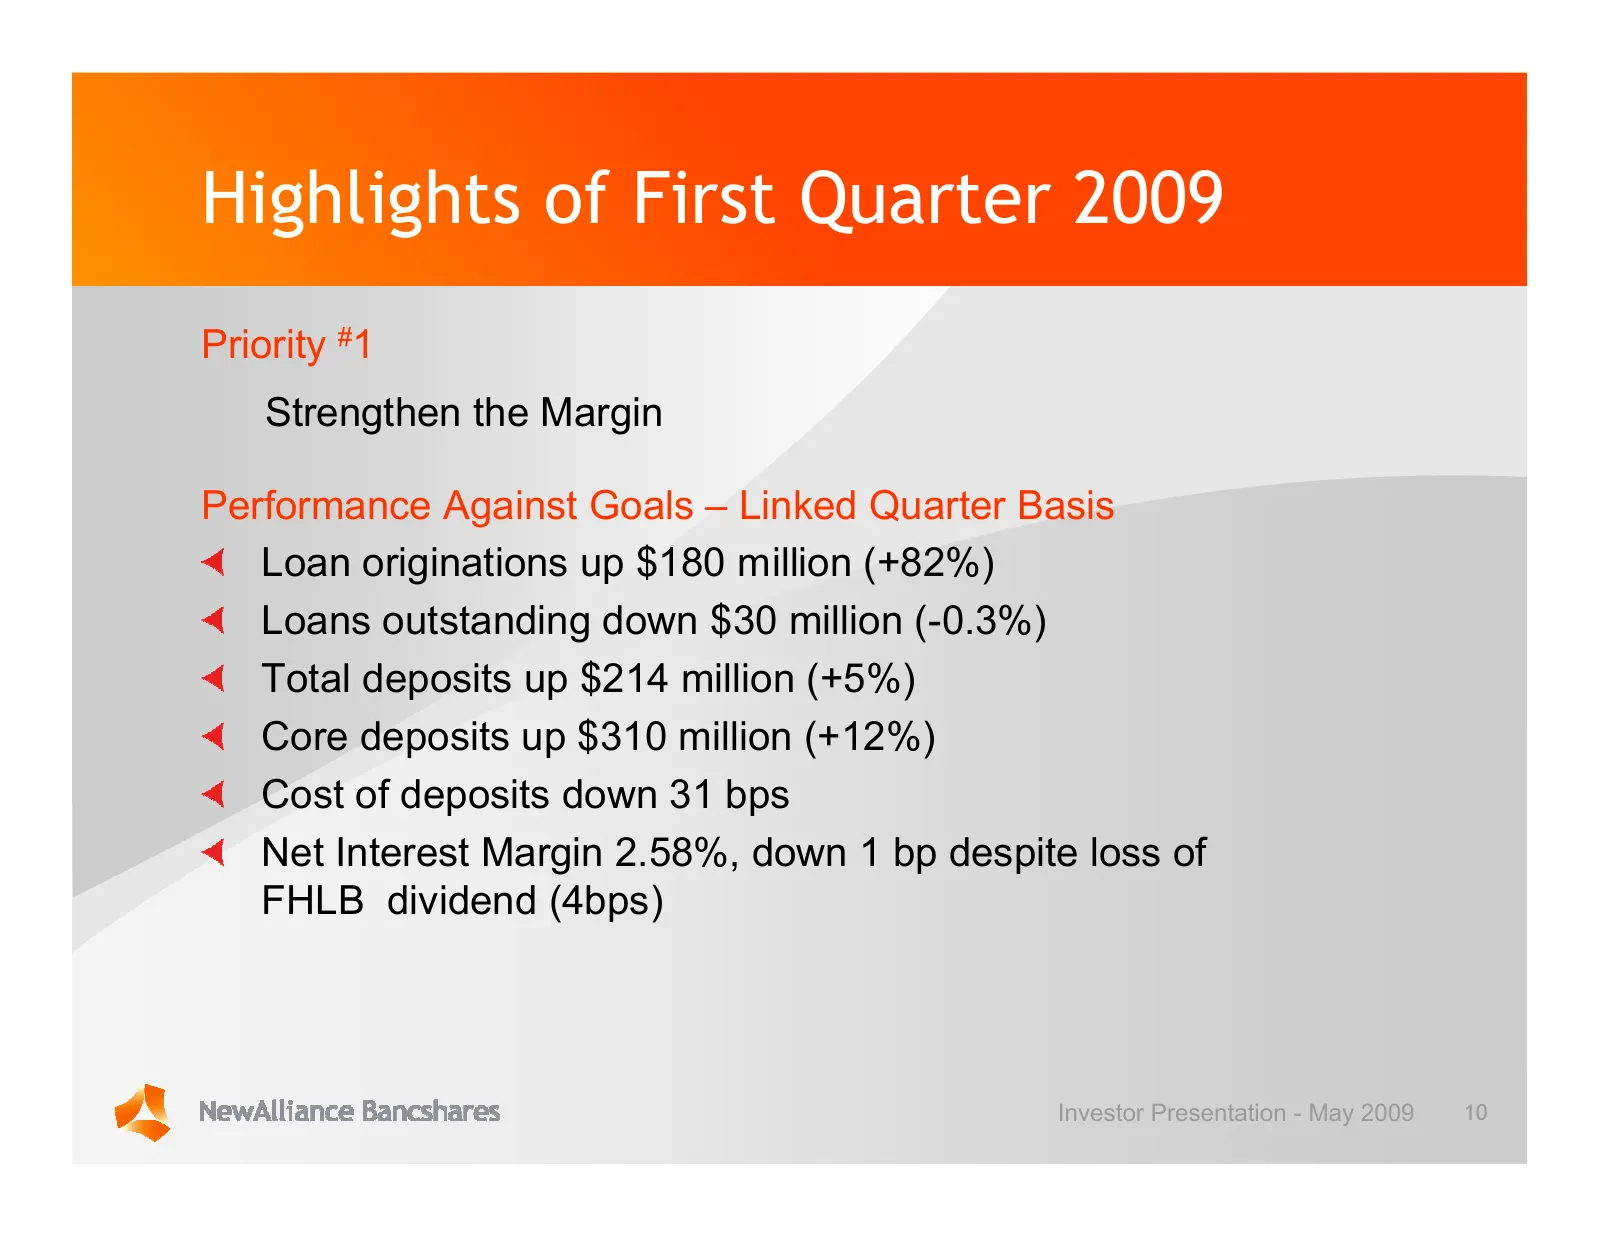
Highlights of First Quarter 2009 Priority #1 Strengthen the Margin Performance Against Goals – Linked Quarter Basis Loan originations up $180 million (+82%) Loans outstanding down $30 million (-0.3%) Total deposits up $214 million (+5%) Core deposits up $310 million (+12%) Cost of deposits down 31 b
Slide 11: Quarterly Loan Originations
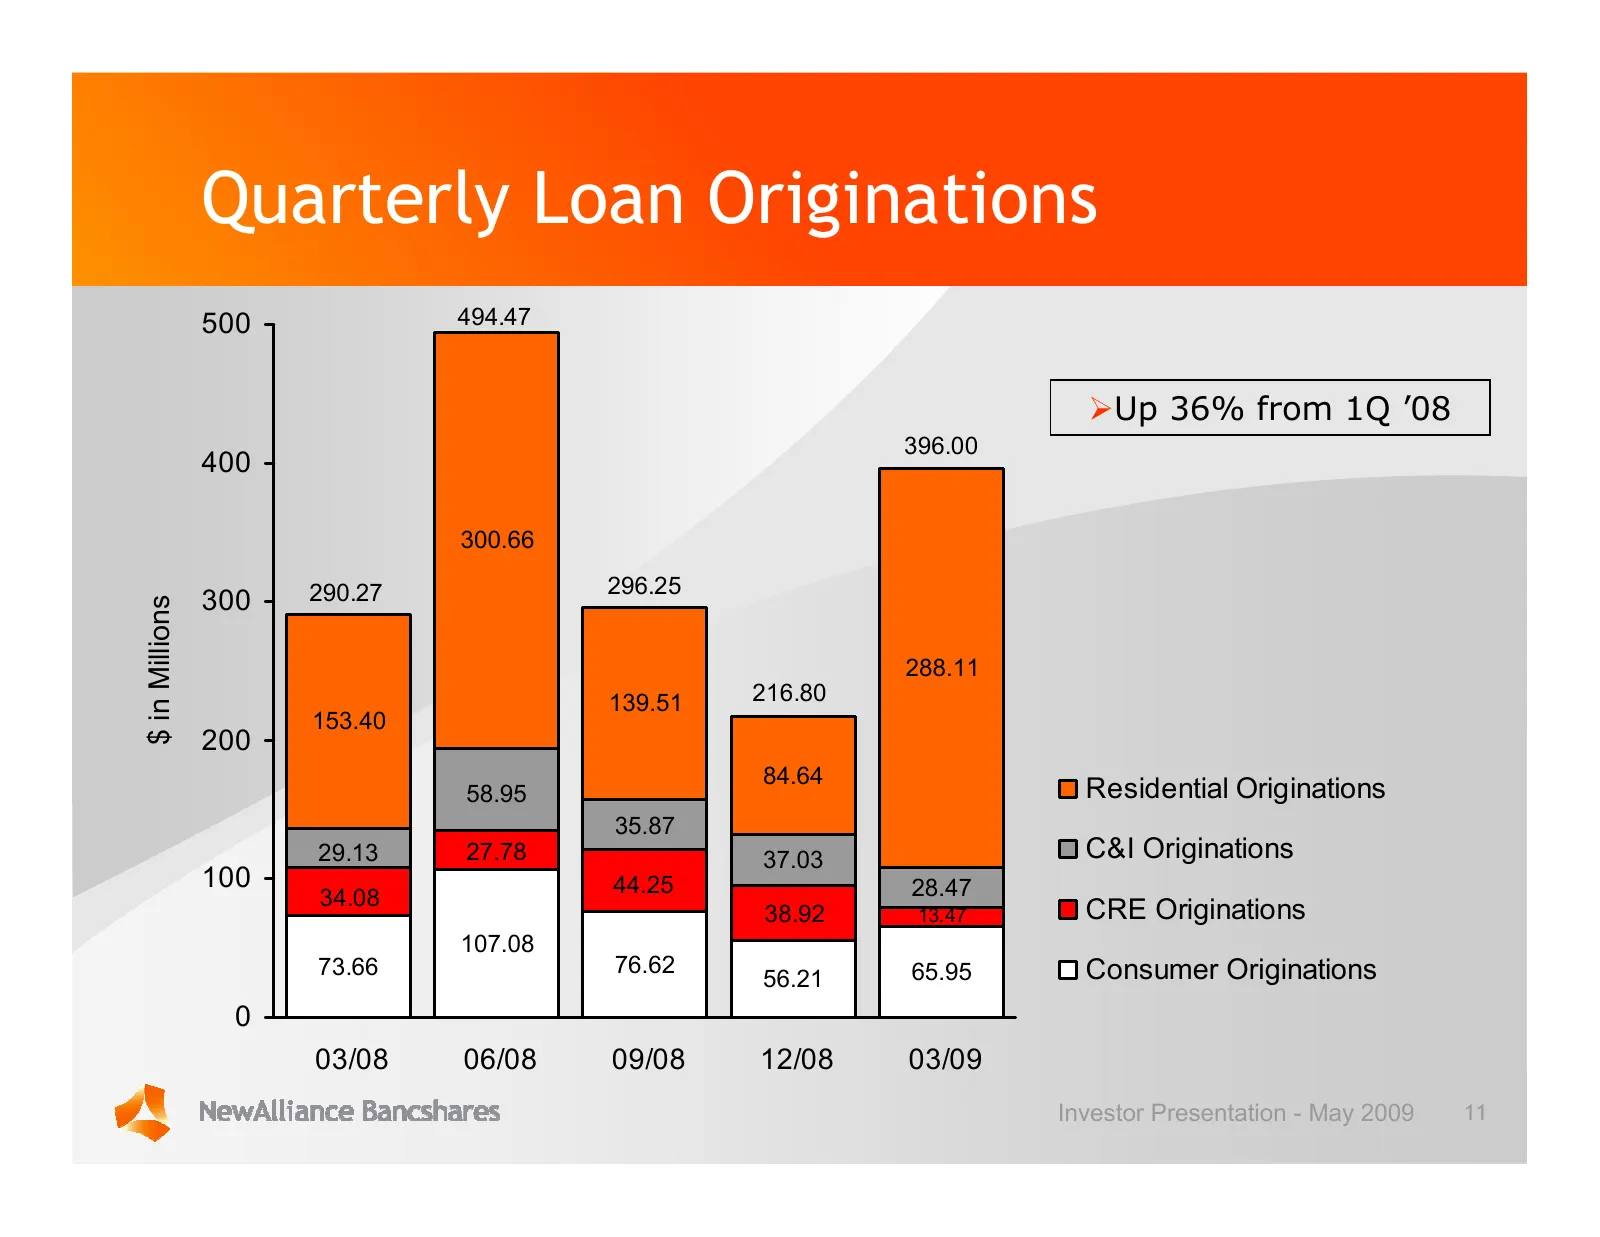
Quarterly Loan Originations 500 494.47 ØUp 36% from 1Q ’08 396.00 400 300.66 290.27 296.25 300 $ in Millions 288.11 139.51 216.80 153.40 200 84.64 58.95 Residential Originations 35.87 29.13 27.78 37.03 C&I Originations 100 44.25 28.47 34.08 38.92 13.47 CRE Originations 107.08 73.66 76.62 65.95 Consu
Slide 12: Quarter End Loan Balances
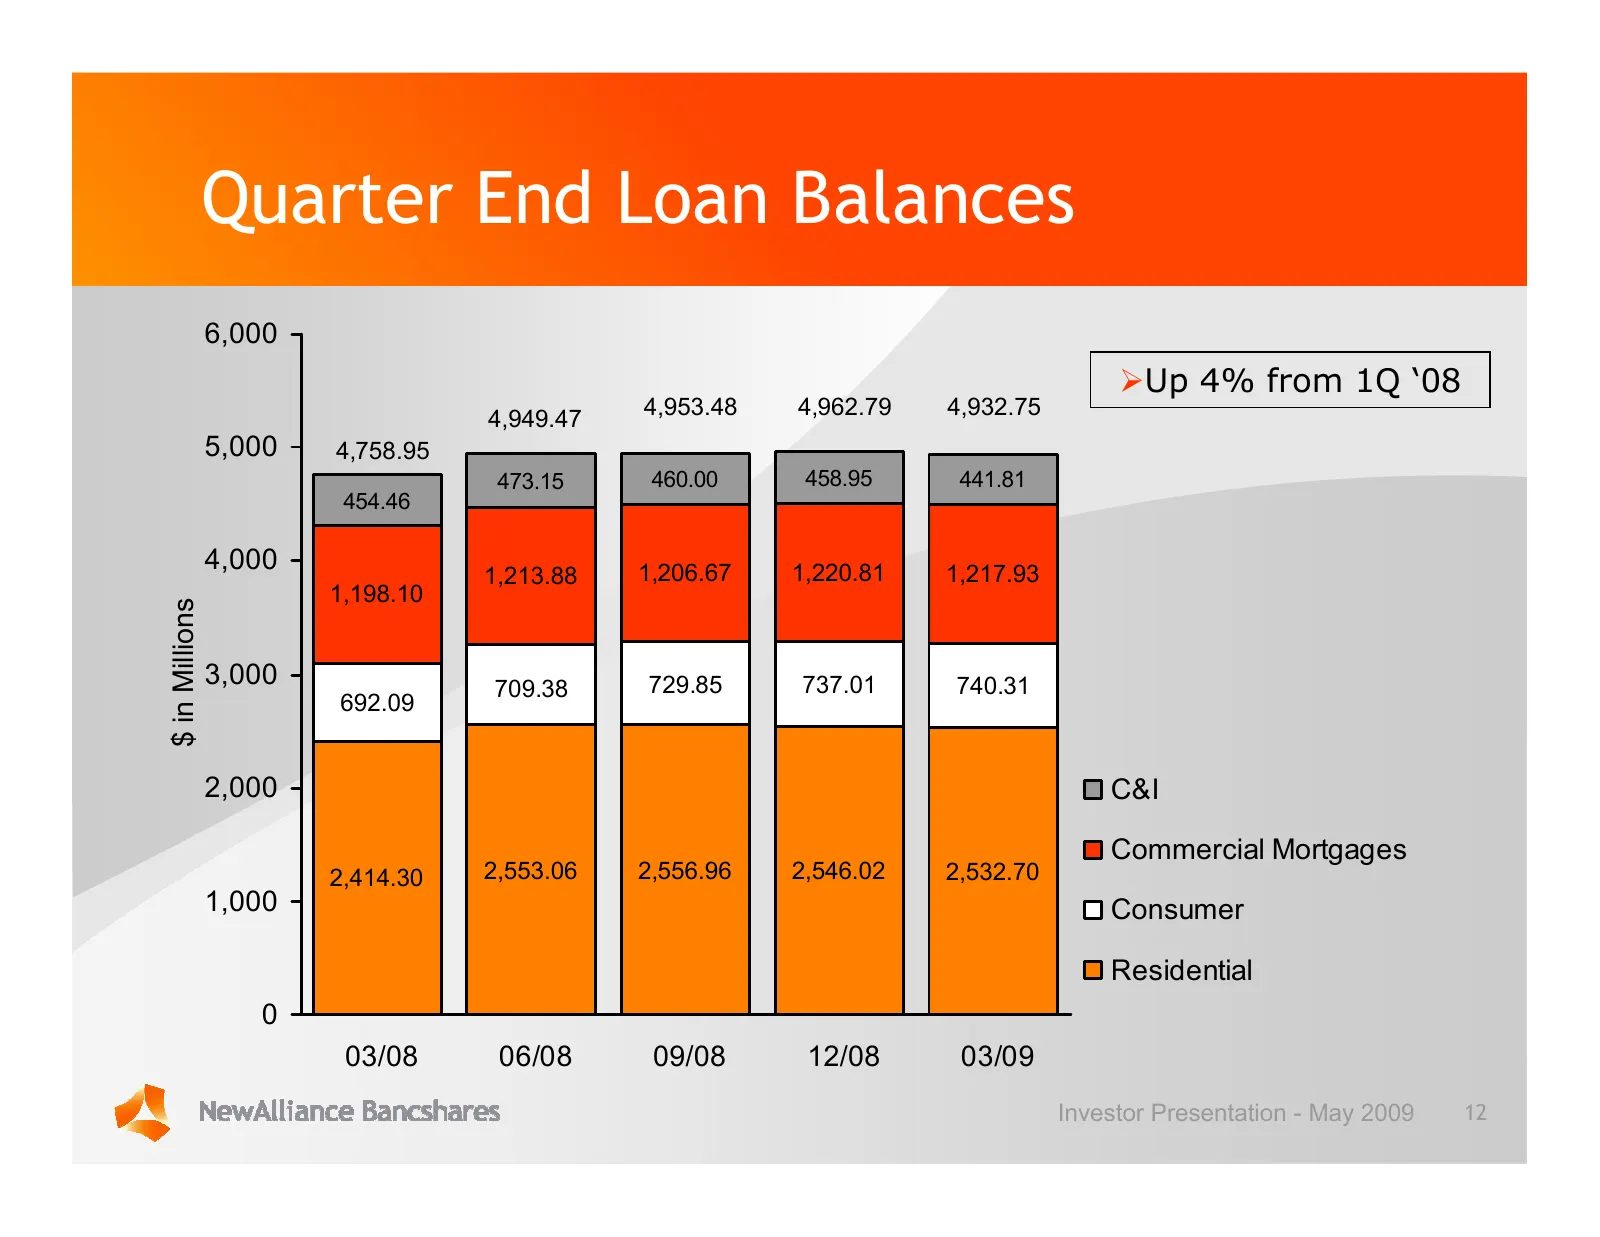
Quarter End Loan Balances 6,000 ØUp 4% from 1Q ‘08 4,949.47 4,953.48 4,962.79 4,932.75 5,000 4,758.95 473.15 460.00 458.95 441.81 454.46 4,000 1,206.67 1,220.81 1,217.93 1,213.88 1,198.10 $ in Millions 3,000 709.38 729.85 737.01 740.31 692.09 2,000 C&I Commercial Mortgages 2,414.30 2,553.06 2,556.96
Slide 13: Quarter End Deposit Balances
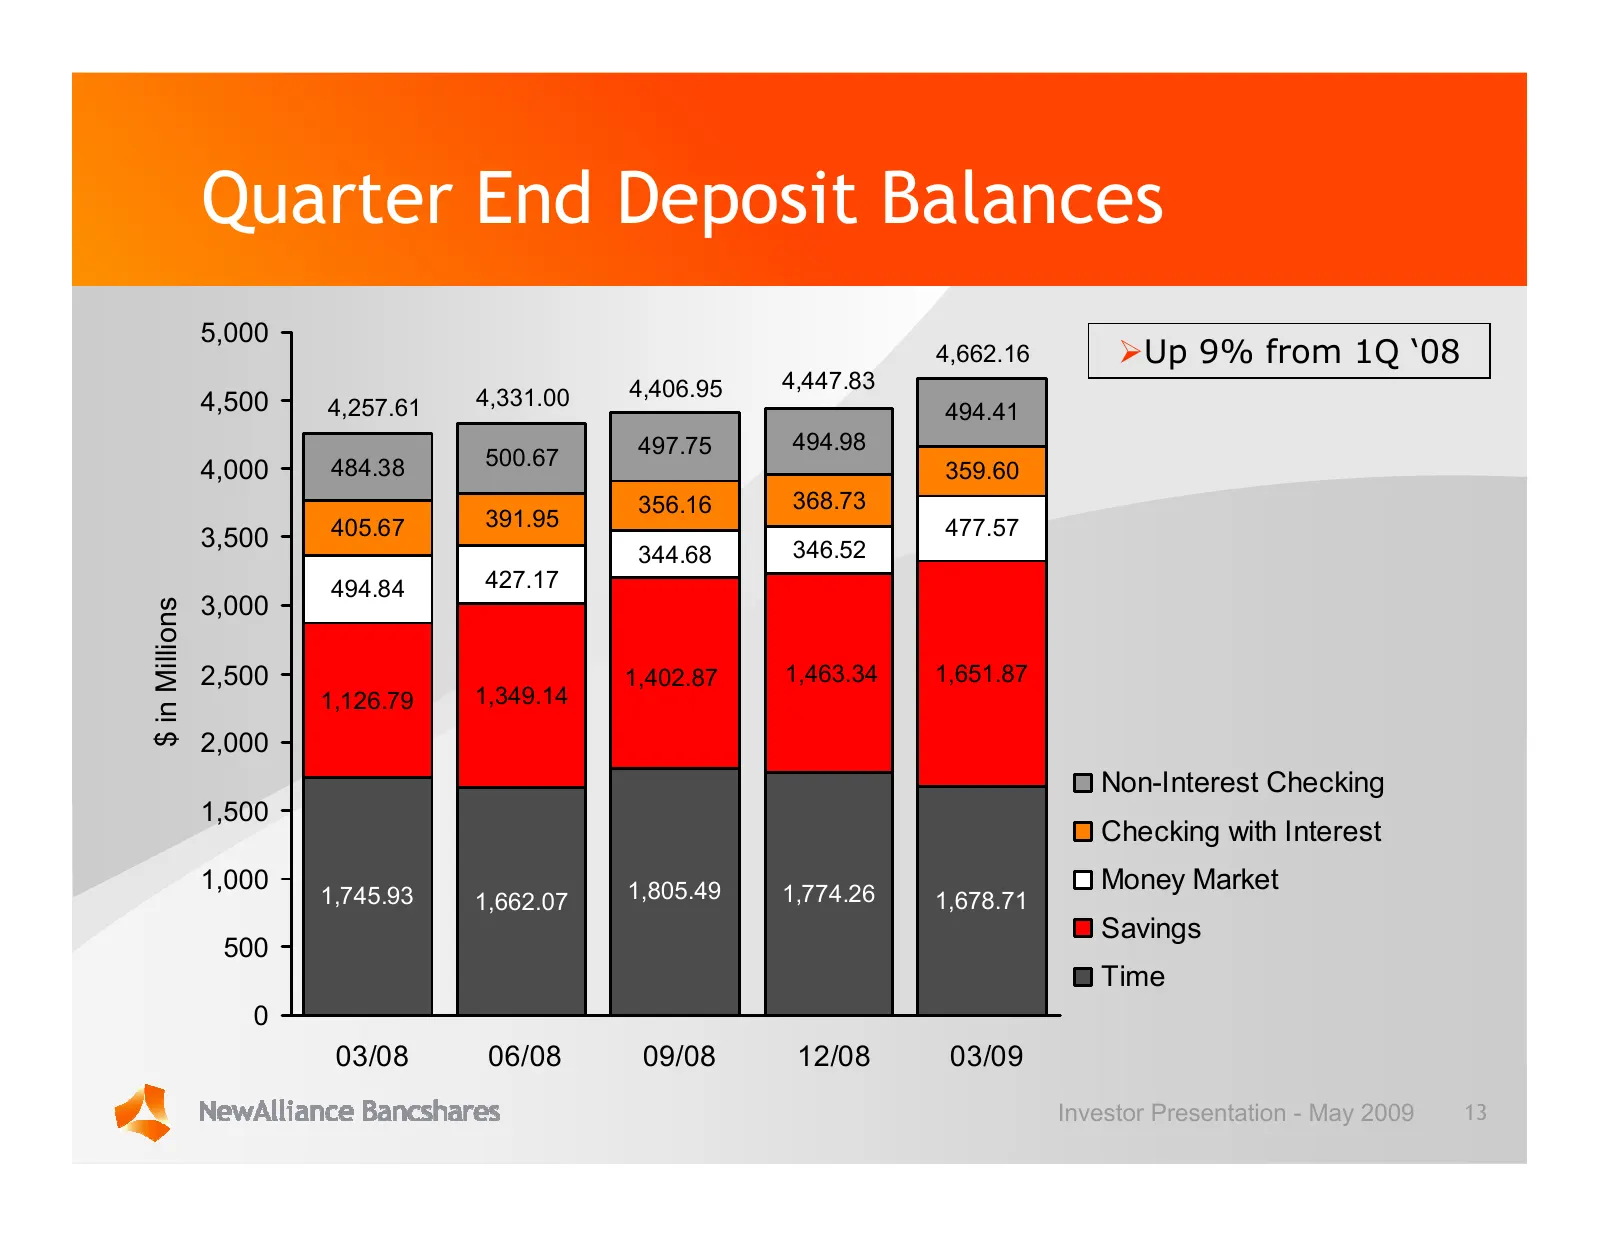
Quarter End Deposit Balances 5,000 4,662.16 ØUp 9% from 1Q ‘08 4,406.95 4,447.83 4,500 4,257.61 4,331.00 494.41 497.75 494.98 484.38 500.67 4,000 359.60 356.16 368.73 405.67 391.95 477.57 3,500 346.52 344.68 494.84 427.17 3,000 $ in Millions 2,500 1,402.87 1,463.34 1,651.87 1,126.79 1,349.14 2,000 N
Slide 14: Deposit Pricing Trends
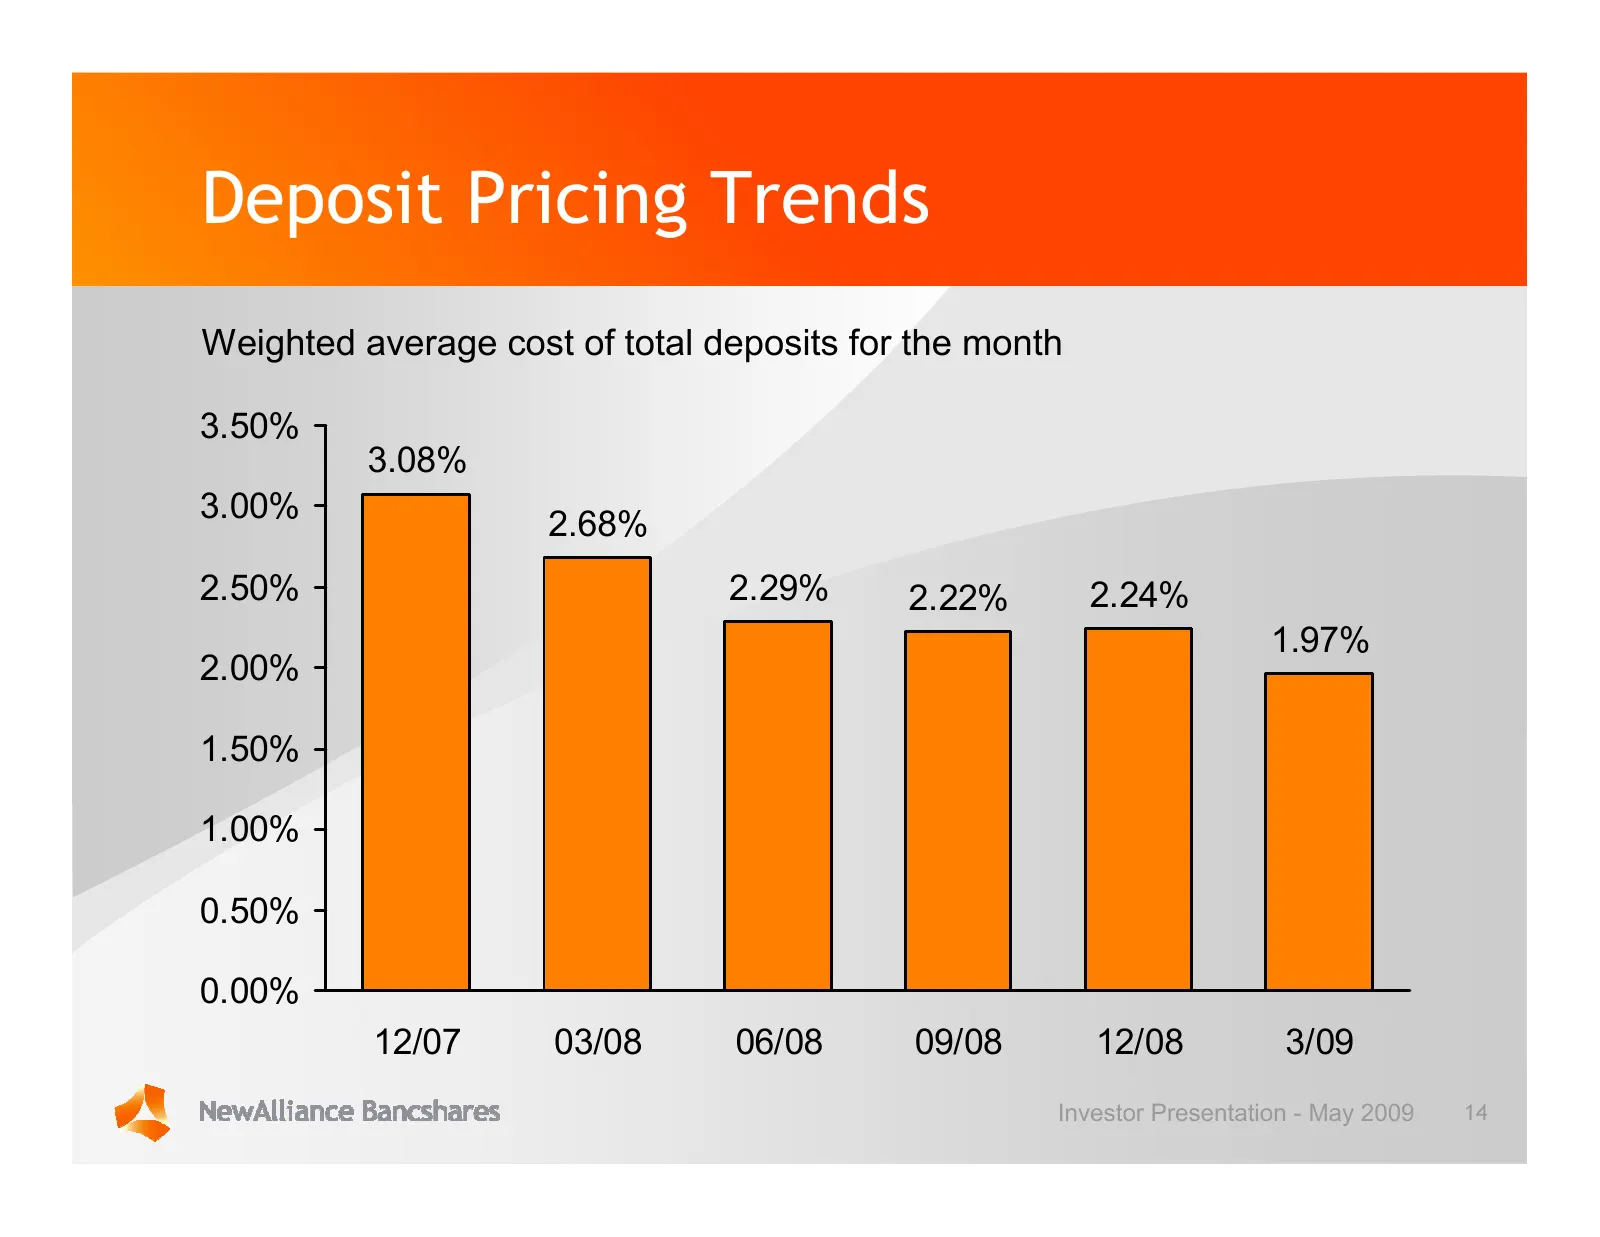
Deposit Pricing Trends Weighted average cost of total deposits for the month 3.50% 3.08% 3.00% 2.68% 2.50% 2.29% 2.22% 2.24% 1.97% 2.00% 1.50% 1.00% 0.50% 0.00% 12/07 03/08 06/08 09/08 12/08 3/09 Investor Presentation - May 2009 14
Slide 15: Highlights of First Quarter 2009: Build Core Fee Income
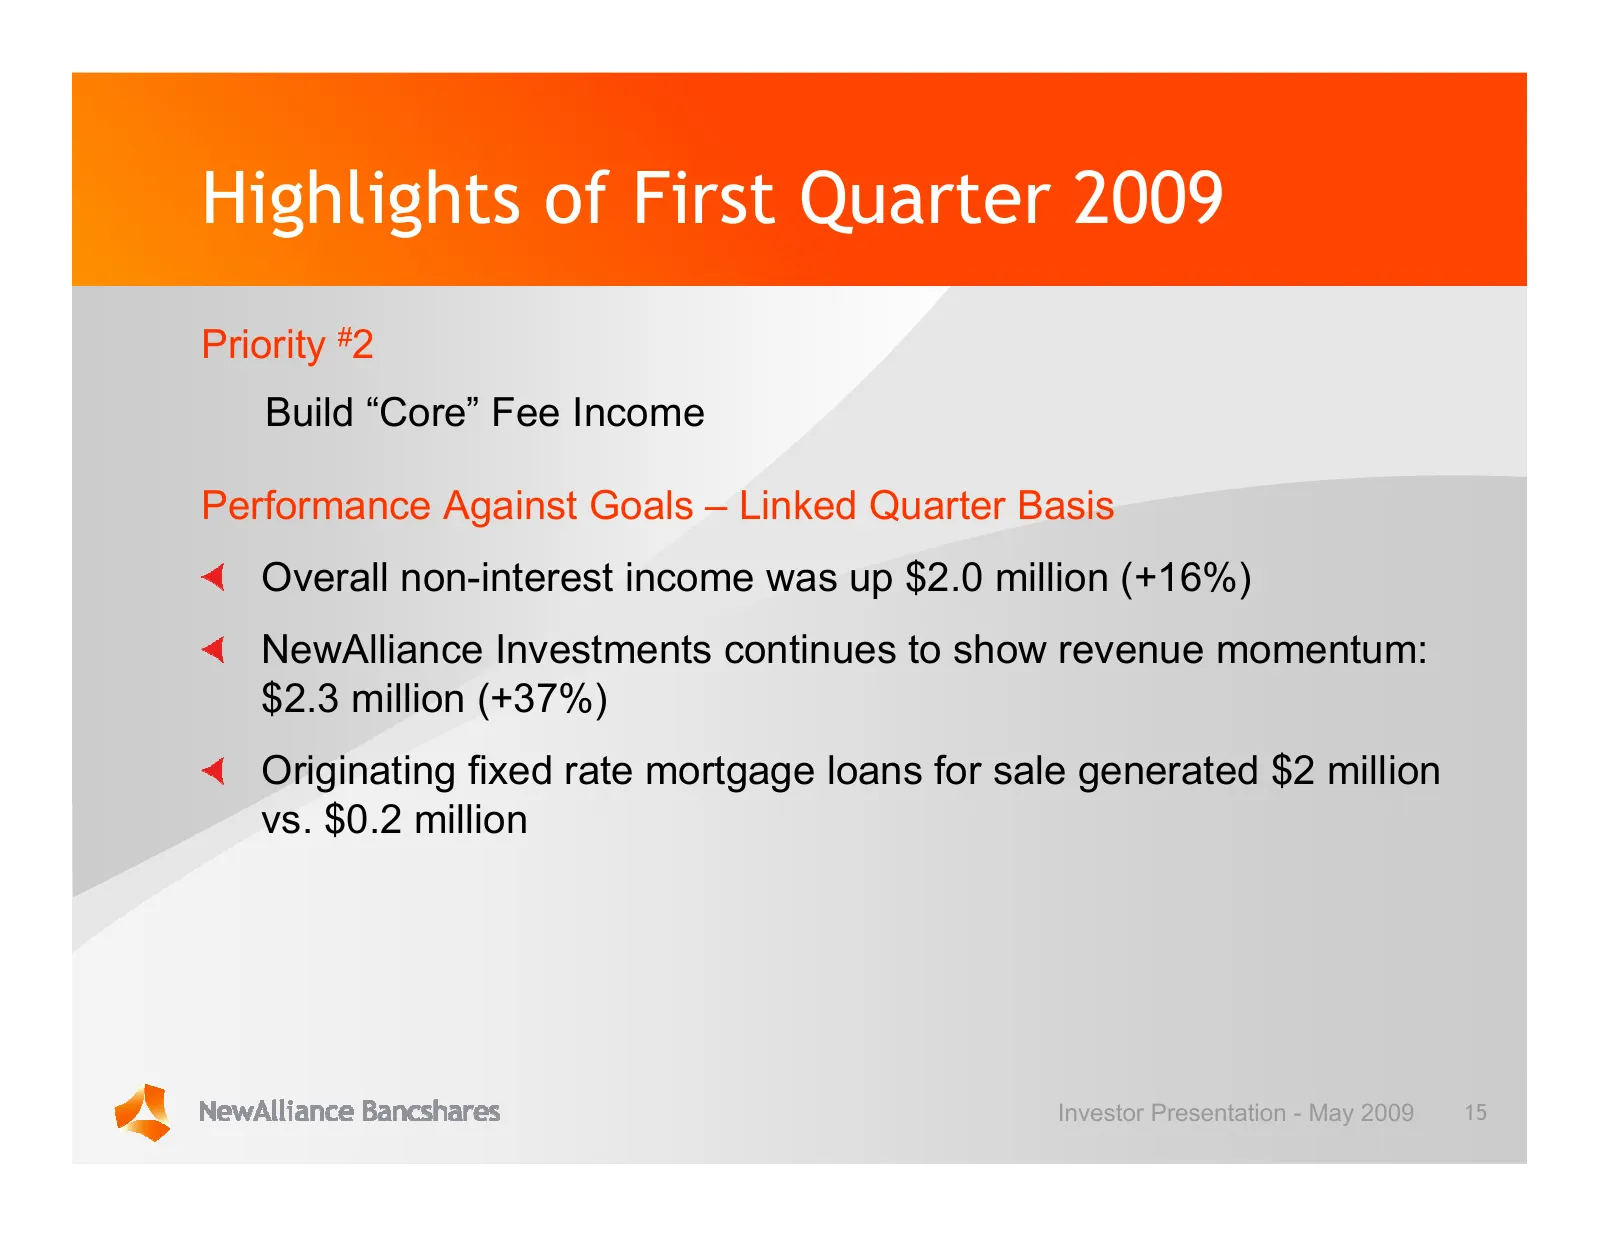
Highlights of First Quarter 2009 Priority #2 Build “Core” Fee Income Performance Against Goals – Linked Quarter Basis Overall non-interest income was up $2.0 million (+16%) NewAlliance Investments continues to show revenue momentum: $2.3 million (+37%) Originating fixed rate mortgage loans for sale
Slide 16: Highlights of First Quarter 2009: Manage Credit Quality
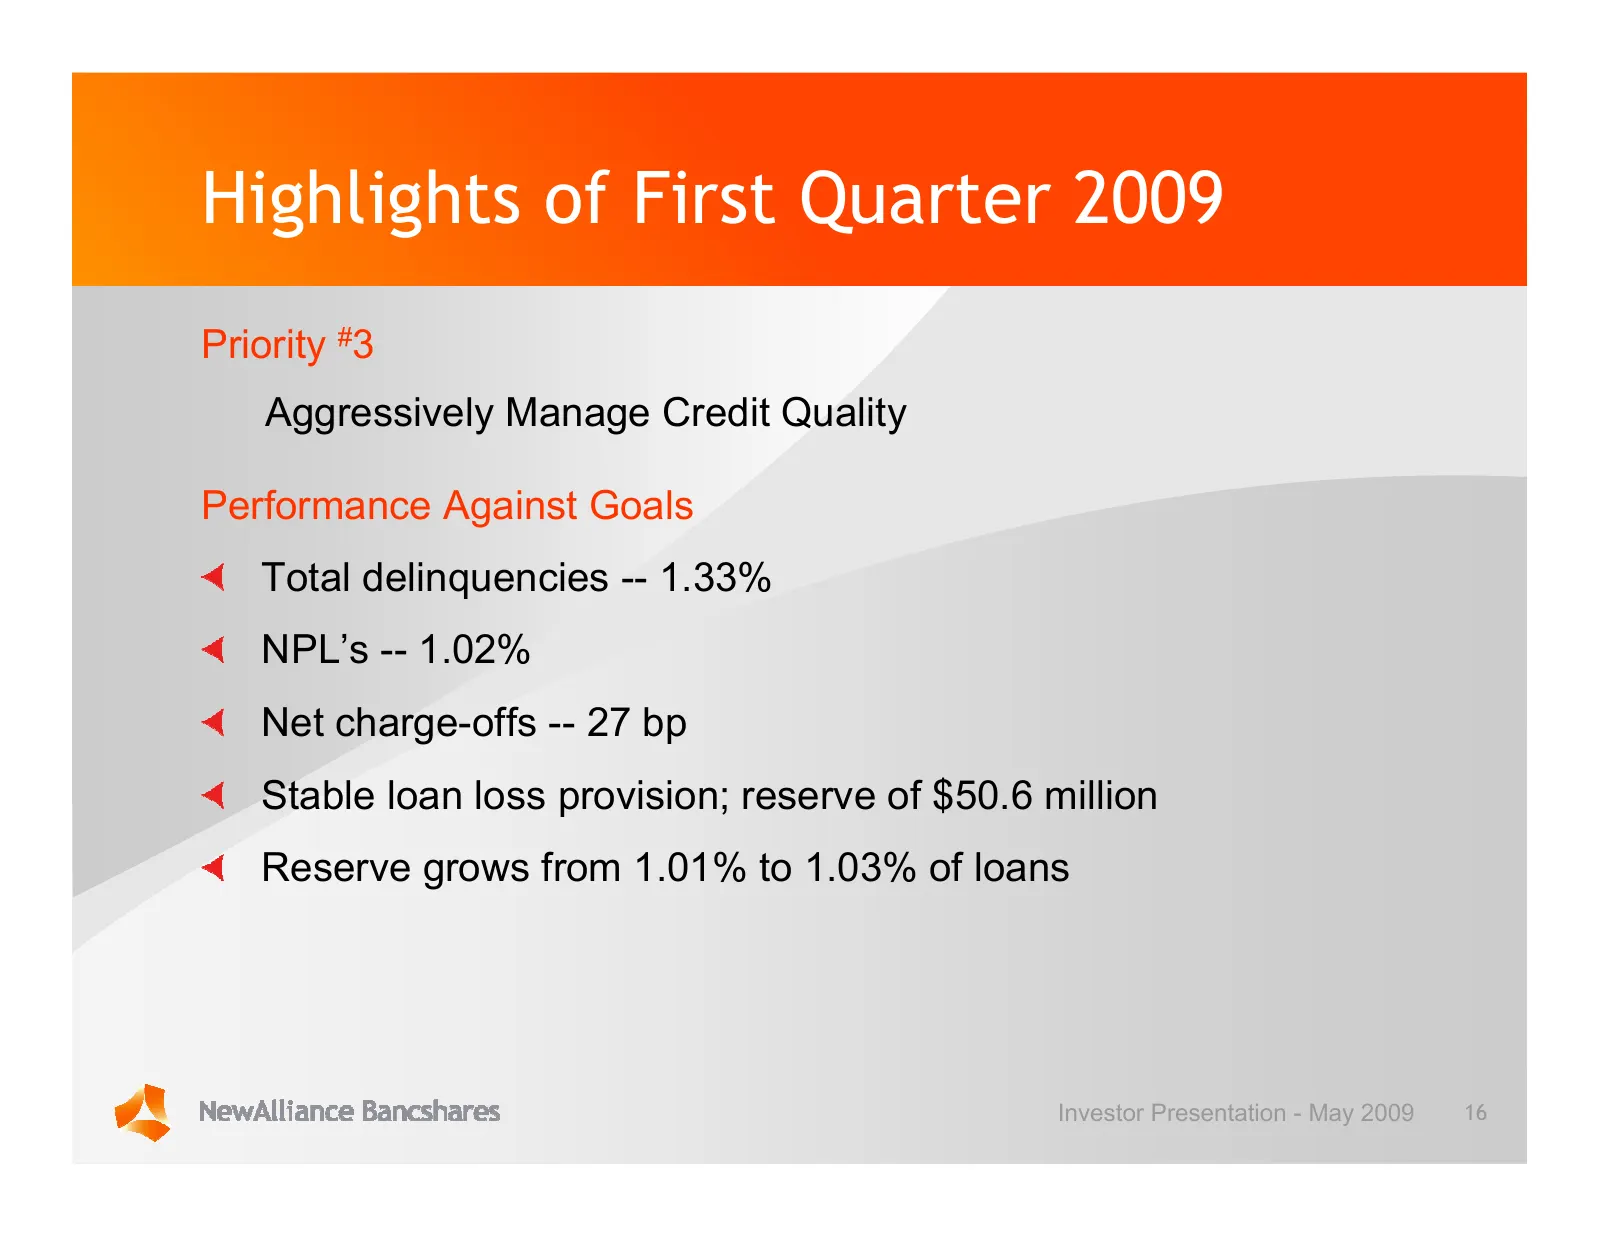
Highlights of First Quarter 2009 Priority #3 Aggressively Manage Credit Quality Performance Against Goals Total delinquencies -- 1.33% NPL’s -- 1.02% Net charge-offs -- 27 bp Stable loan loss provision; reserve of $50.6 million Reserve grows from 1.01% to 1.03% of loans Investor Presentation - May 2
Slide 17: Highlights of First Quarter 2009: Maintain Flat Expenses
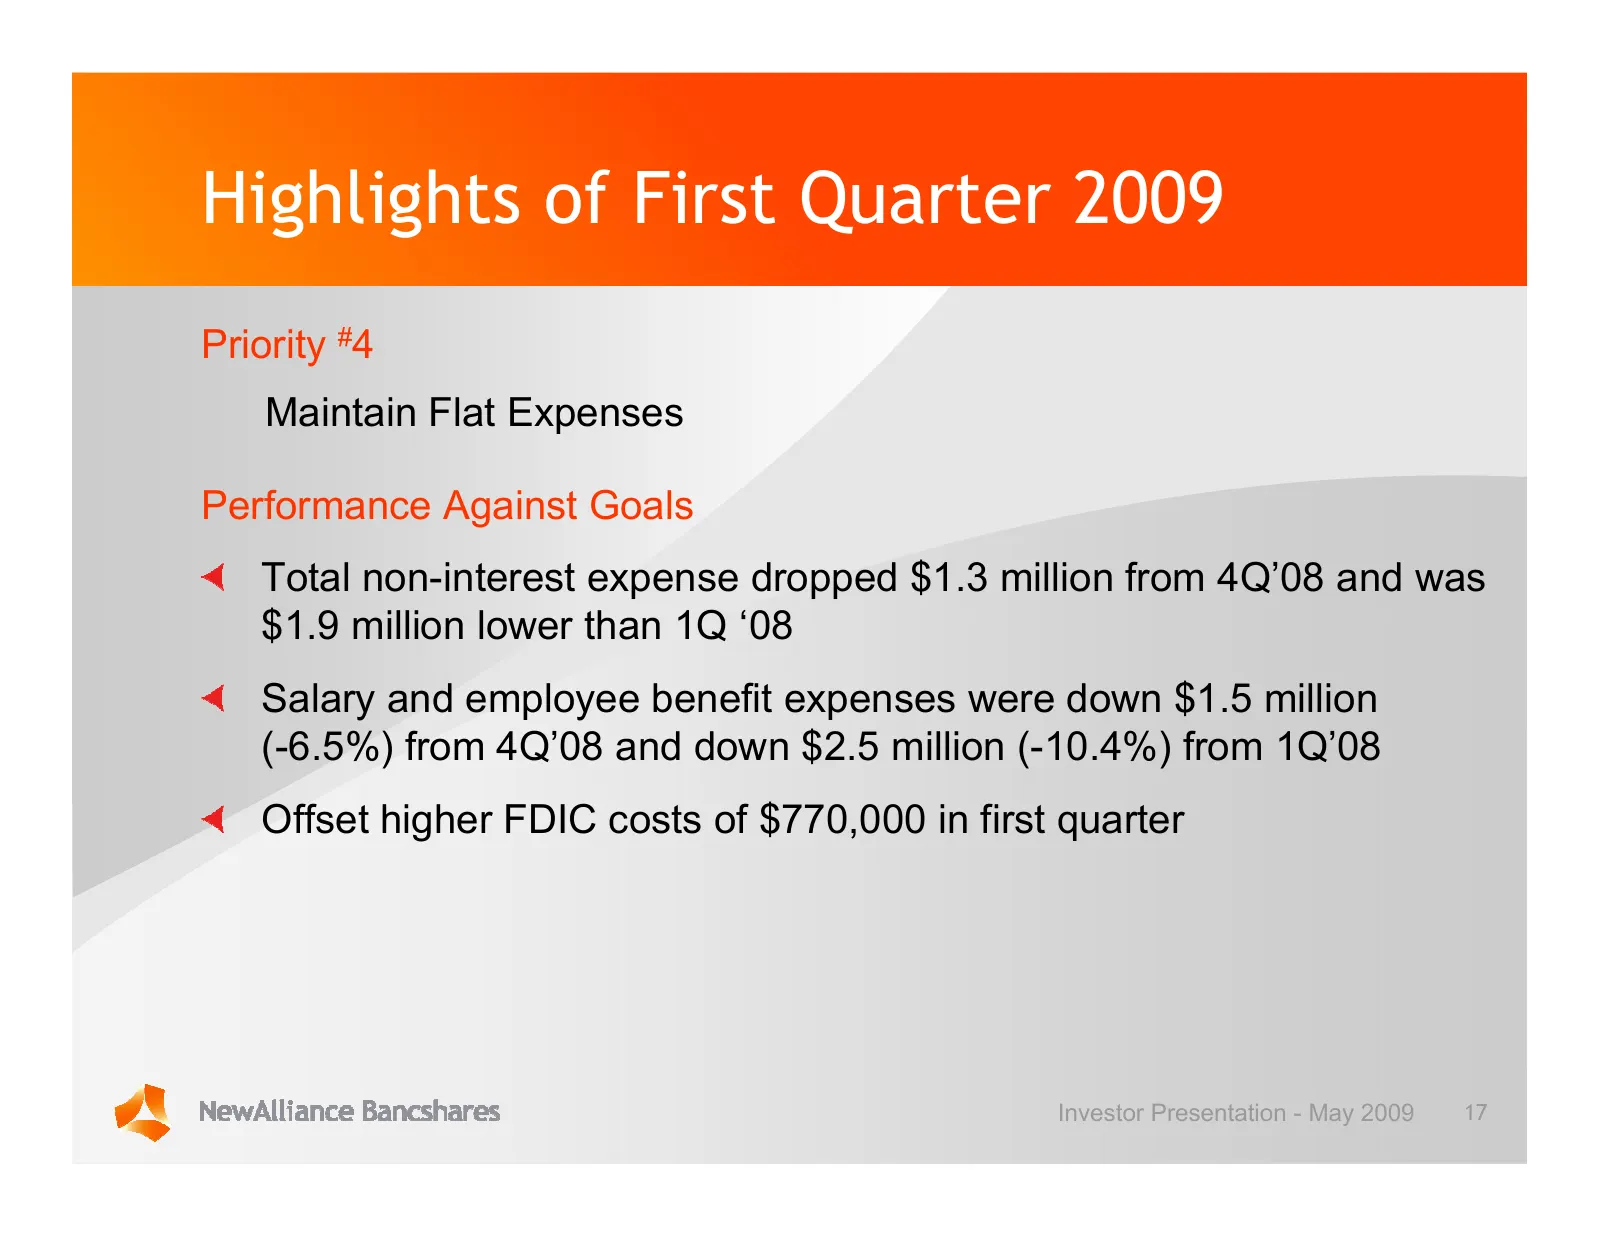
Highlights of First Quarter 2009 Priority #4 Maintain Flat Expenses Performance Against Goals Total non-interest expense dropped $1.3 million from 4Q’08 and was $1.9 million lower than 1Q ‘08 Salary and employee benefit expenses were down $1.5 million (-6.5%) from 4Q’08 and down $2.5 million (-10.4%
Slide 18: Highlights of First Quarter 2009: Grow the Franchise
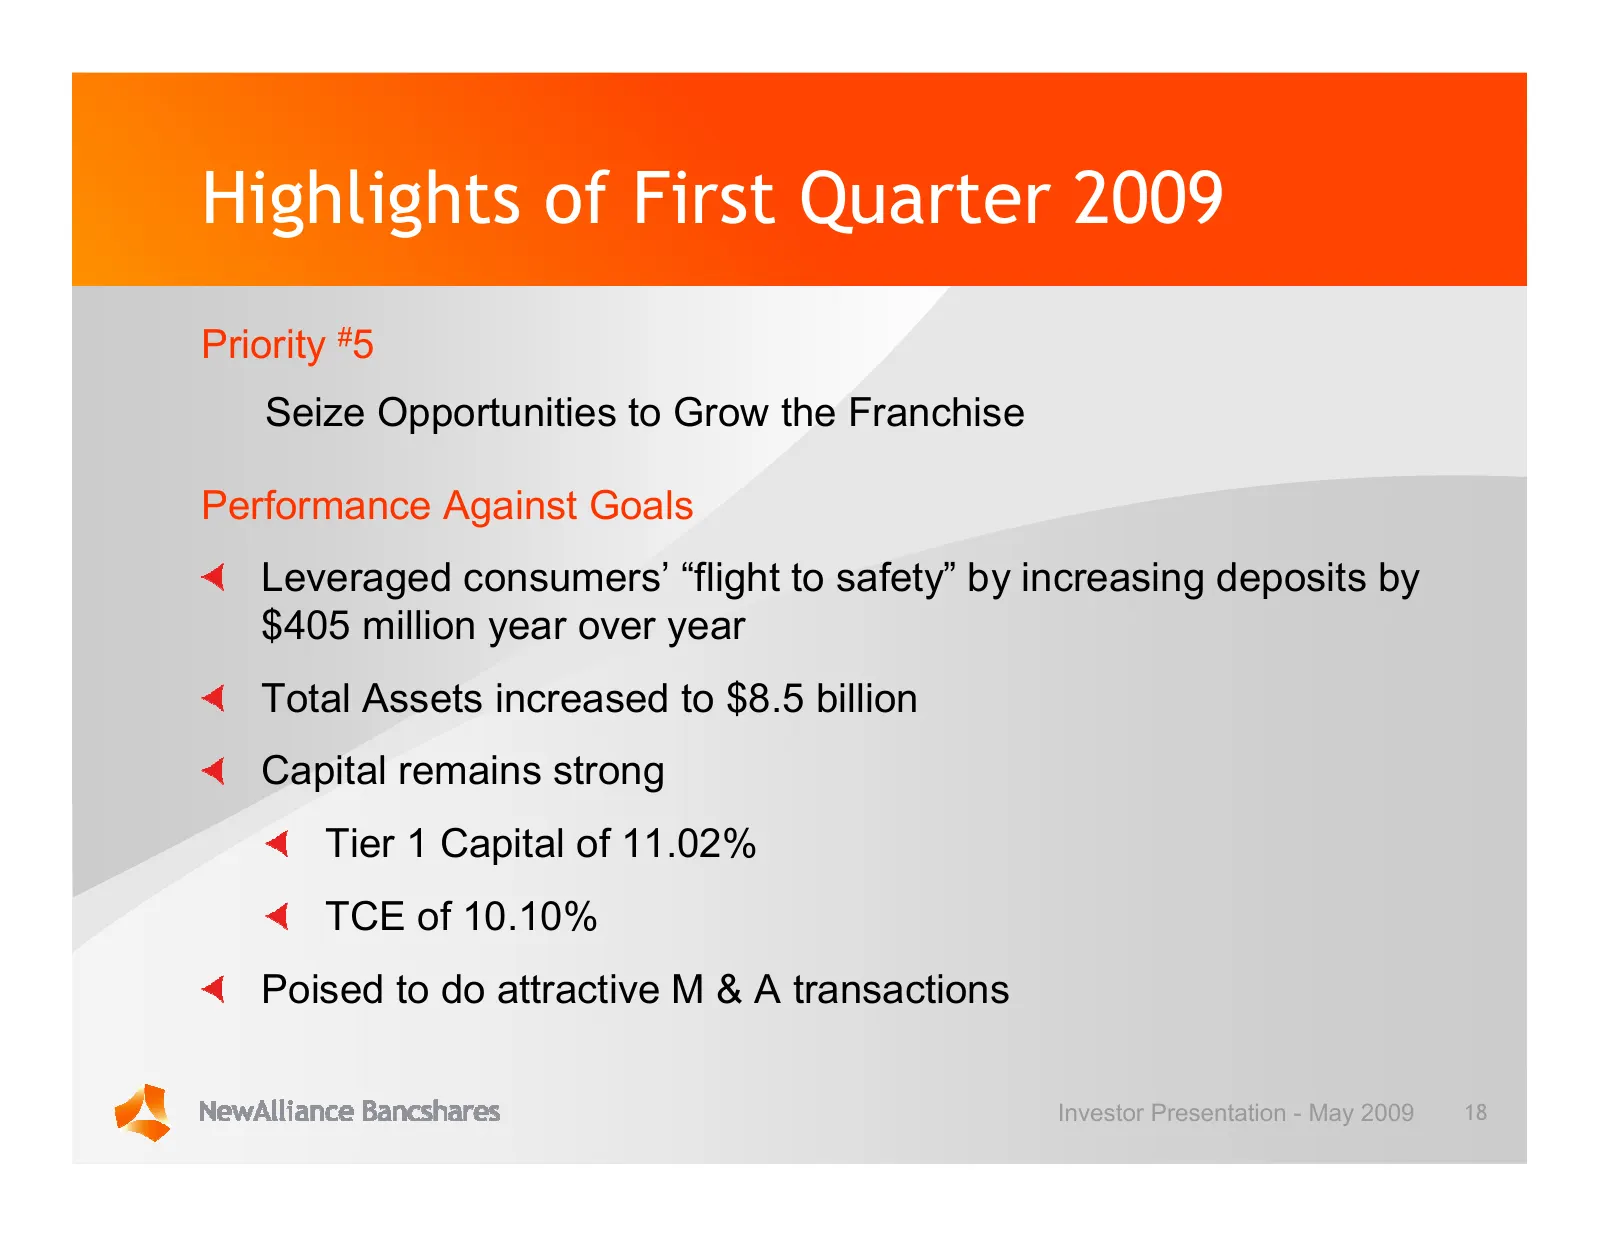
Highlights of First Quarter 2009 Priority #5 Seize Opportunities to Grow the Franchise Performance Against Goals Leveraged consumers’ “flight to safety” by increasing deposits by $405 million year over year Total Assets increased to $8.5 billion Capital remains strong Tier 1 Capital of 11.02% TCE of
Slide 19: Highlights of First Quarter 2009: Grow the Franchise (continued)
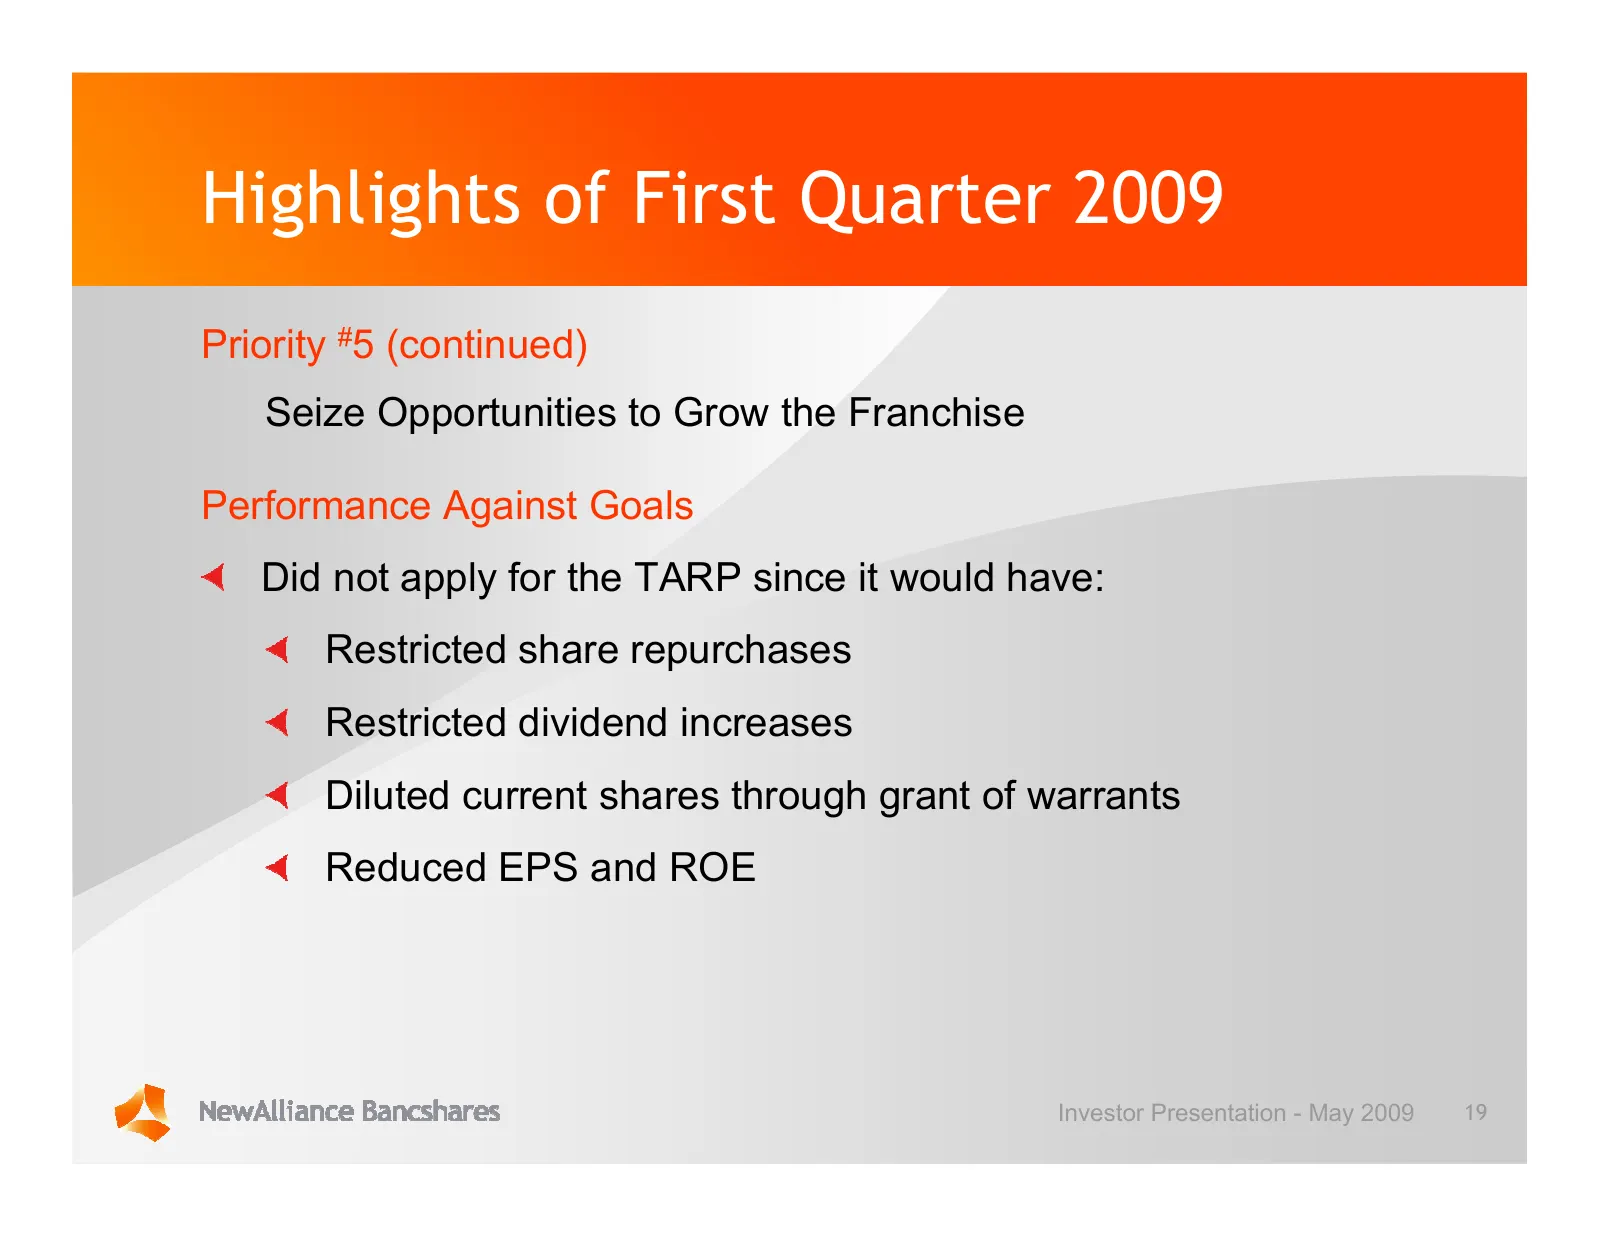
Highlights of First Quarter 2009 Priority #5 (continued) Seize Opportunities to Grow the Franchise Performance Against Goals Did not apply for the TARP since it would have: Restricted share repurchases Restricted dividend increases Diluted current shares through grant of warrants Reduced EPS and ROE
Slide 20: Last Twelve Months Stock Price Performance
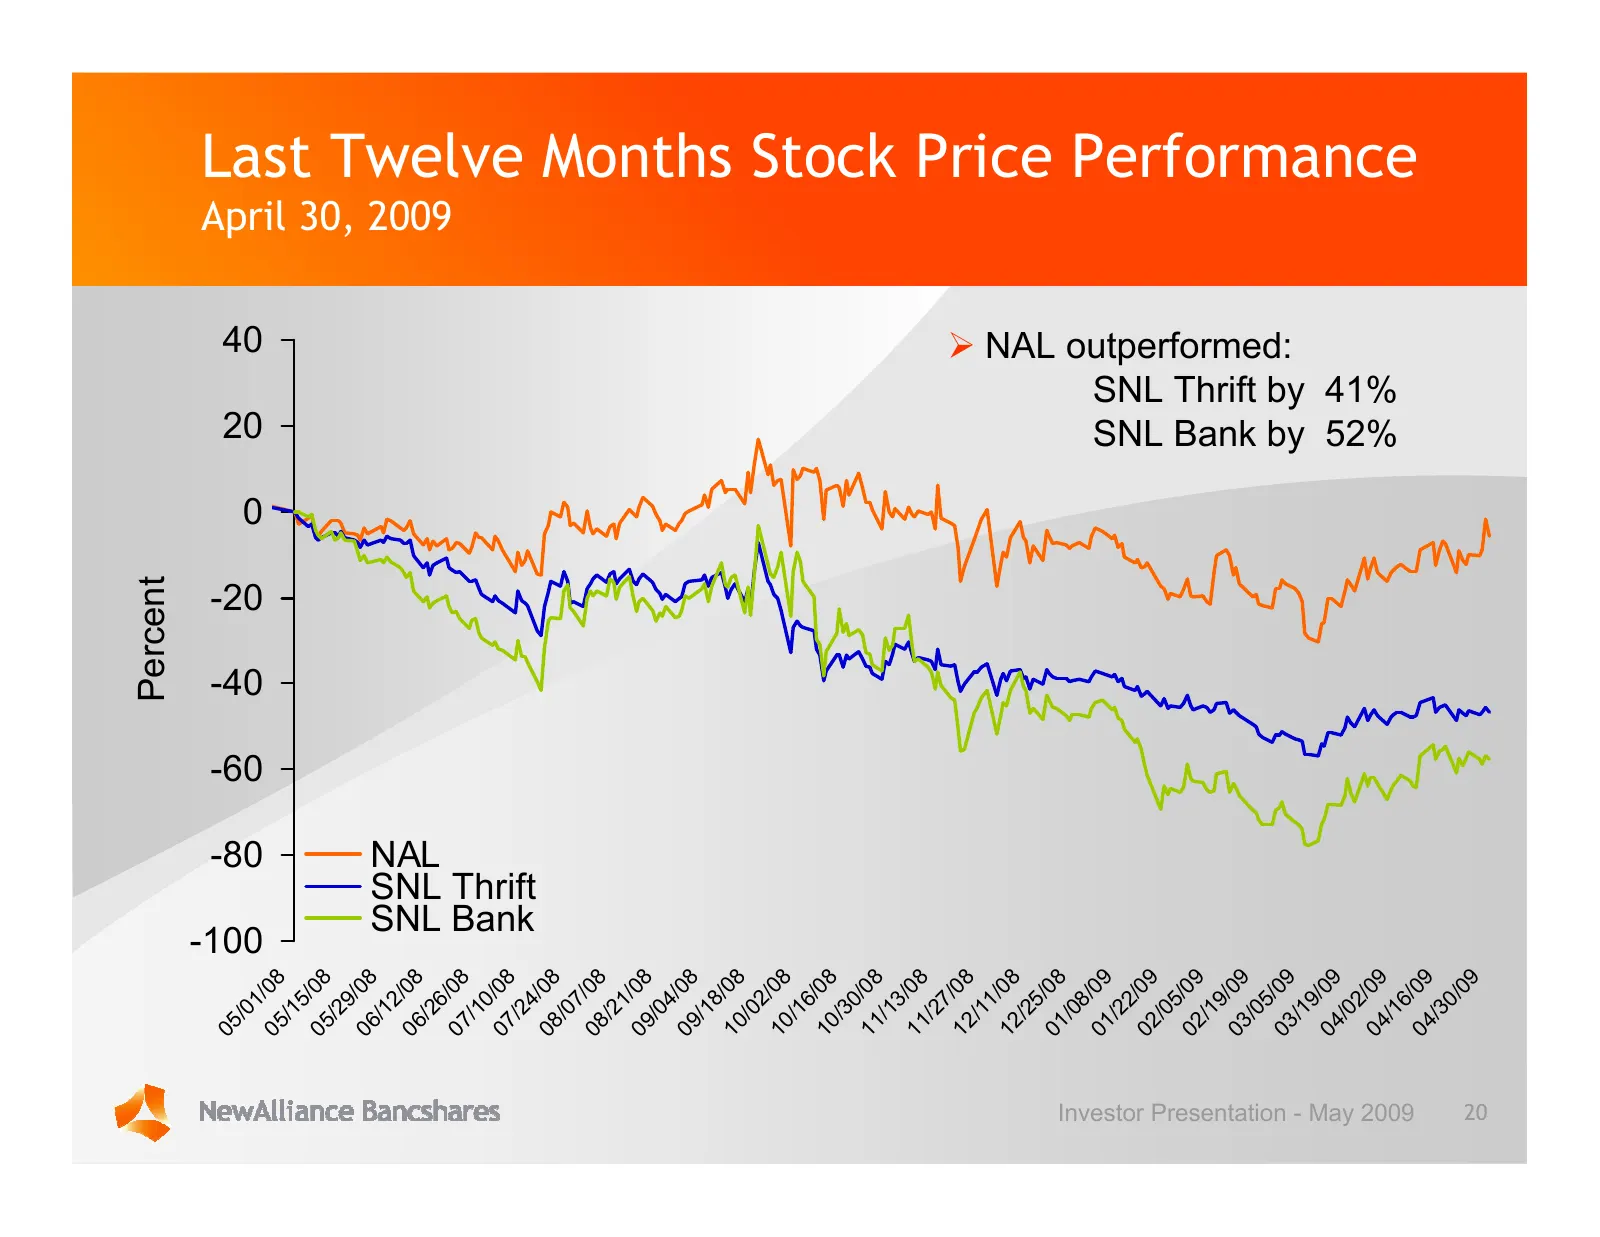
Percent 05 /0 1 0 20 40 -80 -60 -40 -20 -100 05 /08 /1 5 05 /08 /2 9 06 /08 /1 2 06 /08 /2 NAL 6 April 30, 2009 07 /08 /1 0 07 /08 /2 SNL Bank SNL Thrift 4 08 /08 /0 7 08 /08 /2 1 09 /08 /0 4 09 /08 /1 8 10 /08 /0 2 10 /08 /1 6 10 /08 /3 0 11 /08 /1 3 11 /08 /2 7 12 /08 /1 1 12 /08 /2 5 01 /08 /0 8

Slide 21: Balance Sheet and Credit Quality
Balance Sheet and Credit Quality
Slide 22: Balance Sheet
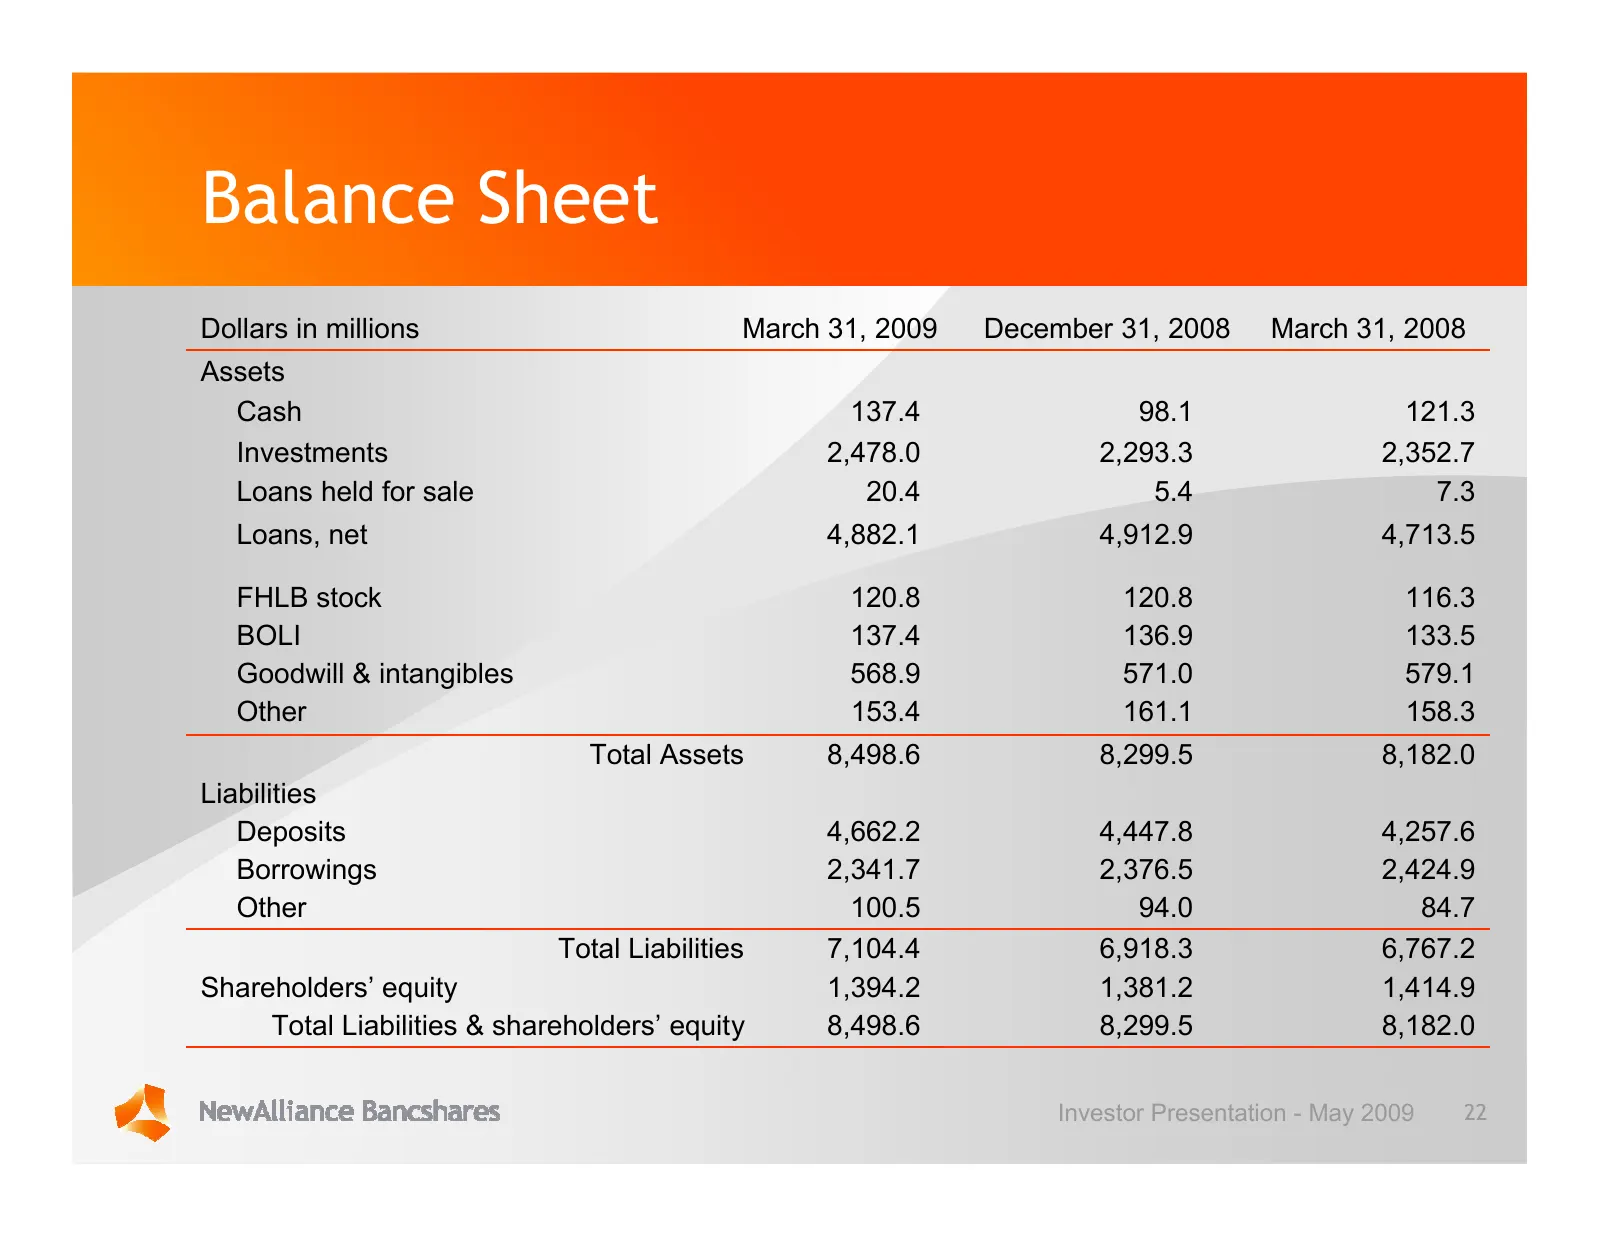
Balance Sheet Dollars in millions March 31, 2009 December 31, 2008 March 31, 2008 Assets Cash 137.4 98.1 121.3 Investments 2,478.0 2,293.3 2,352.7 Loans held for sale 20.4 5.4 7.3 Loans, net 4,882.1 4,912.9 4,713.5 FHLB stock 120.8 120.8 116.3 BOLI 137.4 136.9 133.5 Goodwill & intangibles 568.9 571.
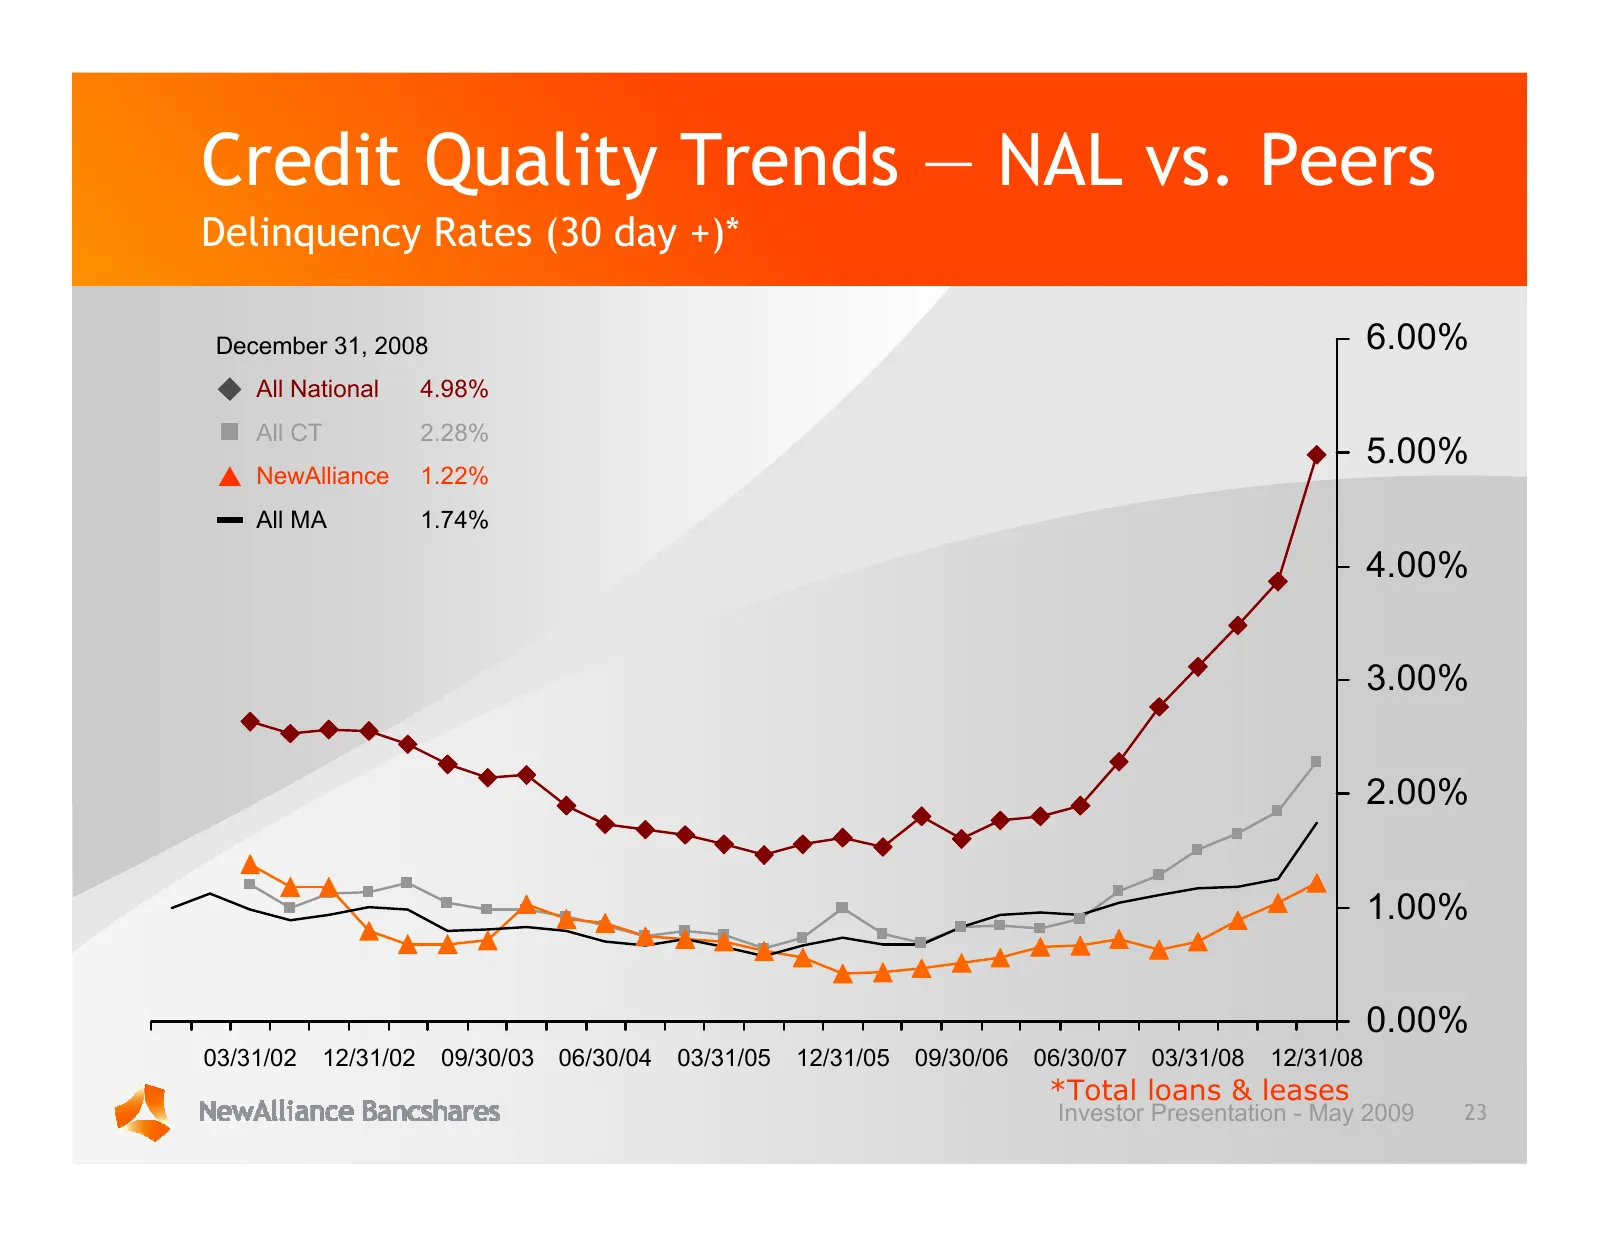
Slide 23: Credit Quality Trends — NAL vs. Peers
Credit Quality Trends — NAL vs. Peers Delinquency Rates (30 day +)* December 31, 2008 6.00% All National 4.98% All CT 2.28% 5.00% NewAlliance 1.22% All MA 1.74% 4.00% 3.00% 2.00% 1.00% 0.00% 03/31/02 12/31/02 09/30/03 06/30/04 03/31/05 12/31/05 09/30/06 06/30/07 03/31/08 12/31/08 *Total loans & leas
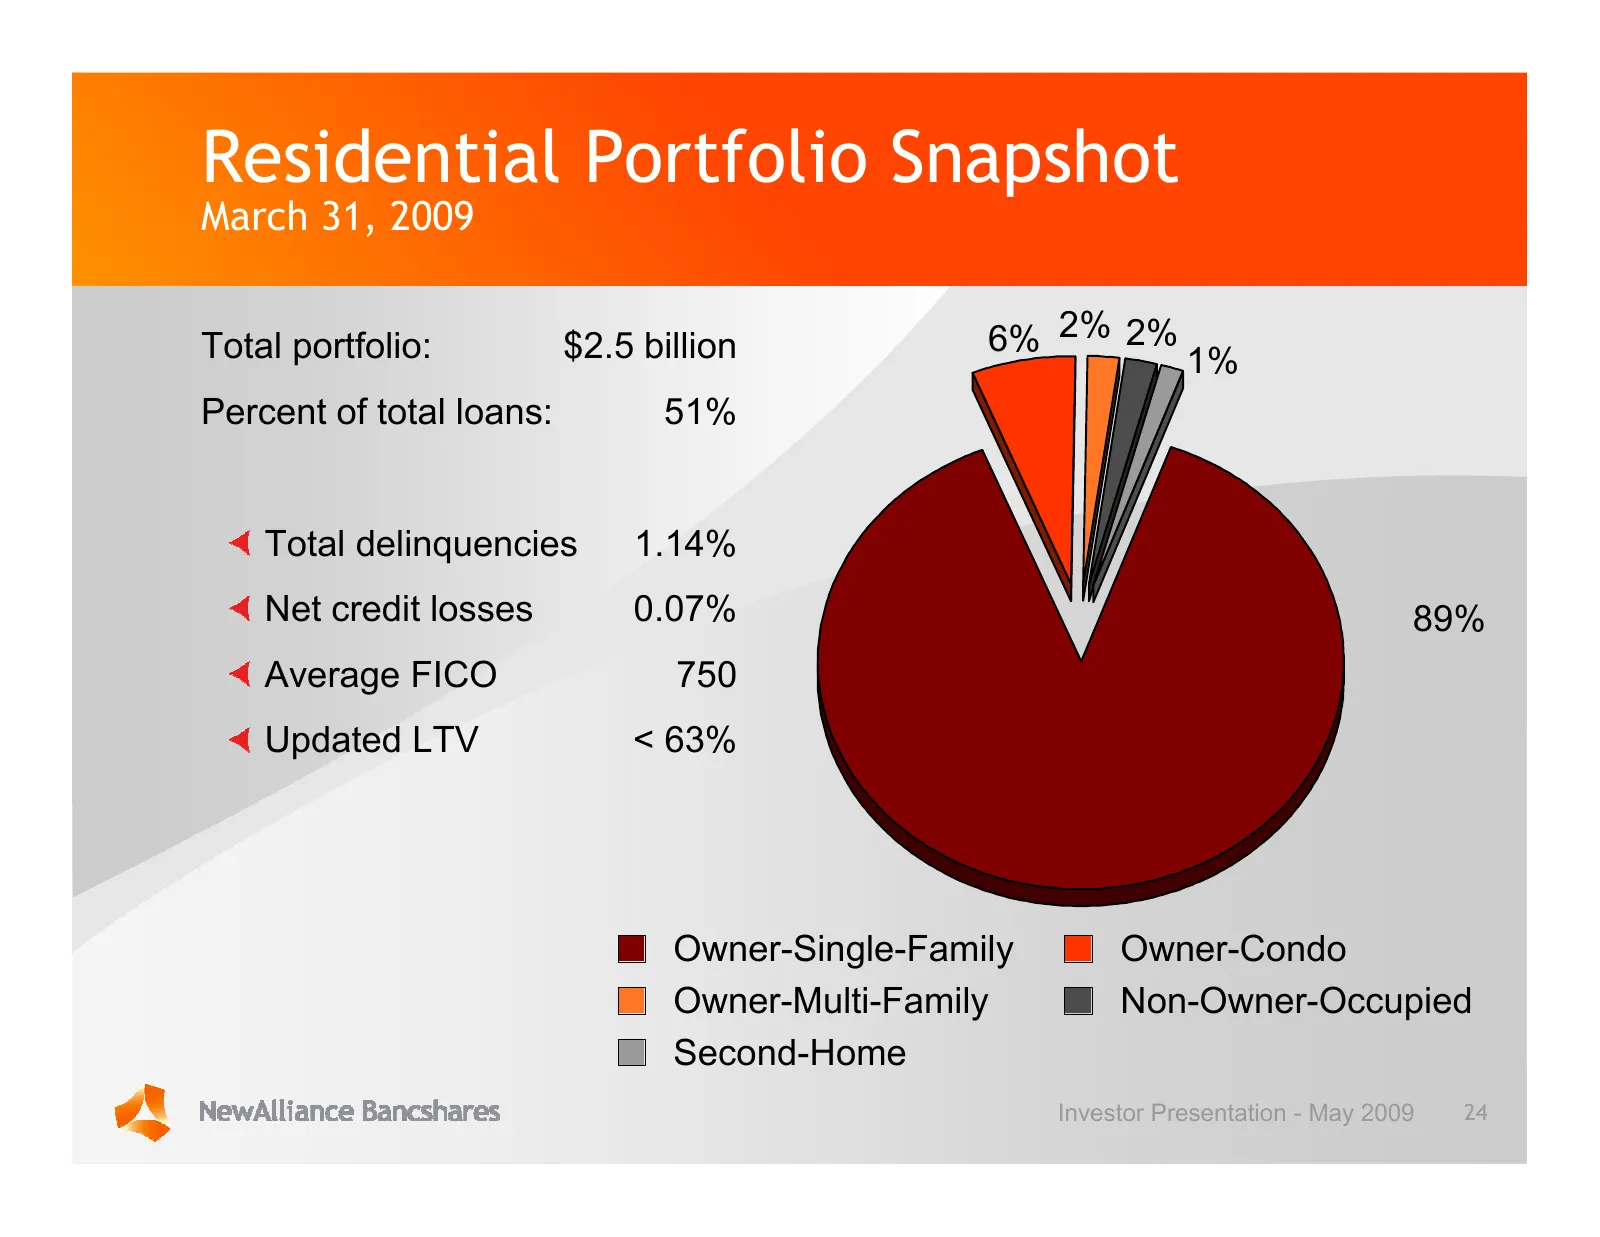
Slide 24: Residential Portfolio Snapshot
Residential Portfolio Snapshot March 31, 2009 Total portfolio: $2.5 billion 6% 2% 2% 1% Percent of total loans: 51% Total delinquencies 1.14% Net credit losses 0.07% 89% Average FICO 750 Updated LTV < 63% Owner-Single-Family Owner-Condo Owner-Multi-Family Non-Owner-Occupied Second-Home Investor Pres
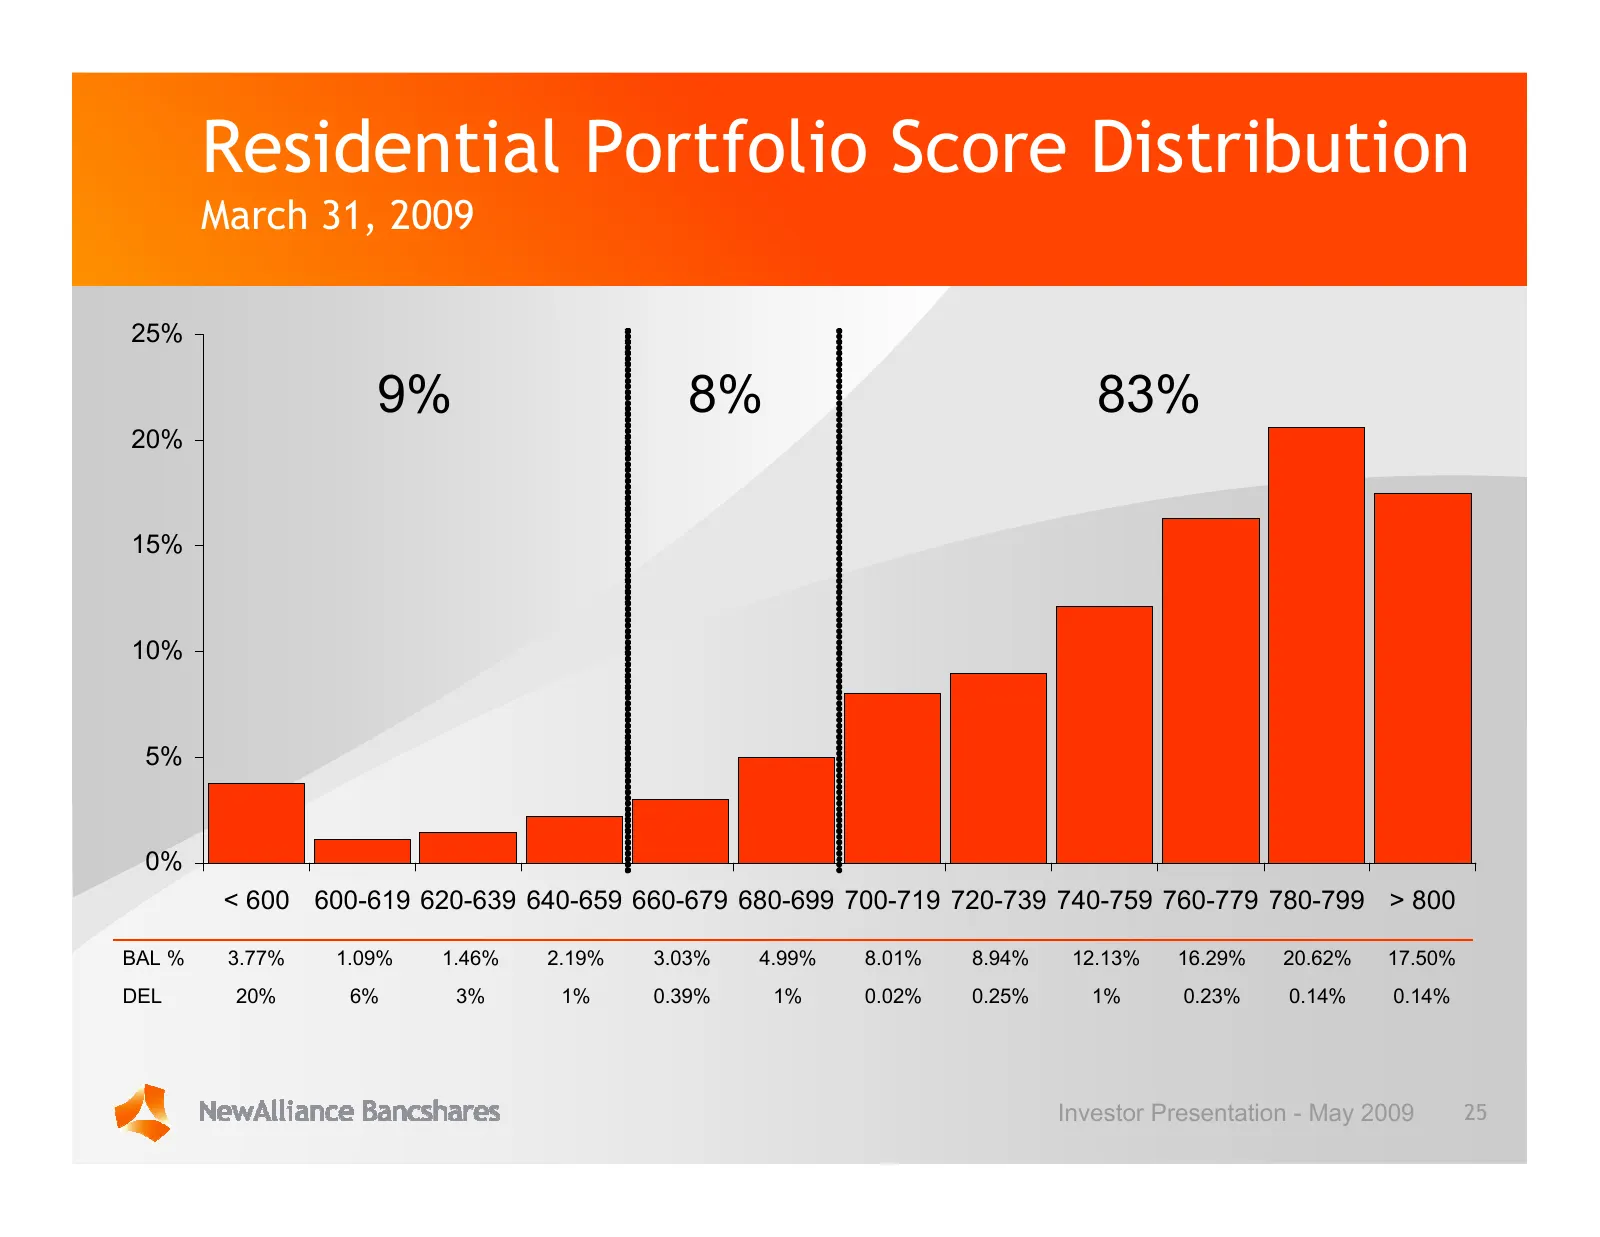
Slide 25: Residential Portfolio Score Distribution
Residential Portfolio Score Distribution March 31, 2009 25% 9% 8% 83% 20% 15% 10% 5% 0% < 600 600-619 620-639 640-659 660-679 680-699 700-719 720-739 740-759 760-779 780-799 > 800 BAL % 3.77% 1.09% 1.46% 2.19% 3.03% 4.99% 8.01% 8.94% 12.13% 16.29% 20.62% 17.50% DEL 20% 6% 3% 1% 0.39% 1% 0.02% 0.25%
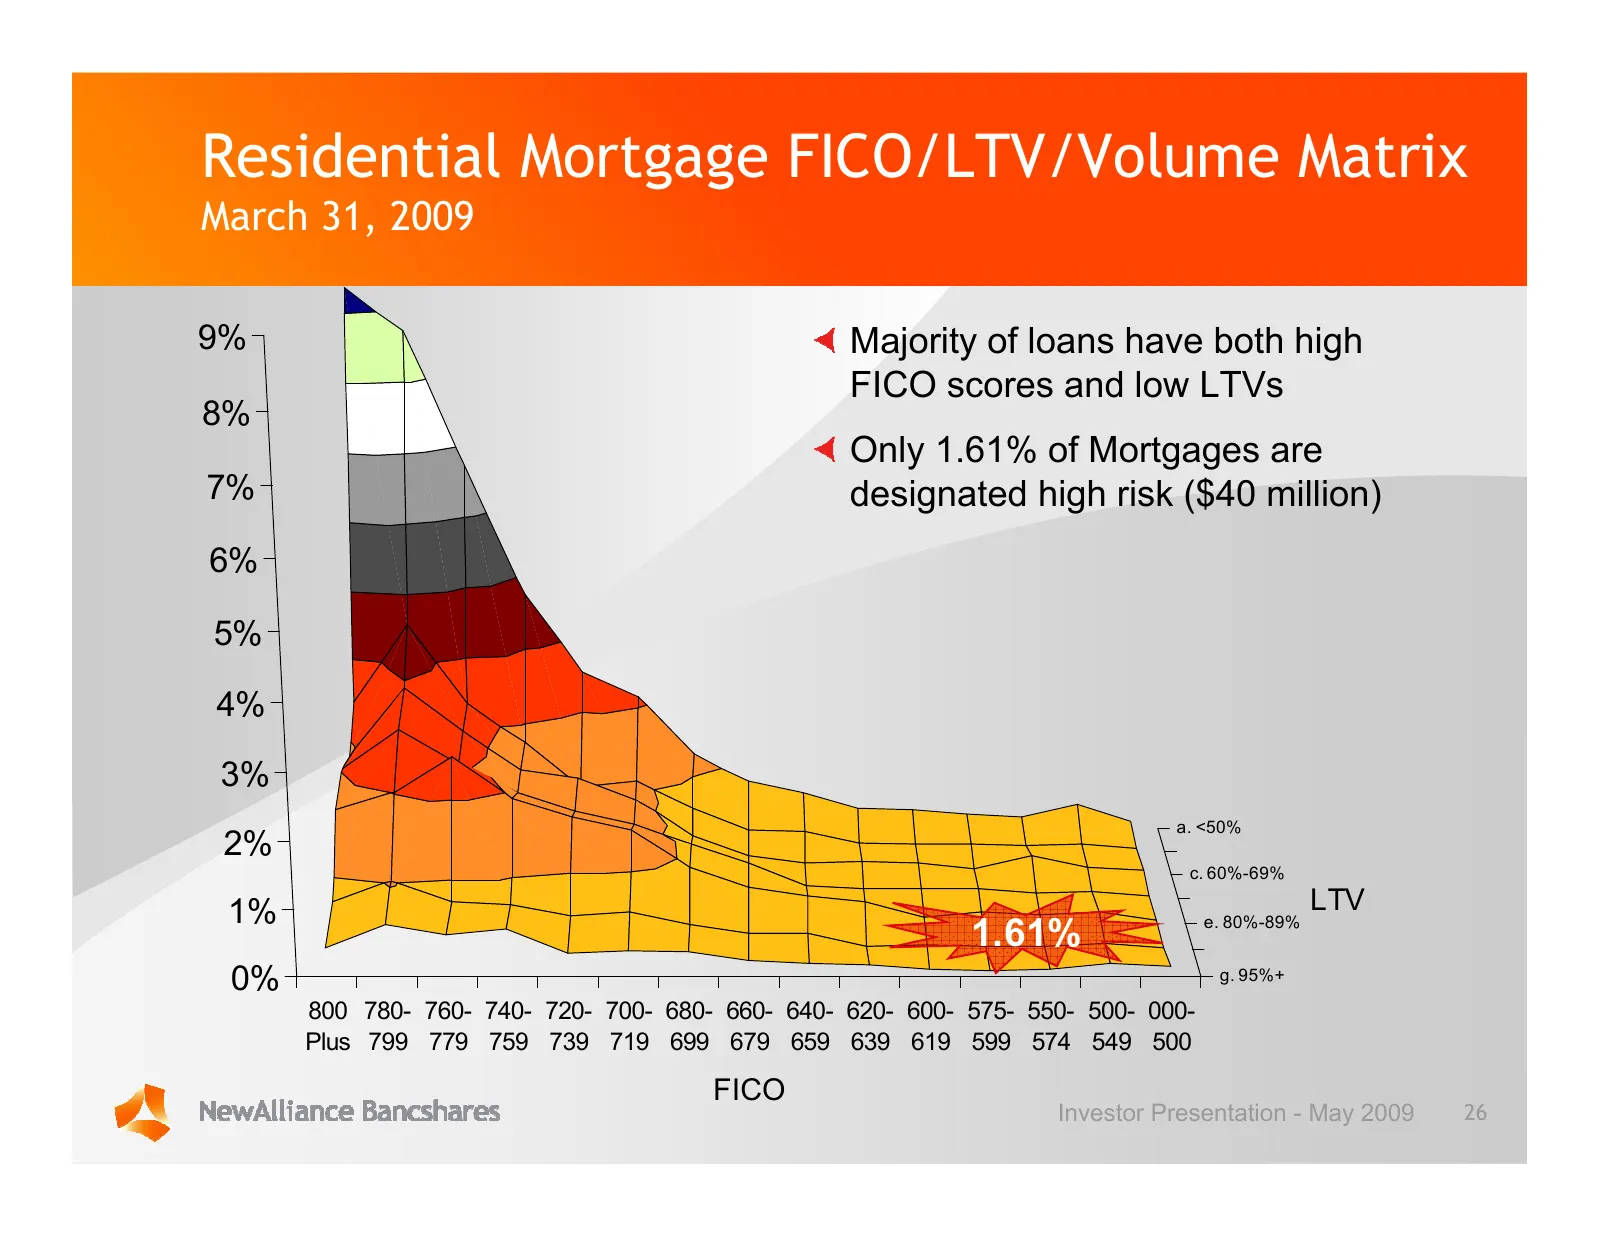
Slide 26: Residential Mortgage FICO/LTV/Volume Matrix
Residential Mortgage FICO/LTV/Volume Matrix March 31, 2009 9% Majority of loans have both high FICO scores and low LTVs 8% Only 1.61% of Mortgages are 7% designated high risk ($40 million) 6% 5% 4% 3% a. <50% 2% c. 60%-69% 1% LTV e. 80%-89% 1.61% 0% g. 95%+ 800 780- 760- 740- 720- 700- 680- 660- 640
Slide 27: Home Equity Portfolio Snapshot
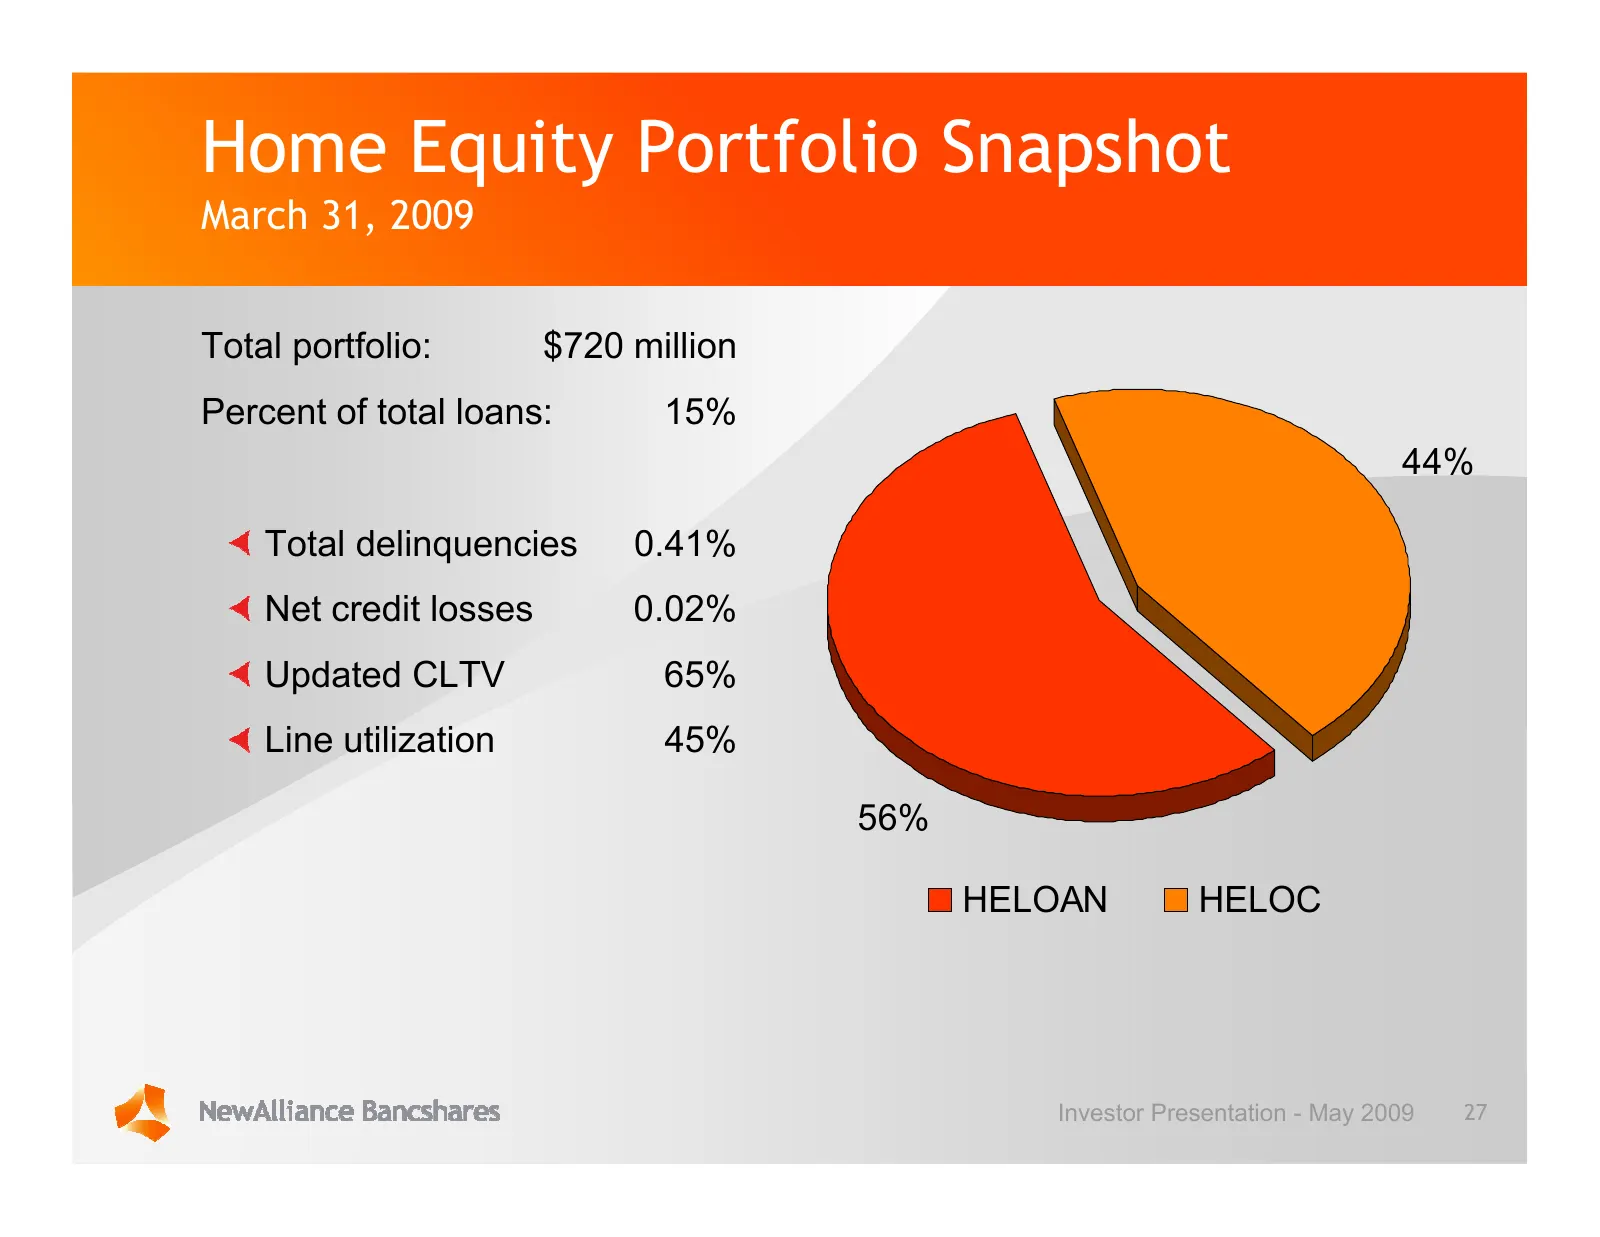
Home Equity Portfolio Snapshot March 31, 2009 Total portfolio: $720 million Percent of total loans: 15% 44% Total delinquencies 0.41% Net credit losses 0.02% Updated CLTV 65% Line utilization 45% 56% HELOAN HELOC Investor Presentation - May 2009 27
Slide 28: Total CRE Portfolio Snapshot
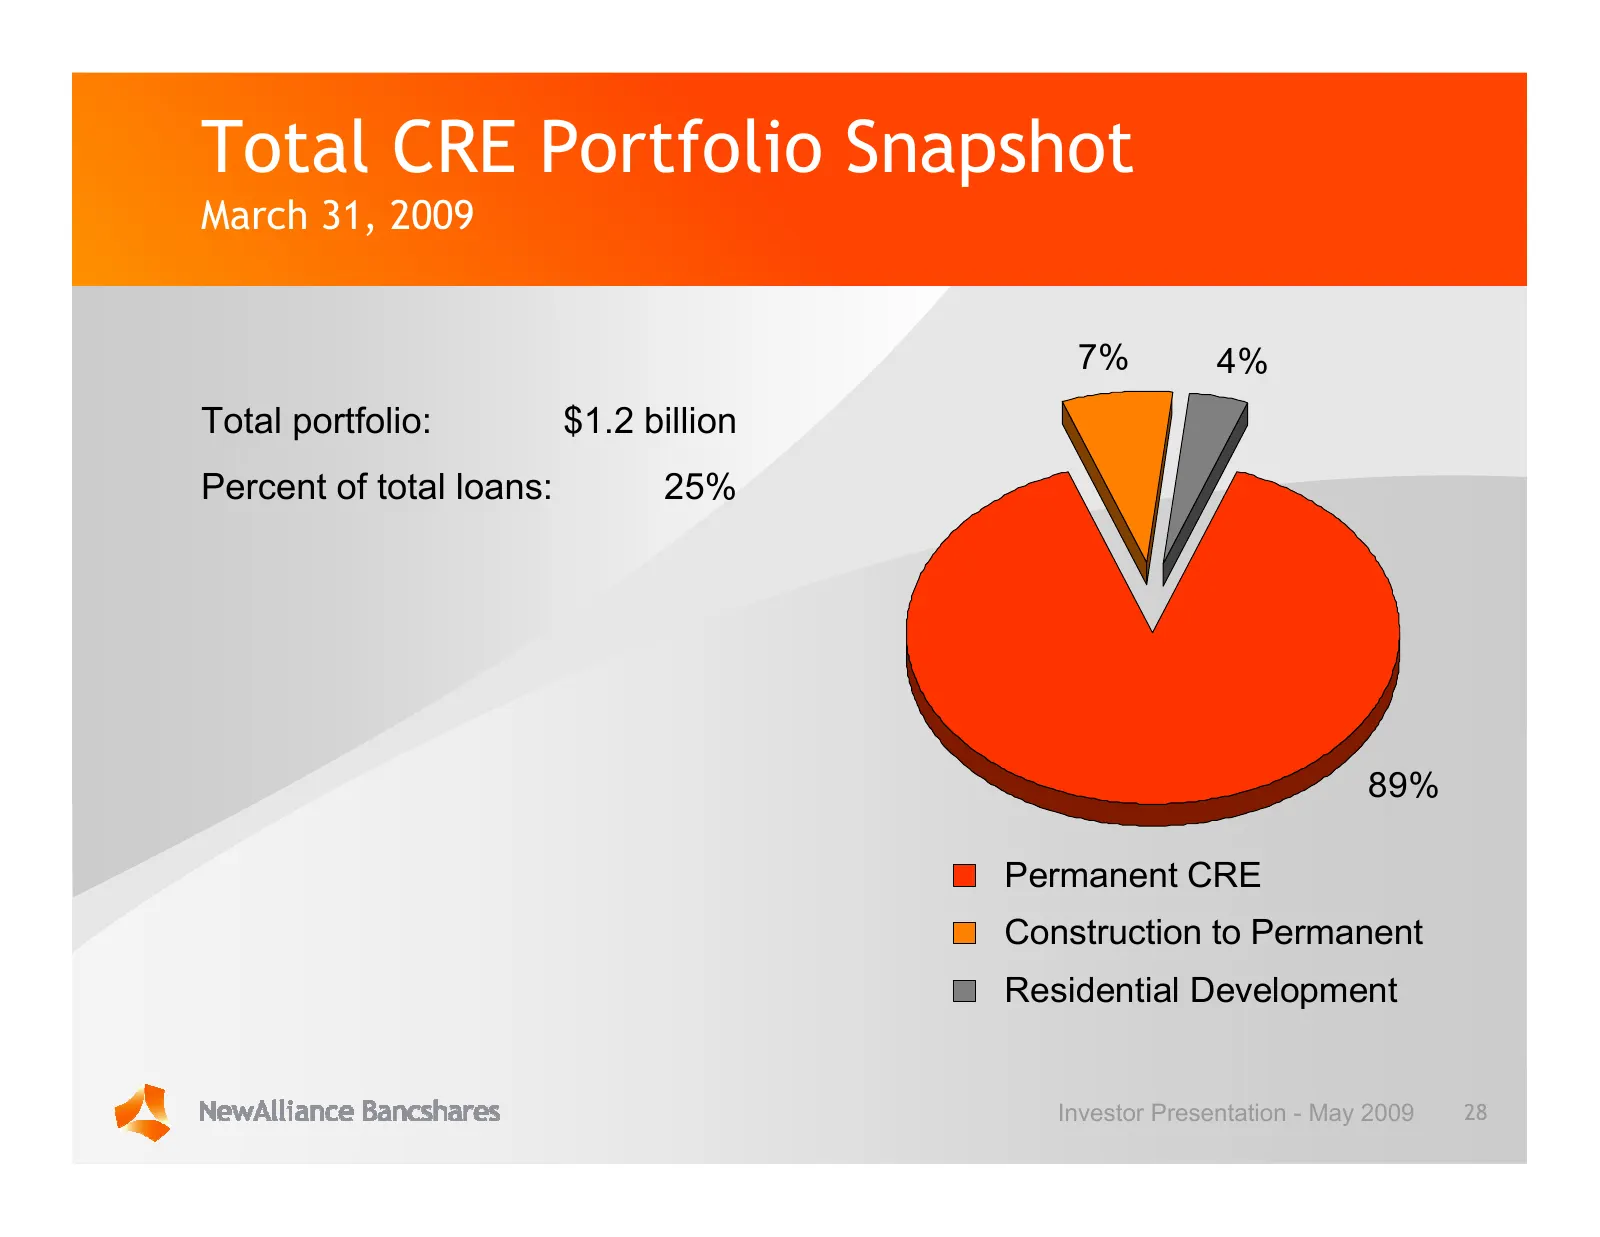
Total CRE Portfolio Snapshot March 31, 2009 7% 4% Total portfolio: $1.2 billion Percent of total loans: 25% 89% Permanent CRE Construction to Permanent Residential Development Investor Presentation - May 2009 28
Slide 29: Permanent CRE Portfolio Snapshot
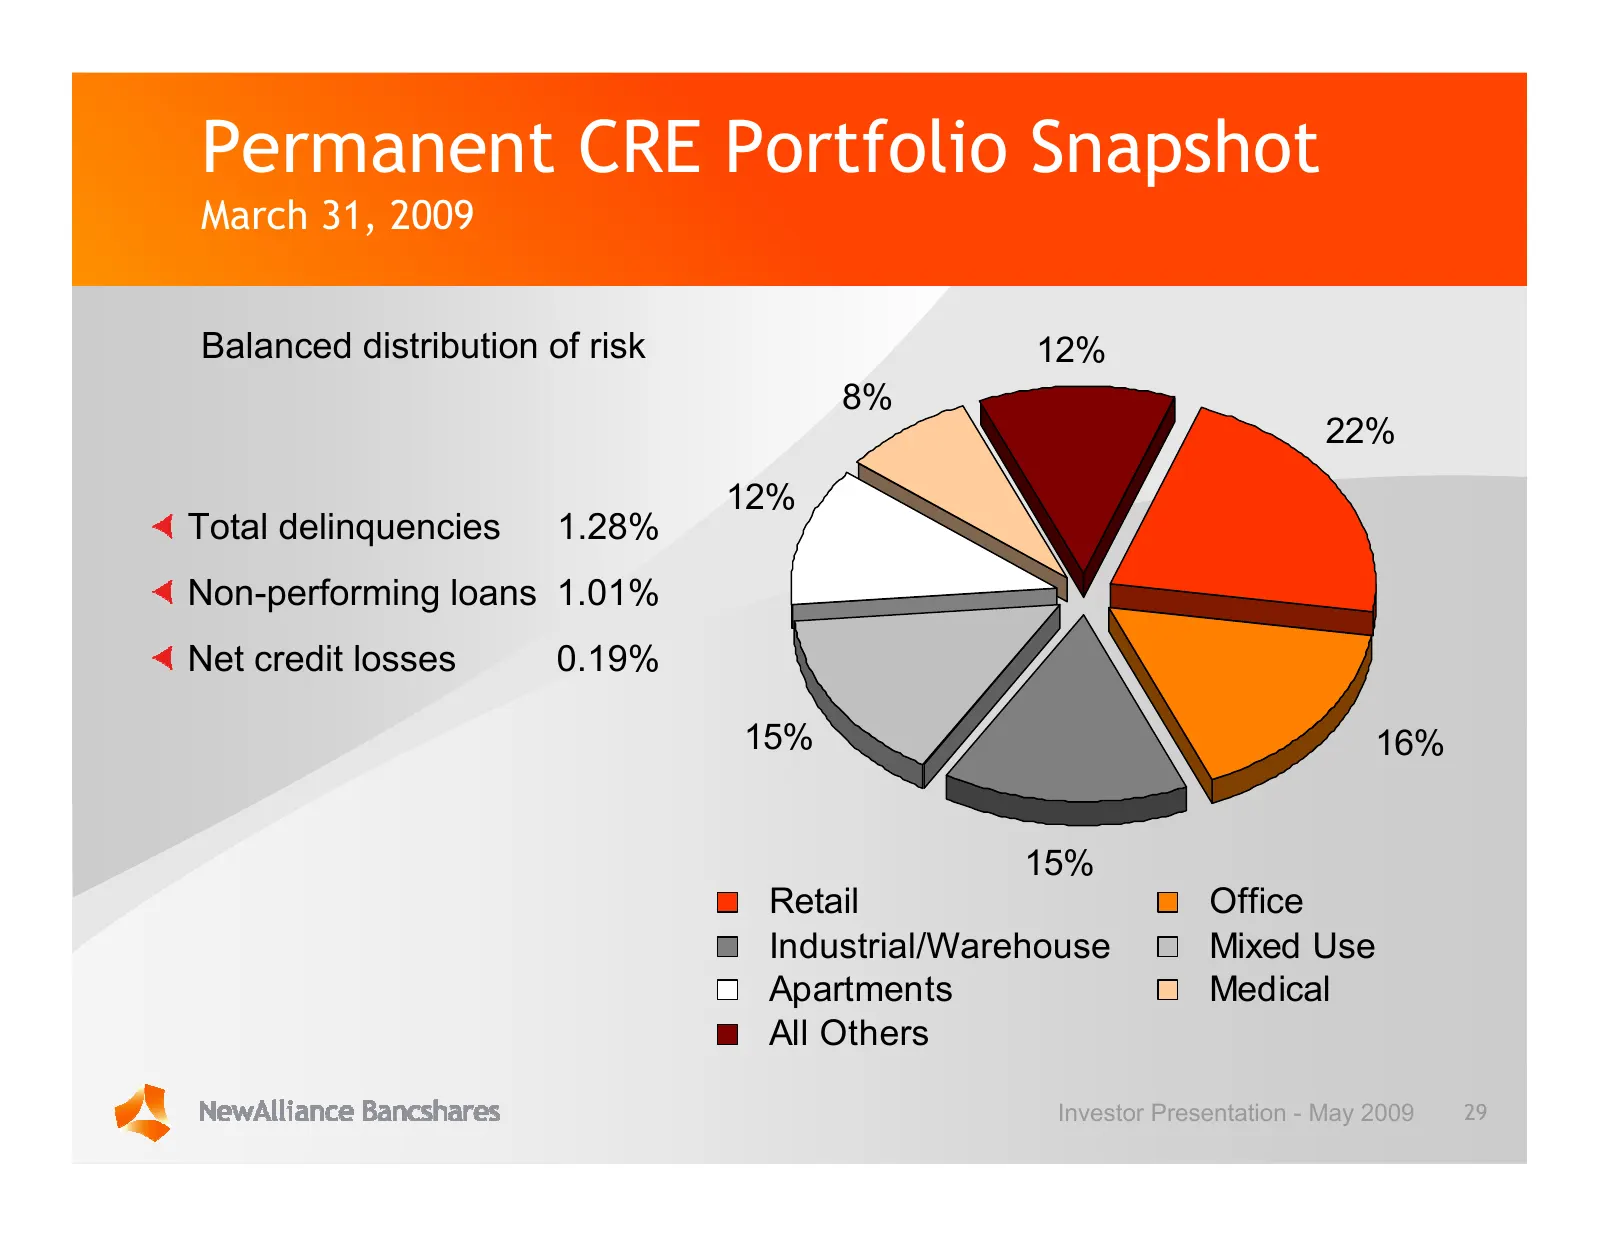
Permanent CRE Portfolio Snapshot March 31, 2009 Balanced distribution of risk 12% 8% 22% 12% Total delinquencies 1.28% Non-performing loans 1.01% Net credit losses 0.19% 15% 16% 15% Retail Office Industrial/Warehouse Mixed Use Apartments Medical All Others Investor Presentation - May 2009 29
Slide 30: Residential Development Portfolio Snapshot
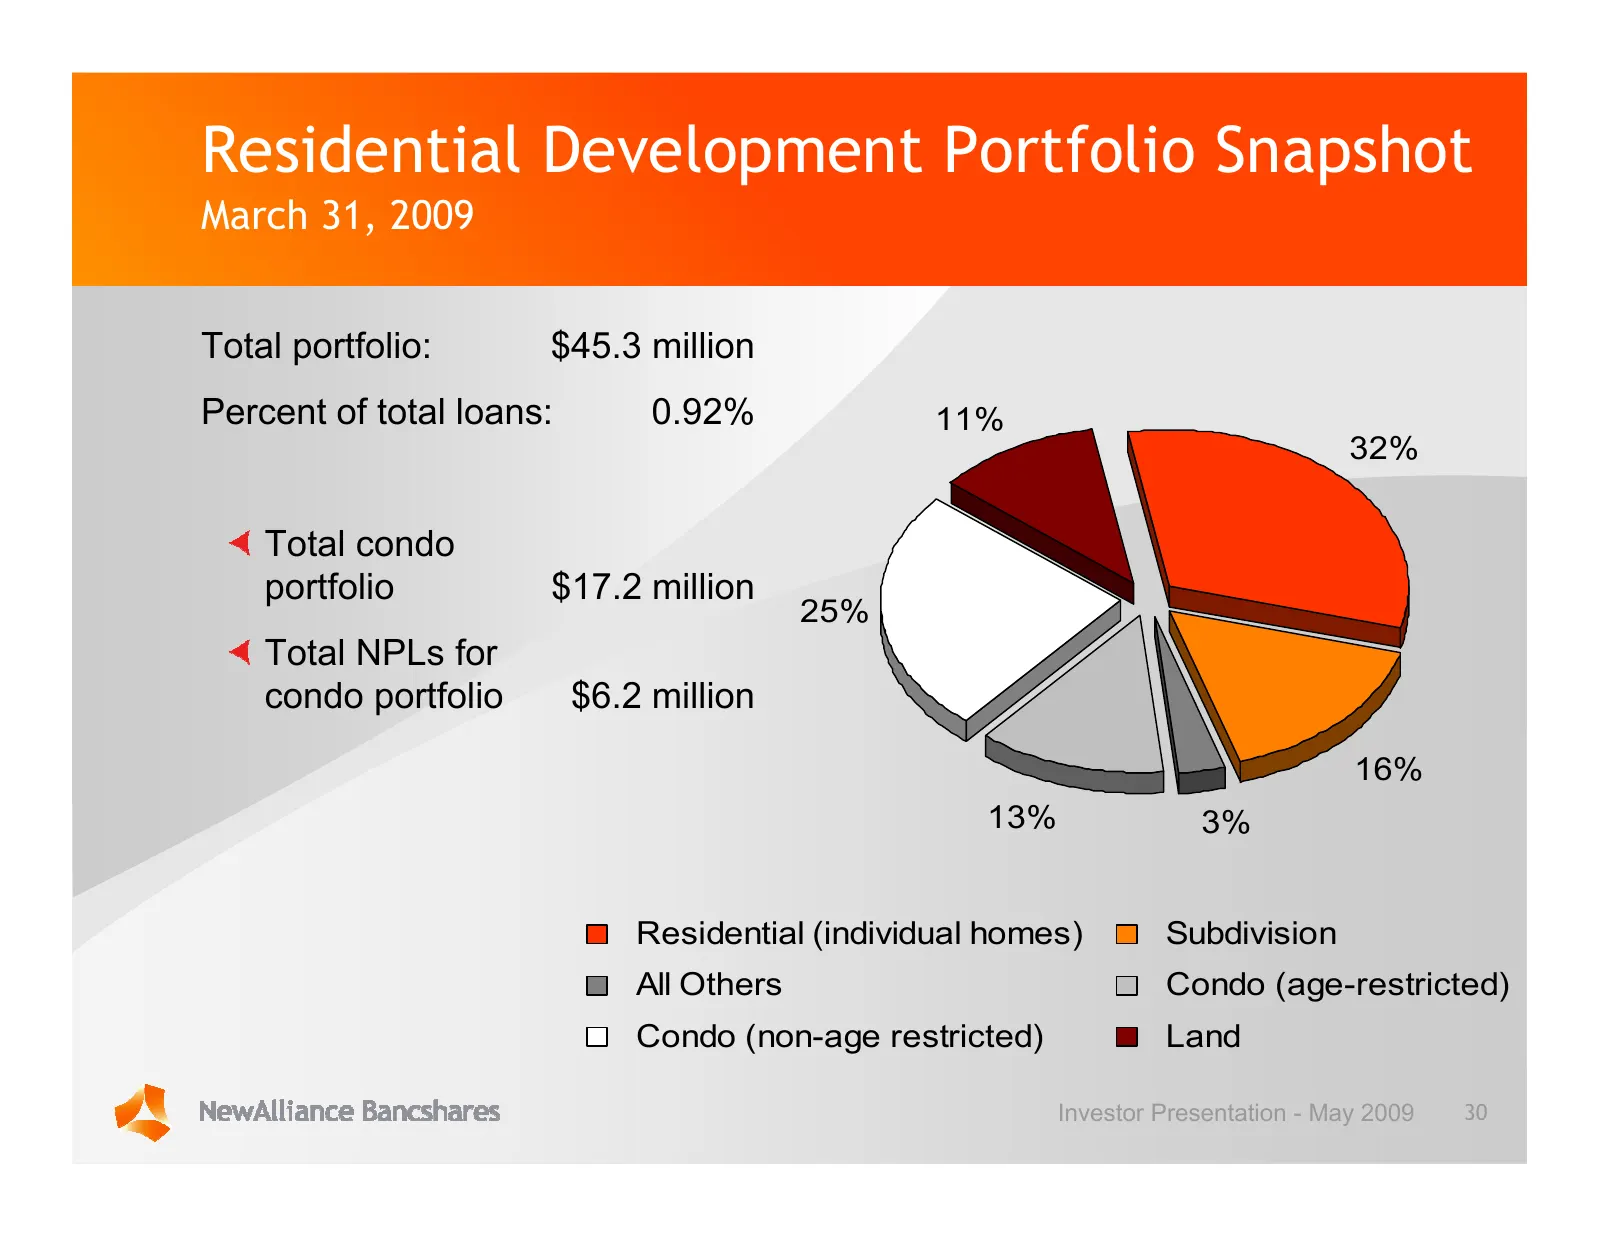
Residential Development Portfolio Snapshot March 31, 2009 Total portfolio: $45.3 million Percent of total loans: 0.92% 11% 32% Total condo portfolio $17.2 million 25% Total NPLs for condo portfolio $6.2 million 16% 13% 3% Residential (individual homes) Subdivision All Others Condo (age-restricted) C
Slide 31: C&I Portfolio Snapshot
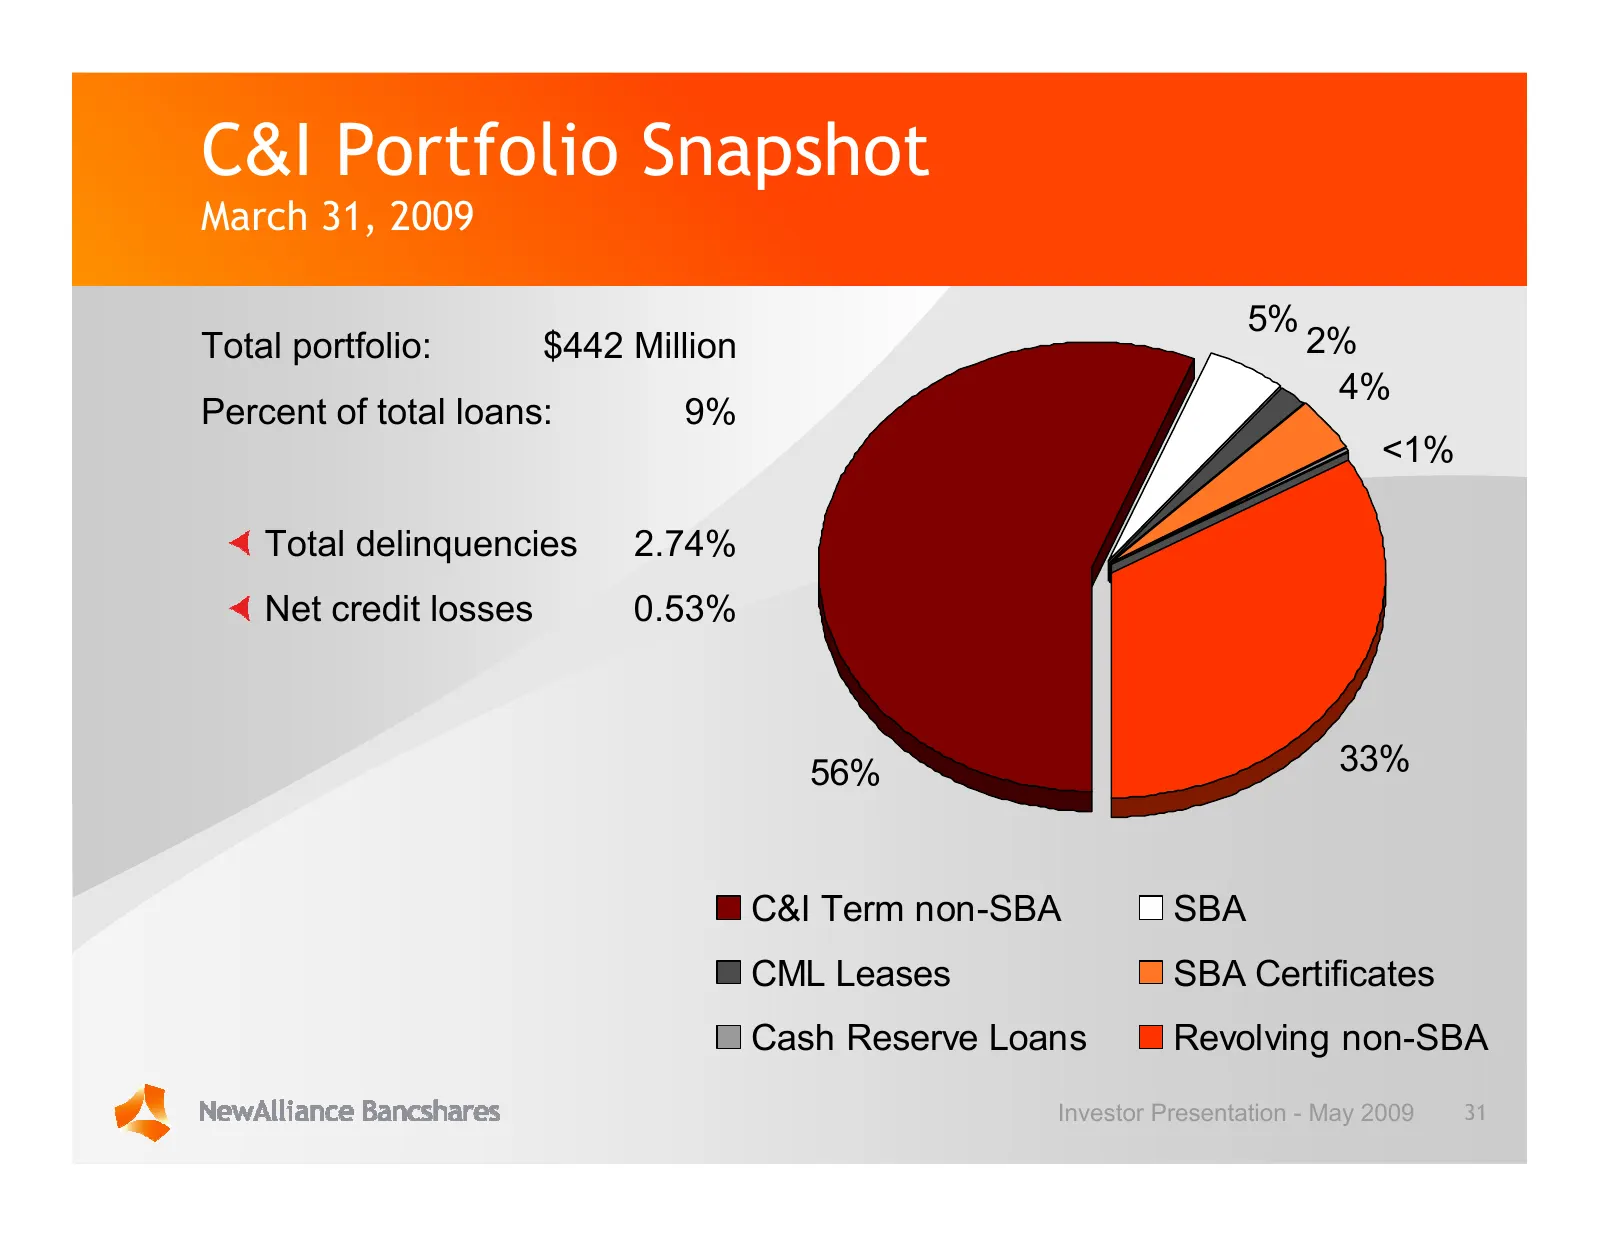
C&I Portfolio Snapshot March 31, 2009 5% Total portfolio: $442 Million 2% 4% Percent of total loans: 9% <1% Total delinquencies 2.74% Net credit losses 0.53% 56% 33% C&I Term non-SBA SBA CML Leases SBA Certificates Cash Reserve Loans Revolving non-SBA Investor Presentation - May 2009 31
Slide 32: C&I Portfolio Snapshot by NAICS Code
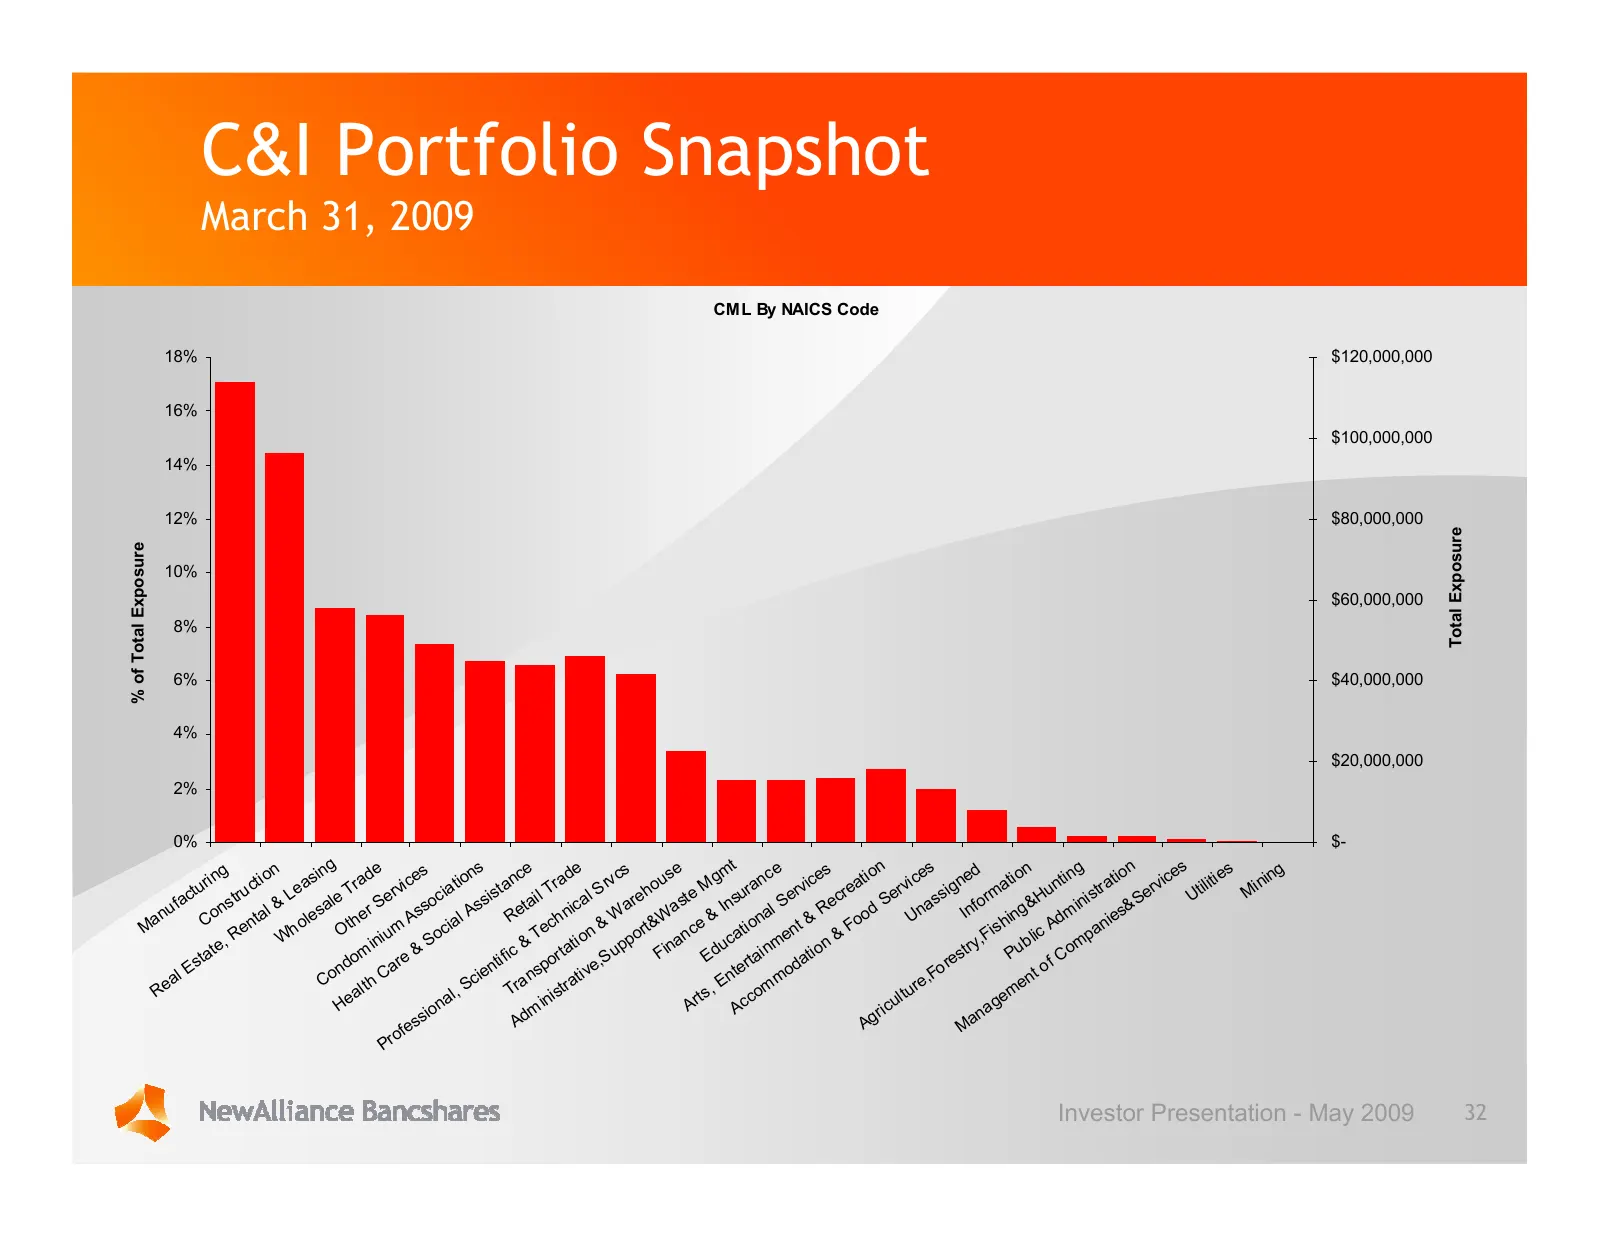
C&I Portfolio Snapshot March 31, 2009 CML By NAICS Code 18% $120,000,000 16% $100,000,000 14% 12% $80,000,000 Total Exposure % of Total Exposure 10% $60,000,000 8% 6% $40,000,000 4% $20,000,000 2% 0% $- ng s t n s g n s ri n g n ti o e asi e ad vi ce s ion t anc e ad e rv c s us e gm anc e ices ati
Slide 33: Quarterly Net Charge-offs by Category
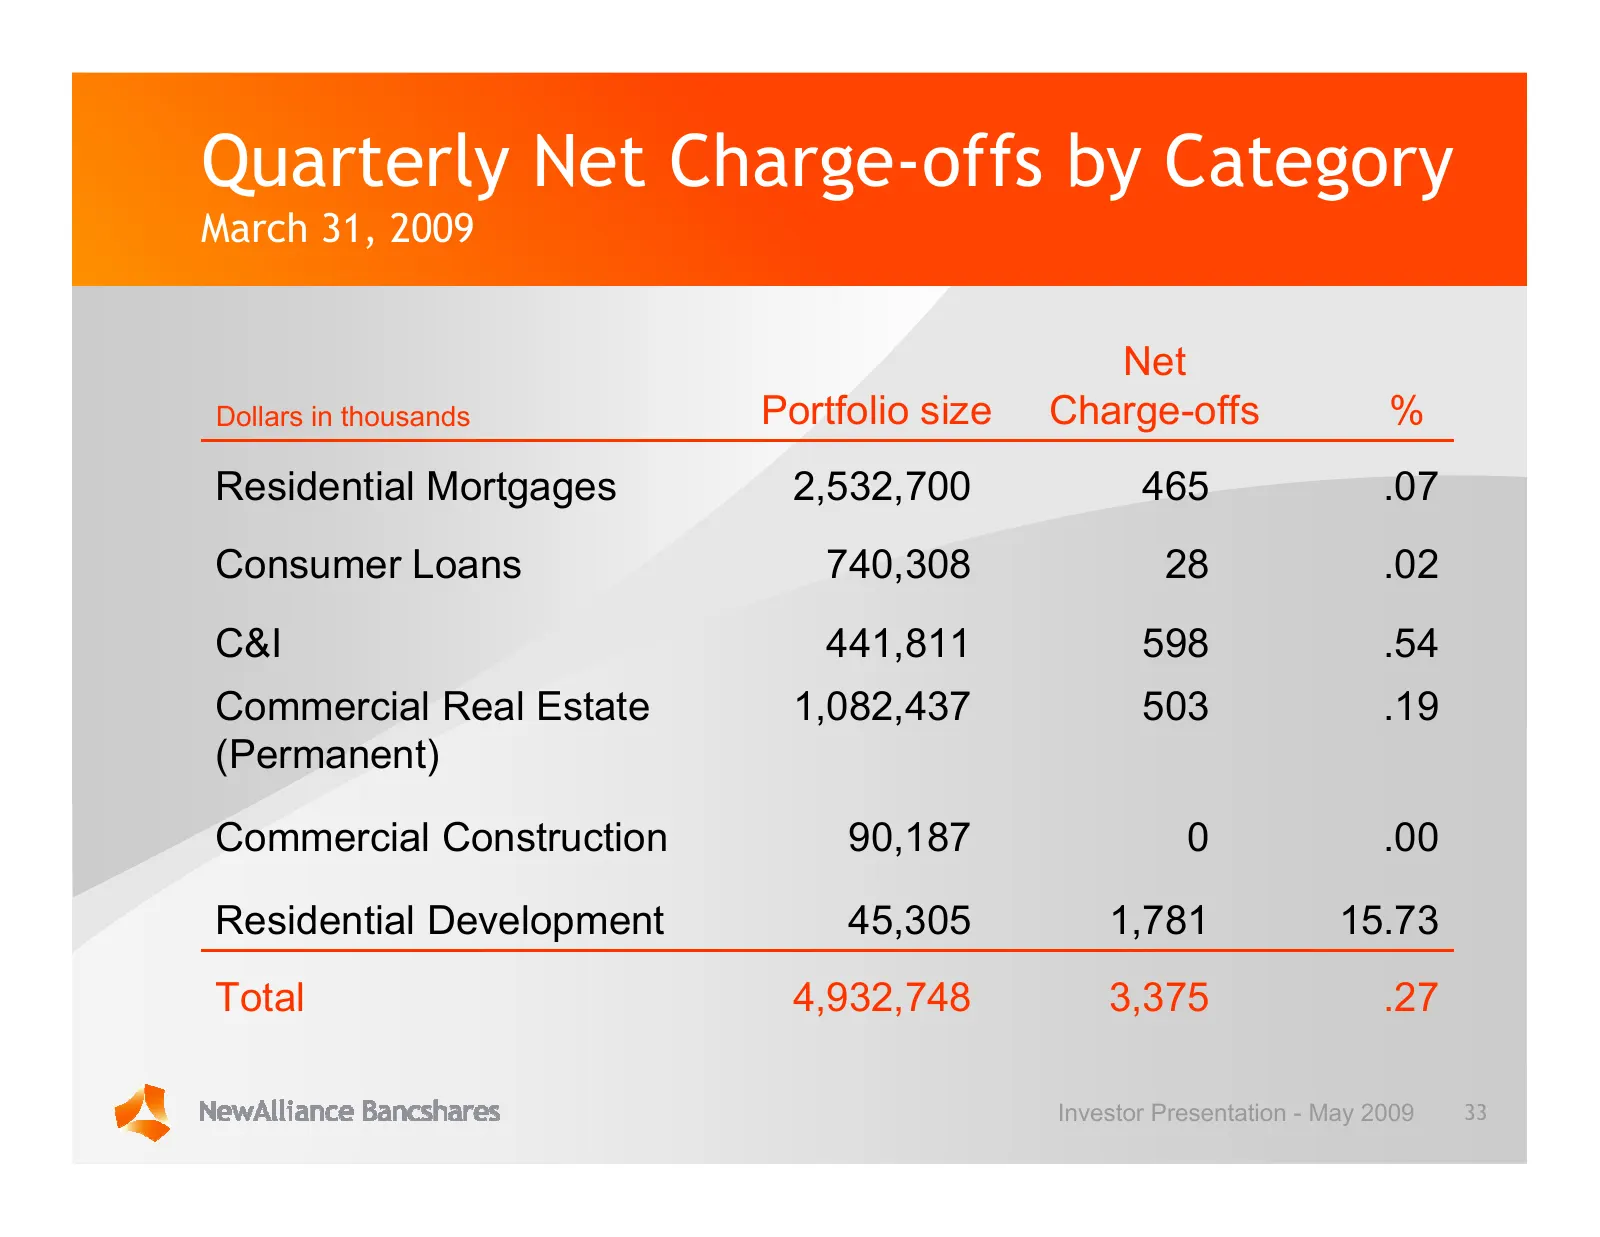
Quarterly Net Charge-offs by Category March 31, 2009 Net Dollars in thousands Portfolio size Charge-offs % Residential Mortgages 2,532,700 465 .07 Consumer Loans 740,308 28 .02 C&I 441,811 598 .54 Commercial Real Estate 1,082,437 503 .19 (Permanent) Commercial Construction 90,187 0 .00 Residential D
Slide 34: Investment Portfolio
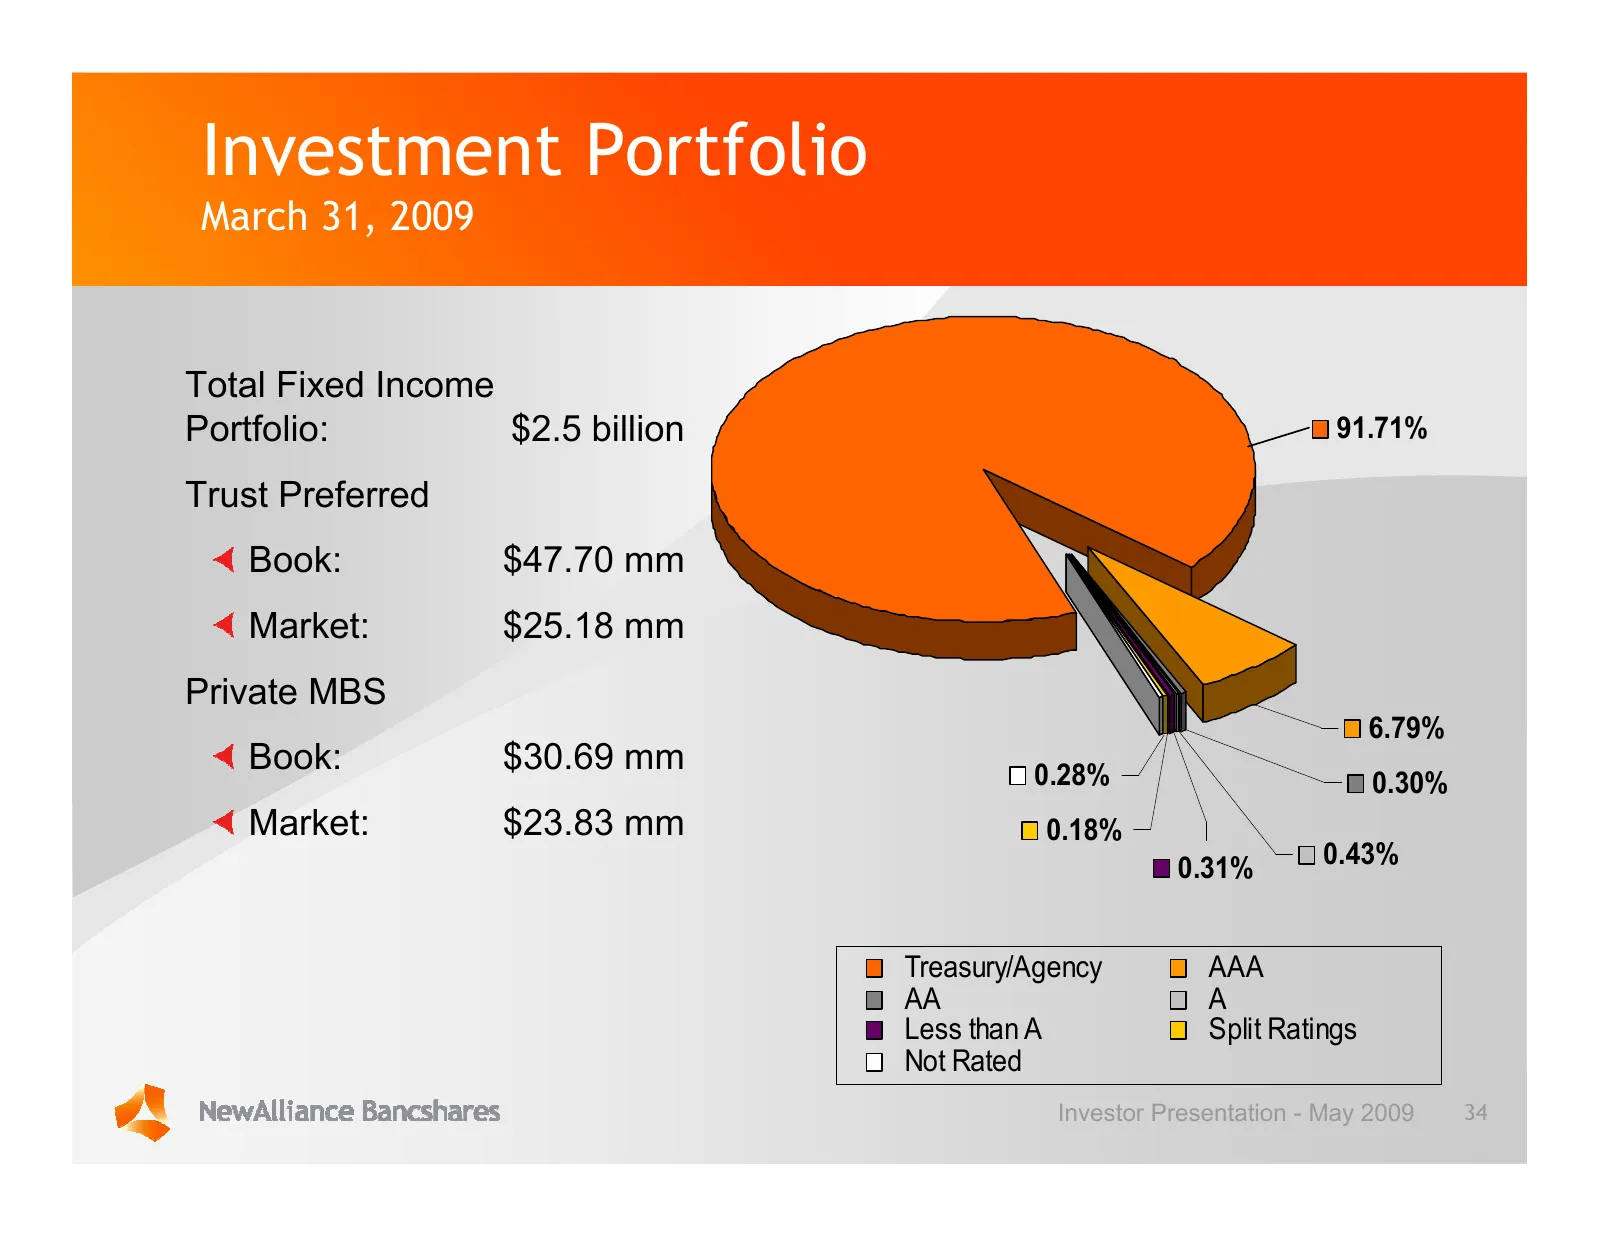
Investment Portfolio March 31, 2009 Total Fixed Income Portfolio: $2.5 billion 91.71% Trust Preferred Book: $47.70 mm Market: $25.18 mm Private MBS 6.79% Book: $30.69 mm 0.28% 0.30% Market: $23.83 mm 0.18% 0.31% 0.43% Treasury/Agency AAA AA A Less than A Split Ratings Not Rated Investor Presentation

Slide 35: Outlook for 2009
. q Outlook for 2009
Slide 36: Key 2009 Business Priorities
Key 2009 Business Priorities Priorities: 1. Strengthen the margin 2. Build “core” fee income momentum 3. Maintain flat expenses 4. Aggressively manage credit quality 5. Seize opportunities to grow the franchise Investor Presentation - May 2009 36
Slide 37: Organizational Strengths
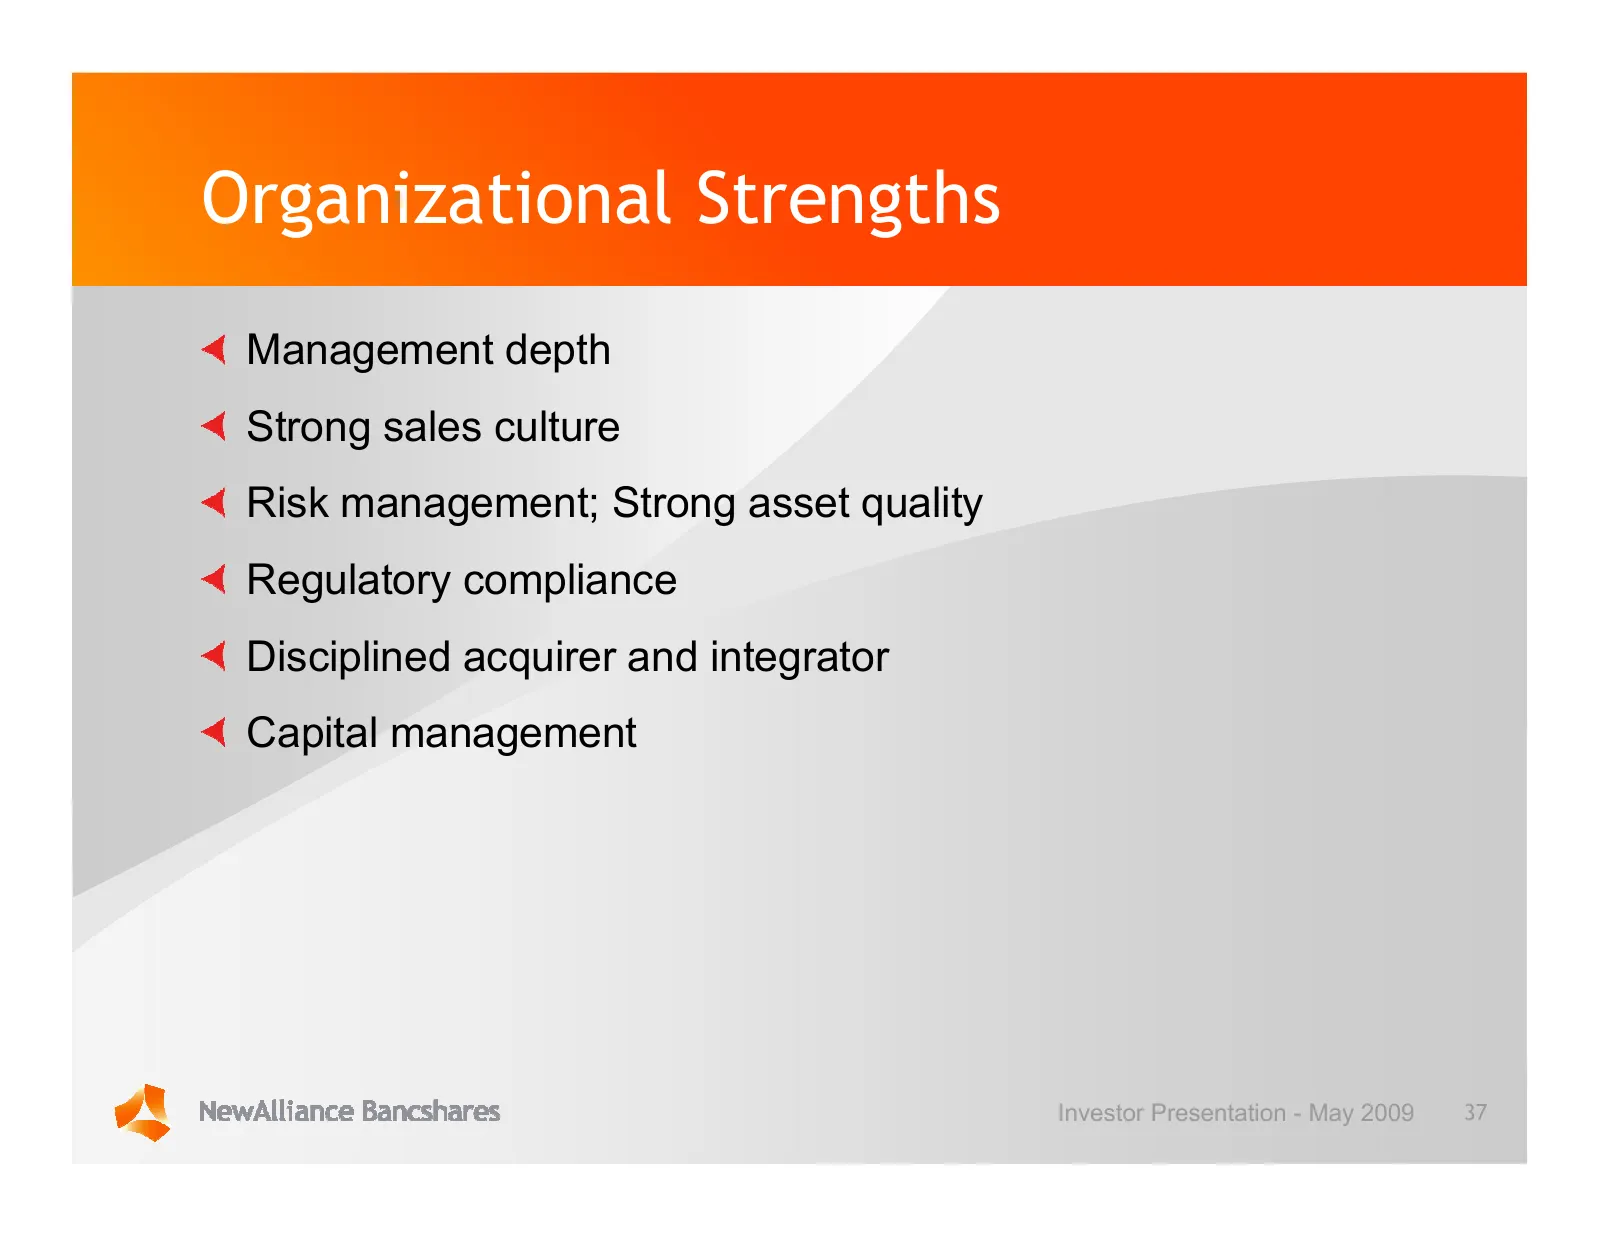
Organizational Strengths Management depth Strong sales culture Risk management; Strong asset quality Regulatory compliance Disciplined acquirer and integrator Capital management Investor Presentation - May 2009 37

Slide 38: NewAlliance Bancshares
! q NewaAlliance Bancsharé
Source: SEC EDGAR · 8-K filed May 6, 2009
More decks from Newalliance Bancshares Inc
 Merger or Acquisition (November 2010)45 slides · Nov 18, 2010
 Stifel, Nicolaus & Company, Inc. Bank and Thrift Conference 201037 slides · Nov 3, 2010
 Merger or Acquisition (August 2010)25 slides · Aug 25, 2010
 Merger or Acquisition (August 2010)24 slides · Aug 19, 2010
 Merger or Acquisition (August 2010)23 slides · Aug 19, 2010
 Q2 2010 Earnings Presentation31 slides · Jul 28, 2010