JinkoSolar Holding Co., Ltd. · NYSE:JKS
JinkoSolar — Q2 2015 Earnings Presentation
13 slides from JinkoSolar's earnings presentation, Aug 20, 2015
Slide 1: Q2 2015 Earnings Call Presentation
JinkoSolar Holding Co., Ltd. Q2 2015 Earnings Call Presentation Aug 20, 2015
Slide 2: Disclaimer
Disclaimer This presentation does not constitute an offer to sell or issue or the solicitation of an offer to buy or acquire securities of JinkoSolar Holding Co., Ltd. (the “Company”) in any jurisdiction or an inducement to enter into investment activity, nor may it or any part of it form the basis
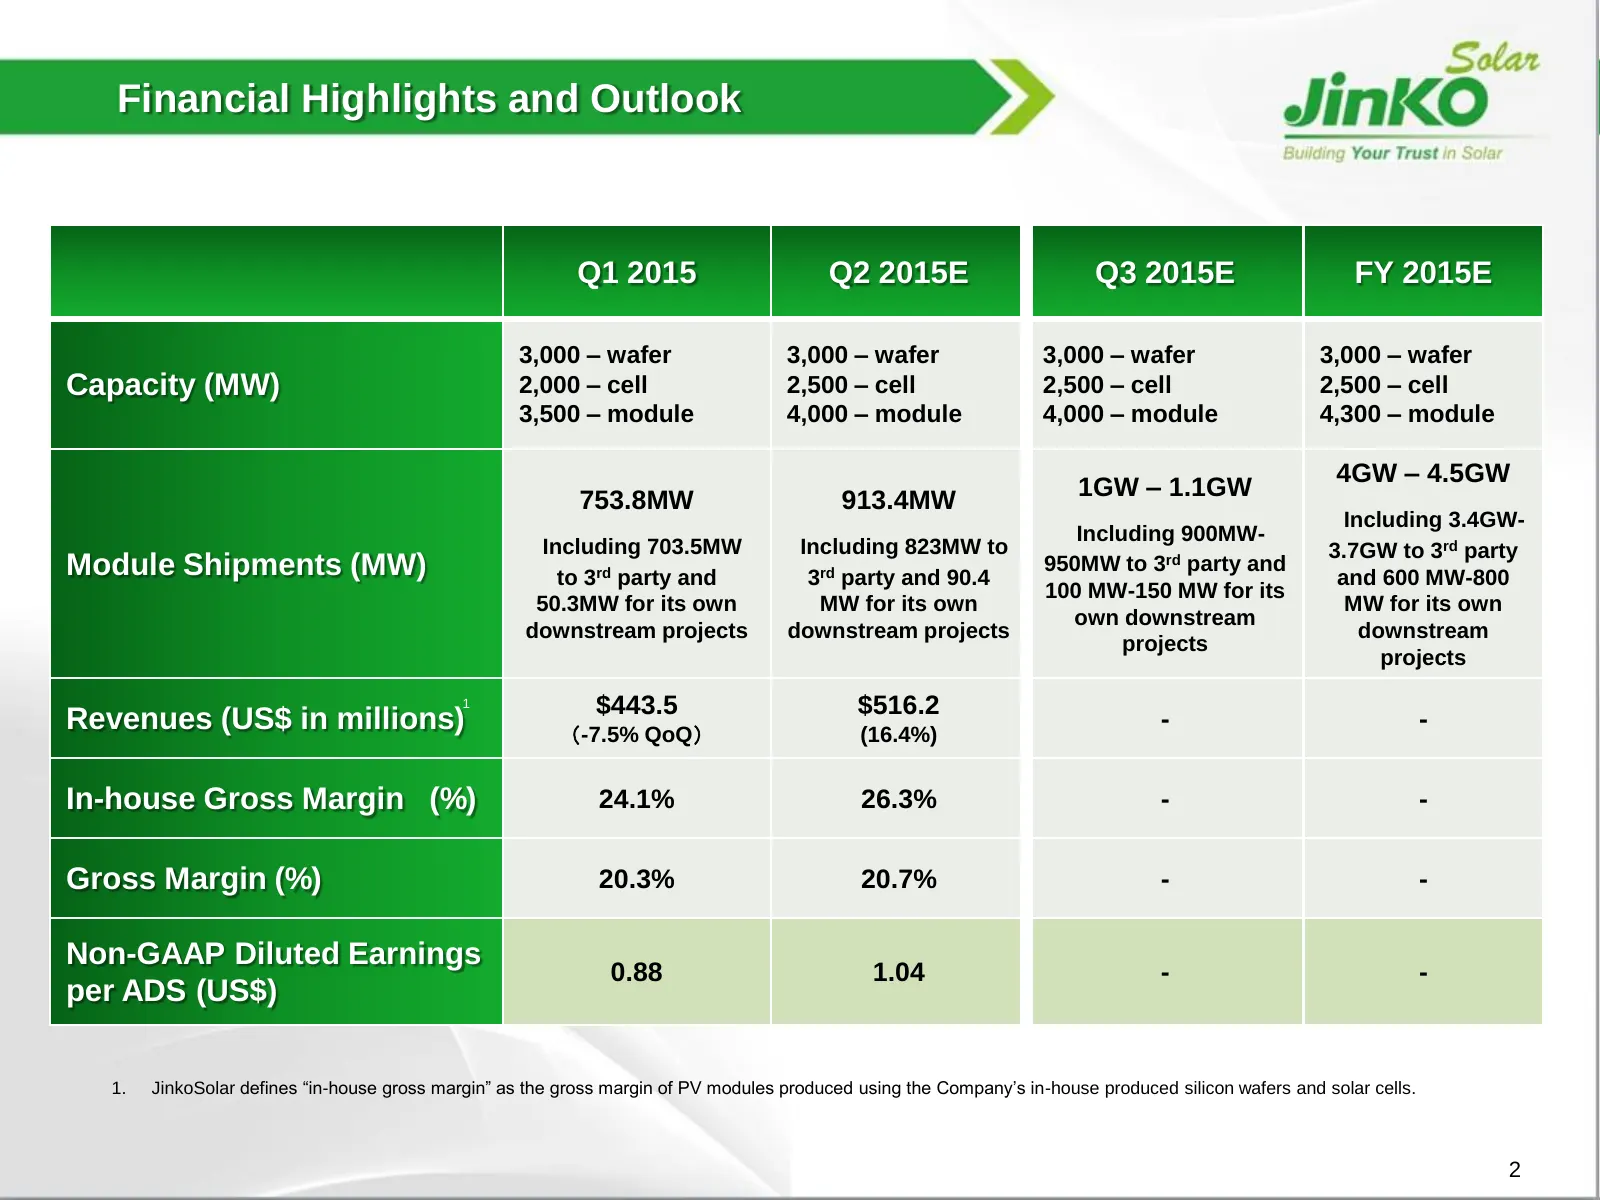
Slide 3: Financial Highlights and Outlook
Financial Highlights and Outlook Q1 2015 Q2 2015E Q3 2015E FY 2015E 3,000 – wafer 3,000 – wafer 3,000 – wafer 3,000 – wafer Capacity (MW) 2,000 – cell 2,500 – cell 2,500 – cell 2,500 – cell 3,500 – module 4,000 – module 4,000 – module 4,300 – module 4GW – 4.5GW 1GW – 1.1GW 753.8MW 913.4MW Including
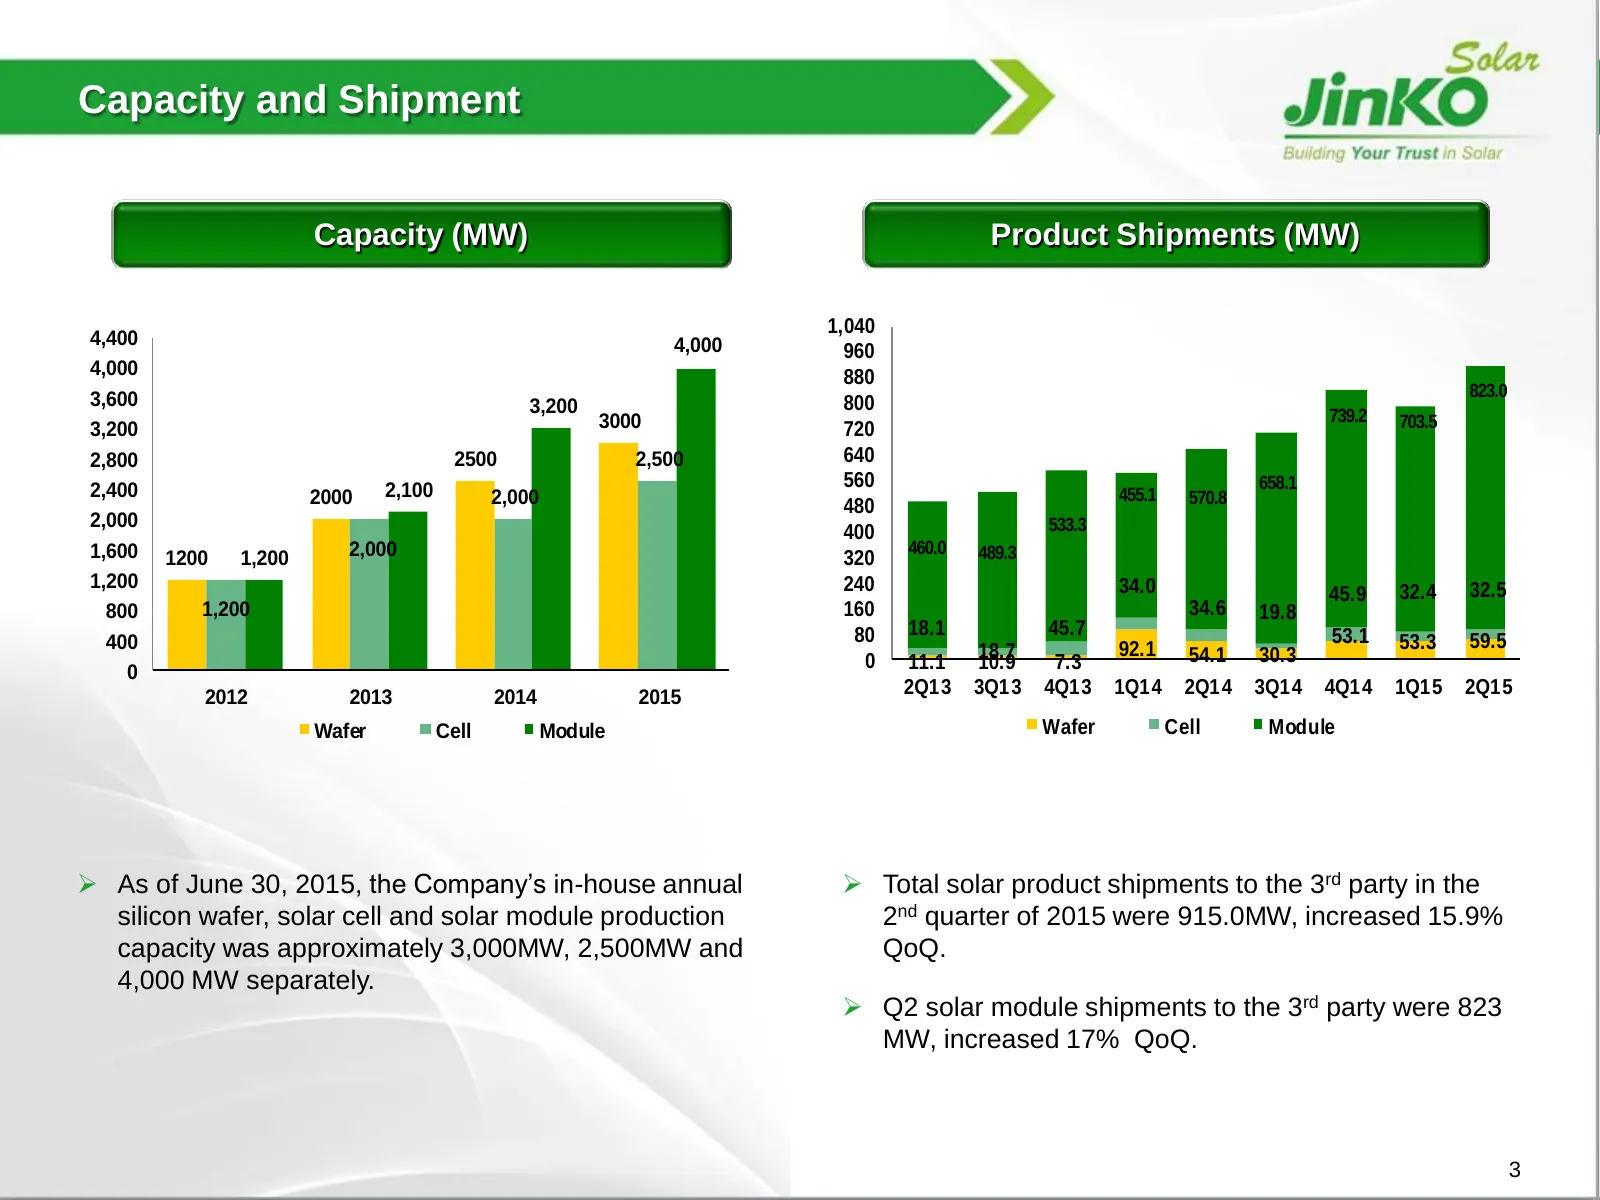
Slide 4: Capacity and Shipment
Capacity and Shipment Capacity (MW) Product Shipments (MW) 1,040 4,400 4,000 960 4,000 880 3,600 823.0 3,200 800 3000 739.2 703.5 3,200 720 2,800 2500 2,500 640 2,400 2,100 560 658.1 2000 2,000 455.1 570.8 480 2,000 533.3 400 1,600 2,000 460.0 489.3 1200 1,200 320 1,200 240 34.0 32.5 45.9 32.4 800 1
Slide 5: Significant Cost per Watt Reduction
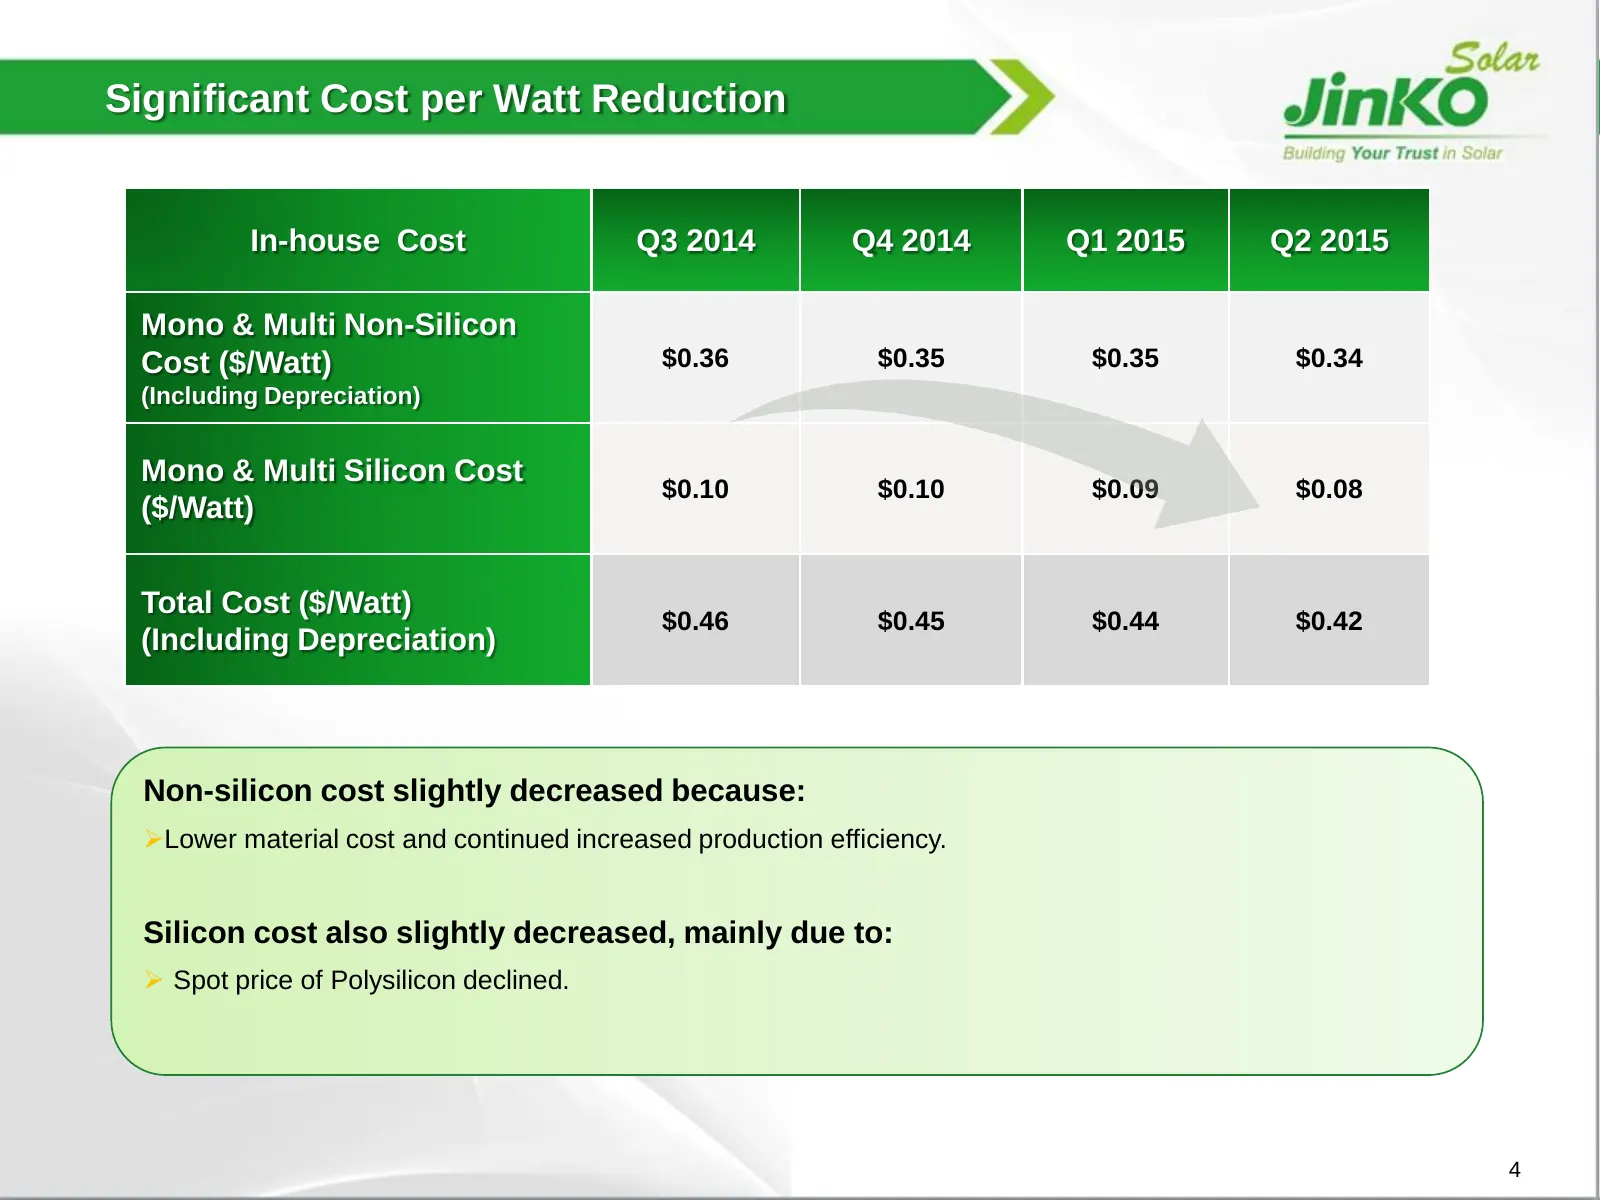
Significant Cost per Watt Reduction In-house Cost Q3 2014 Q4 2014 Q1 2015 Q2 2015 Mono & Multi Non-Silicon Cost ($/Watt) $0.36 $0.35 $0.35 $0.34 (Including Depreciation) Mono & Multi Silicon Cost $0.10 $0.10 $0.09 $0.08 ($/Watt) Total Cost ($/Watt) $0.46 $0.45 $0.44 $0.42 (Including Depreciation) No
Slide 6: Connected Downstream Project List
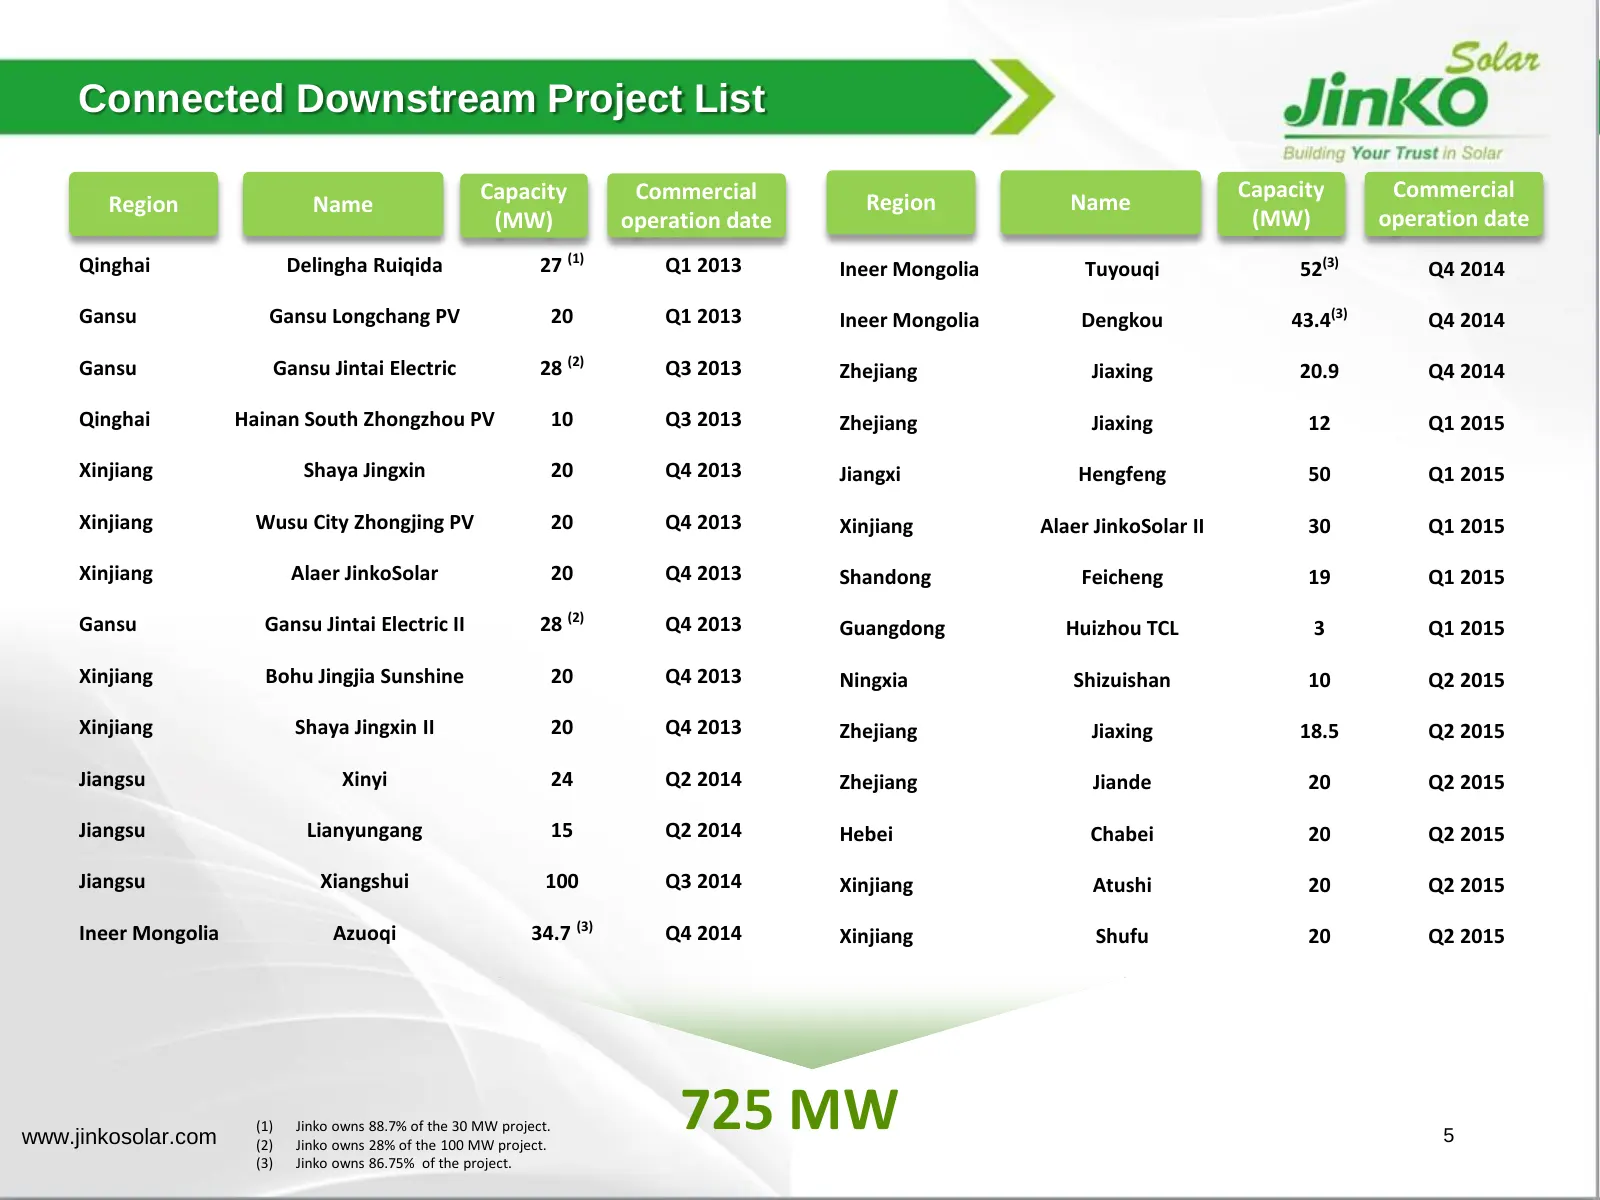
Connected Downstream Project List Capacity Commercial Capacity Commercial Region Name Region Name (MW) operation date (MW) operation date Qinghai Delingha Ruiqida 27 (1) Q1 2013 Ineer Mongolia Tuyouqi 52(3) Q4 2014 Gansu Gansu Longchang PV 20 Q1 2013 Ineer Mongolia Dengkou 43.4(3) Q4 2014 Gansu Gans
Slide 7: Power Output
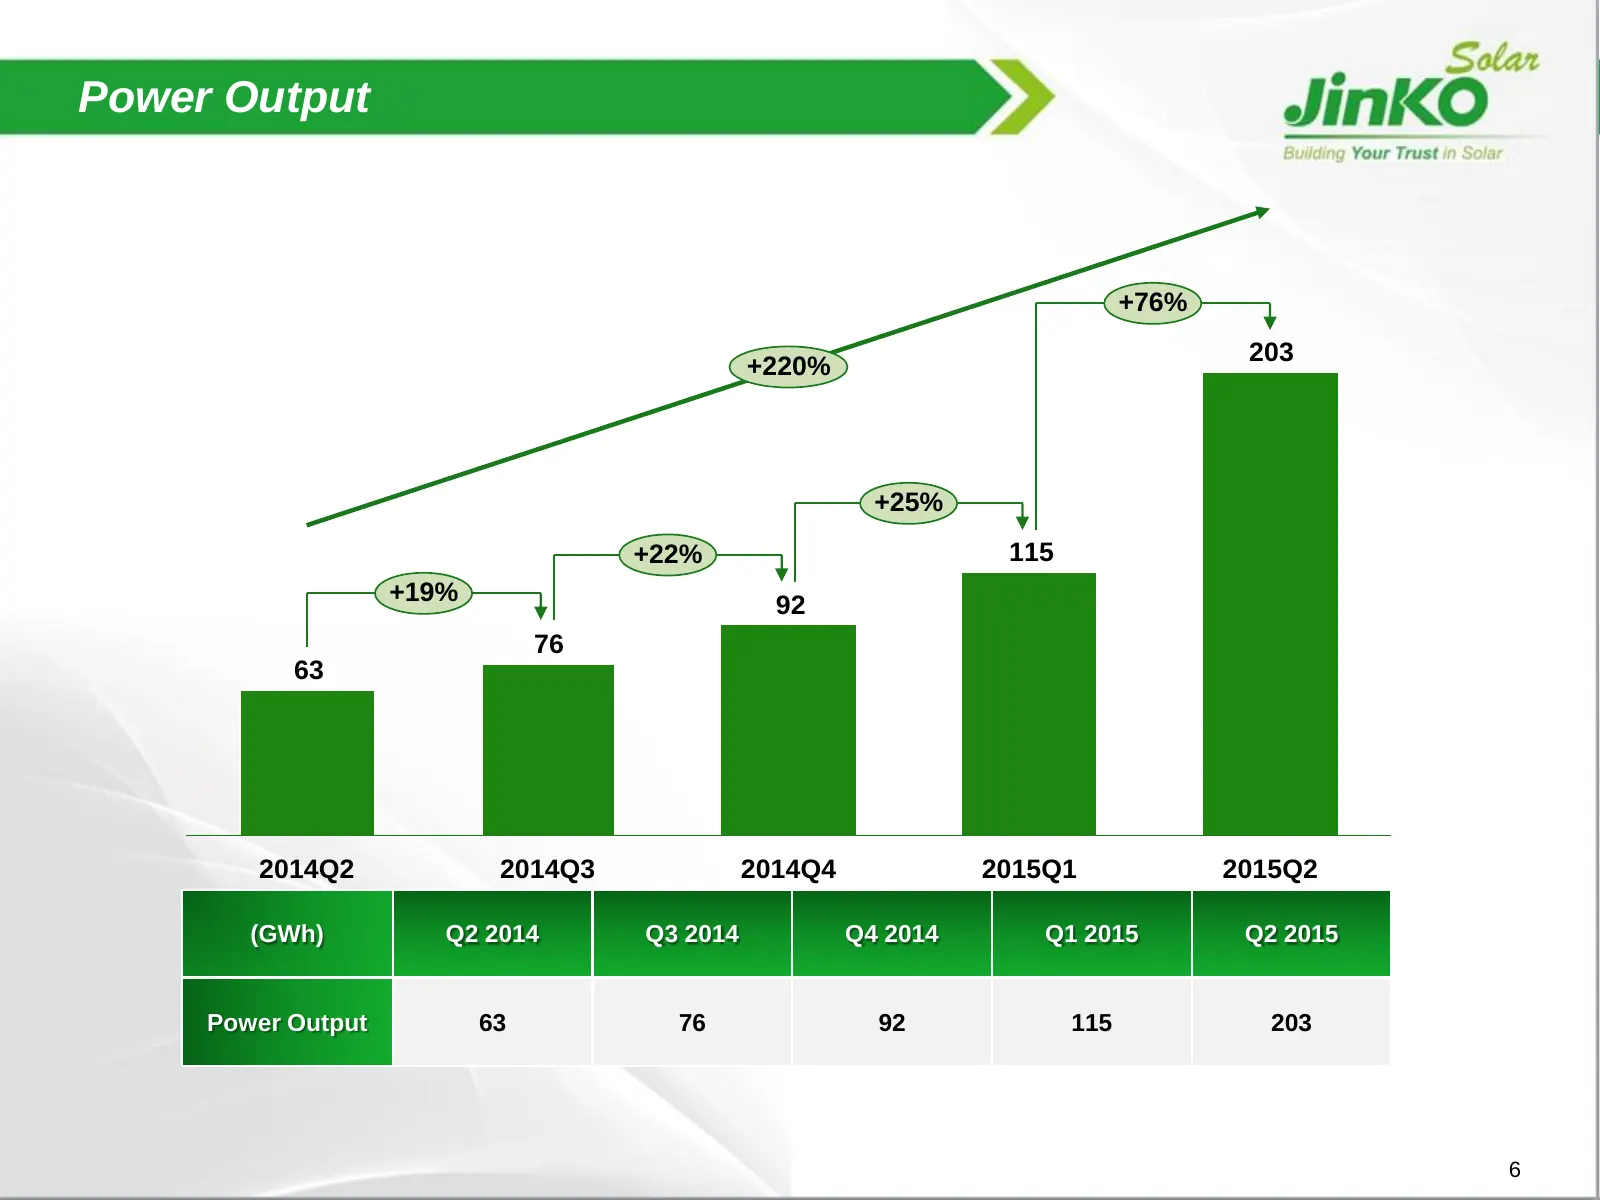
Power Output +76% 203 +220% +25% +22% 115 +19% 92 76 63 2014Q2 2014Q3 2014Q4 2015Q1 2015Q2 (GWh) Q2 2014 Q3 2014 Q4 2014 Q1 2015 Q2 2015 Power Output 63 76 92 115 203 6
Slide 8: Quarterly Financial Highlights
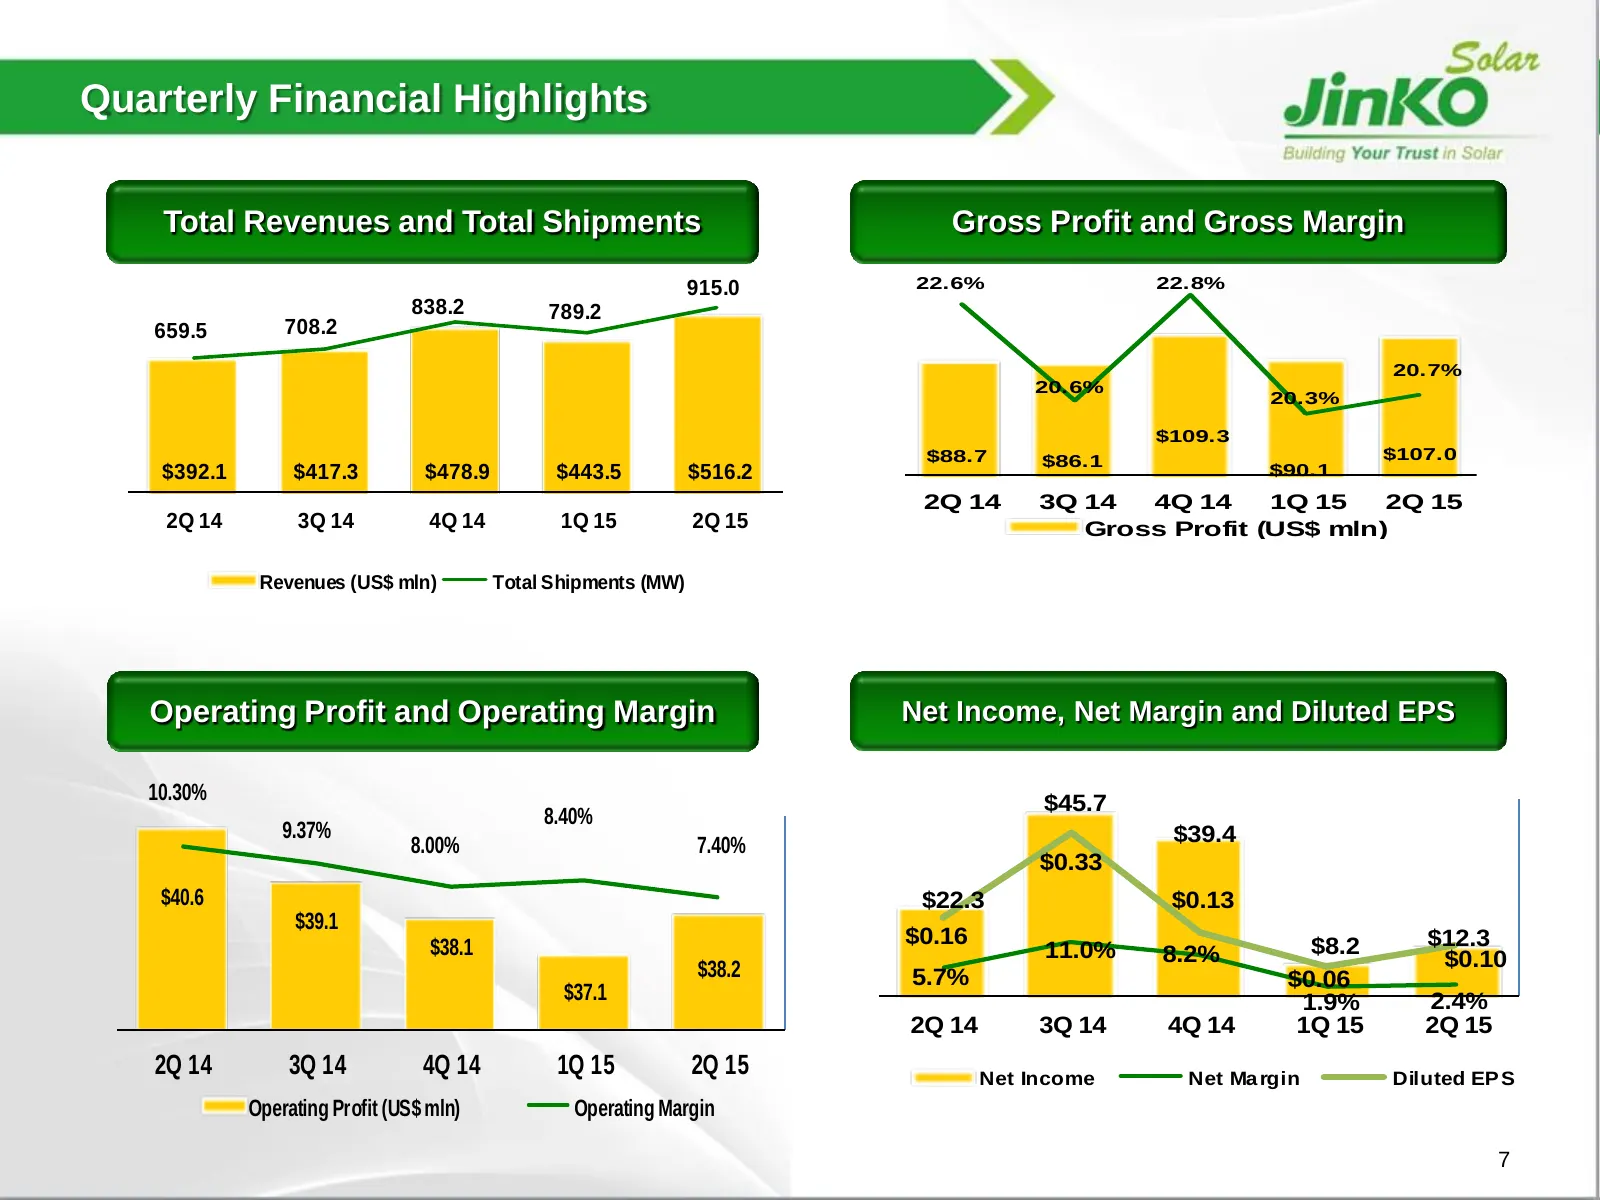
Quarterly Financial Highlights Total Revenues and Total Shipments Gross Profit and Gross Margin 915.0 22.6% 22.8% 838.2 789.2 659.5 708.2 20.7% 20.6% 20.3% $109.3 $88.7 $86.1 $107.0 $392.1 $417.3 $478.9 $443.5 $516.2 $90.1 2Q 14 3Q 14 4Q 14 1Q 15 2Q 15 2Q 14 3Q 14 4Q 14 1Q 15 2Q 15 Gross Profit (US$
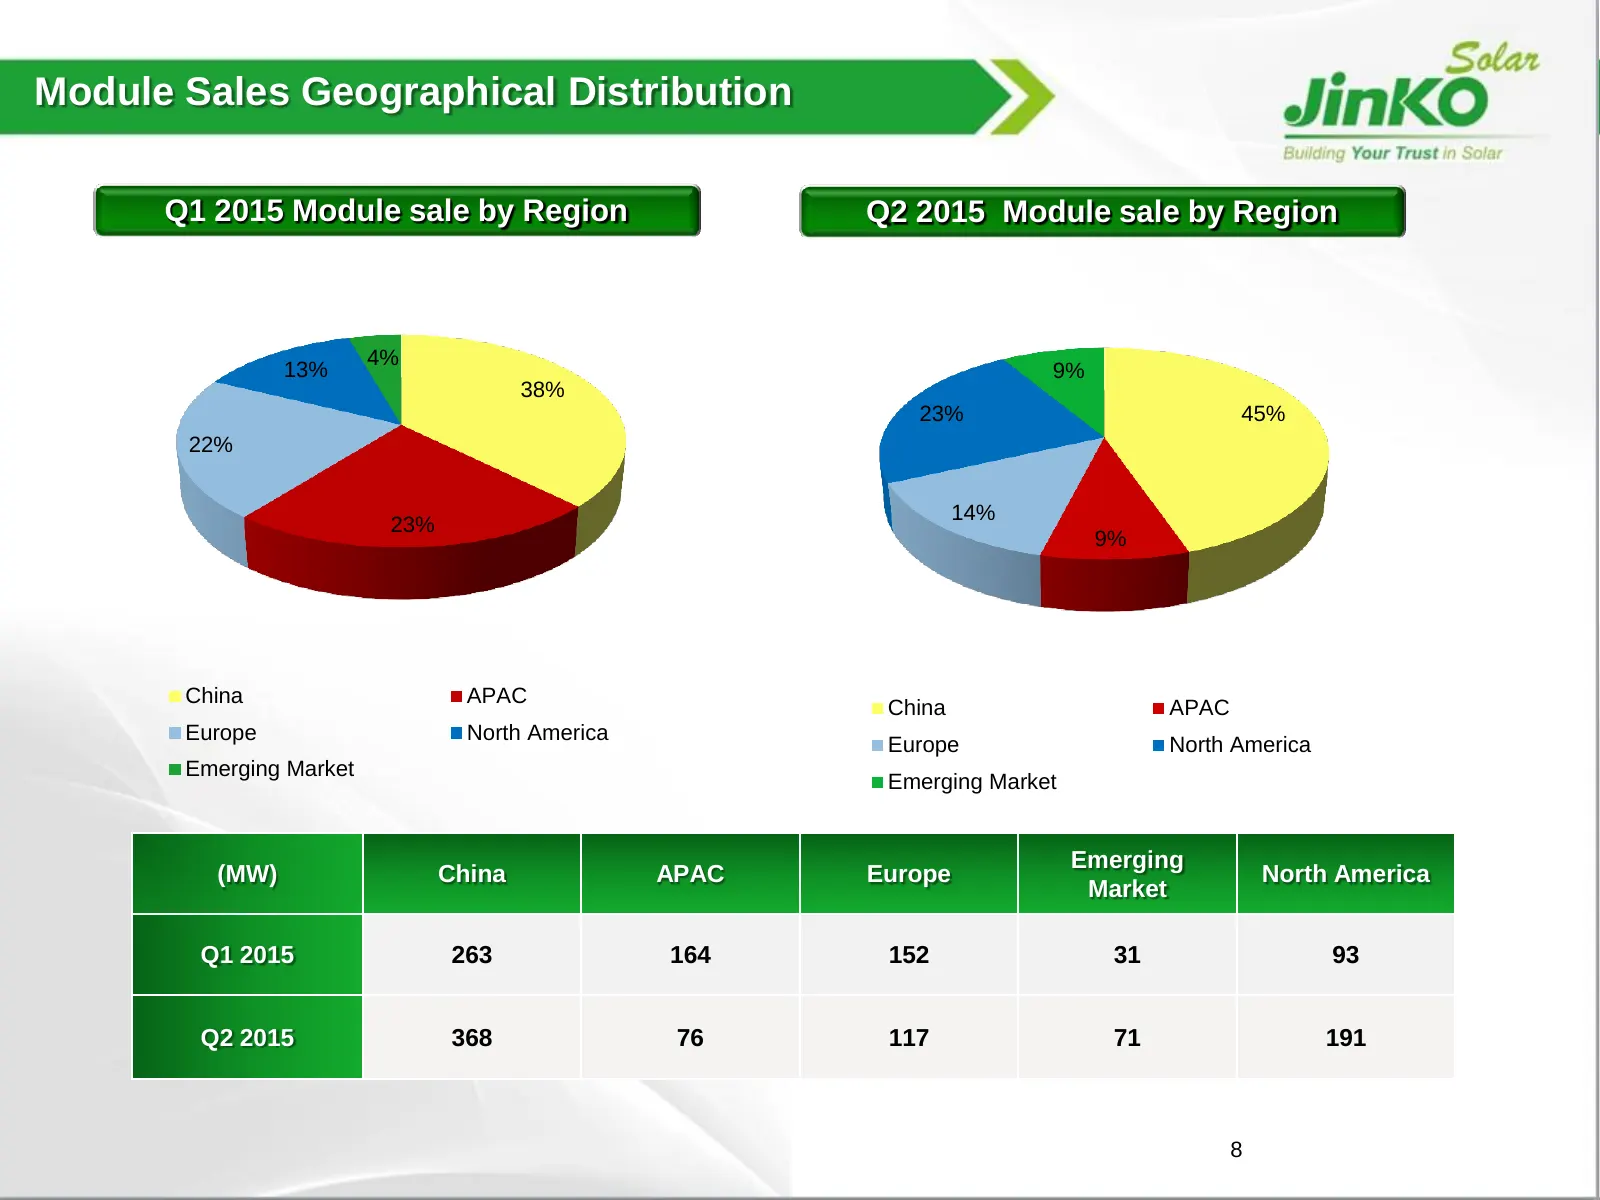
Slide 9: Module Sales Geographical Distribution
Module Sales Geographical Distribution Q1 2015 Module sale by Region Q2 2015 Module sale by Region 4% 13% 9% 38% 23% 45% 22% 14% 23% 9% China APAC China APAC Europe North America Europe North America Emerging Market Emerging Market Emerging (MW) China APAC Europe North America Market Q1 2015 263 164
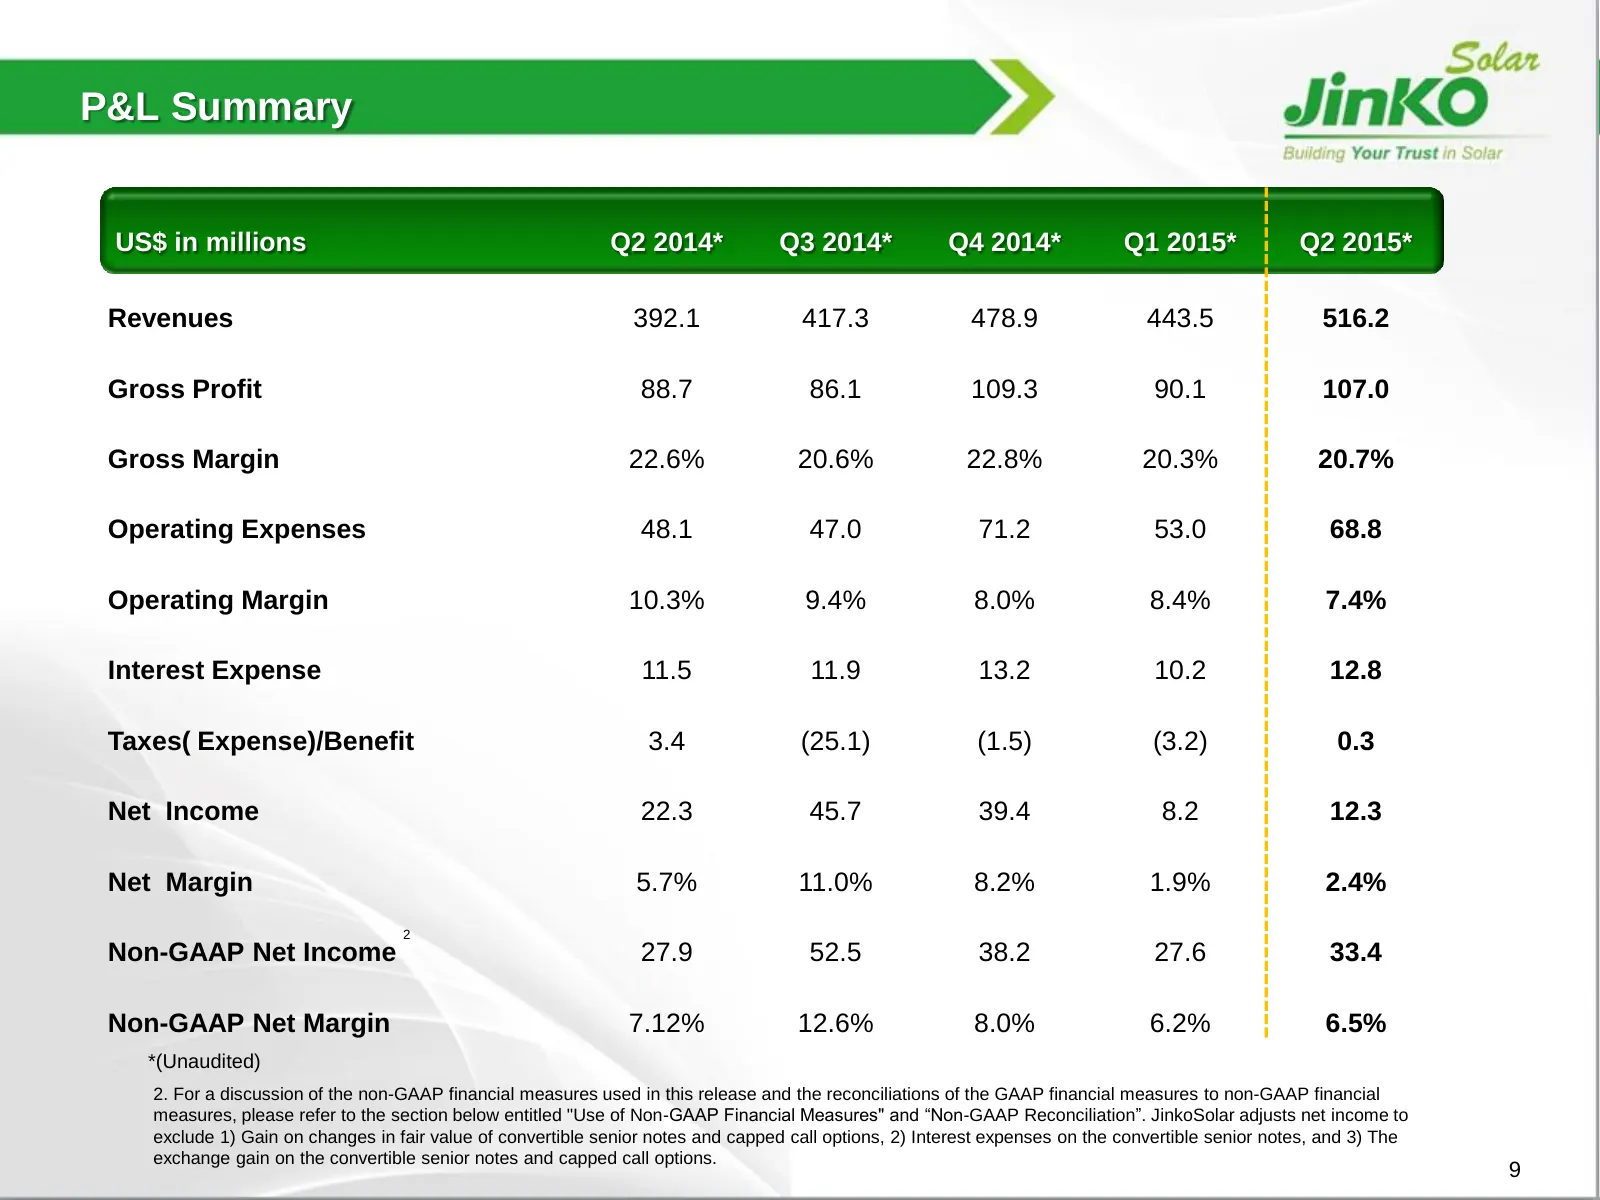
Slide 10: P&L Summary
P&L Summary US$ in millions Q2 2014* Q3 2014* Q4 2014* Q1 2015* Q2 2015* Revenues 392.1 417.3 478.9 443.5 516.2 Gross Profit 88.7 86.1 109.3 90.1 107.0 Gross Margin 22.6% 20.6% 22.8% 20.3% 20.7% Operating Expenses 48.1 47.0 71.2 53.0 68.8 Operating Margin 10.3% 9.4% 8.0% 8.4% 7.4% Interest Expense 1
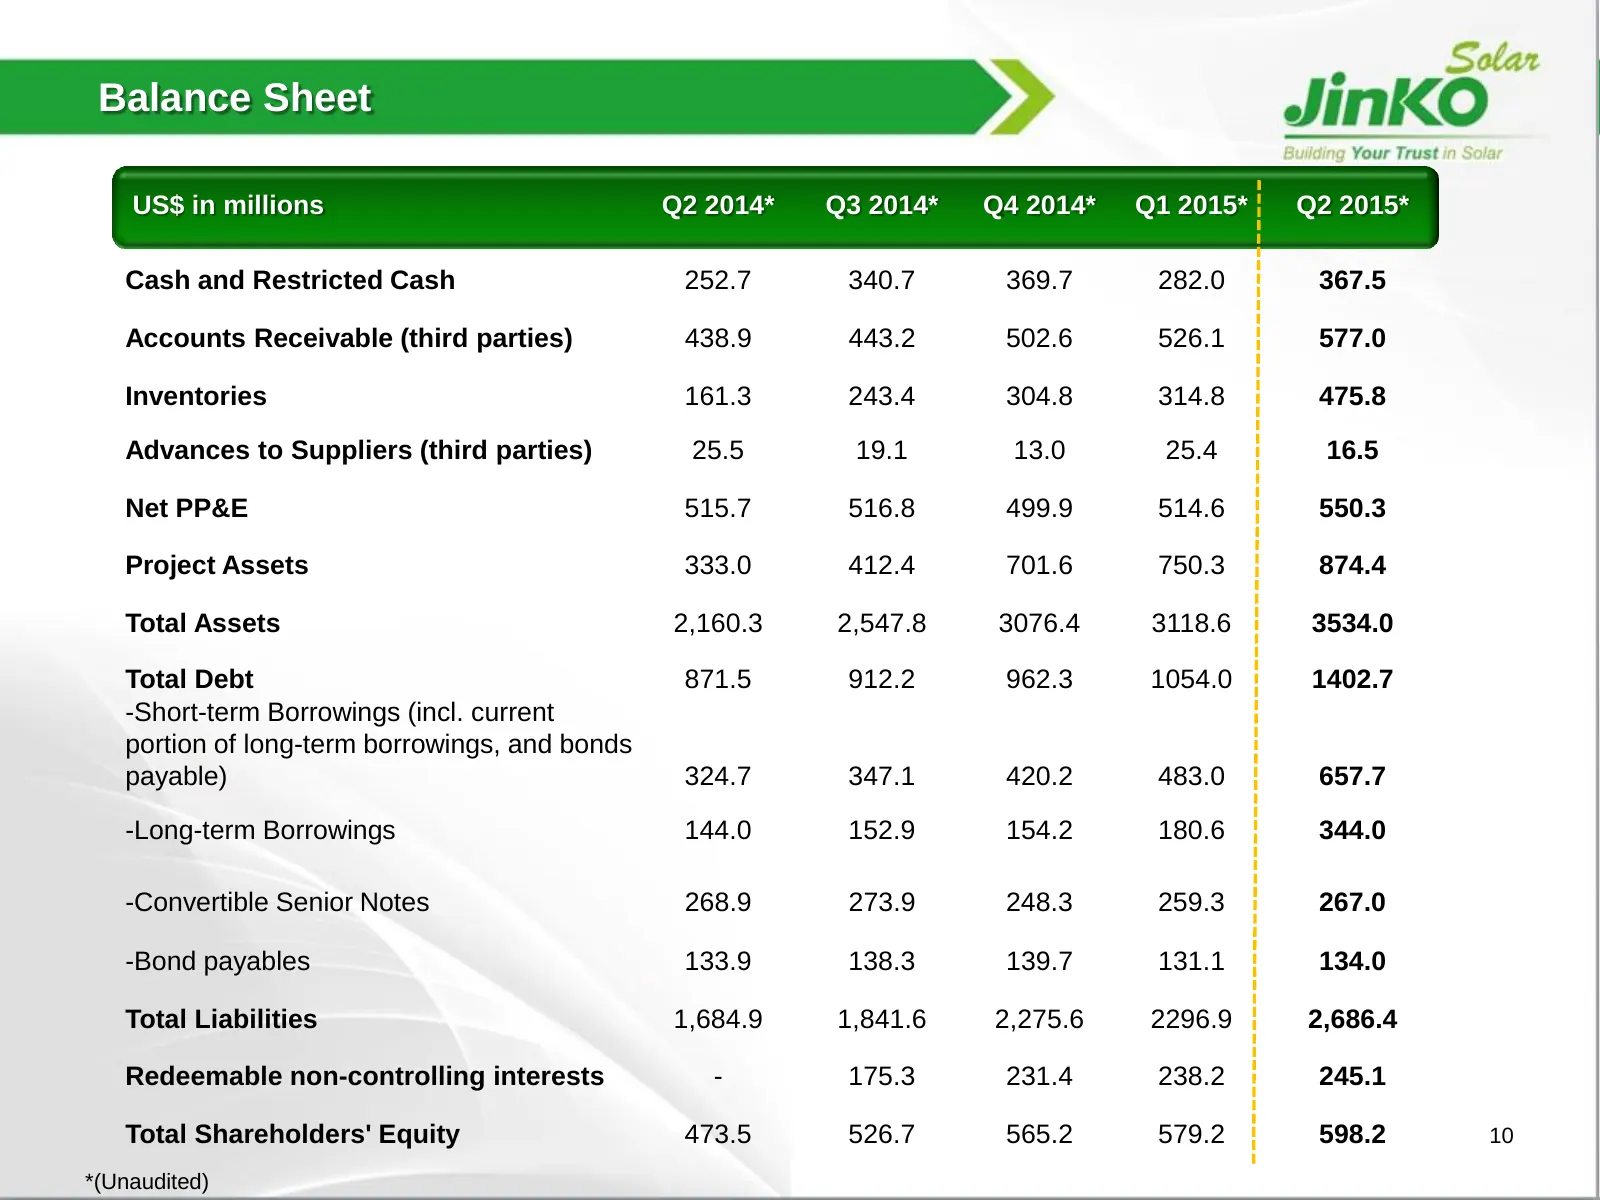
Slide 11: Balance Sheet
Balance Sheet US$ in millions Q2 2014* Q3 2014* Q4 2014* Q1 2015* Q2 2015* Cash and Restricted Cash 252.7 340.7 369.7 282.0 367.5 Accounts Receivable (third parties) 438.9 443.2 502.6 526.1 577.0 Inventories 161.3 243.4 304.8 314.8 475.8 Advances to Suppliers (third parties) 25.5 19.1 13.0 25.4 16.5
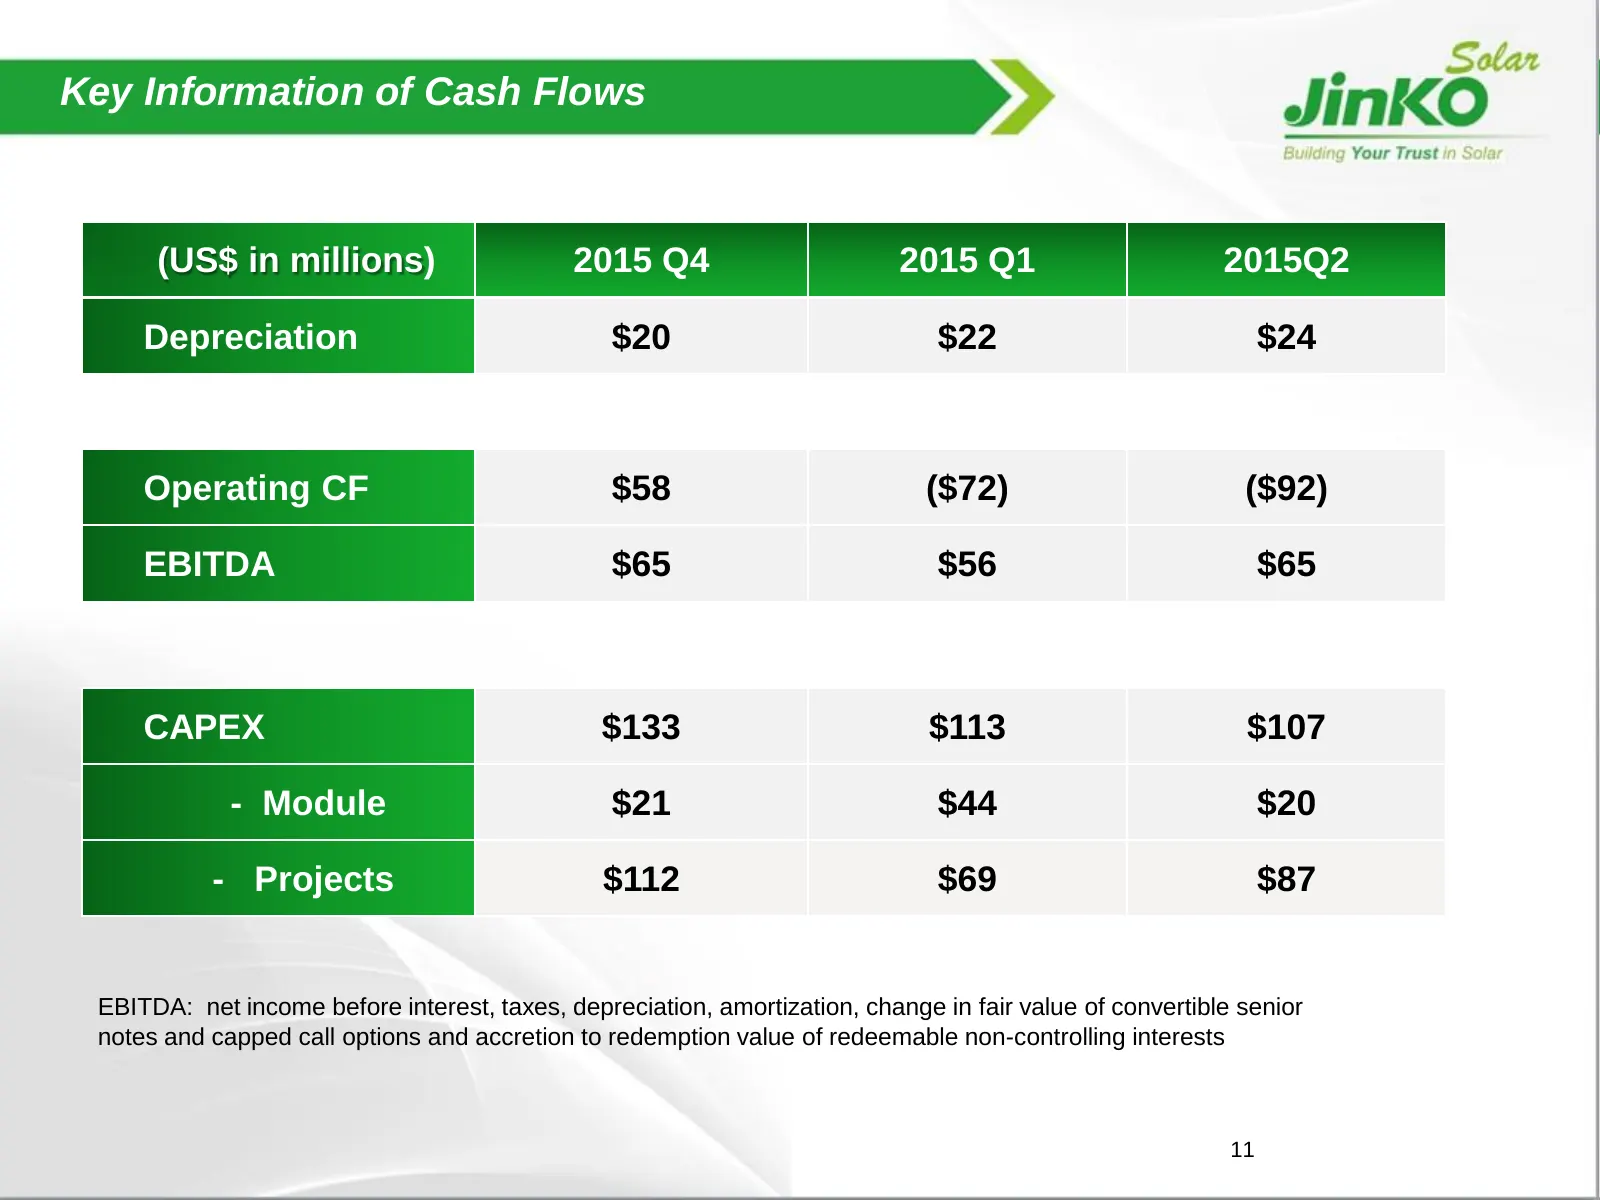
Slide 12: Key Information of Cash Flows
Key Information of Cash Flows (US$ in millions) 2015 Q4 2015 Q1 2015Q2 Depreciation $20 $22 $24 Operating CF $58 ($72) ($92) EBITDA $65 $56 $65 CAPEX $133 $113 $107 - Module $21 $44 $20 - Projects $112 $69 $87 EBITDA: net income before interest, taxes, depreciation, amortization, change in fair valu

Slide 13: Thank you!
Thank you! www.jinkosolar.com 12
Source: company website
More decks from JinkoSolar Holding Co., Ltd.
 Q2 2026 Earnings Presentation15 slides · Aug 26, 2026
 Q4 2025 Earnings Presentation15 slides · Apr 16, 2026
 Q4 2024 Earnings Presentation16 slides · Mar 26, 2025
 Q4 2022 Earnings Presentation17 slides · Mar 10, 2023
 Q3 2022 Earnings Presentation14 slides · Oct 28, 2022
 Q2 2022 Earnings Presentation14 slides · Aug 26, 2022