C&J Energy Services — Investor Presentation (February 2012)
35 slides from C&J Energy Services's investor presentation, Feb 9, 2012
Slide 1: C&J Energy Services, Inc. Investor Presentation
Exhibit 99.1 C&J Energy Services, Inc. Investor Presentation February 9, 2012
Slide 2: Disclaimer
Disclaimer Forward-Looking Statements Certain statements and information in this presentation may constitute “forward-looking statements” within the meaning of Section 27A of the Securities Act of 1933, as amended, Section 21E of the Securities Exchange Act of 1934, as amended, and the Private Secur
Slide 3: Company Overview
Company Overview qs ping & Zz %%, ge %, sé g Energy Services, Inc. ek
Slide 4: C&J is a Differentiated Energy Services Company
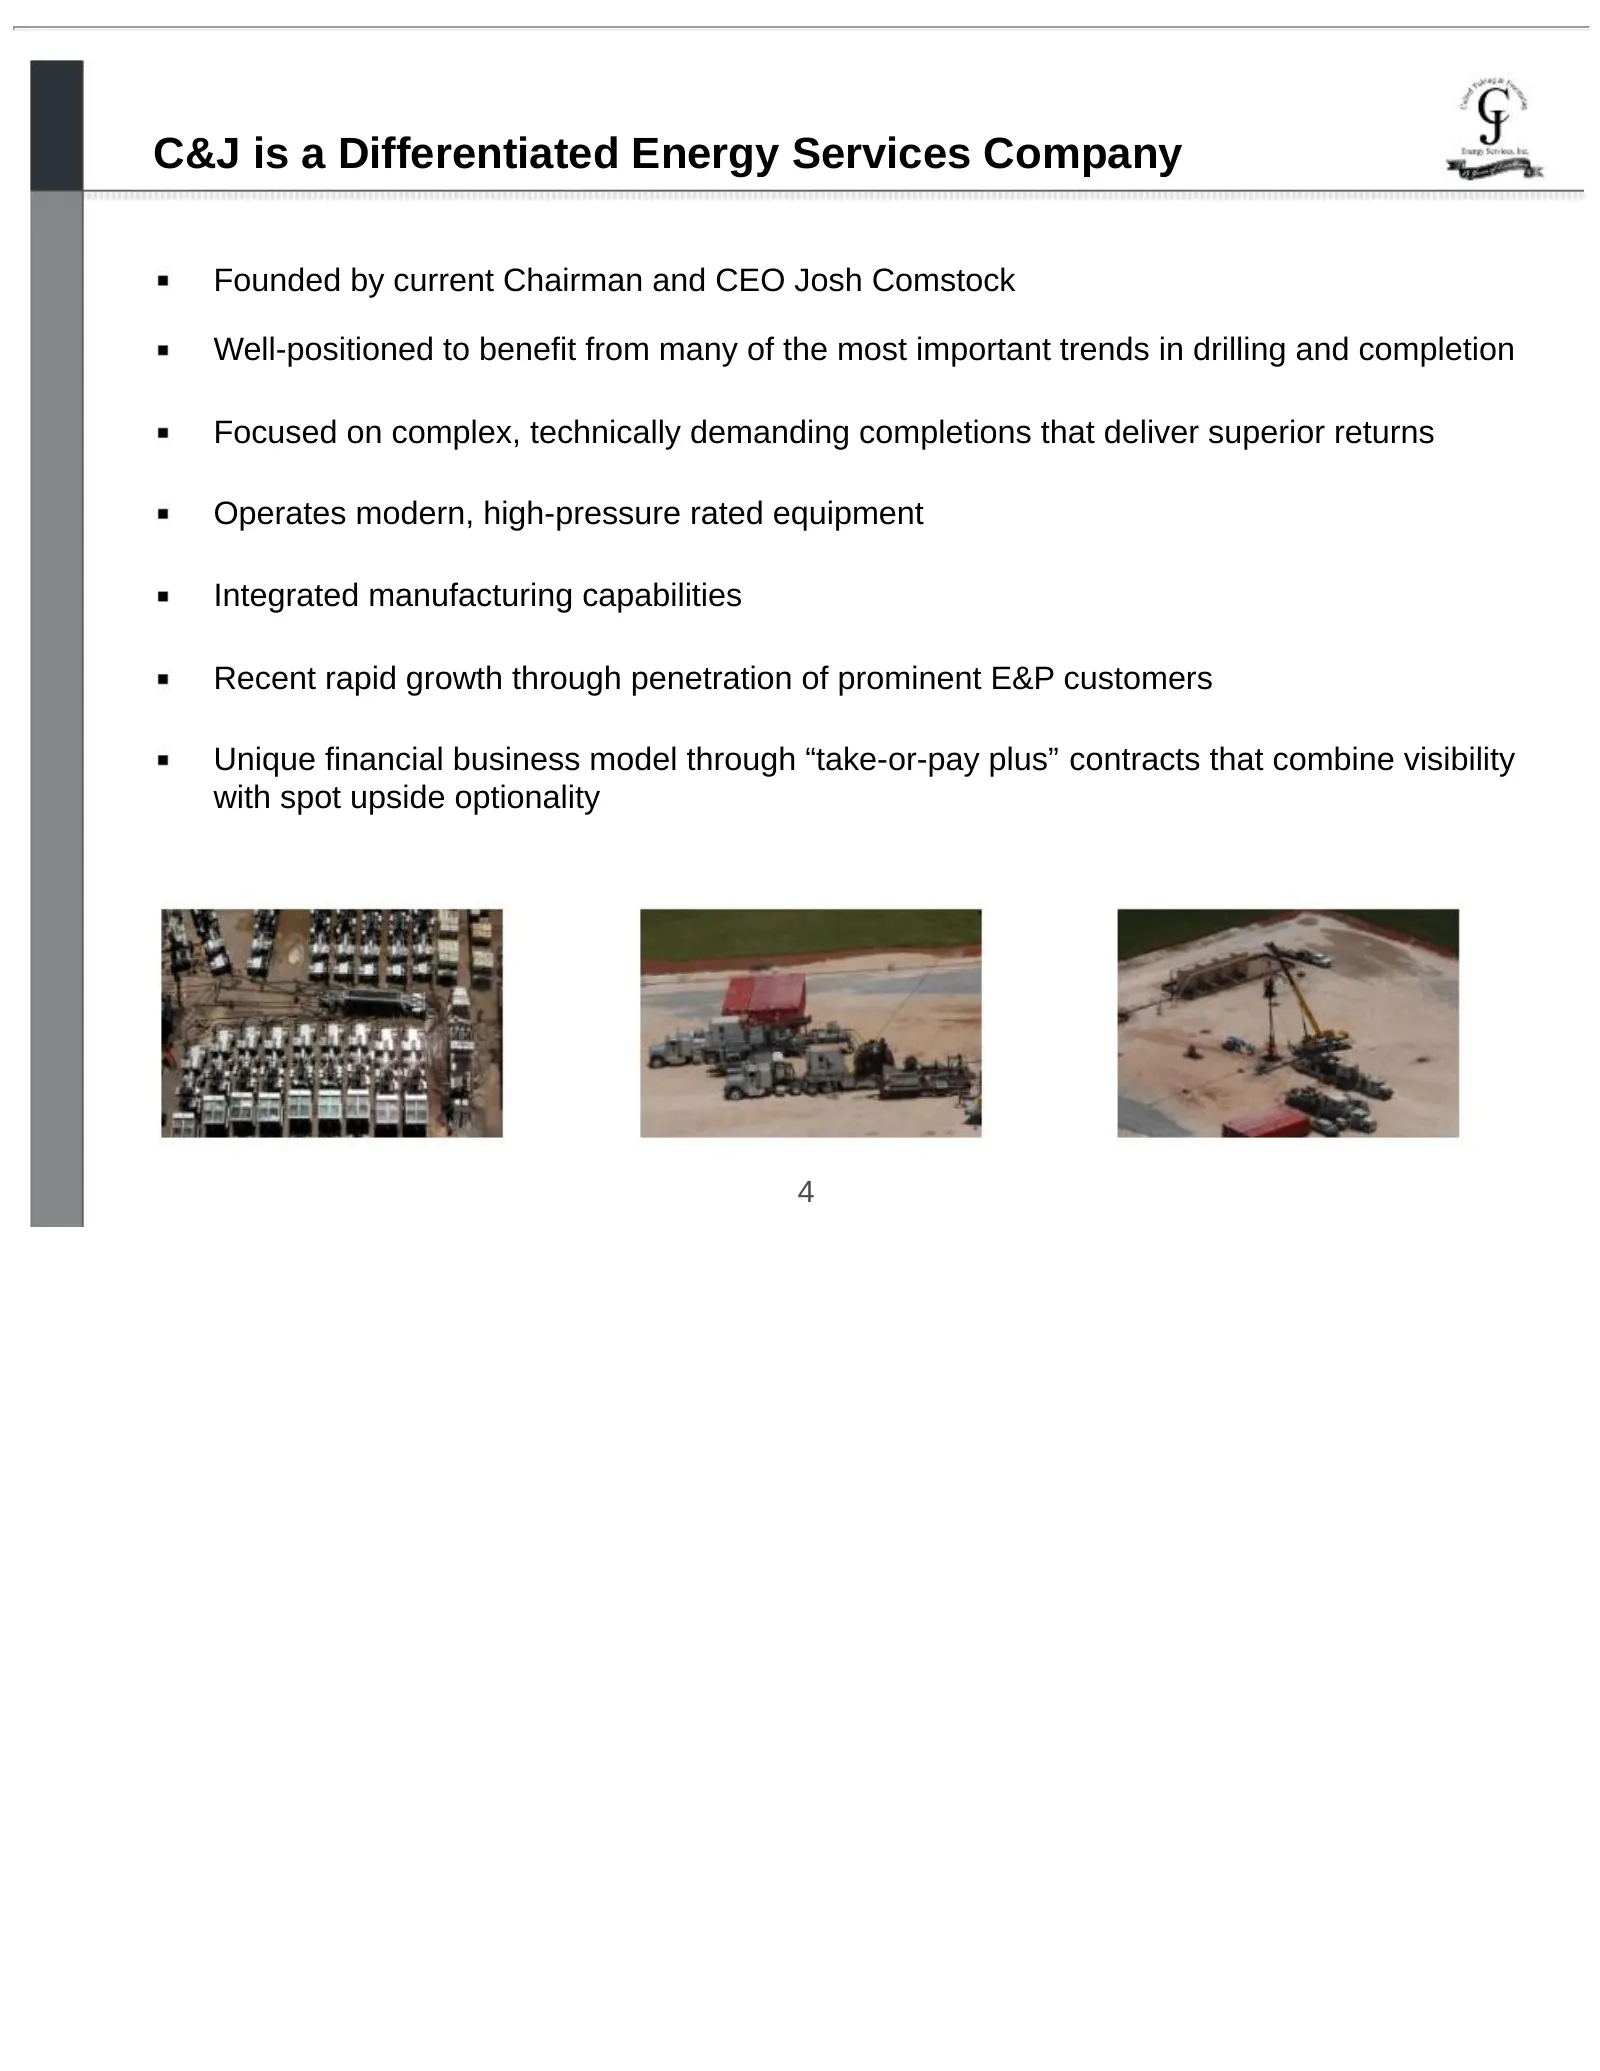
C&J is a Differentiated Energy Services Company Founded by current Chairman and CEO Josh Comstock Well-positioned to benefit from many of the most important trends in drilling and completion Focused on complex, technically demanding completions that deliver superior returns Operates modern, high-pre
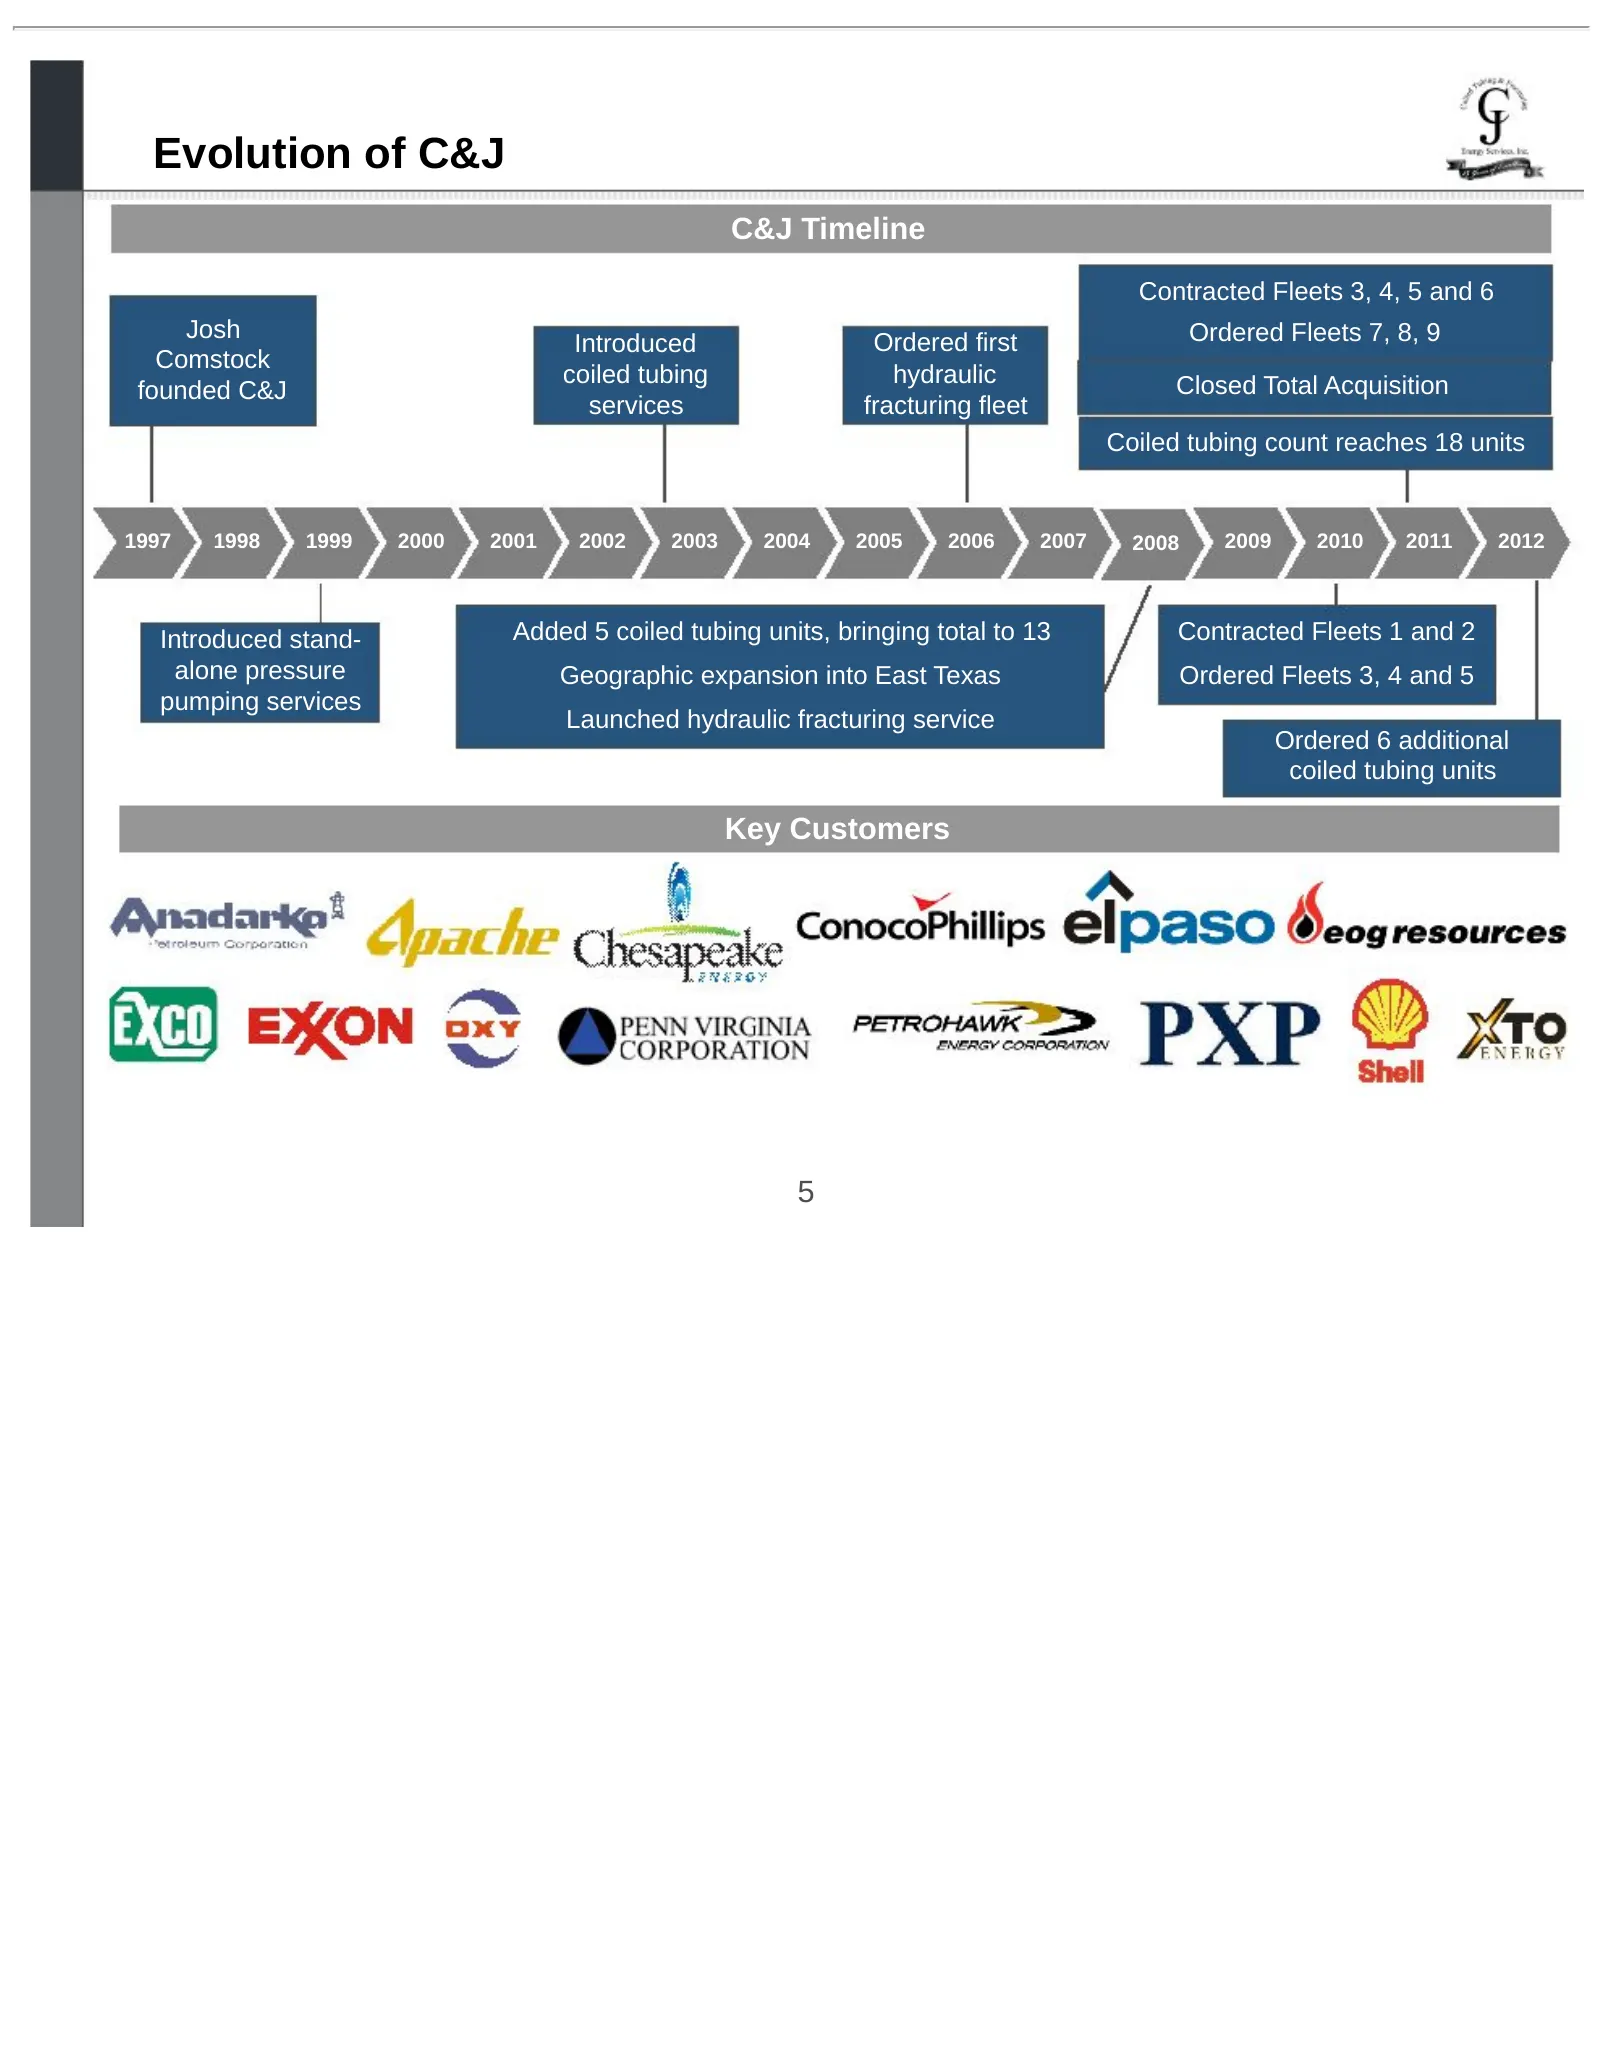
Slide 5: Evolution of C&J
Evolution of C&J C&J Timeline Contracted Fleets 3, 4, 5 and 6 Josh Ordered Fleets 7, 8, 9 Introduced Ordered first Comstock coiled tubing hydraulic Closed Total Acquisition founded C&J services fracturing fleet Coiled tubing count reaches 18 units 1997 1998 1999 2000 2001 2002 2003 2004 2005 2006 20
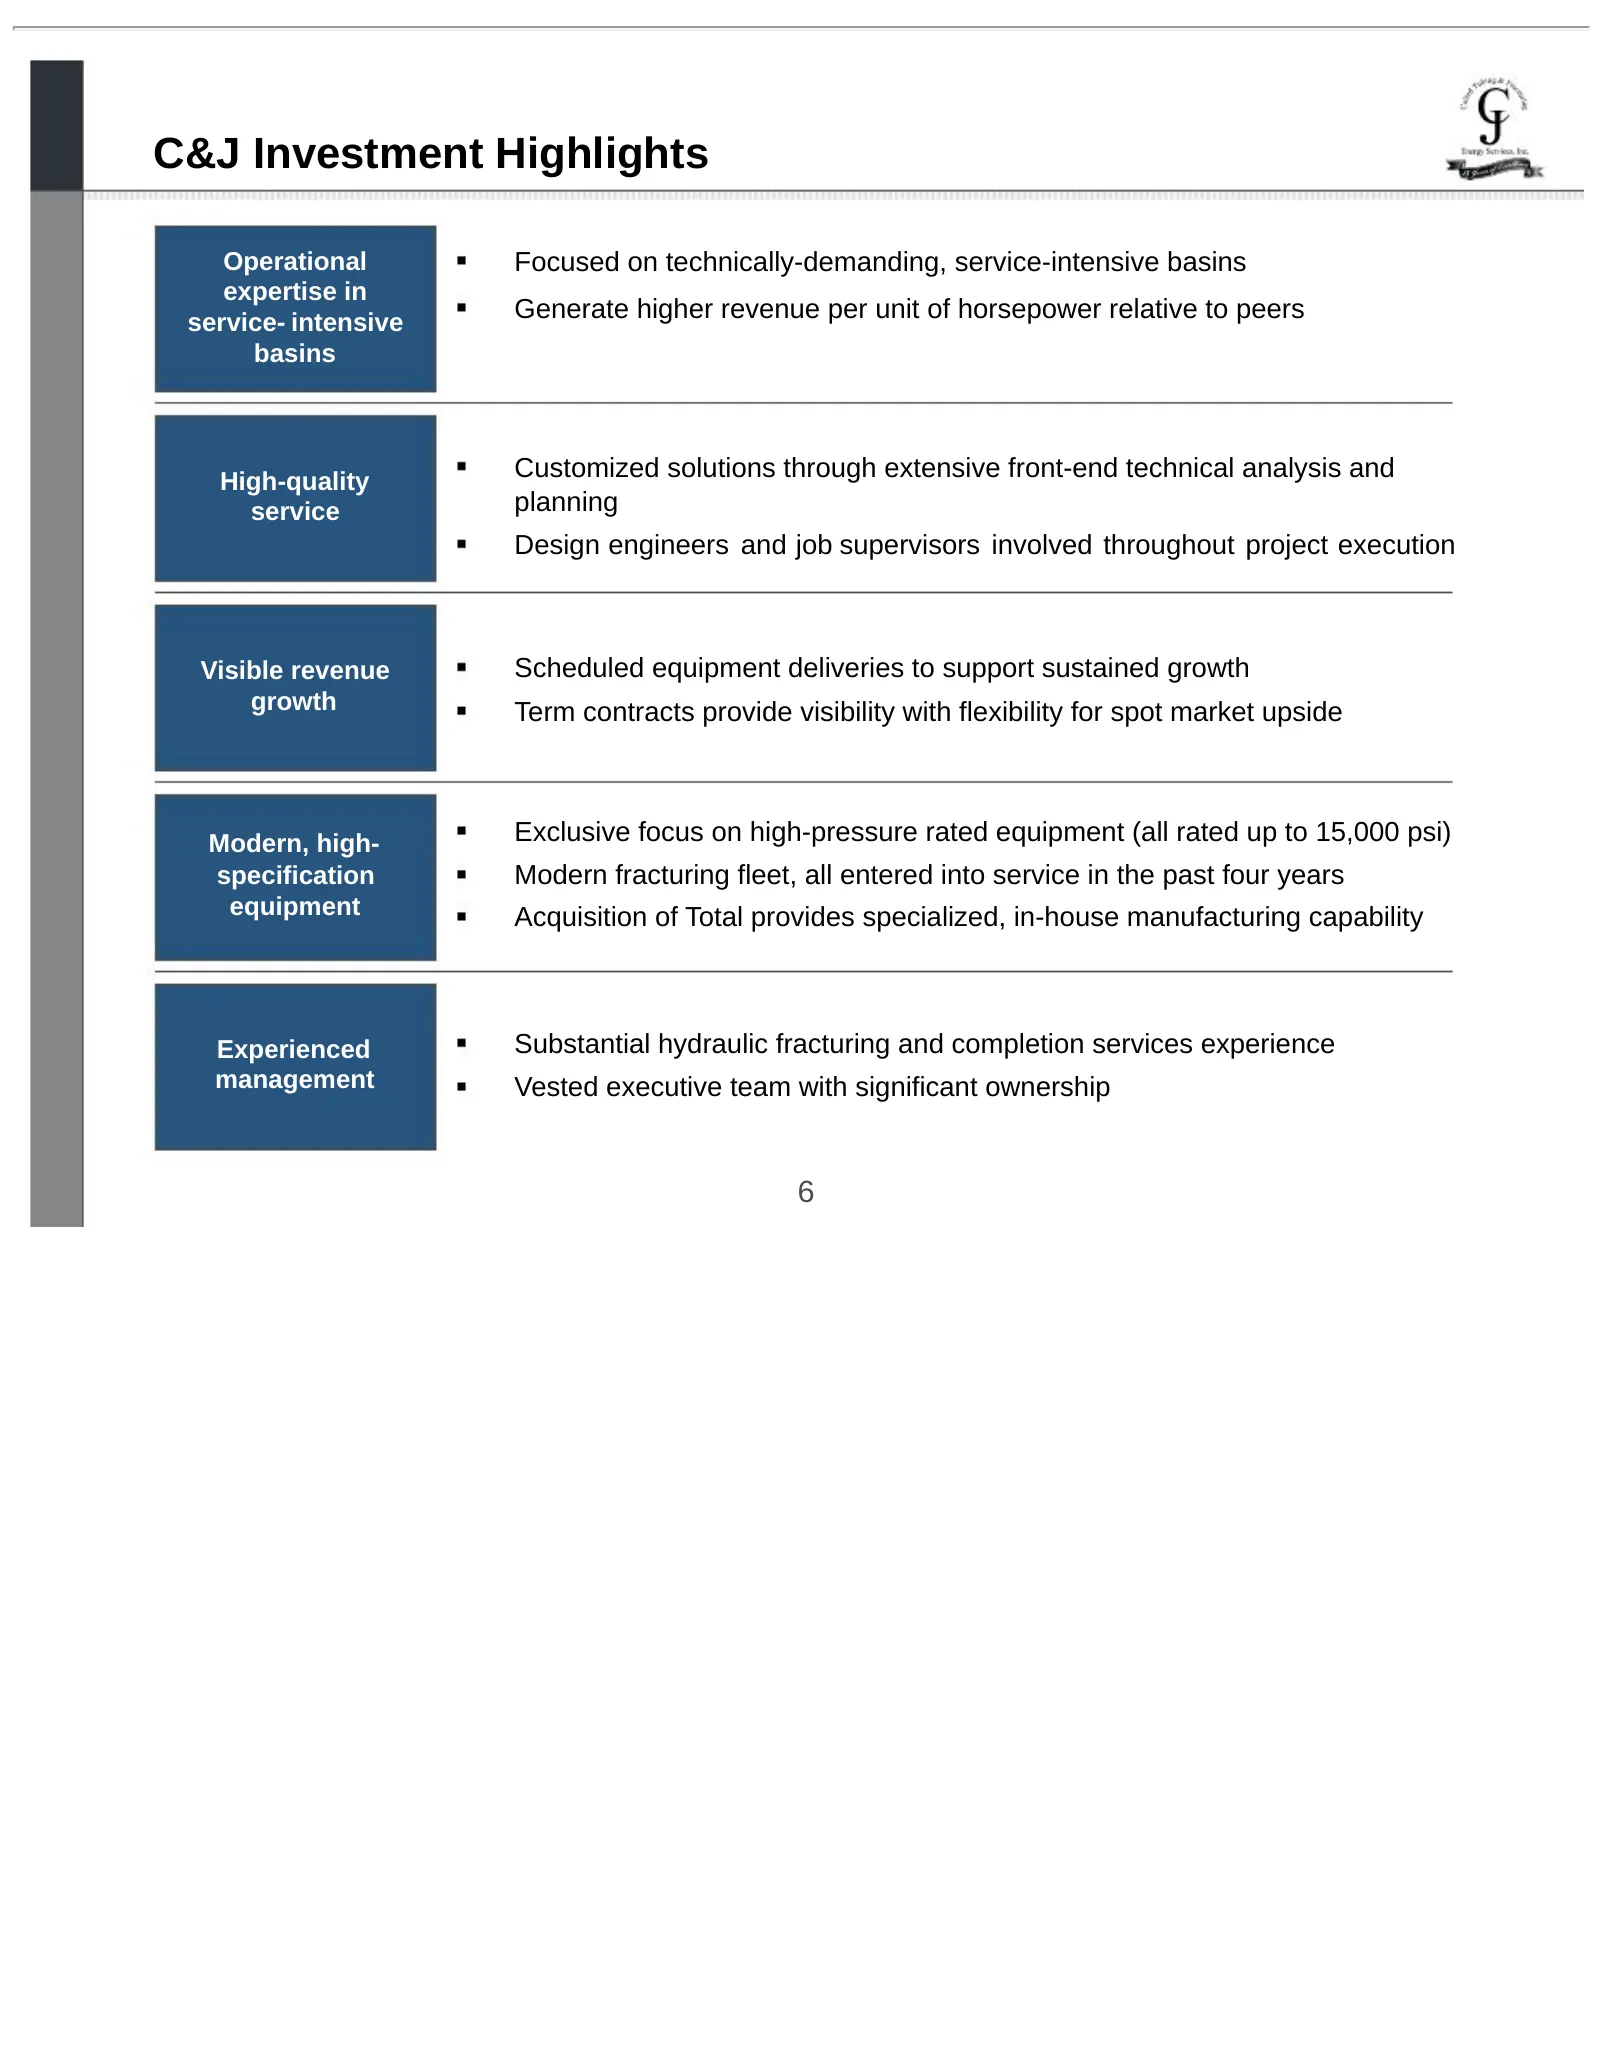
Slide 6: C&J Investment Highlights
C&J Investment Highlights Operational Focused on technically-demanding, service-intensive basins expertise in service- intensive Generate higher revenue per unit of horsepower relative to peers basins High-quality Customized solutions through extensive front-end technical analysis and service planni
Slide 7: Industry Trends
Industry Trends qs ping & Zz %%, ge %, sé g Energy Services, Inc. ek
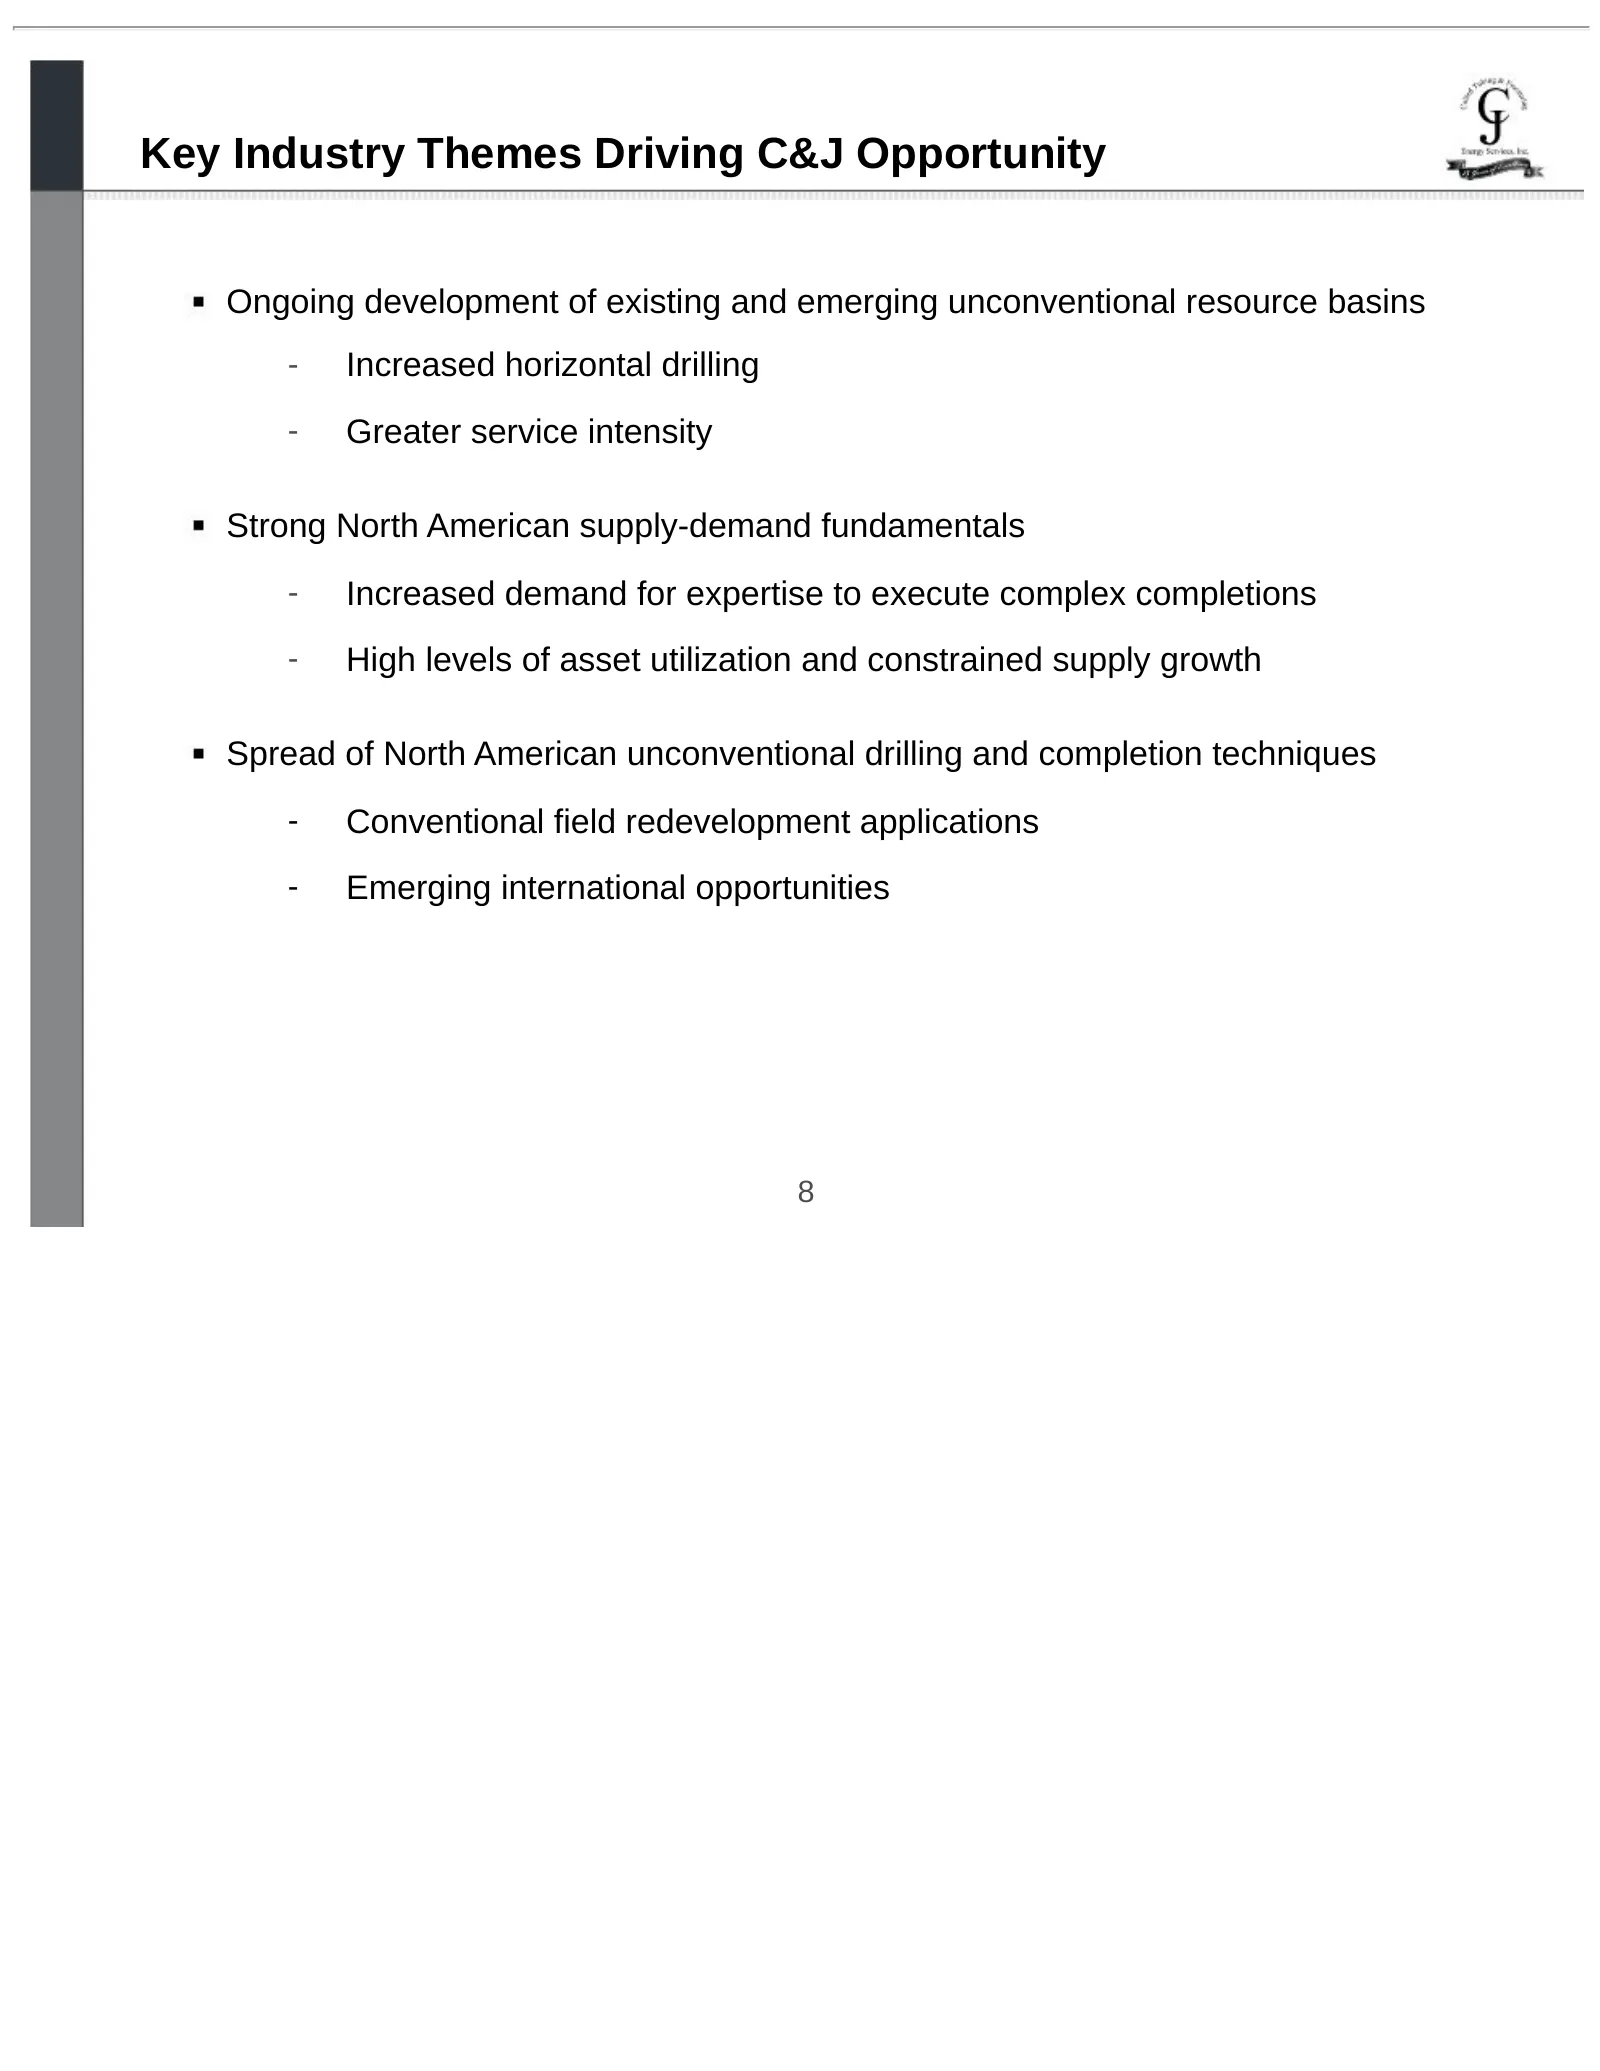
Slide 8: Key Industry Themes Driving C&J Opportunity
Key Industry Themes Driving C&J Opportunity Ongoing development of existing and emerging unconventional resource basins - Increased horizontal drilling - Greater service intensity Strong North American supply-demand fundamentals - Increased demand for expertise to execute complex completions - High
Slide 9: Strong Drilling Outlook Drives Completion Demand
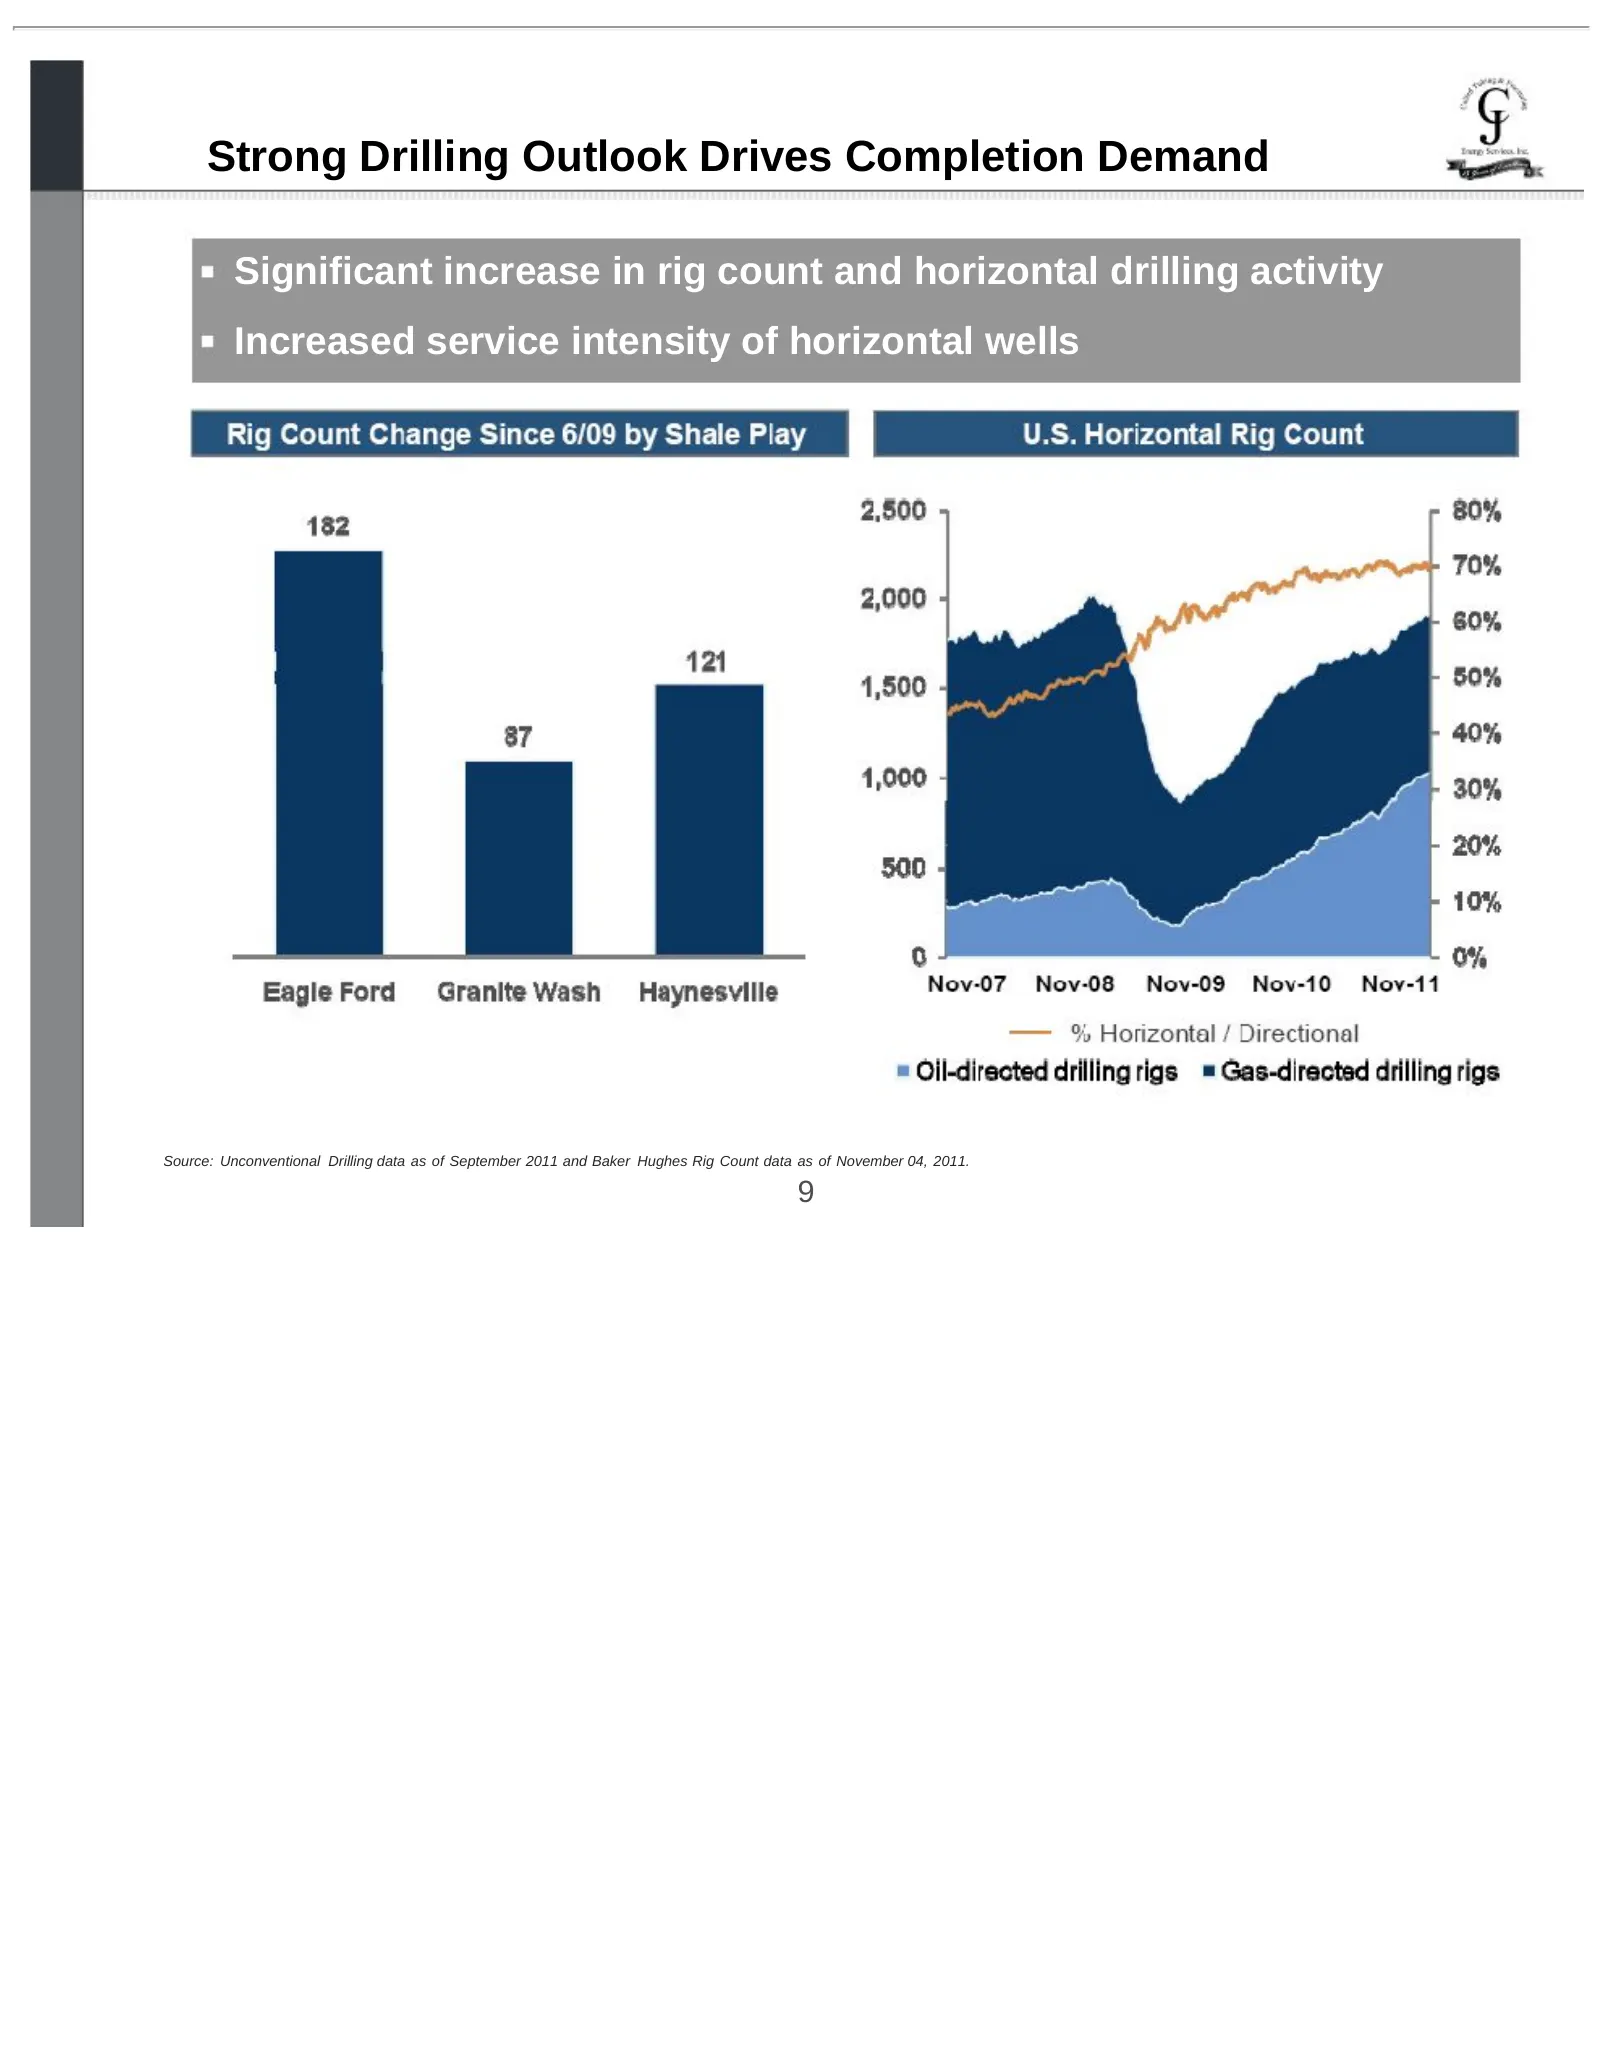
Strong Drilling Outlook Drives Completion Demand Significant increase in rig count and horizontal drilling activity Increased service intensity of horizontal wells Source: Unconventional Drilling data as of September 2011 and Baker Hughes Rig Count data as of November 04, 2011. 9
Slide 10: Advances in Completion Techniques Driving Demand
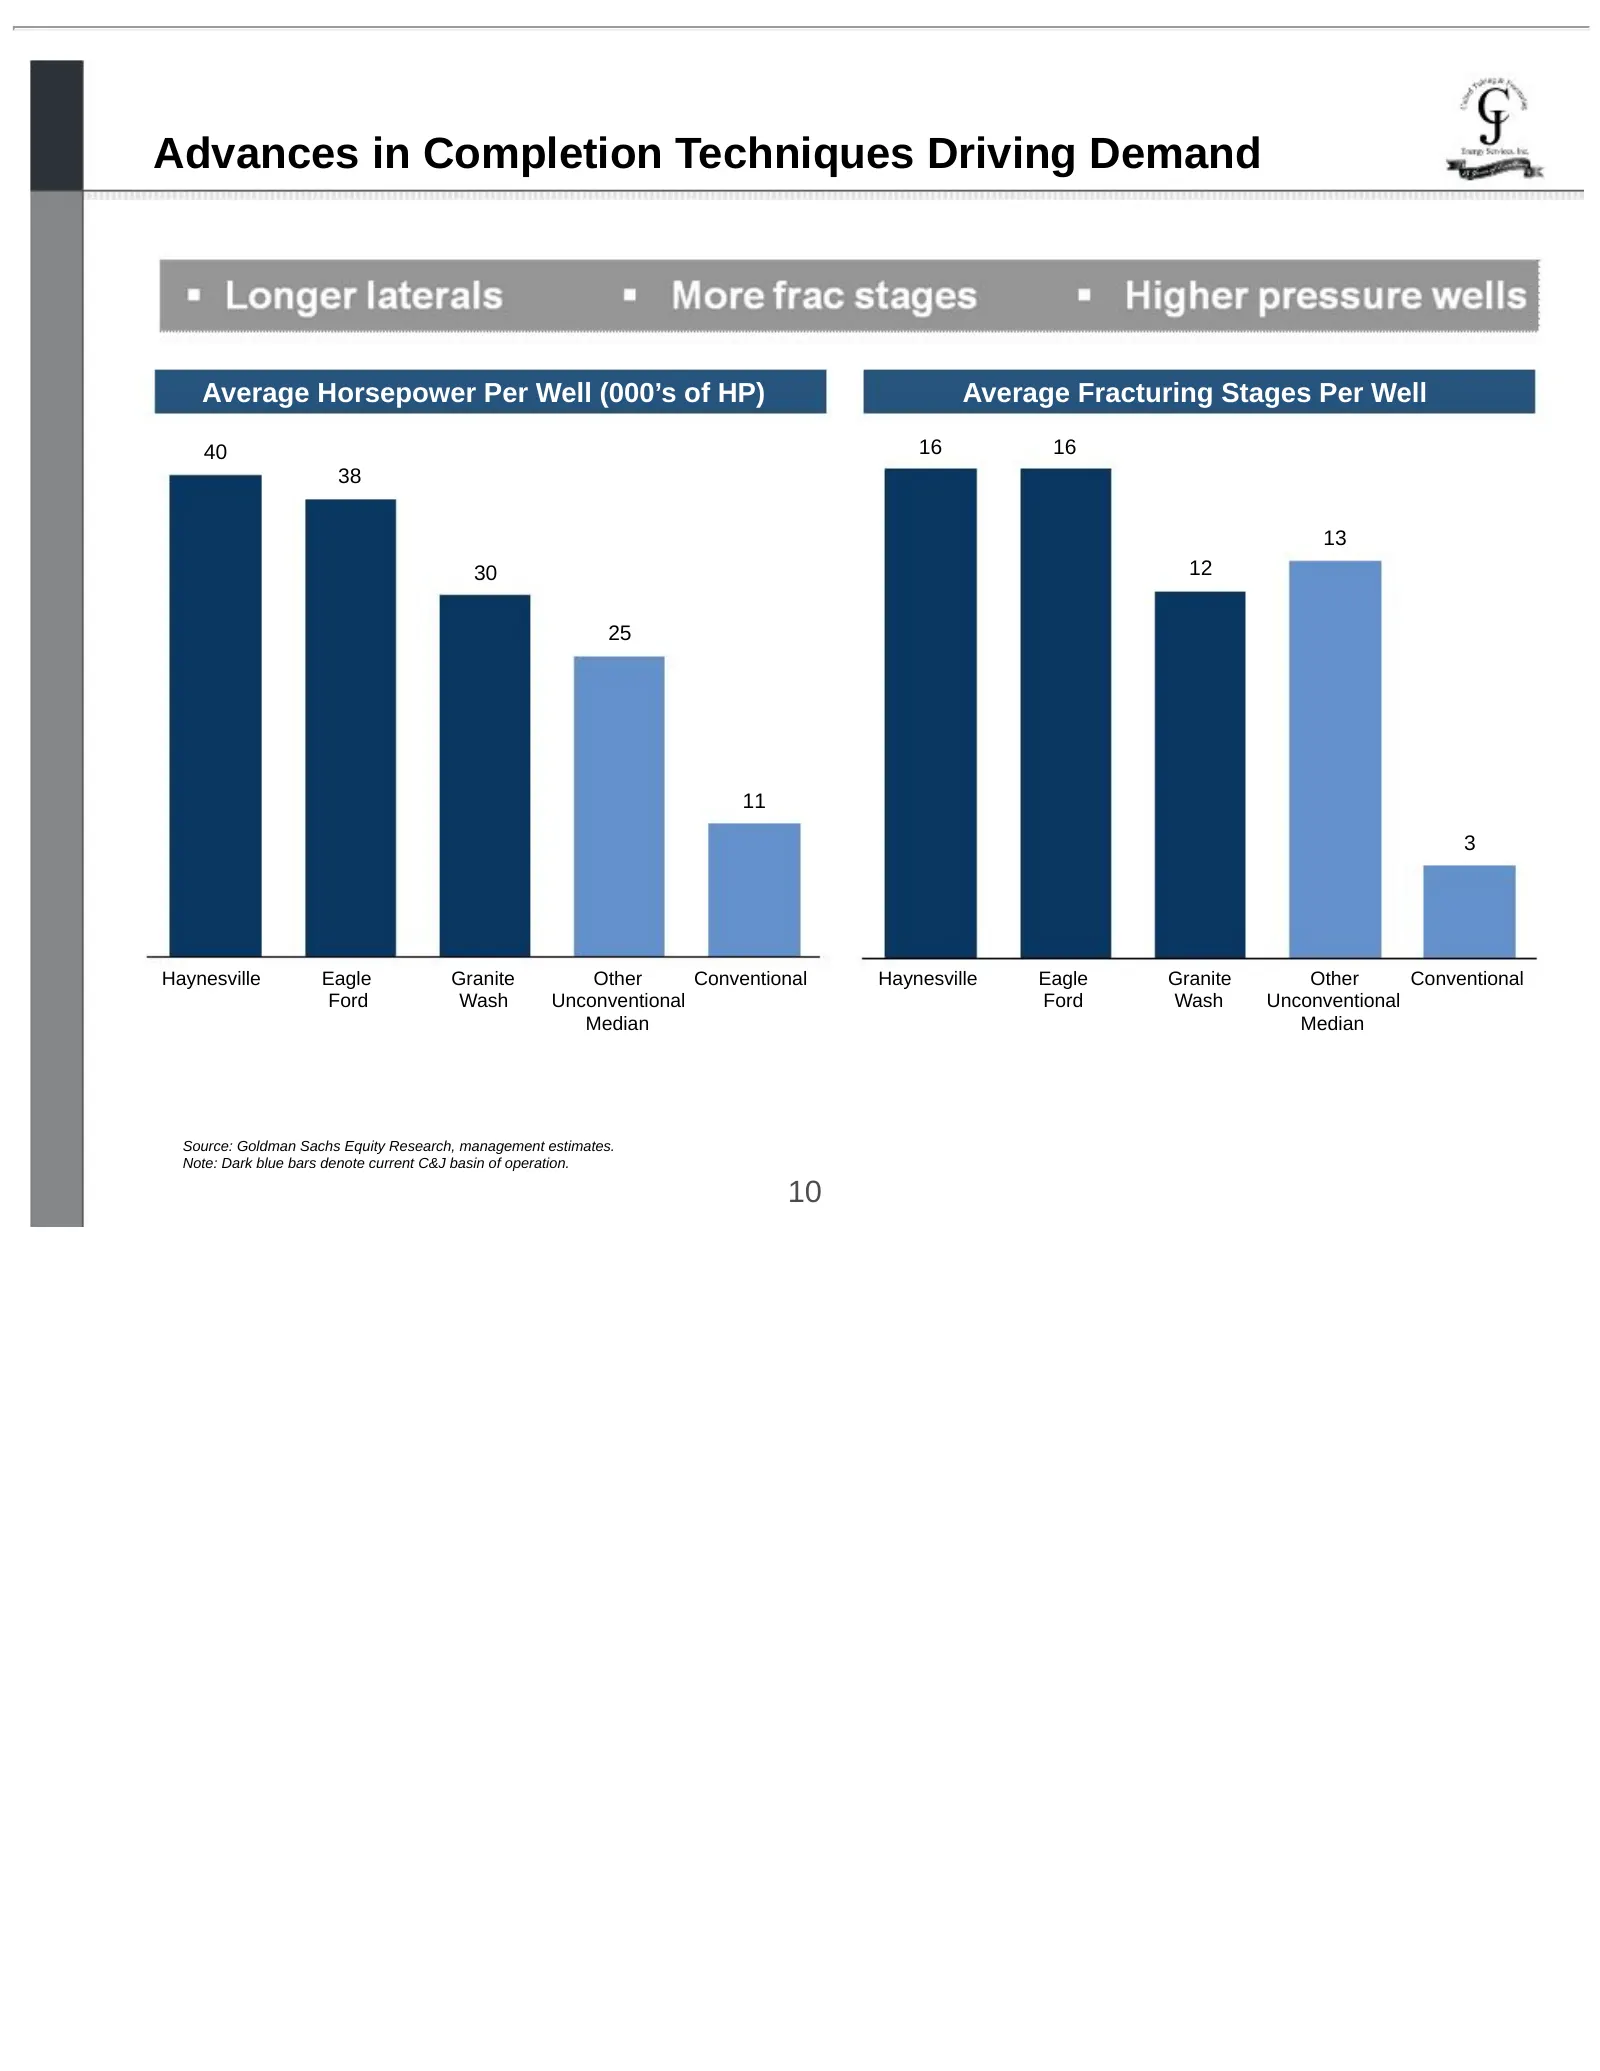
Advances in Completion Techniques Driving Demand Average Horsepower Per Well (000’s of HP) Average Fracturing Stages Per Well 40 16 16 38 13 30 12 25 11 3 Haynesville Eagle Granite Other Conventional Haynesville Eagle Granite Other Conventional Ford Wash Unconventional Ford Wash Unconventional Media
Slide 11: Favorable Supply / Demand Fundamentals
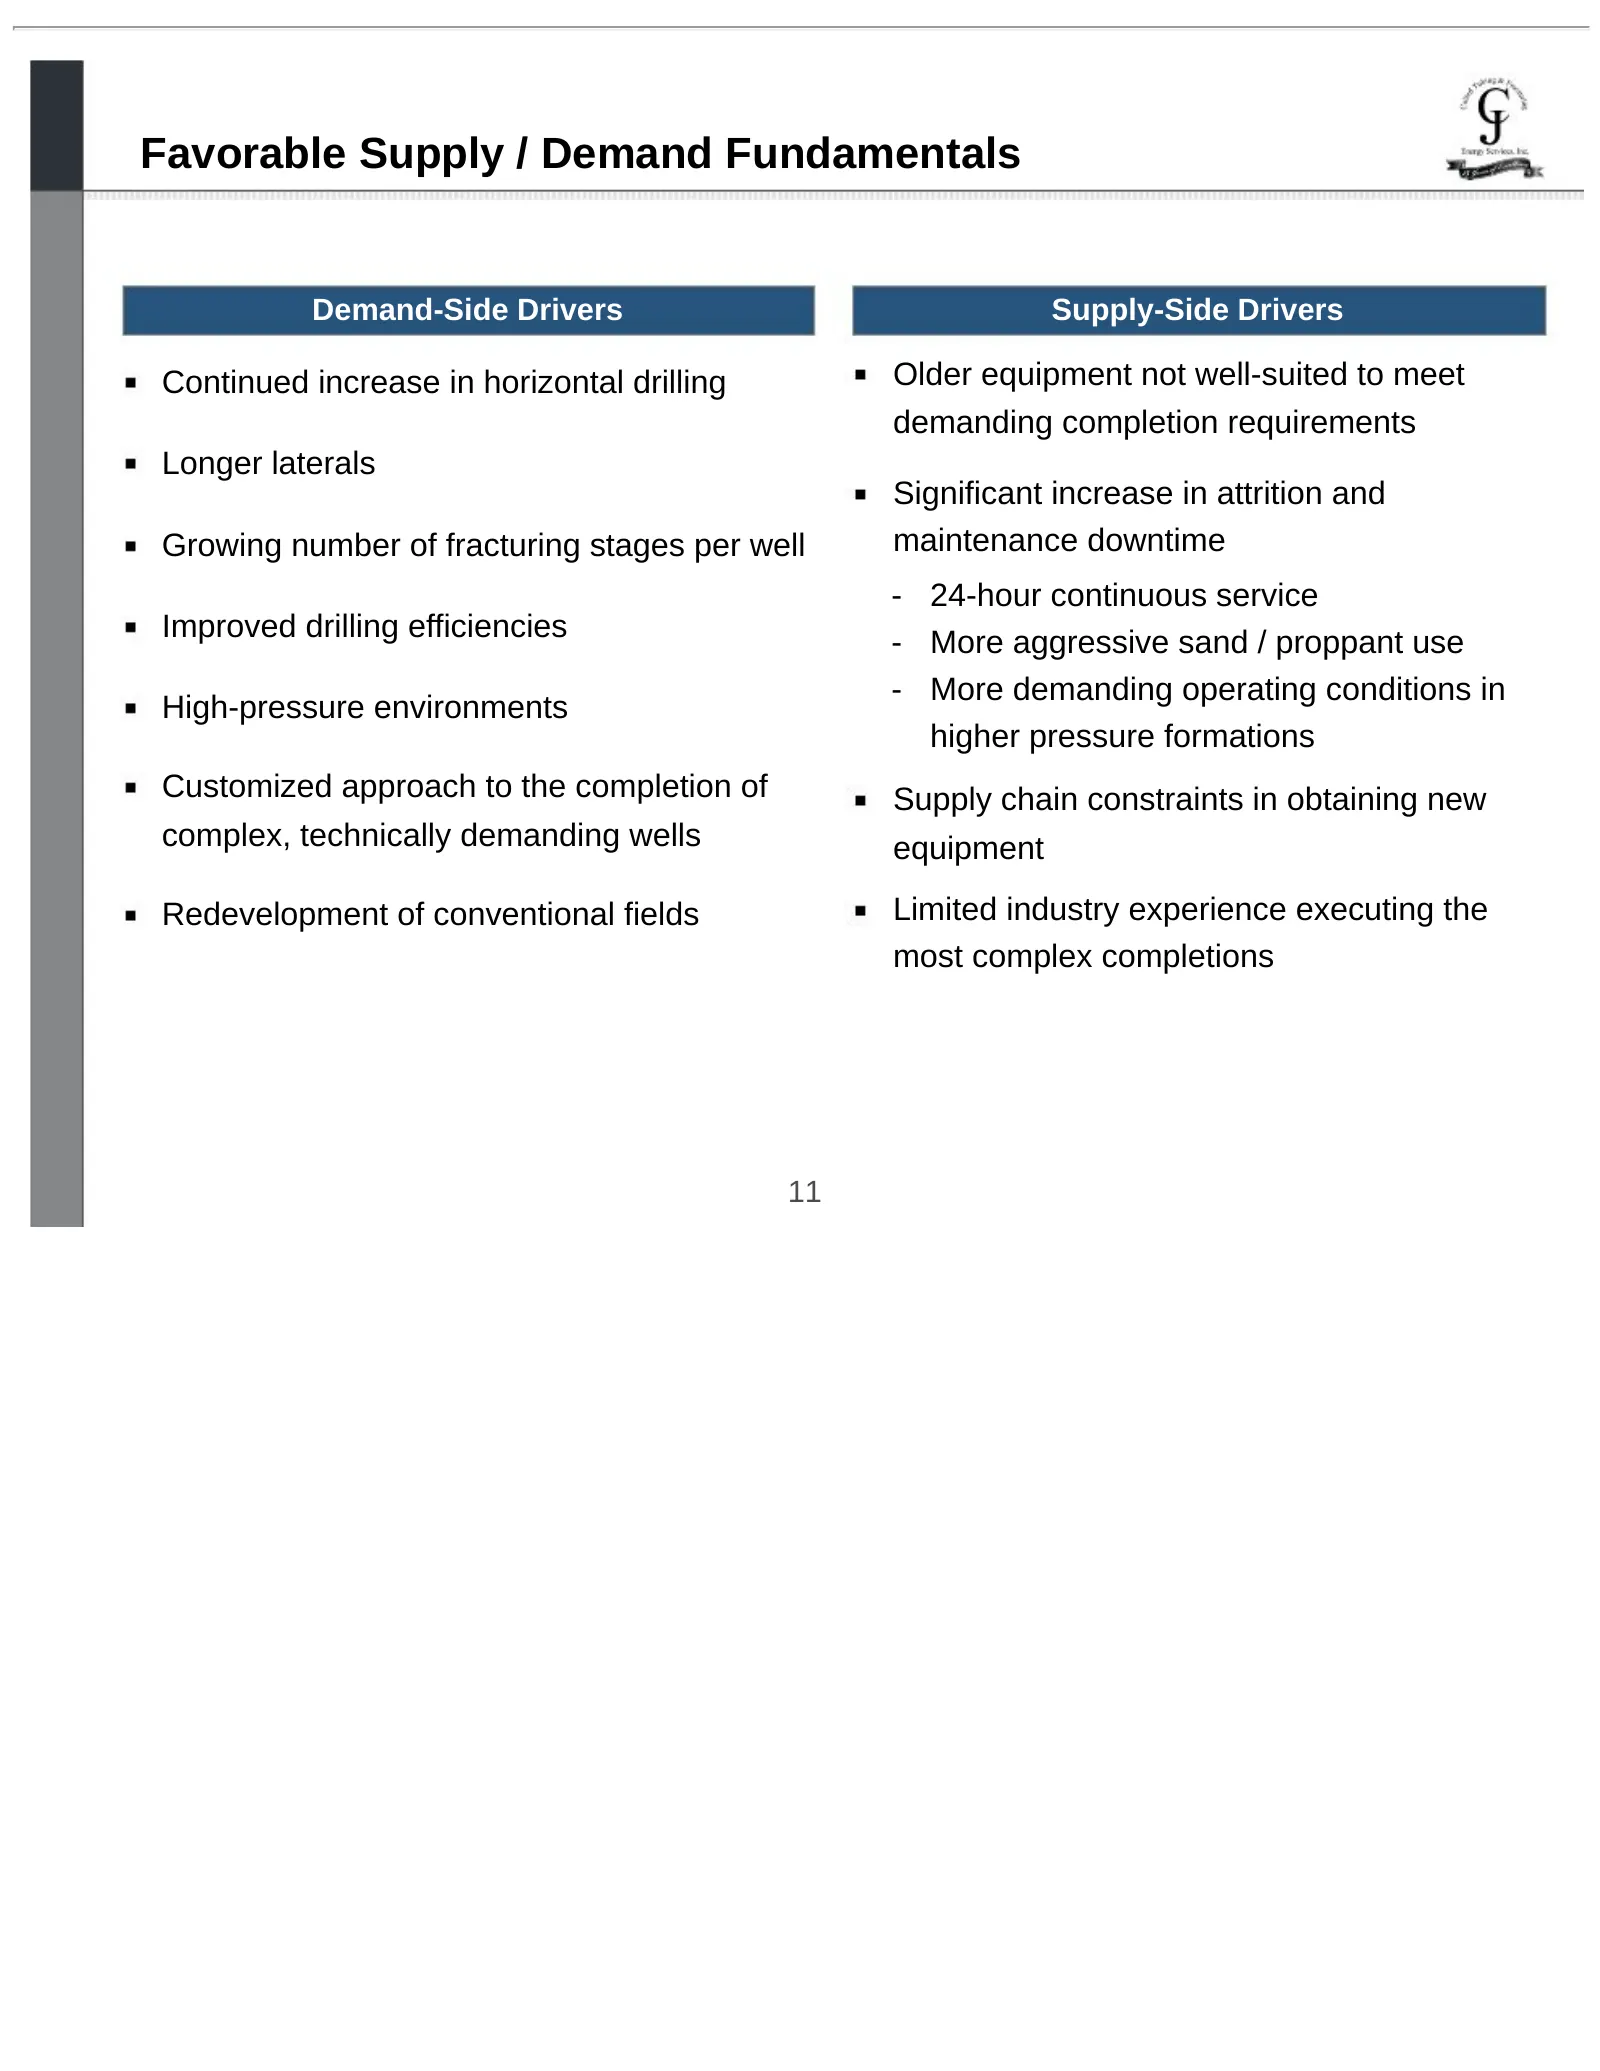
Favorable Supply / Demand Fundamentals Demand-Side Drivers Supply-Side Drivers Continued increase in horizontal drilling Older equipment not well-suited to meet demanding completion requirements Longer laterals Significant increase in attrition and Growing number of fracturing stages per well mainte
Slide 12: Business Overview
Business Overview qs ping & Zz %%, ge %, sé g Energy Services, Inc. ek
Slide 13: Overview of Service Offerings
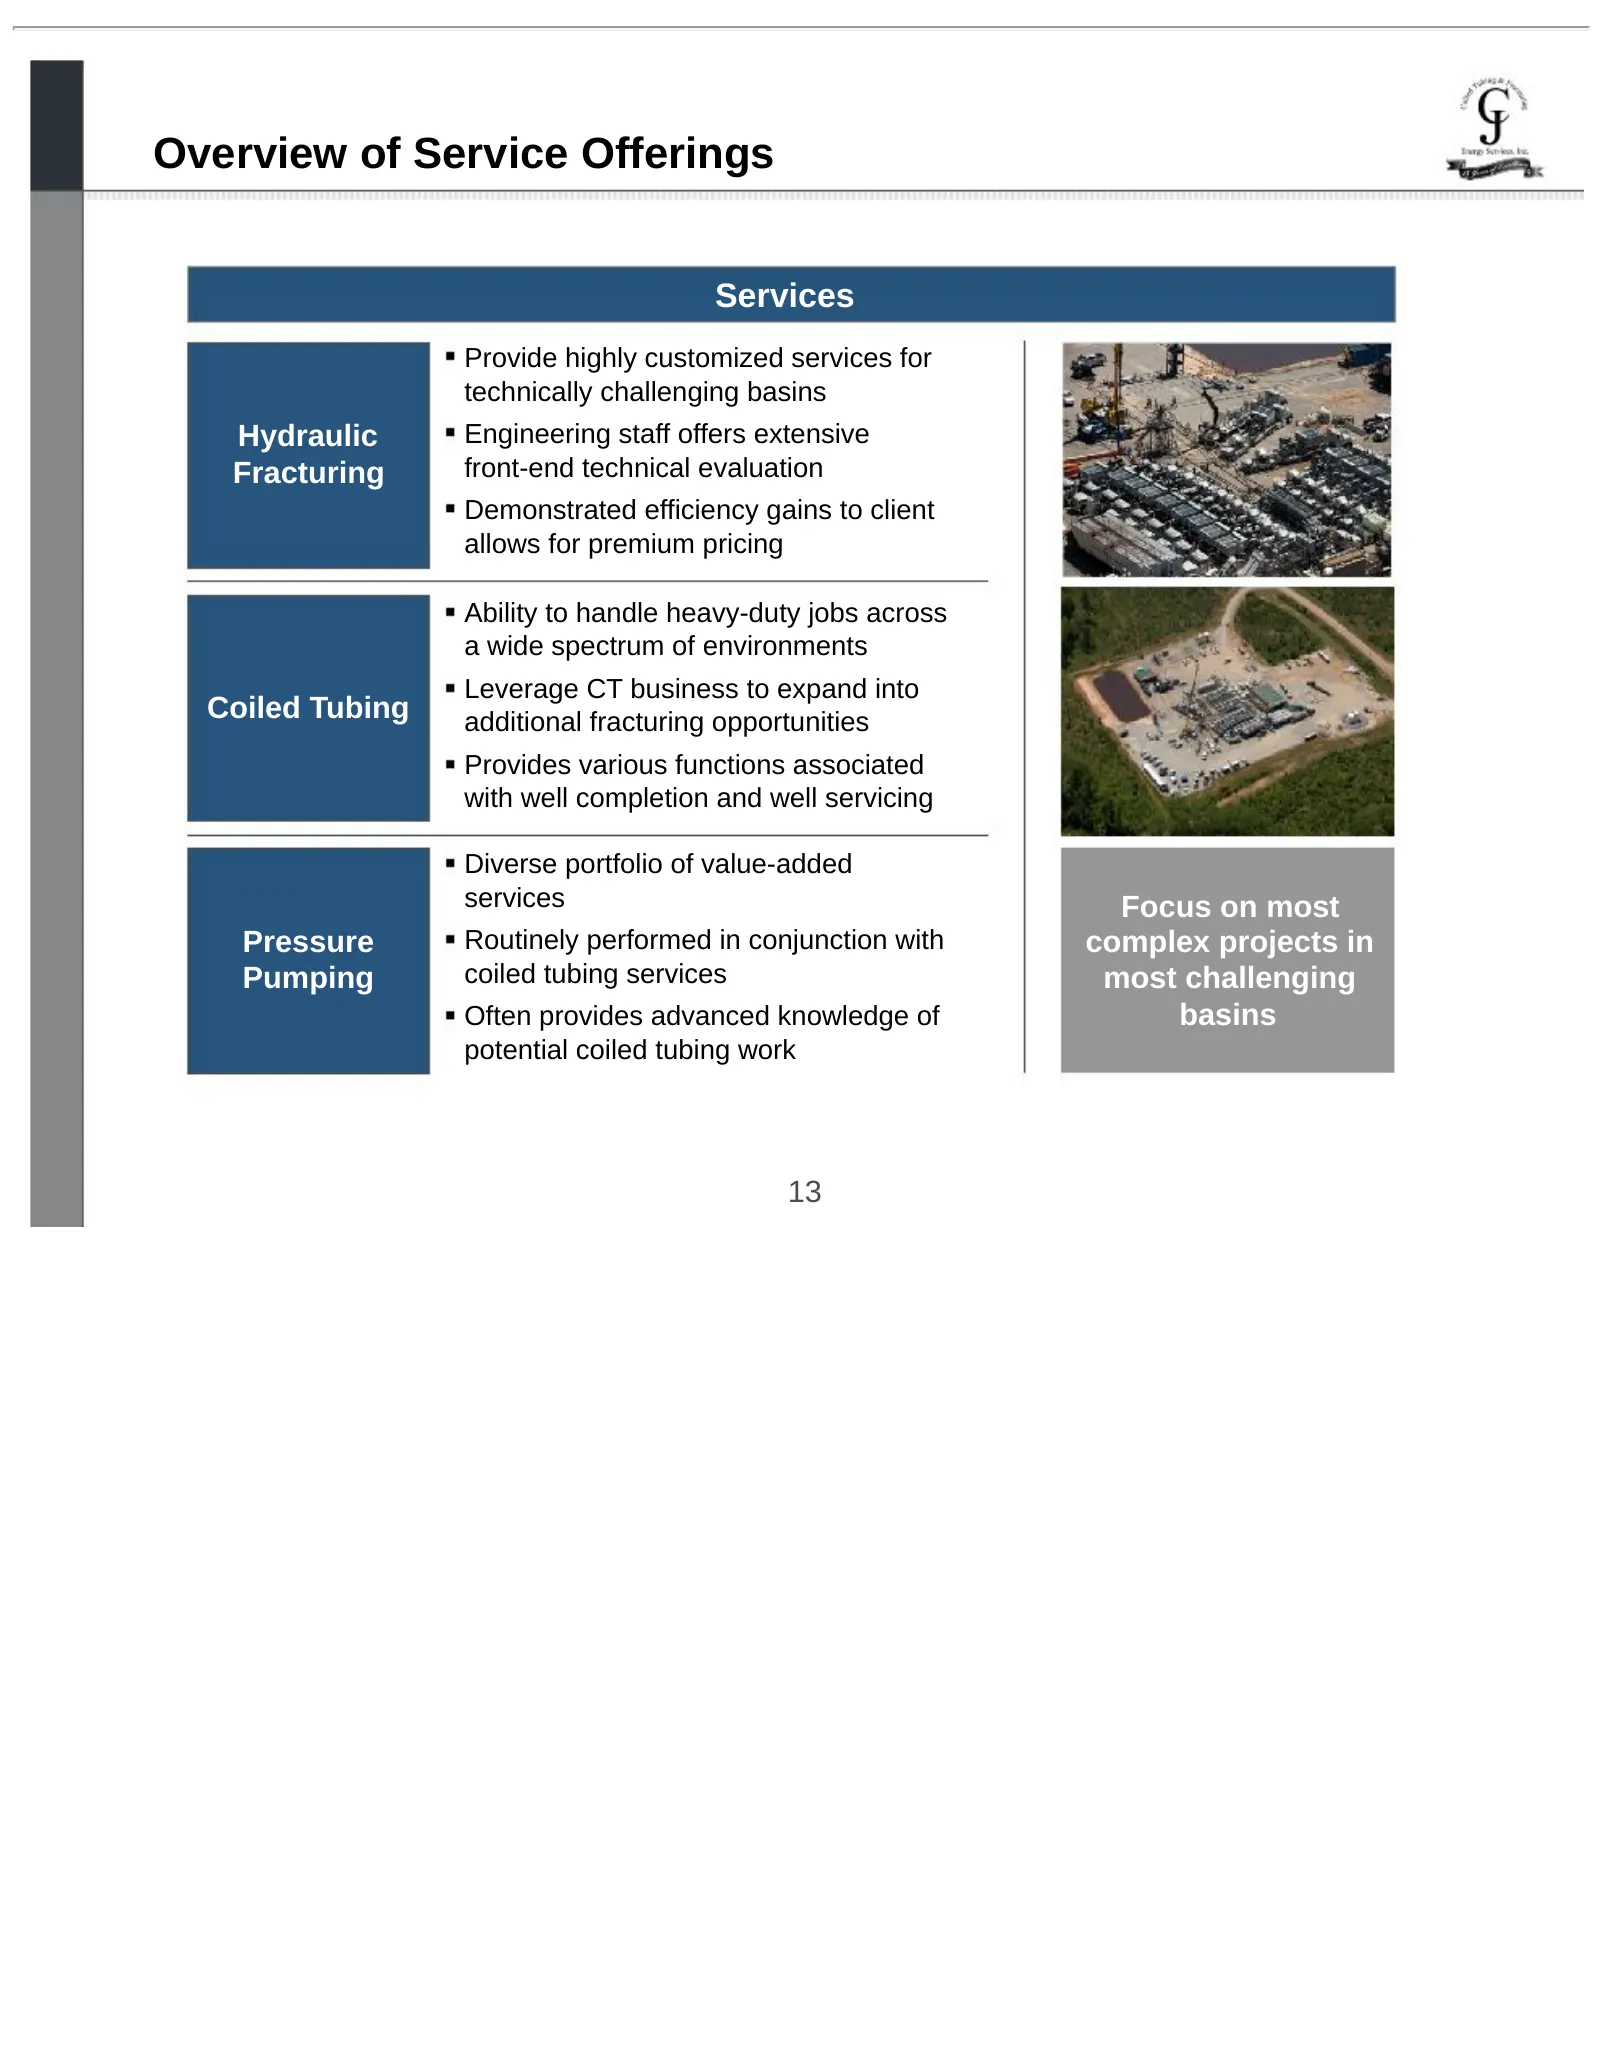
Overview of Service Offerings Services Provide highly customized services for technically challenging basins Hydraulic Engineering staff offers extensive Fracturing front-end technical evaluation Demonstrated efficiency gains to client allows for premium pricing Ability to handle heavy-duty jobs acr
Slide 14: Highly Experienced Management Team
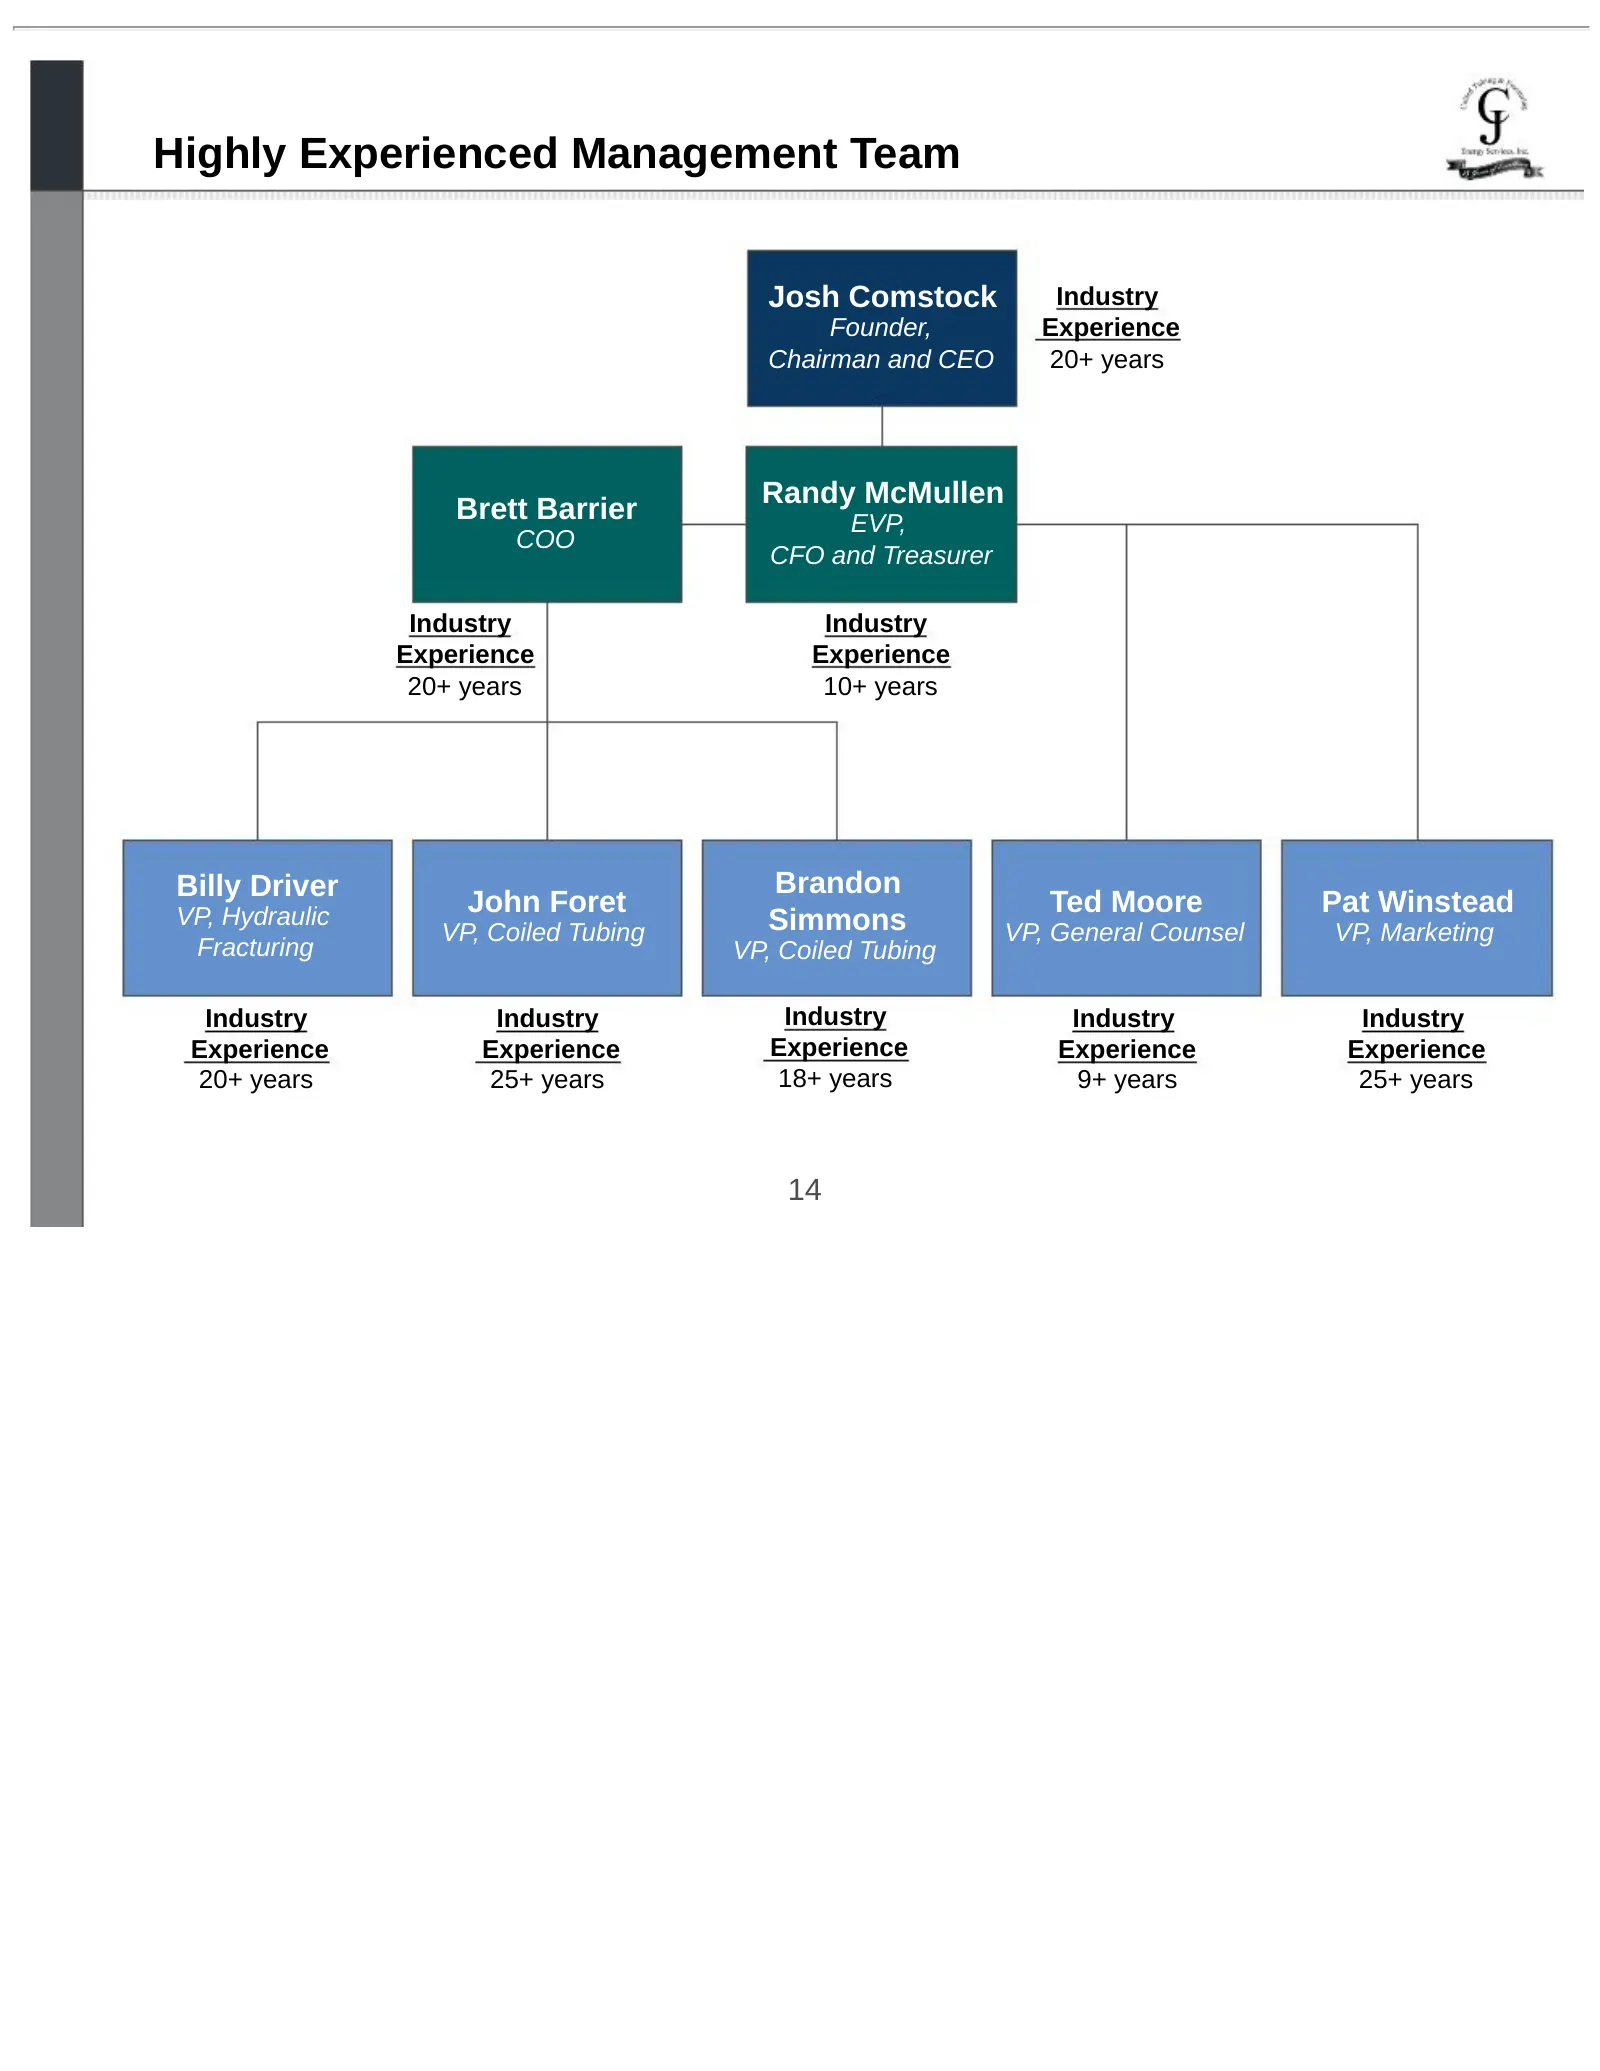
Highly Experienced Management Team Josh Comstock Industry Founder, Experience Chairman and CEO 20+ years Randy McMullen Brett Barrier EVP, COO CFO and Treasurer Industry Industry Experience Experience 20+ years 10+ years Billy Driver Brandon VP, Hydraulic John Foret Ted Moore Pat Winstead VP, Coiled
Slide 15: Modern, High-Specification Equipment
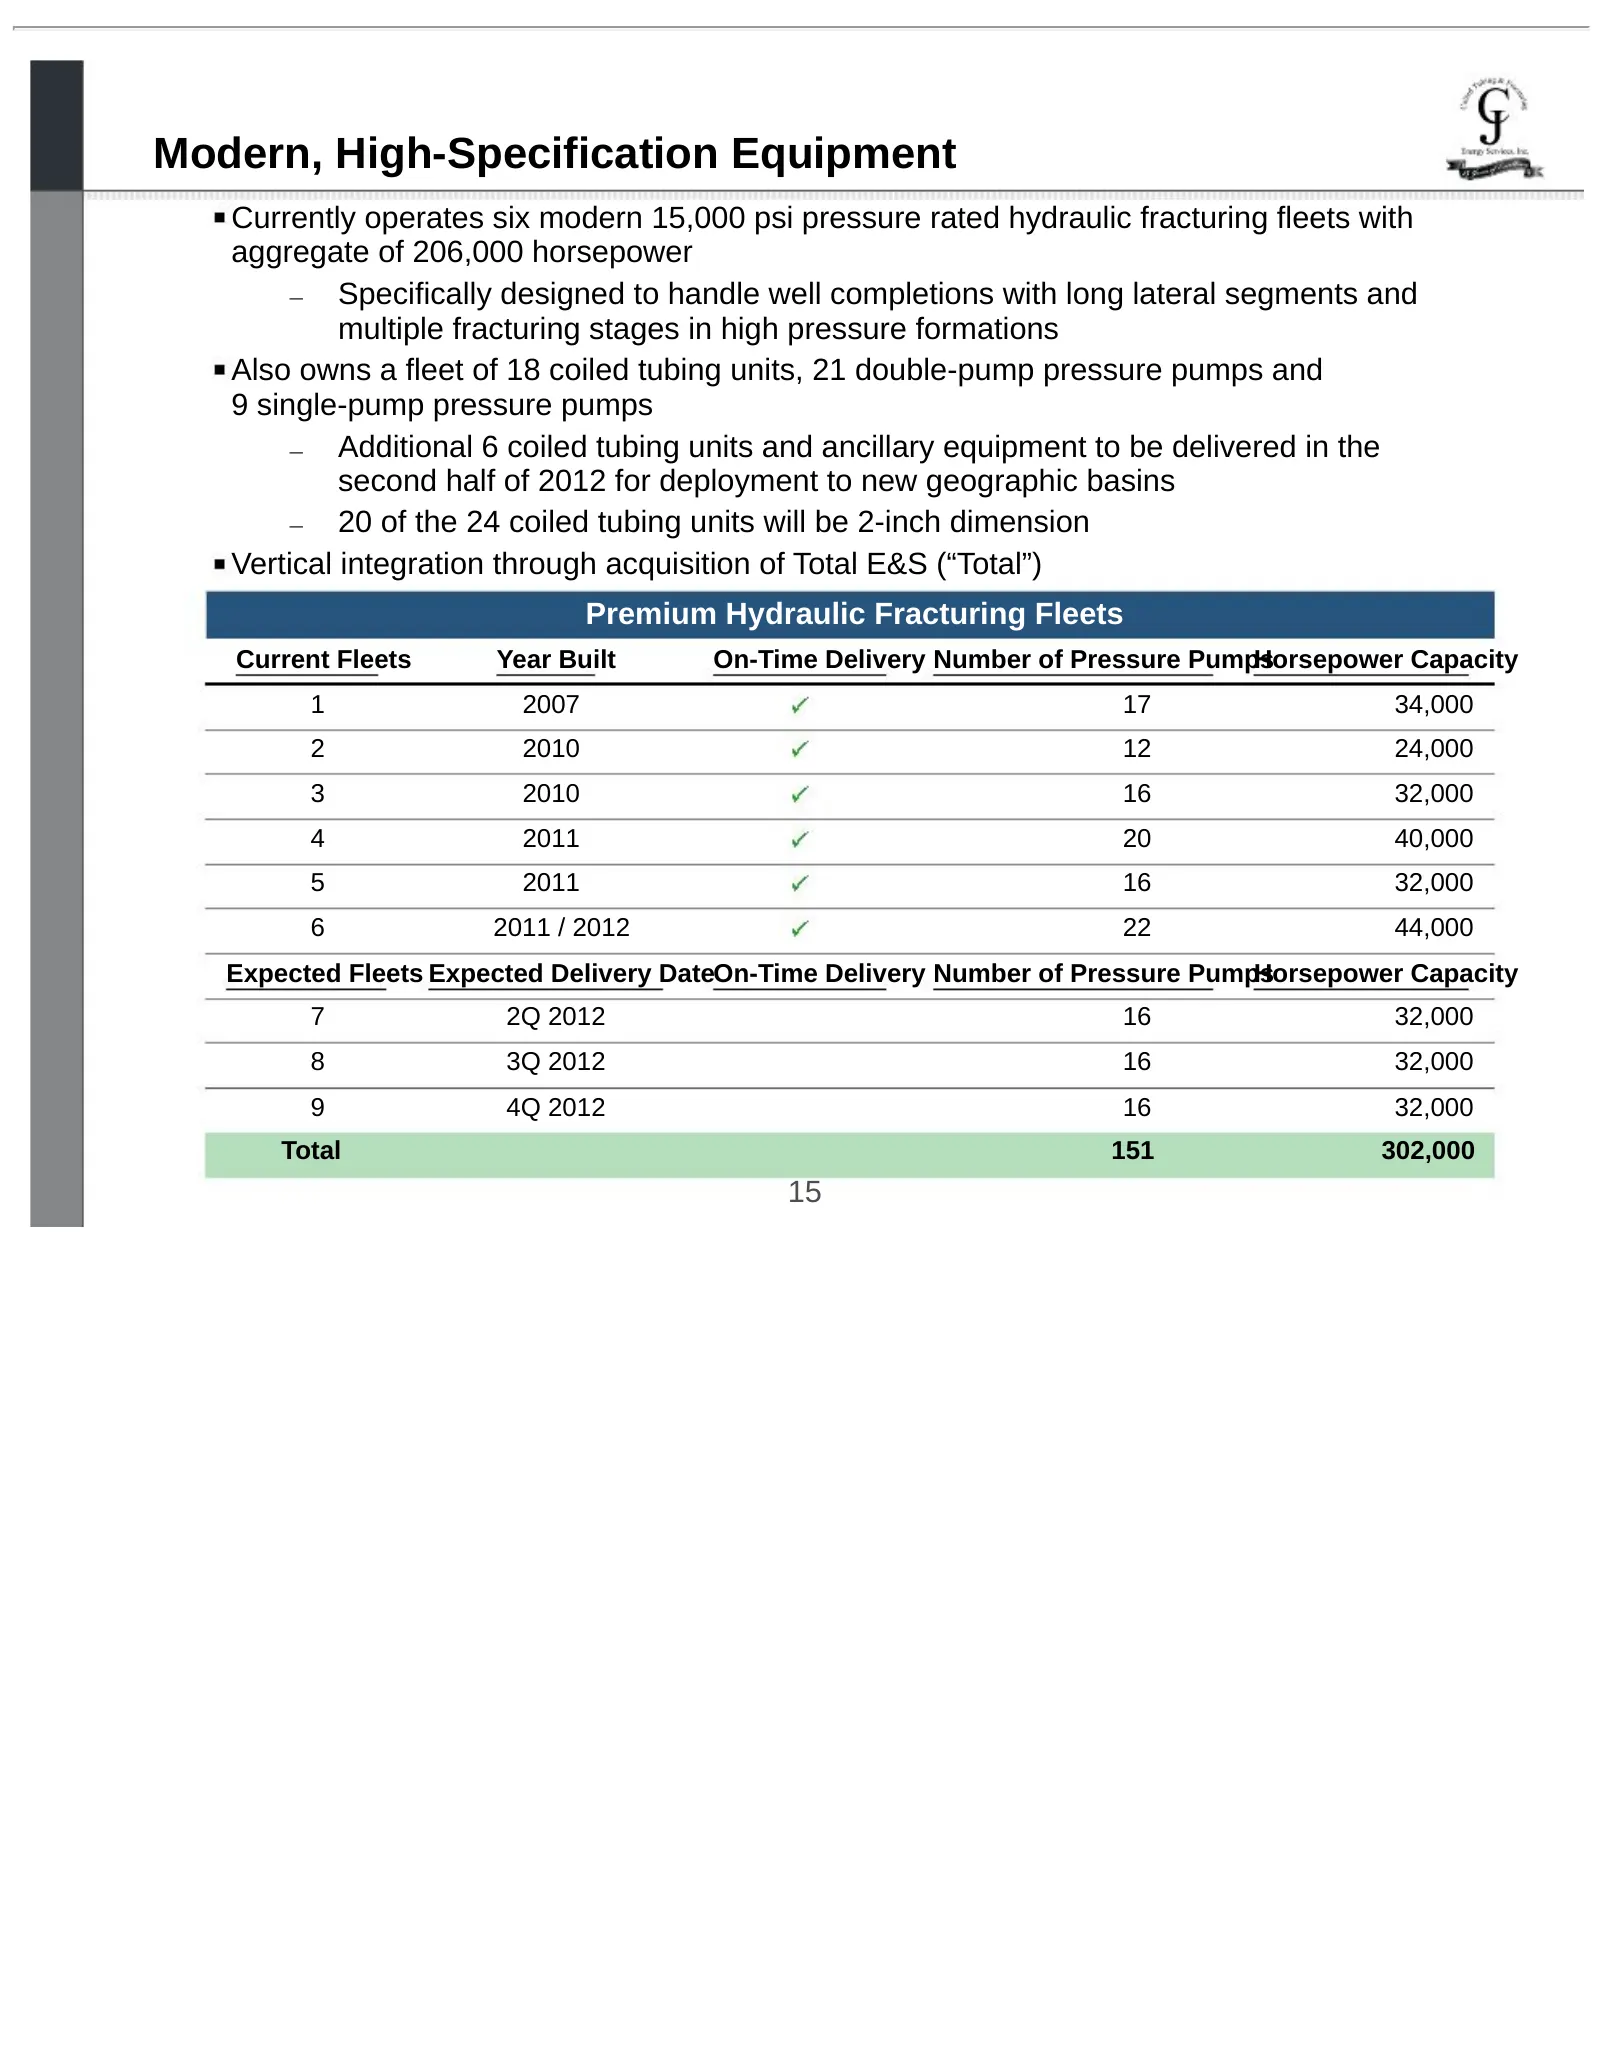
Modern, High-Specification Equipment Currently operates six modern 15,000 psi pressure rated hydraulic fracturing fleets with aggregate of 206,000 horsepower – Specifically designed to handle well completions with long lateral segments and multiple fracturing stages in high pressure formations Also
Slide 16: Geographically Focused in Attractive Basins
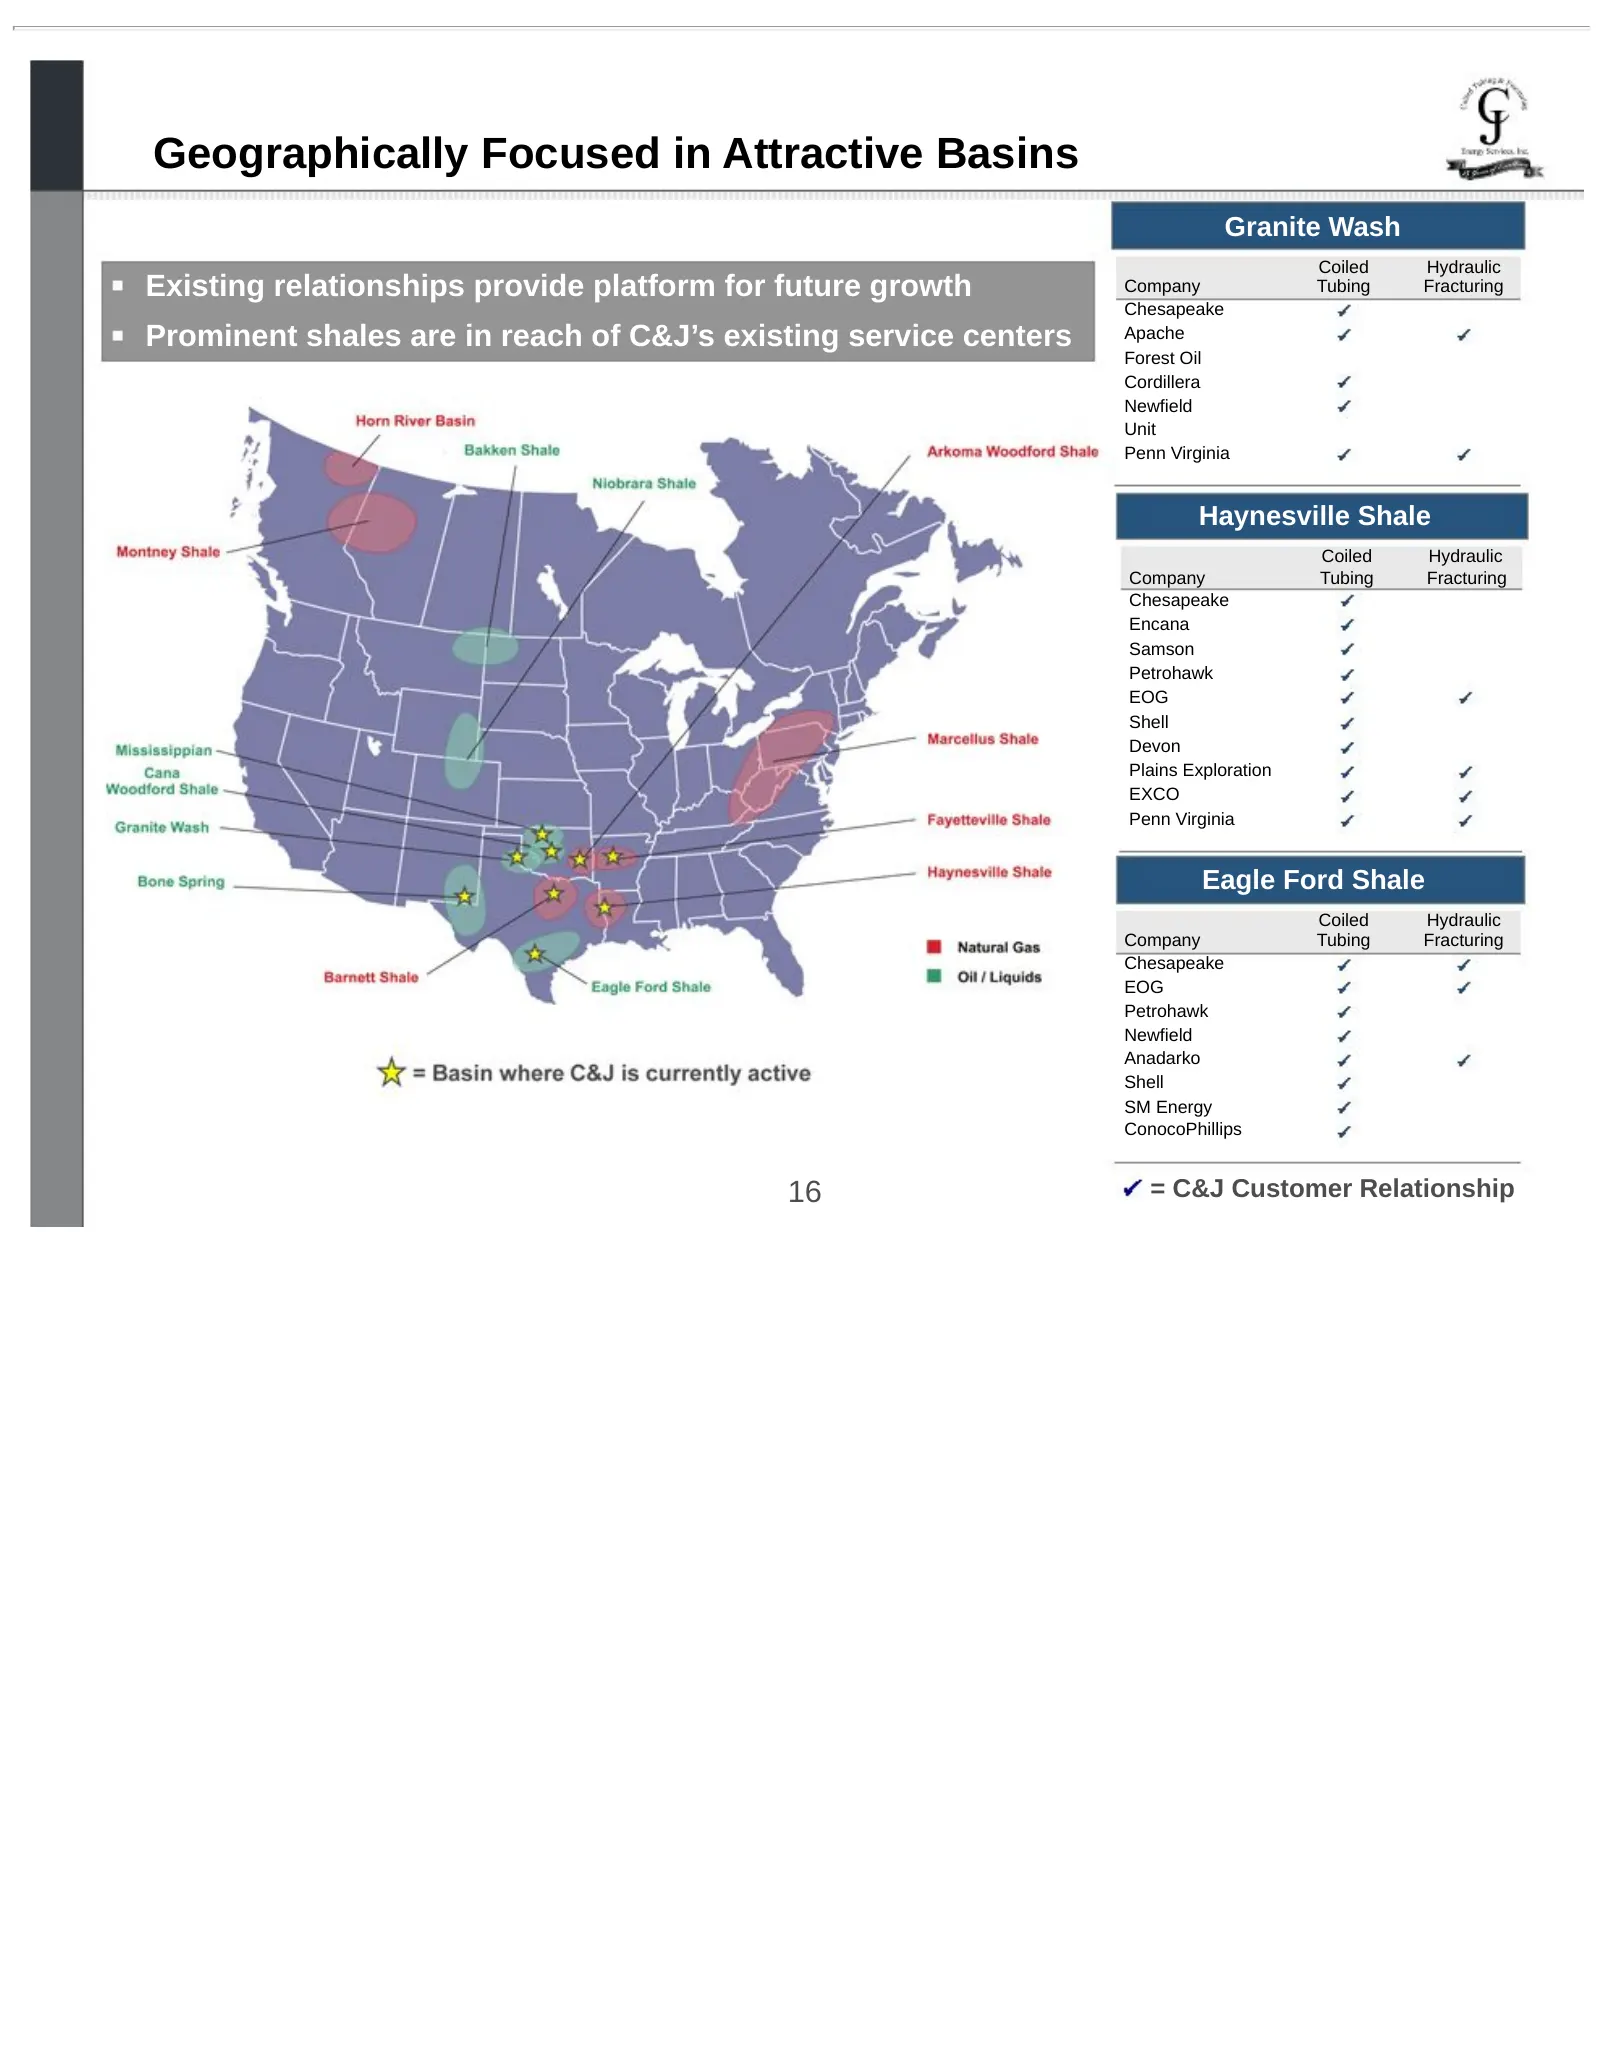
Geographically Focused in Attractive Basins Granite Wash Coiled Hydraulic Existing relationships provide platform for future growth Company Tubing Fracturing Chesapeake Prominent shales are in reach of C&J’s existing service centers Apache Forest Oil Cordillera Newfield Unit Penn Virginia Haynesvill
Slide 17: We Offer an Attractive Value Proposition to Our Customers
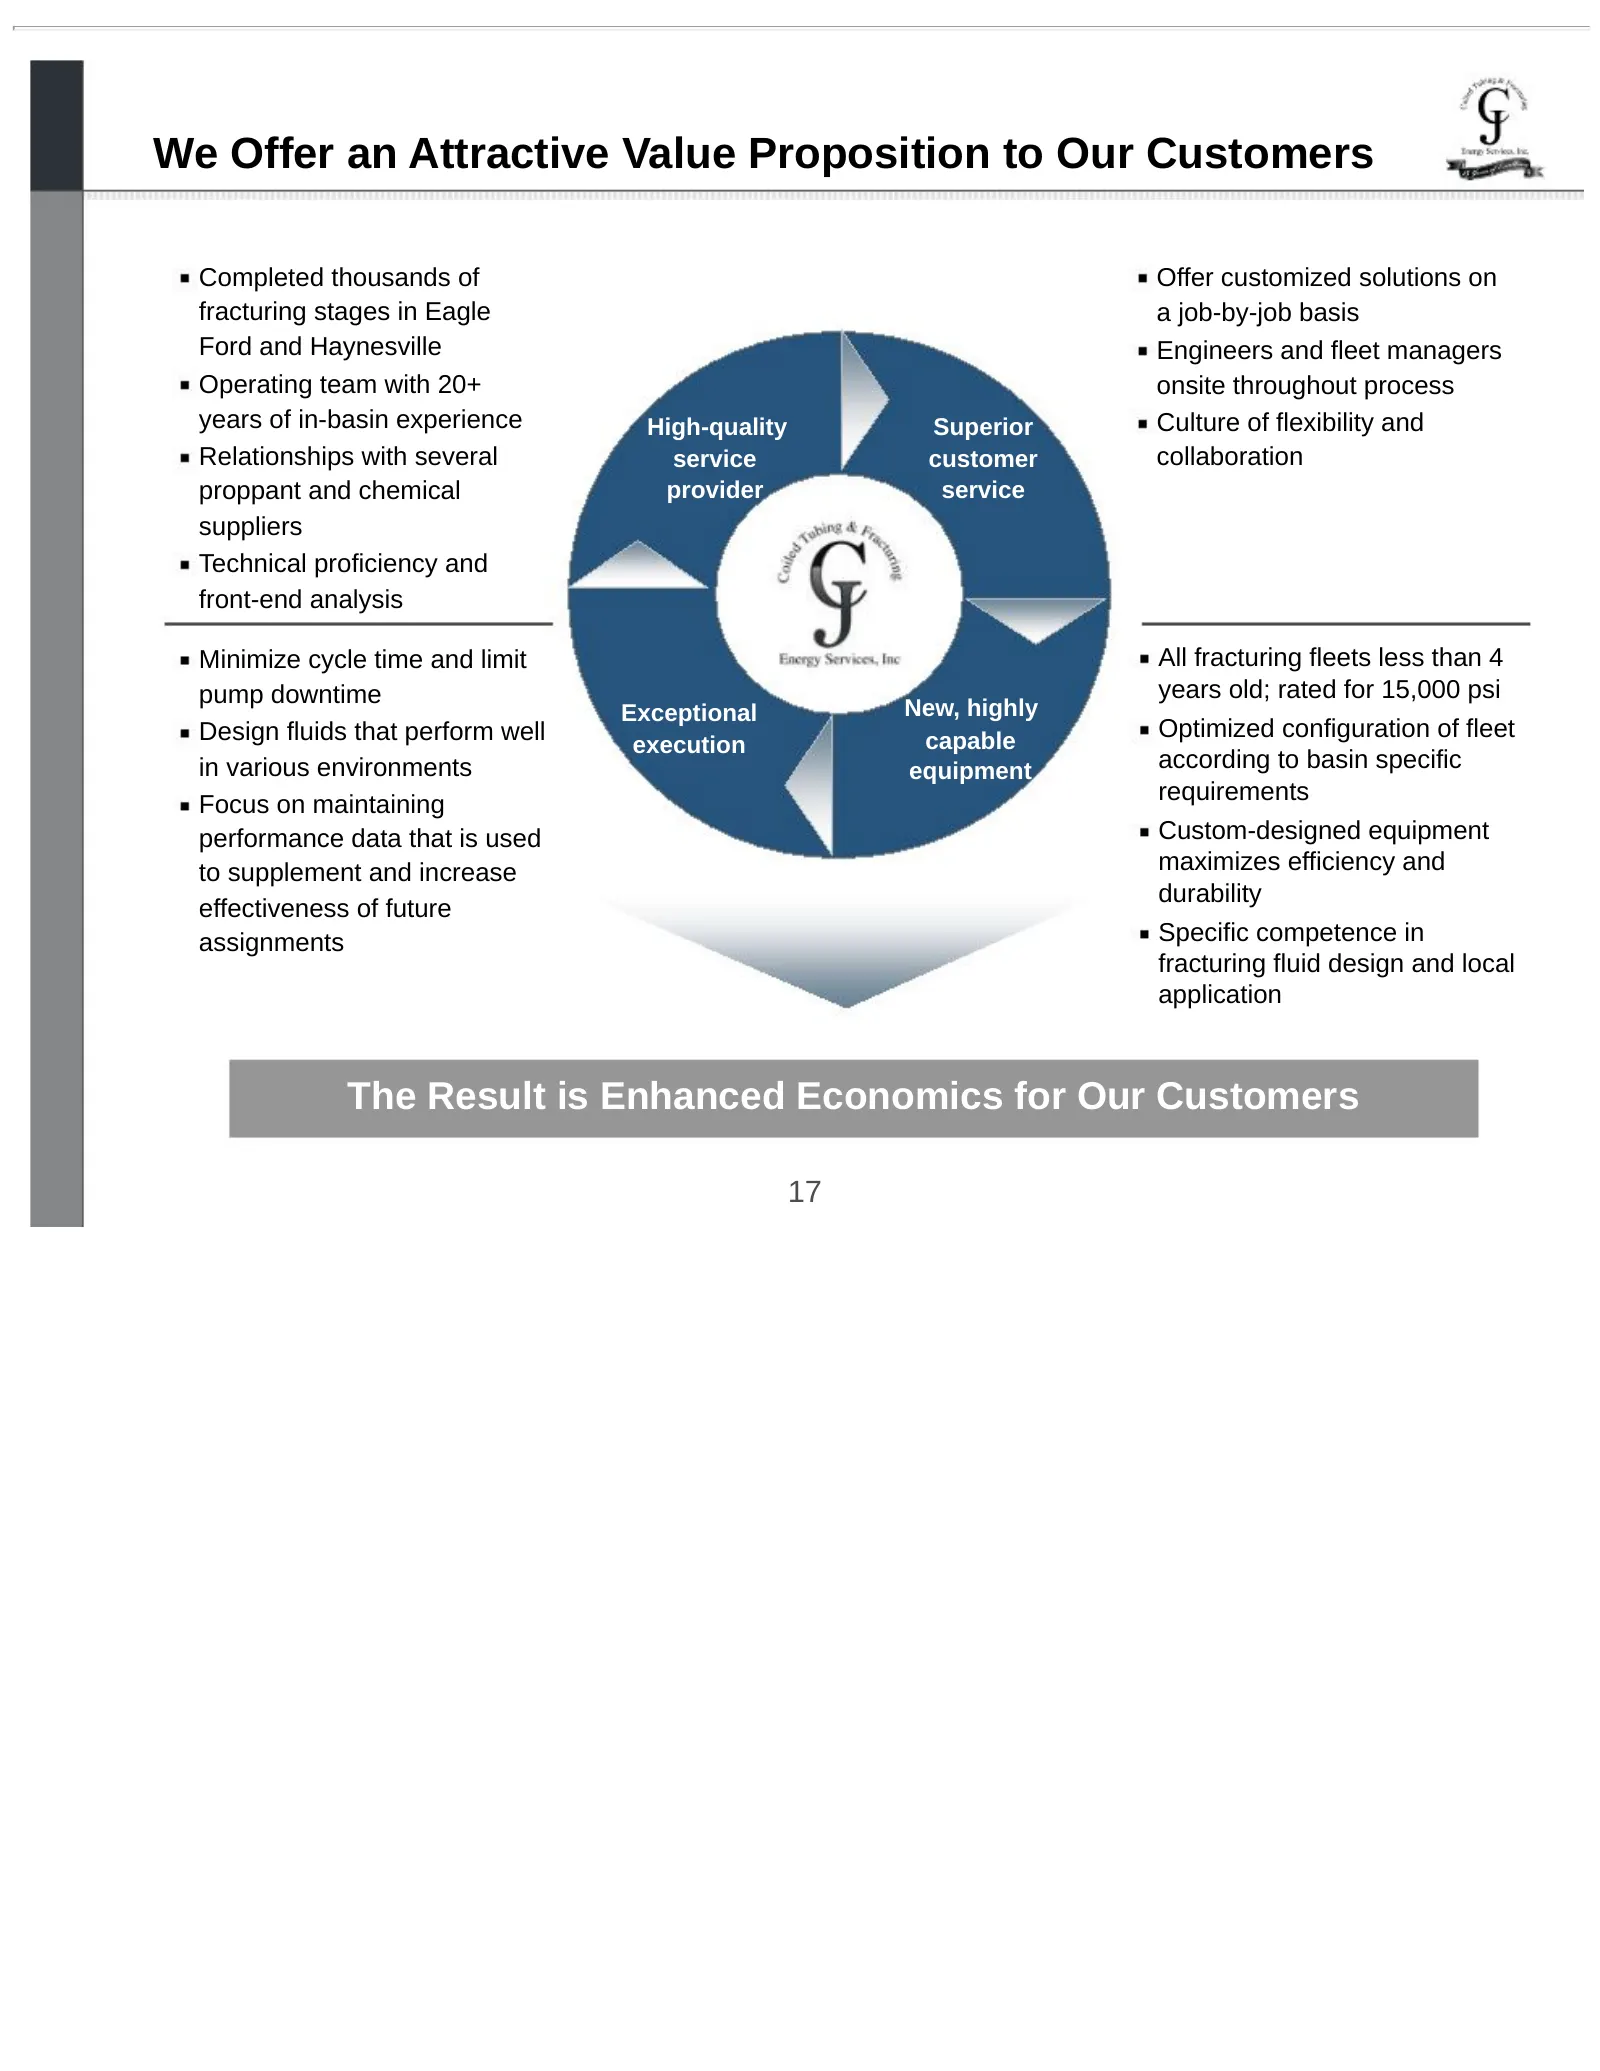
We Offer an Attractive Value Proposition to Our Customers Completed thousands of Offer customized solutions on fracturing stages in Eagle a job-by-job basis Ford and Haynesville Engineers and fleet managers Operating team with 20+ onsite throughout process years of in-basin experience High-quality S
Slide 18: Relationships with Industry Leaders
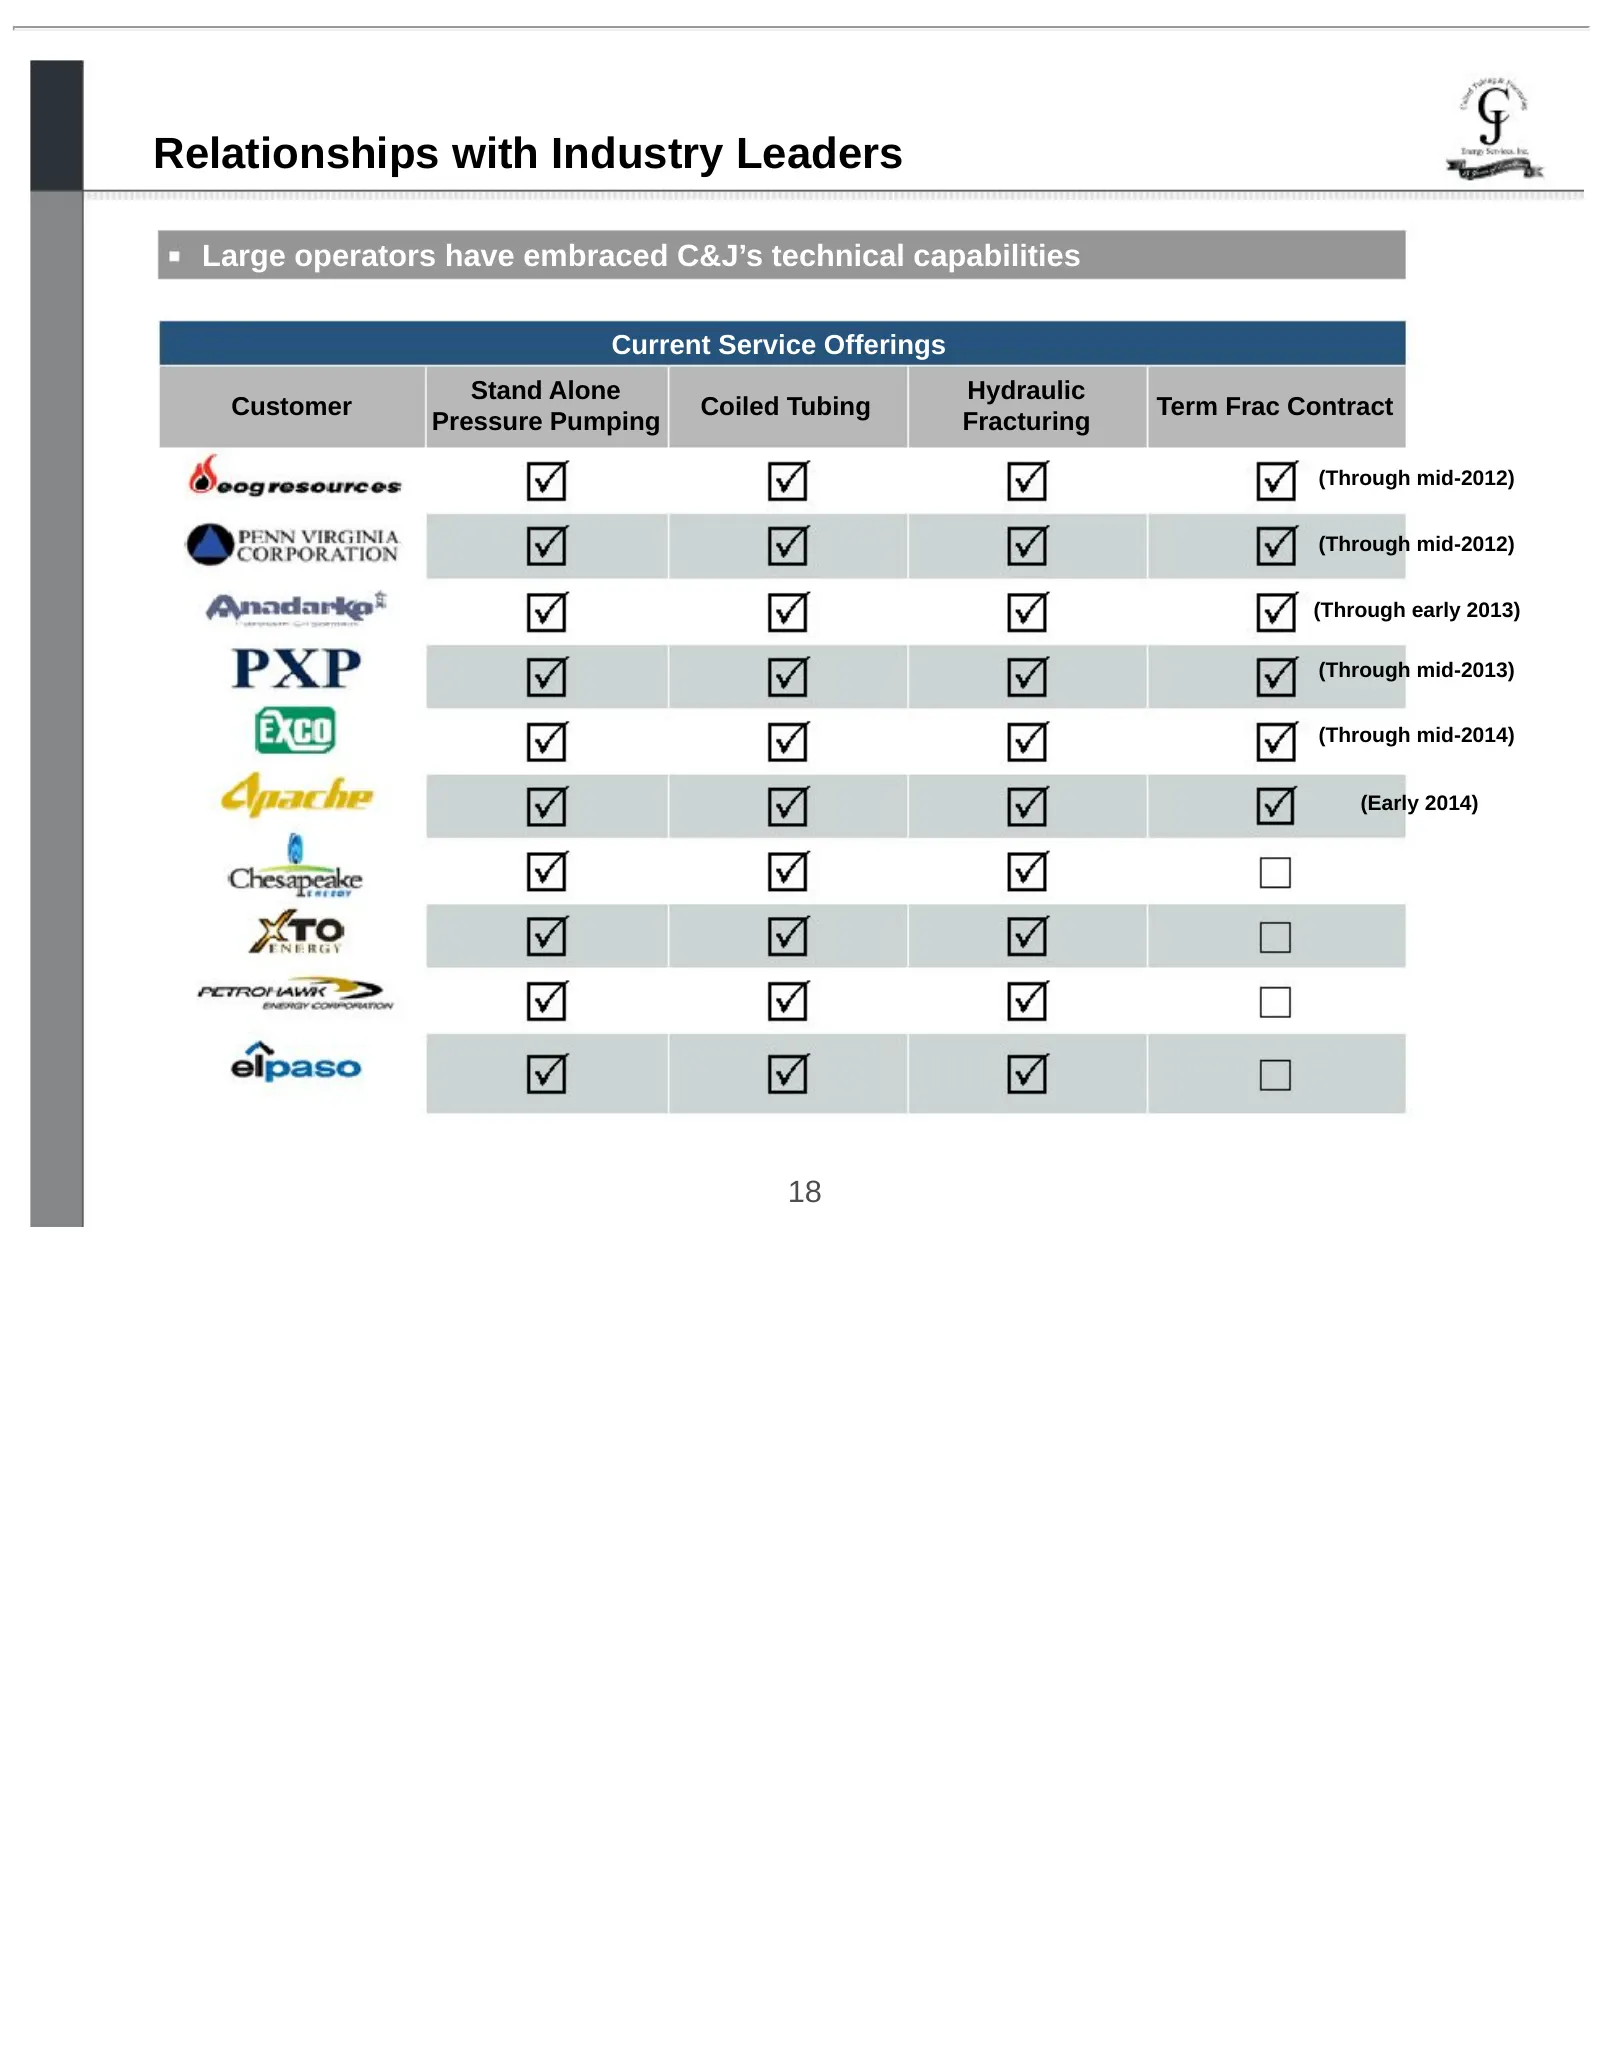
Relationships with Industry Leaders Large operators have embraced C&J’s technical capabilities Current Service Offerings Stand Alone Hydraulic Customer Coiled Tubing Term Frac Contract Pressure Pumping Fracturing (Through mid-2012) (Through mid-2012) (Through early 2013) (Through mid-2013) (Through
Slide 19: Outperformance Through Efficiency
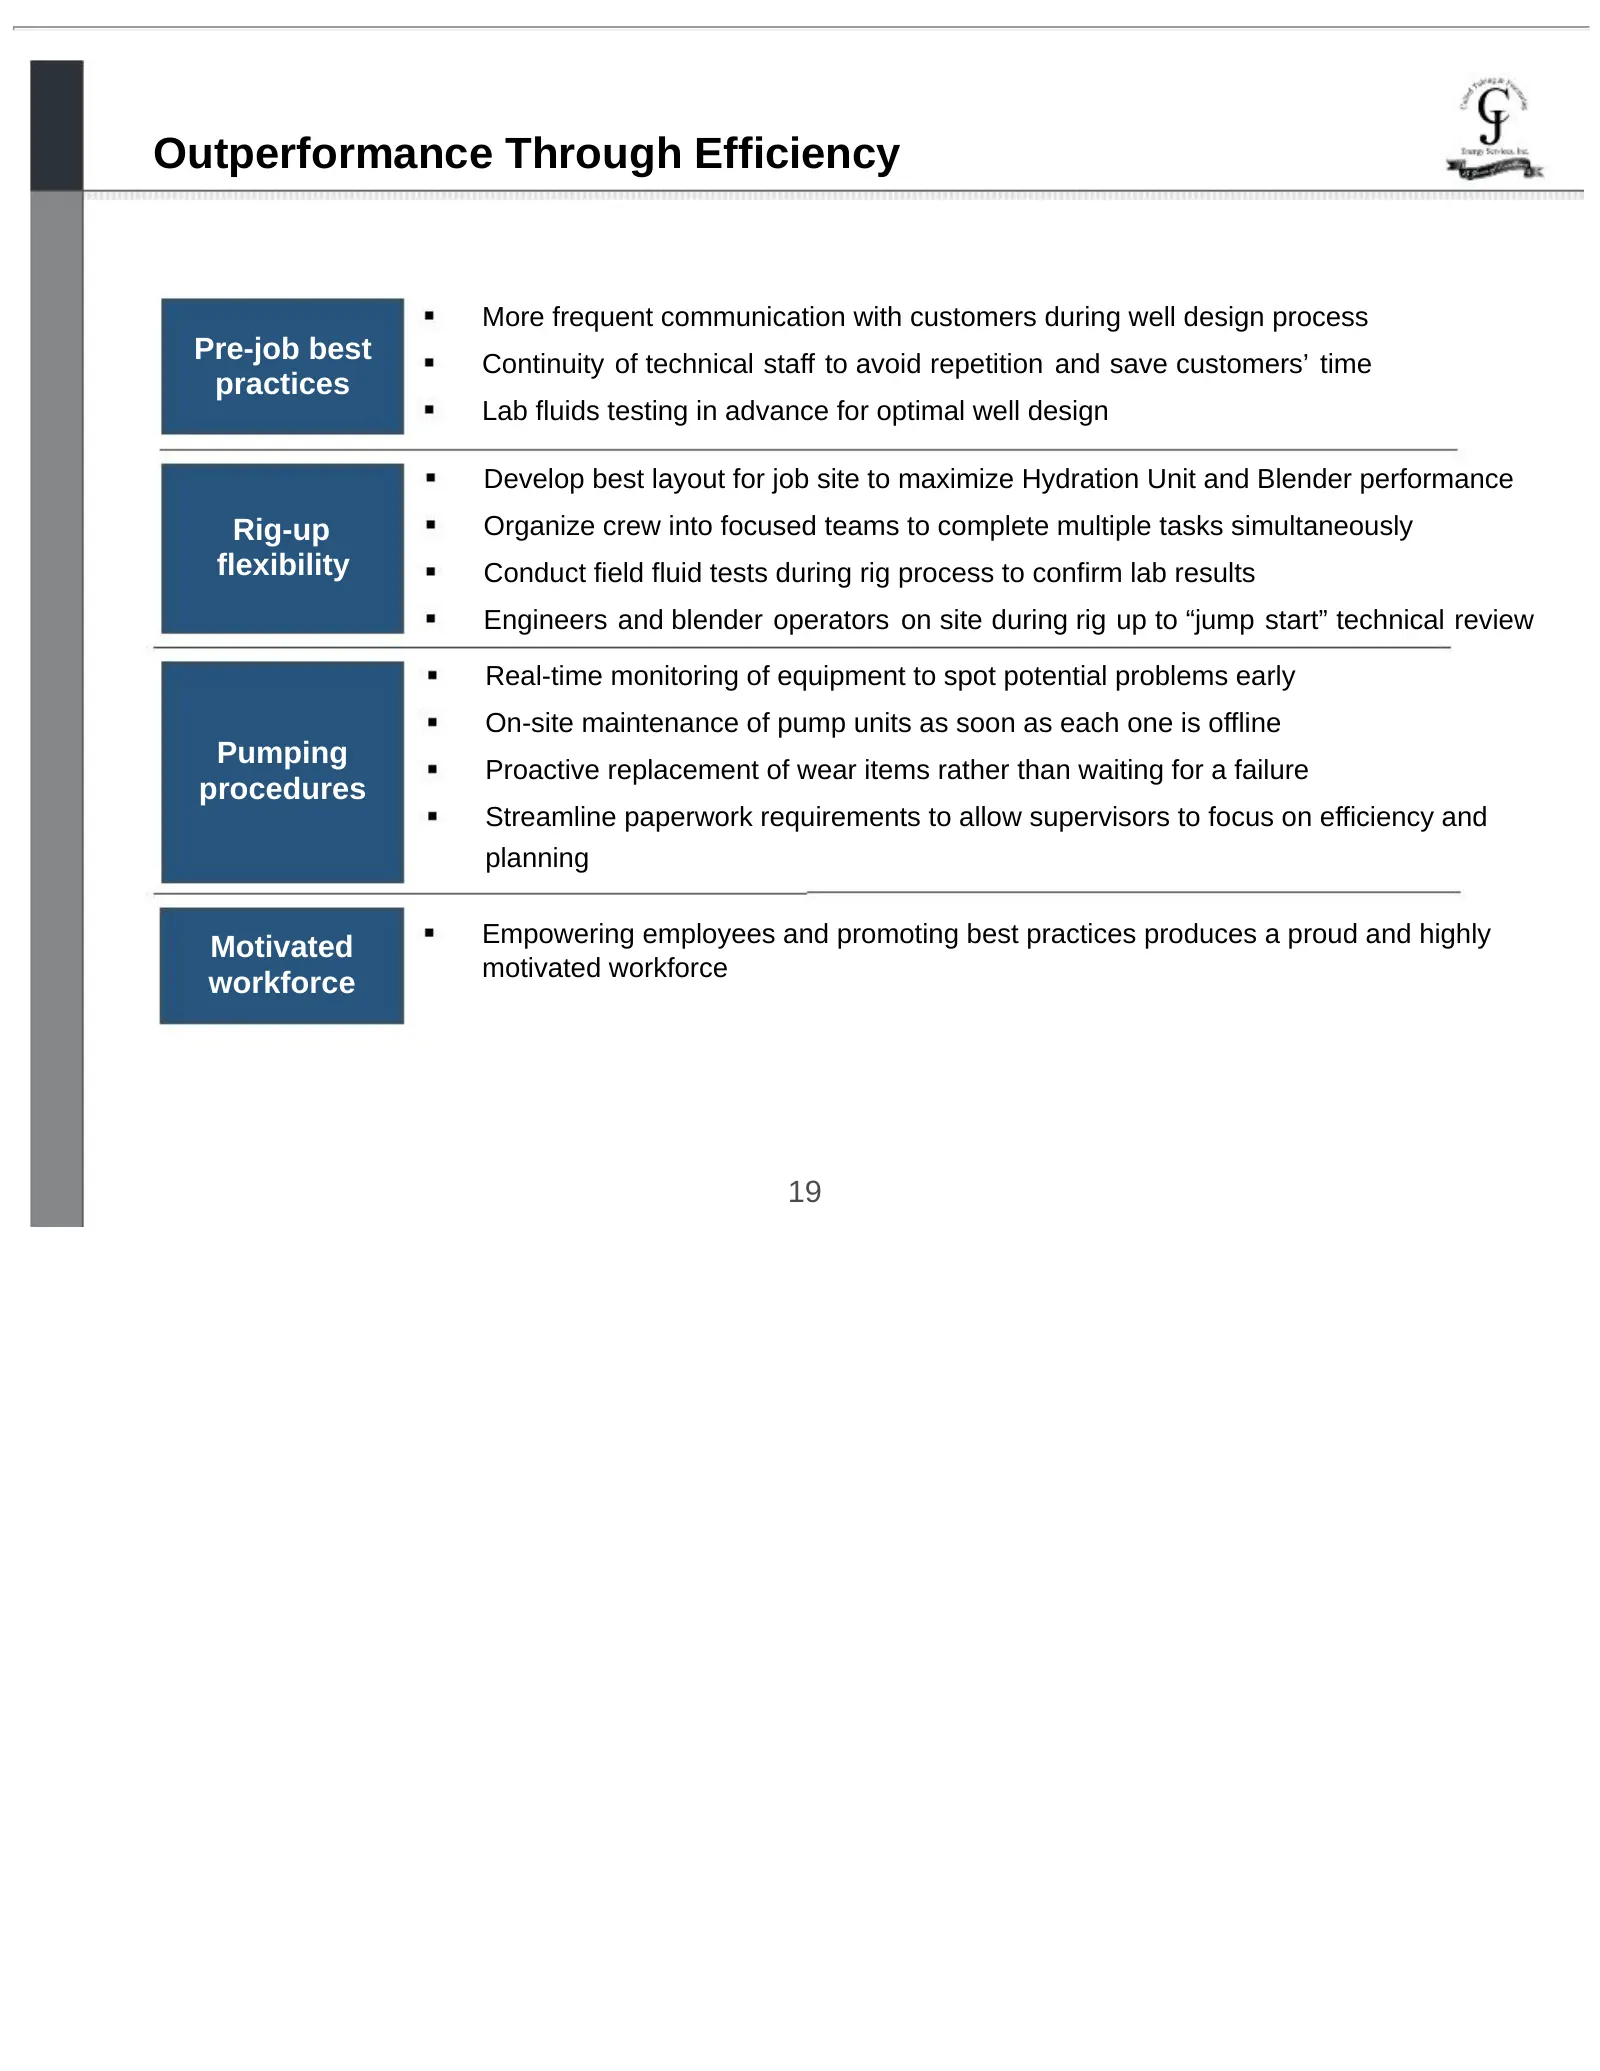
Outperformance Through Efficiency More frequent communication with customers during well design process Pre-job best Continuity of technical staff to avoid repetition and save customers’ time practices Lab fluids testing in advance for optimal well design Develop best layout for job site to maximize
Slide 20: Strategy for Continued Growth
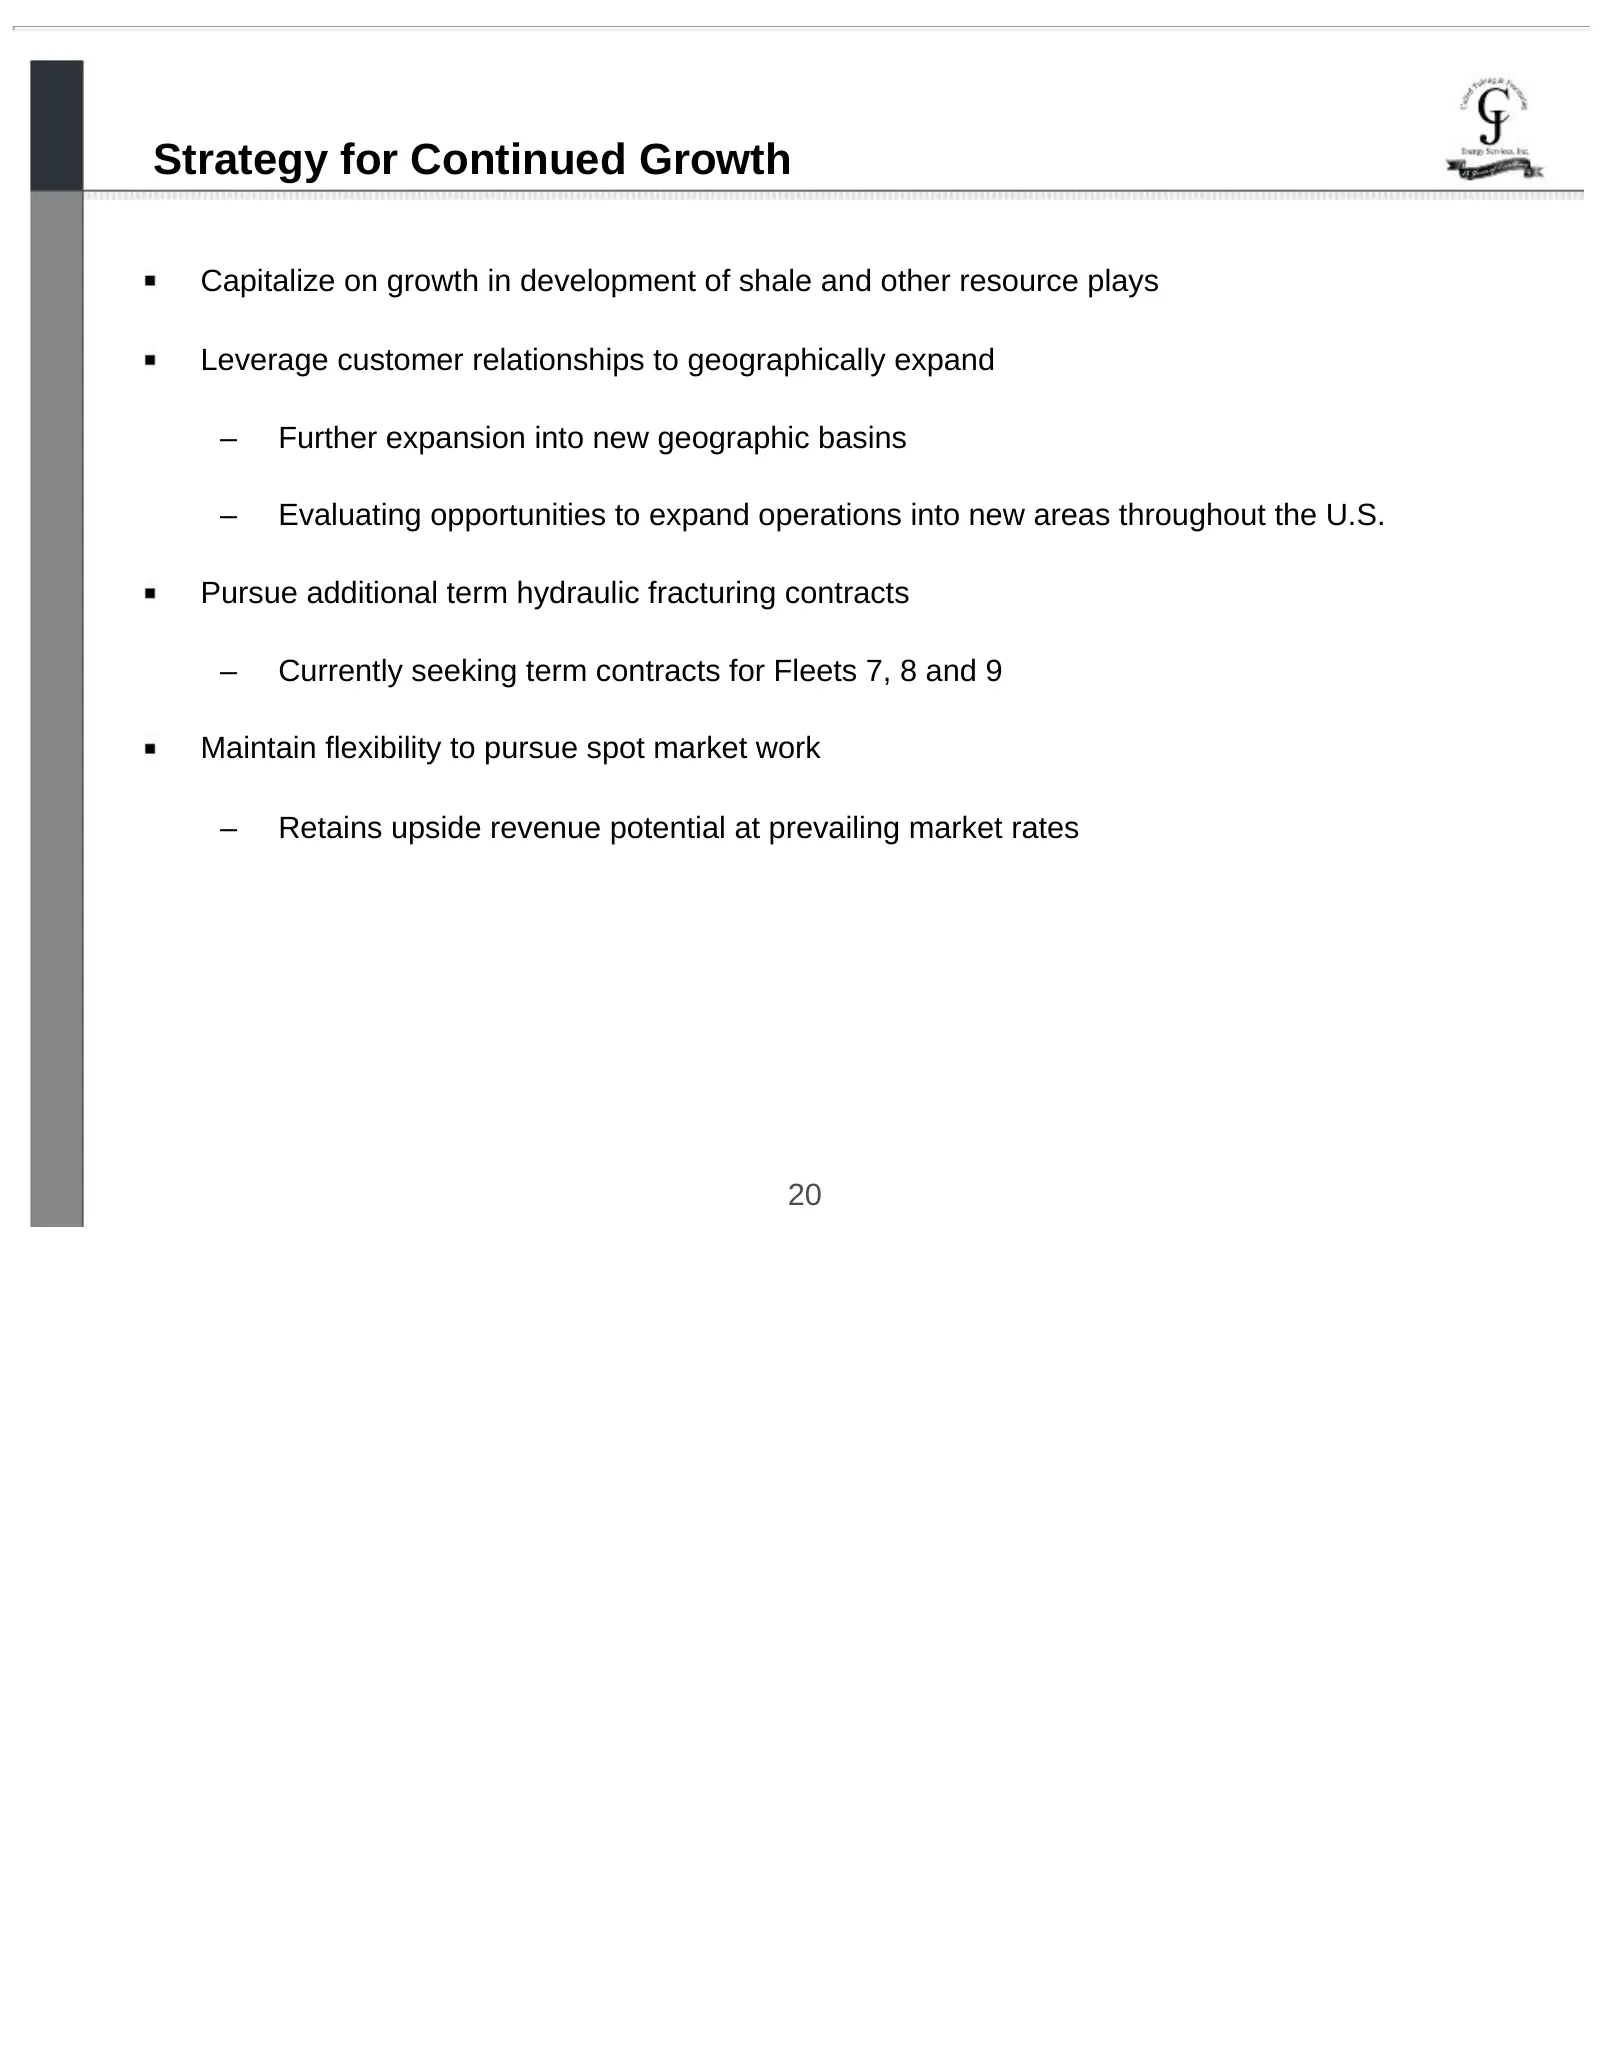
Strategy for Continued Growth Capitalize on growth in development of shale and other resource plays Leverage customer relationships to geographically expand – Further expansion into new geographic basins – Evaluating opportunities to expand operations into new areas throughout the U.S. Pursue additi
Slide 21: Financials
Financials qs & Pn, Rs iy 5 (a) %,. 3 ae Energy Services, Inc. ek
Slide 22: Key Drivers of Financial Performance
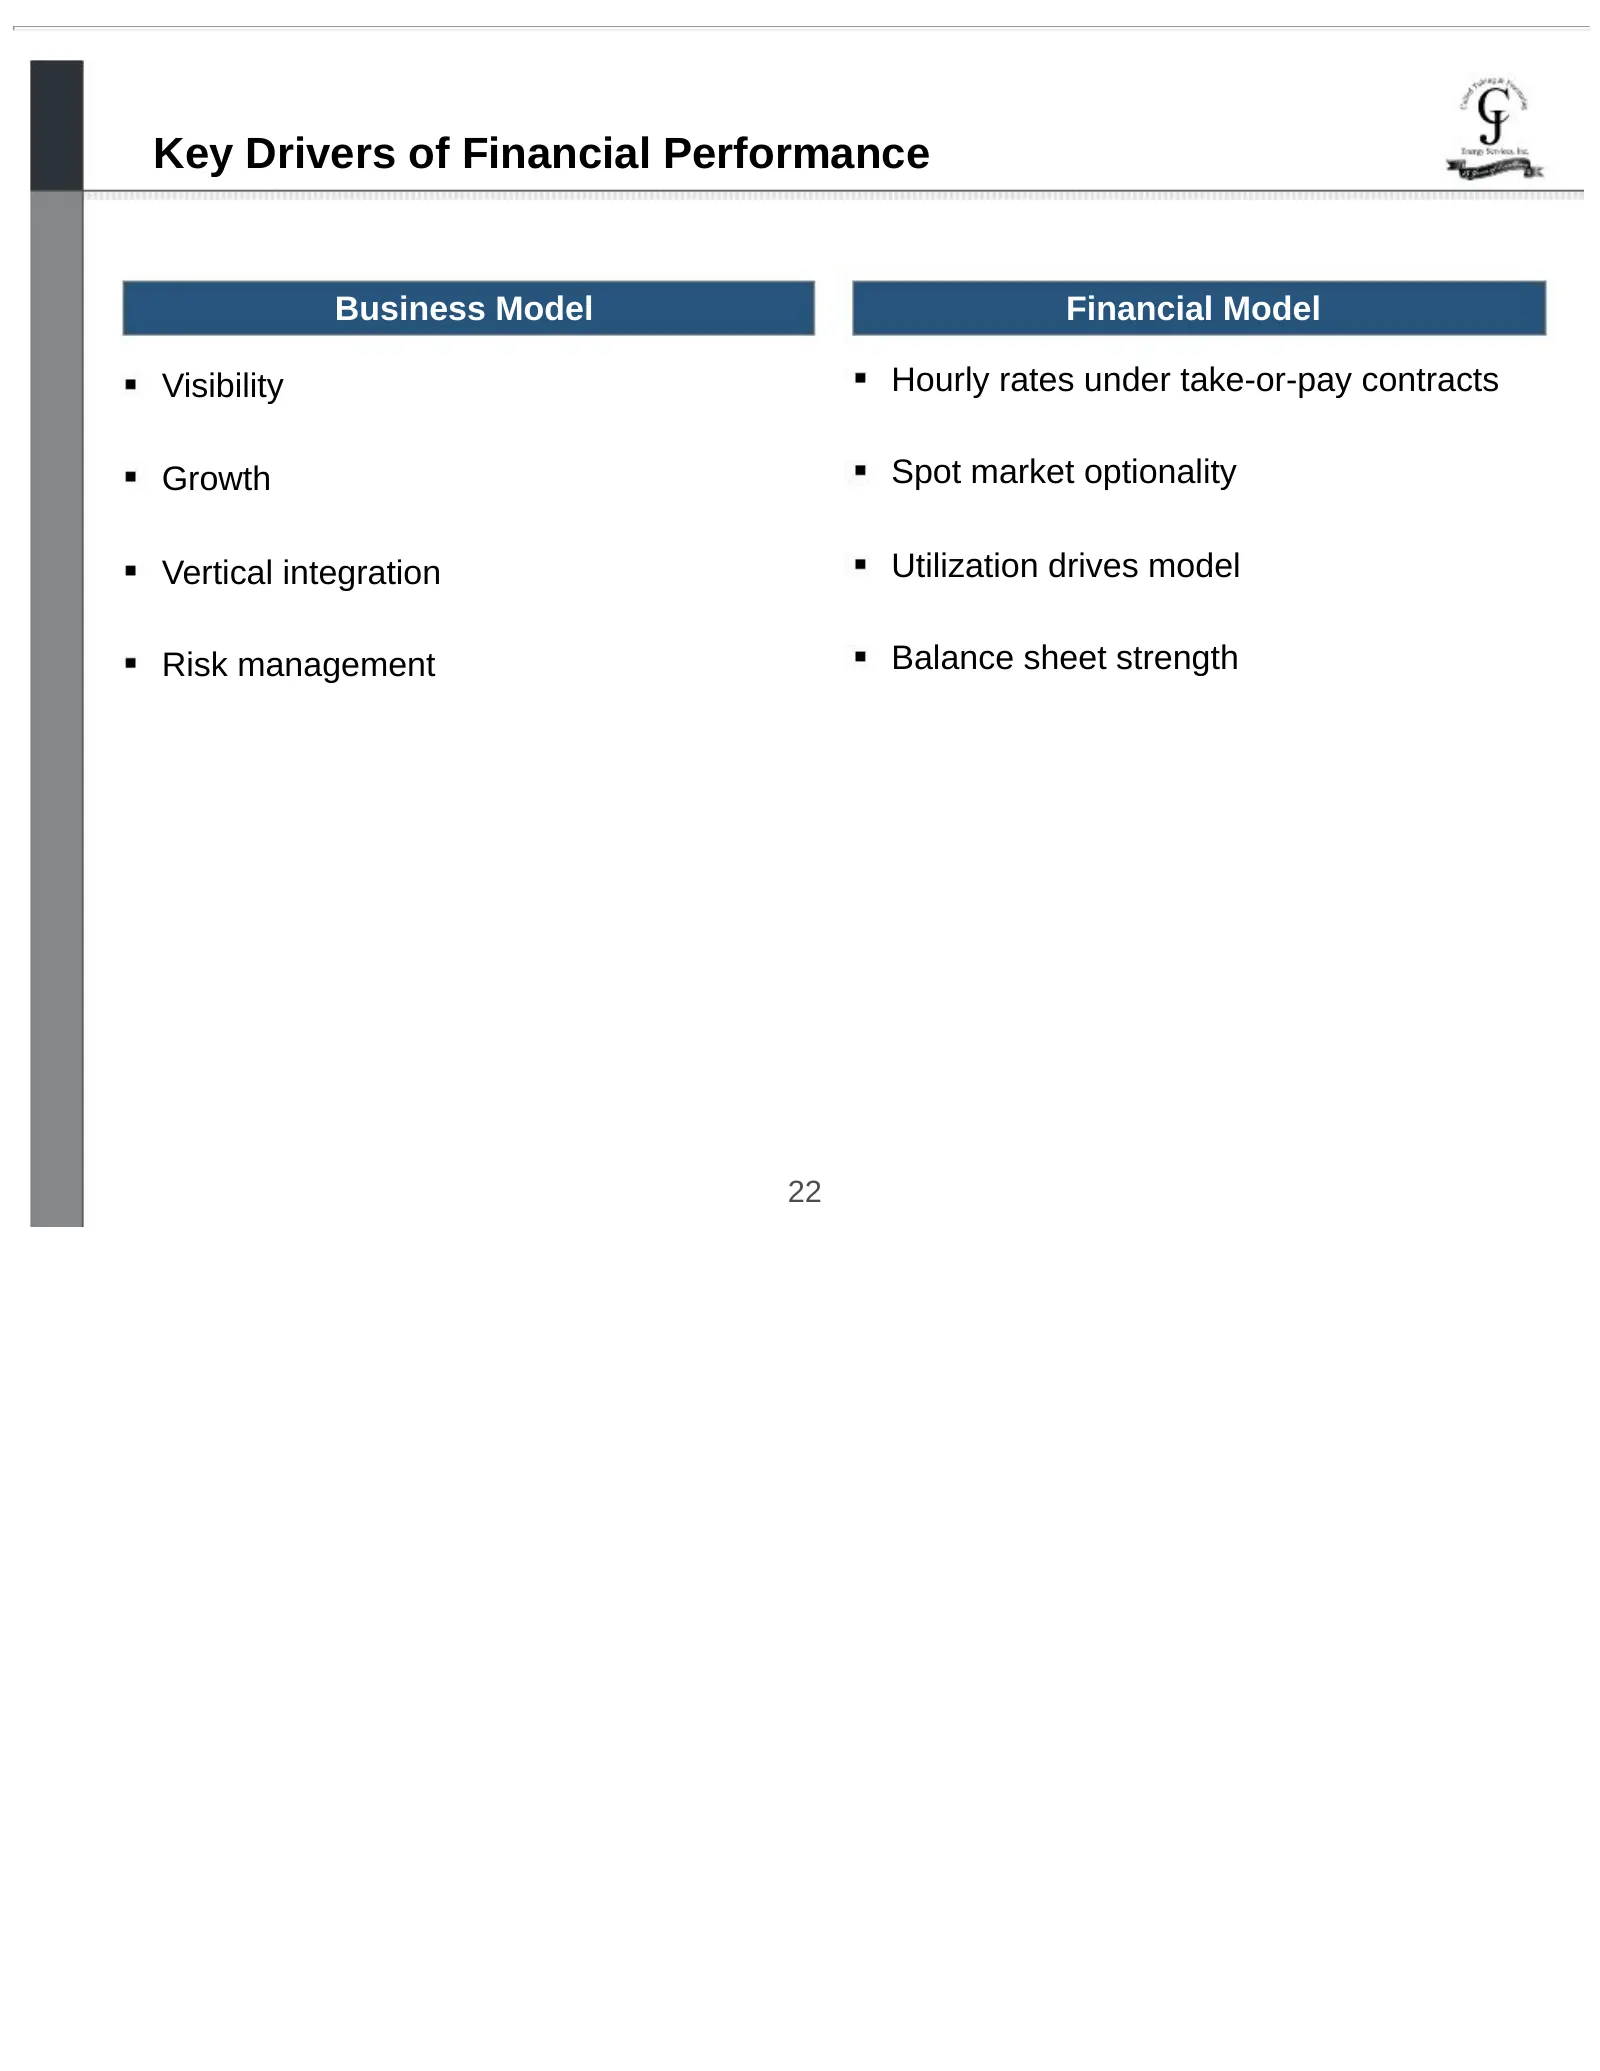
Key Drivers of Financial Performance Business Model Financial Model Visibility Hourly rates under take-or-pay contracts Growth Spot market optionality Vertical integration Utilization drives model Risk management Balance sheet strength 22
Slide 23: Significant Historical Growth
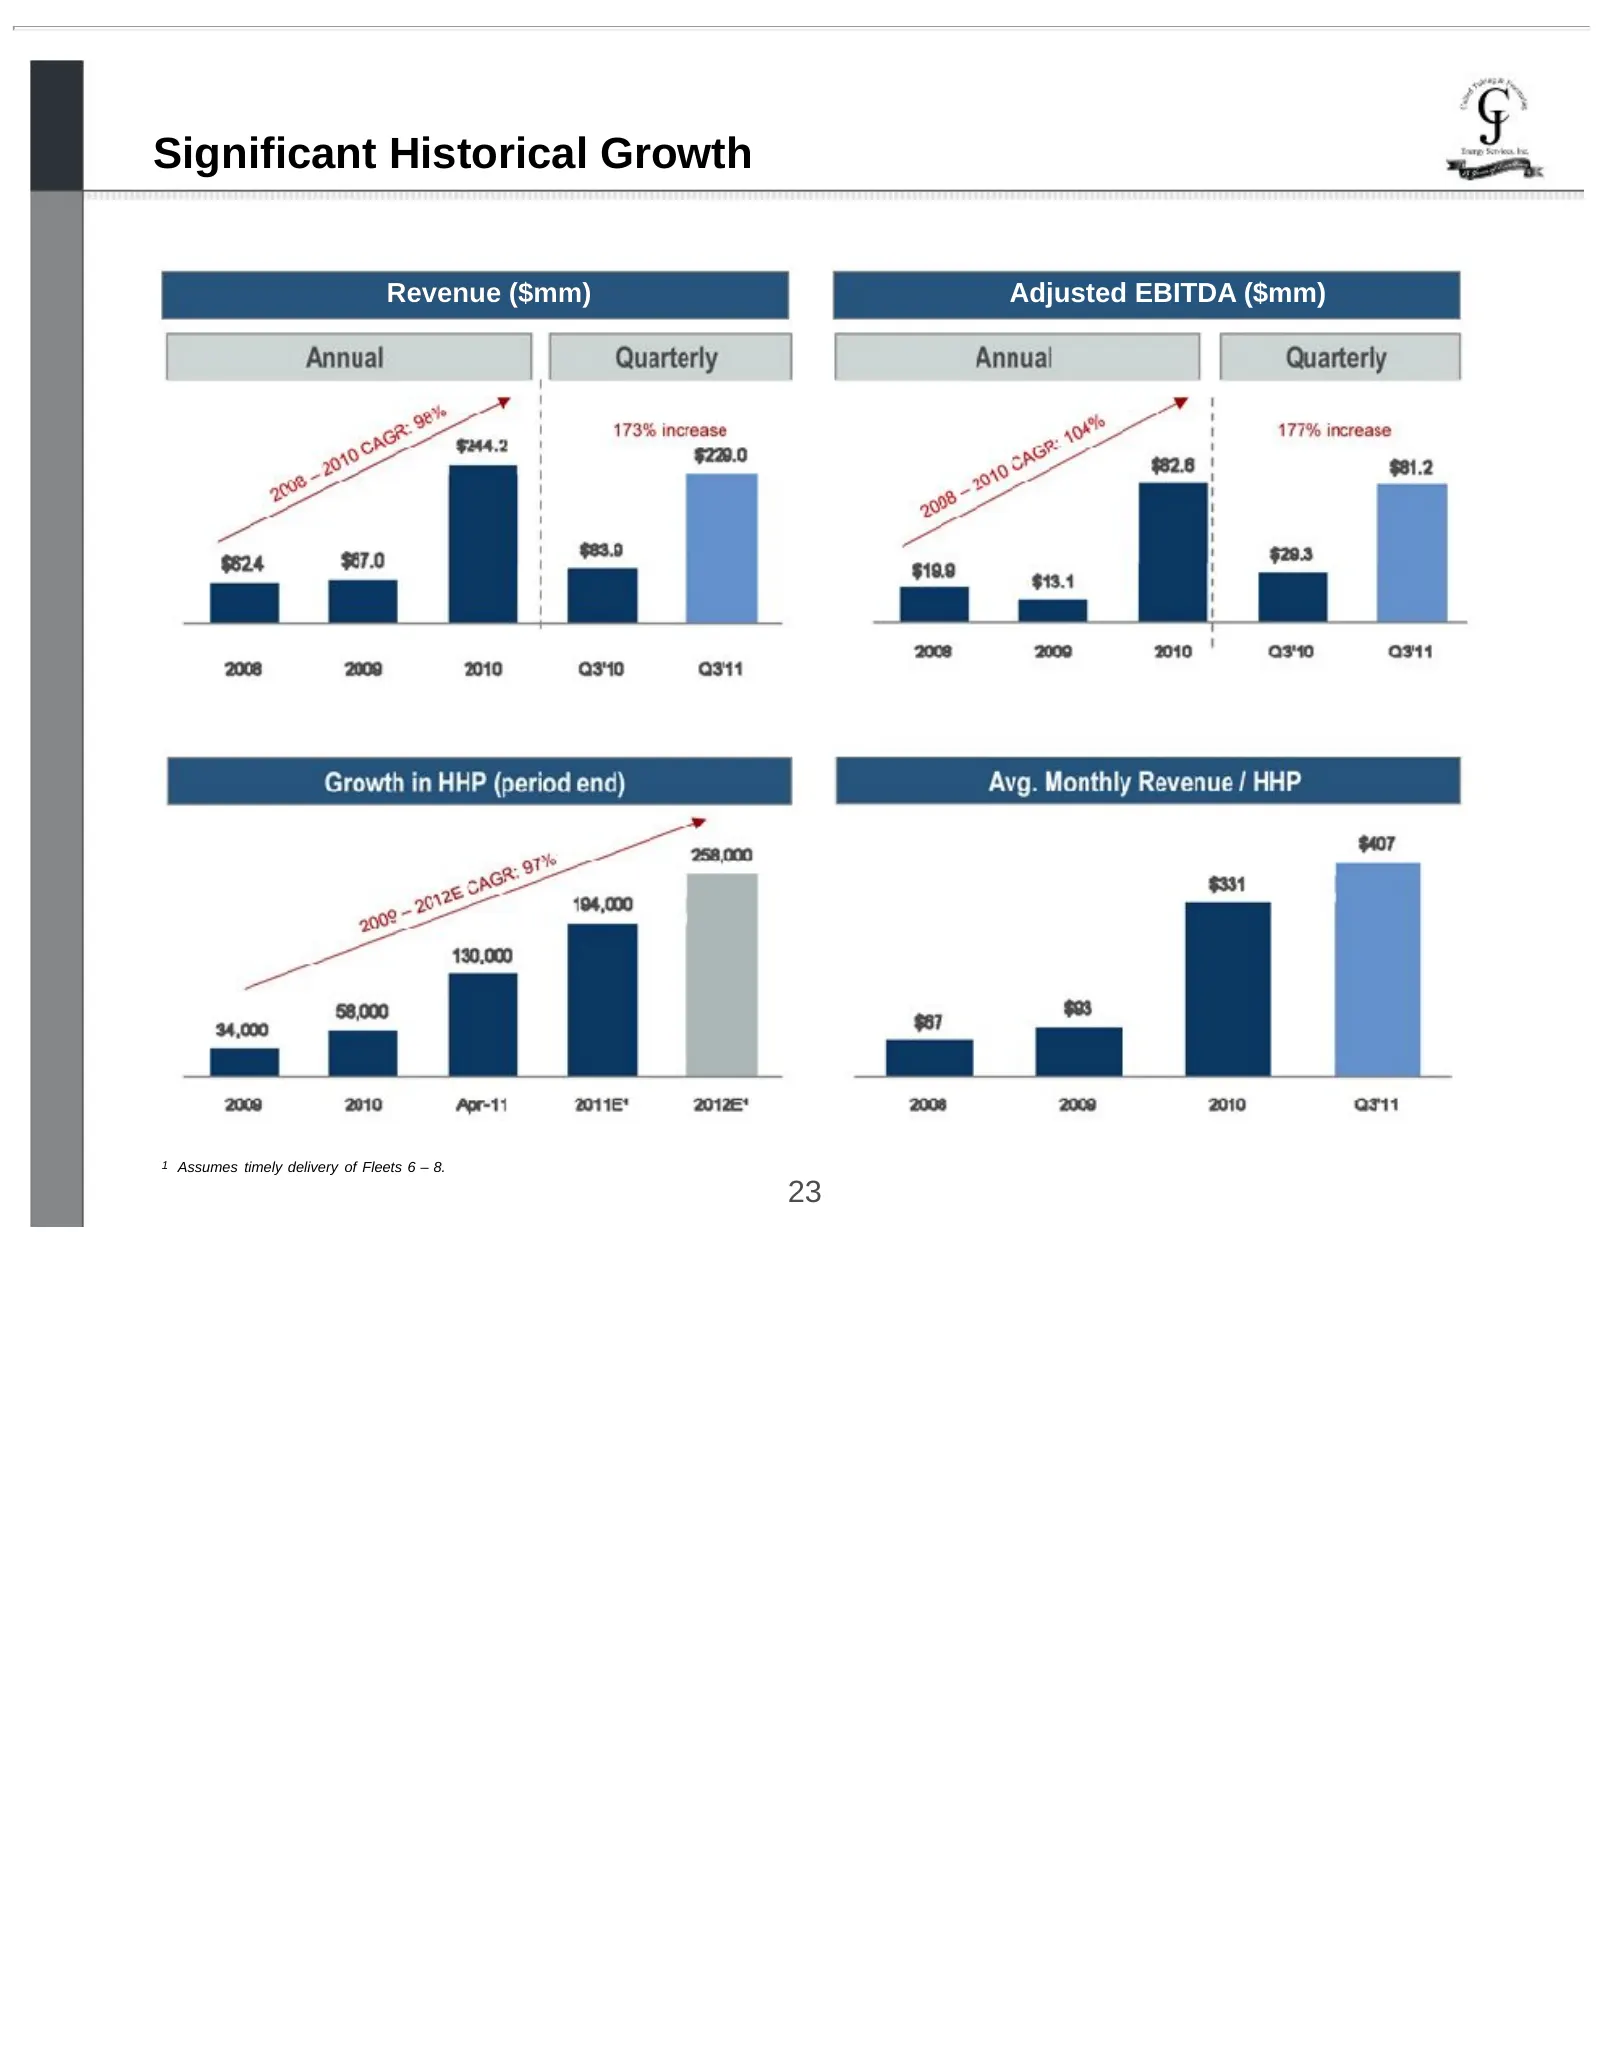
Significant Historical Growth Revenue ($mm) Adjusted EBITDA ($mm) 1 Assumes timely delivery of Fleets 6 – 8. 23
Slide 24: Strong Margin Profile
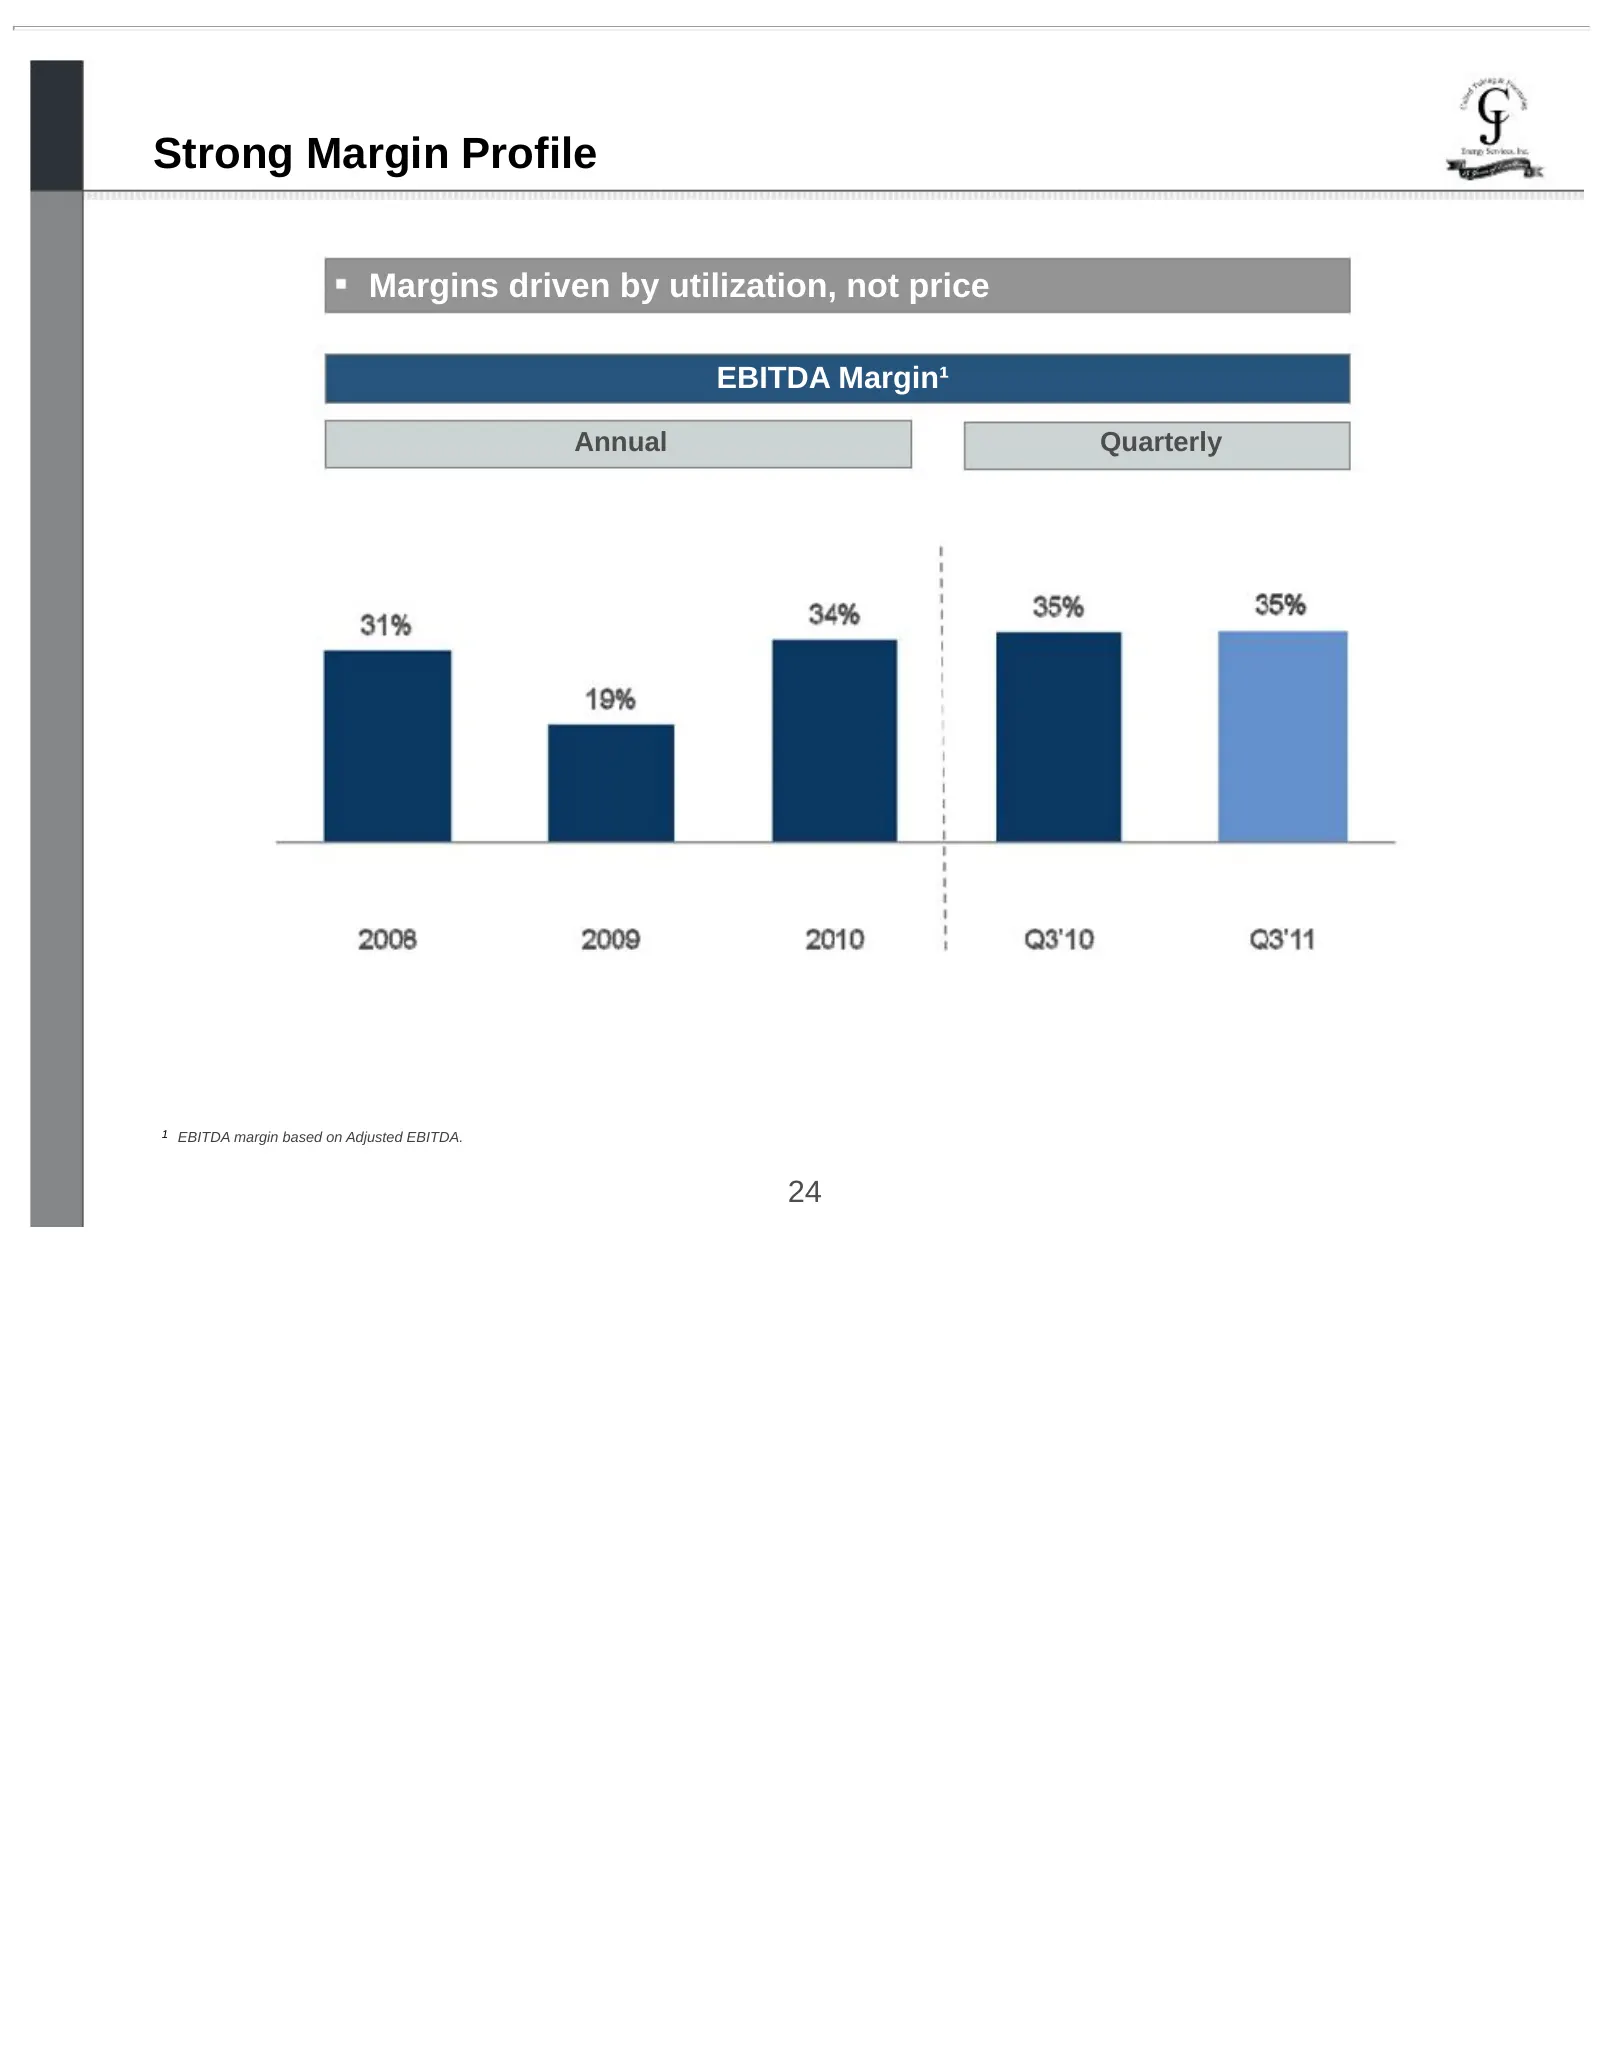
Strong Margin Profile Margins driven by utilization, not price EBITDA Margin¹ Annual Quarterly 1 EBITDA margin based on Adjusted EBITDA. 24
Slide 25: Operational Strategy Drives Strong Financial Performance
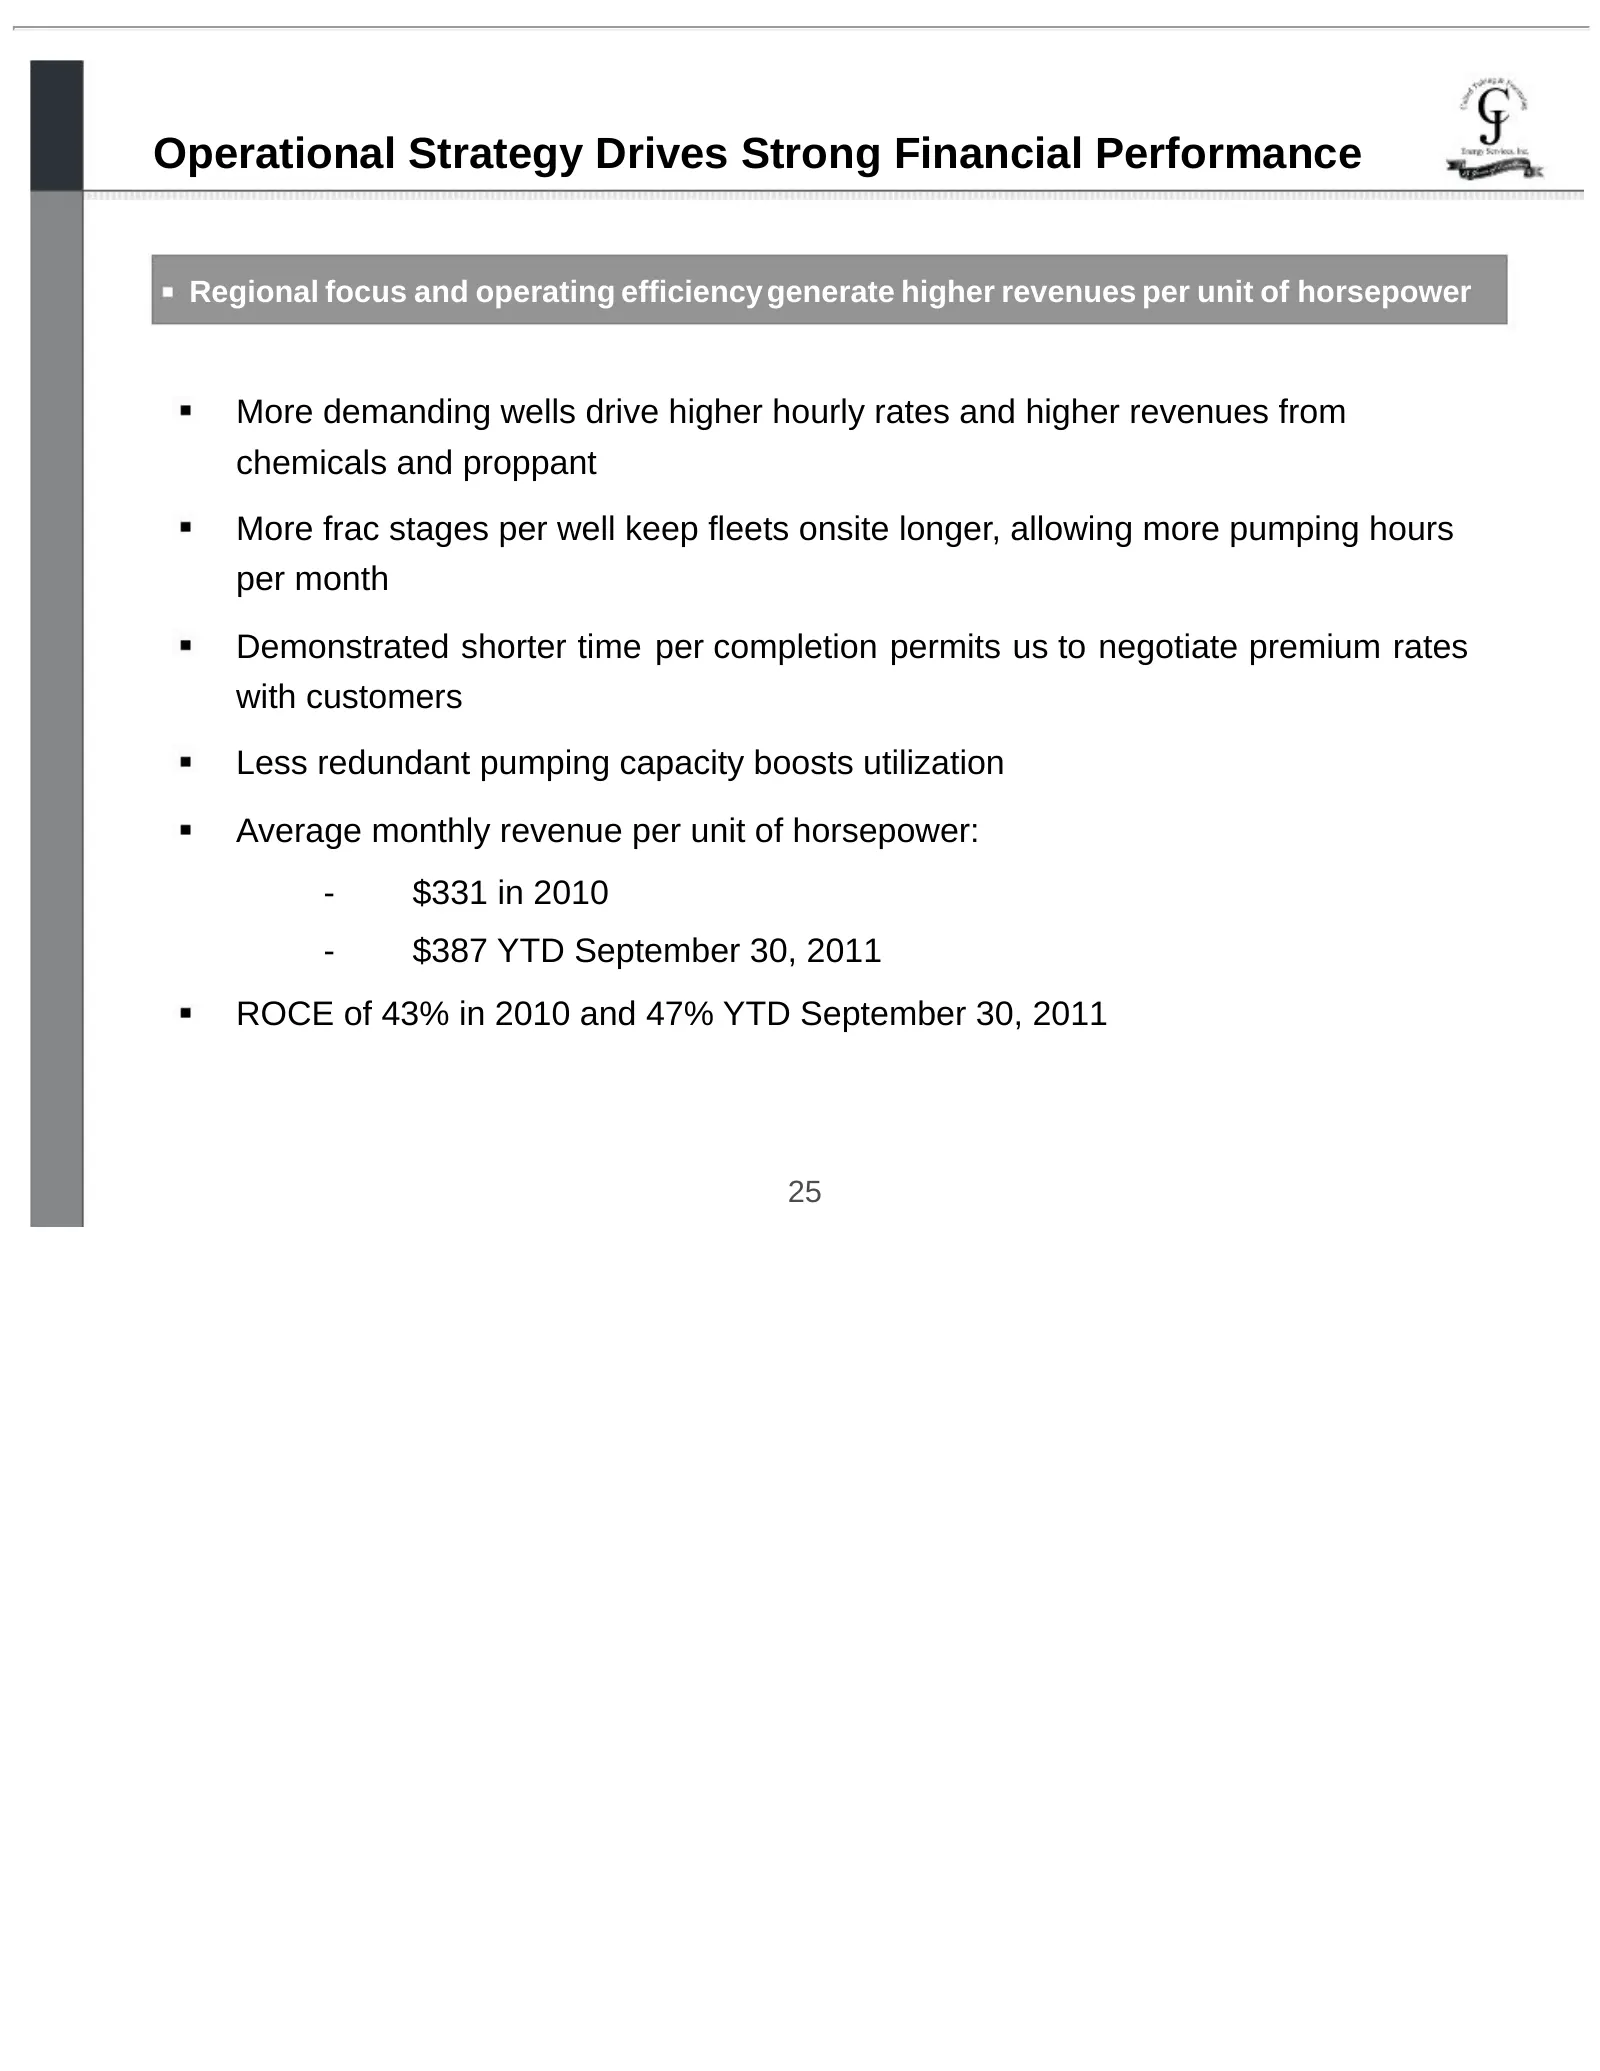
Operational Strategy Drives Strong Financial Performance Regional focus and operating efficiency generate higher revenues per unit of horsepower More demanding wells drive higher hourly rates and higher revenues from chemicals and proppant More frac stages per well keep fleets onsite longer, allowin
Slide 26: Fracturing Term Contracts Provide Visible Growth
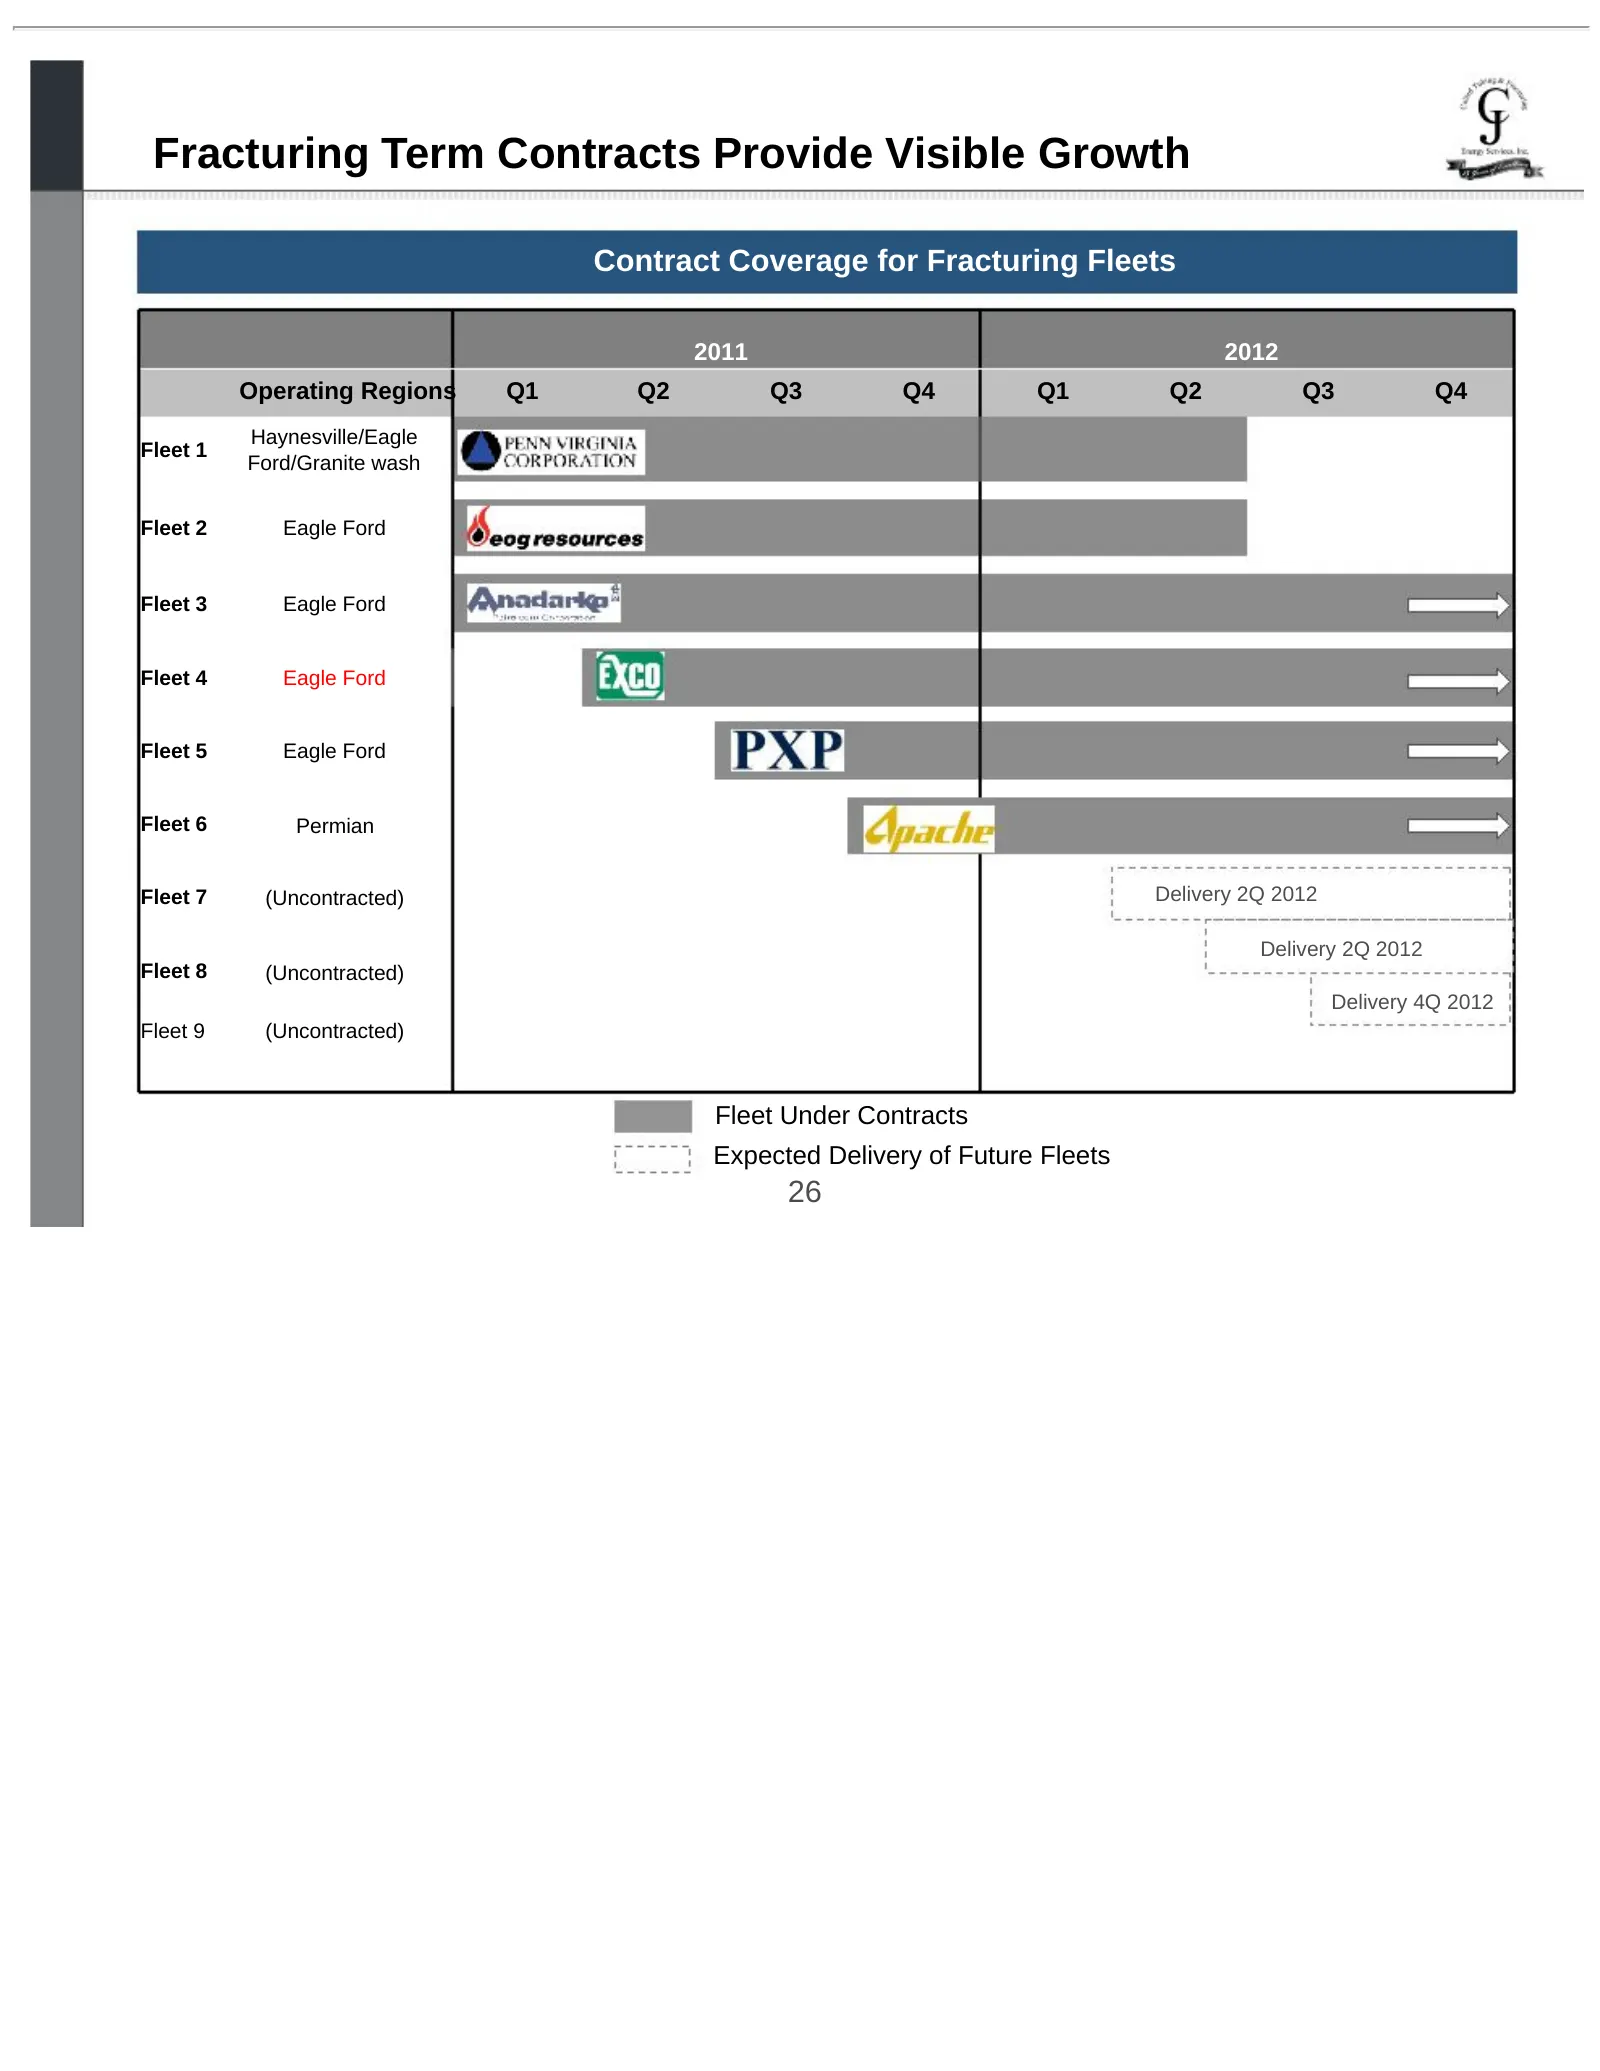
Fracturing Term Contracts Provide Visible Growth Contract Coverage for Fracturing Fleets 2011 2012 Operating Regions Q1 Q2 Q3 Q4 Q1 Q2 Q3 Q4 Haynesville/Eagle Fleet 1 Ford/Granite wash Fleet 2 Eagle Ford Fleet 3 Eagle Ford Fleet 4 Eagle Ford Fleet 5 Eagle Ford Fleet 6 Permian Fleet 7 (Uncontracted)
Slide 27: Overview of Term Contracts
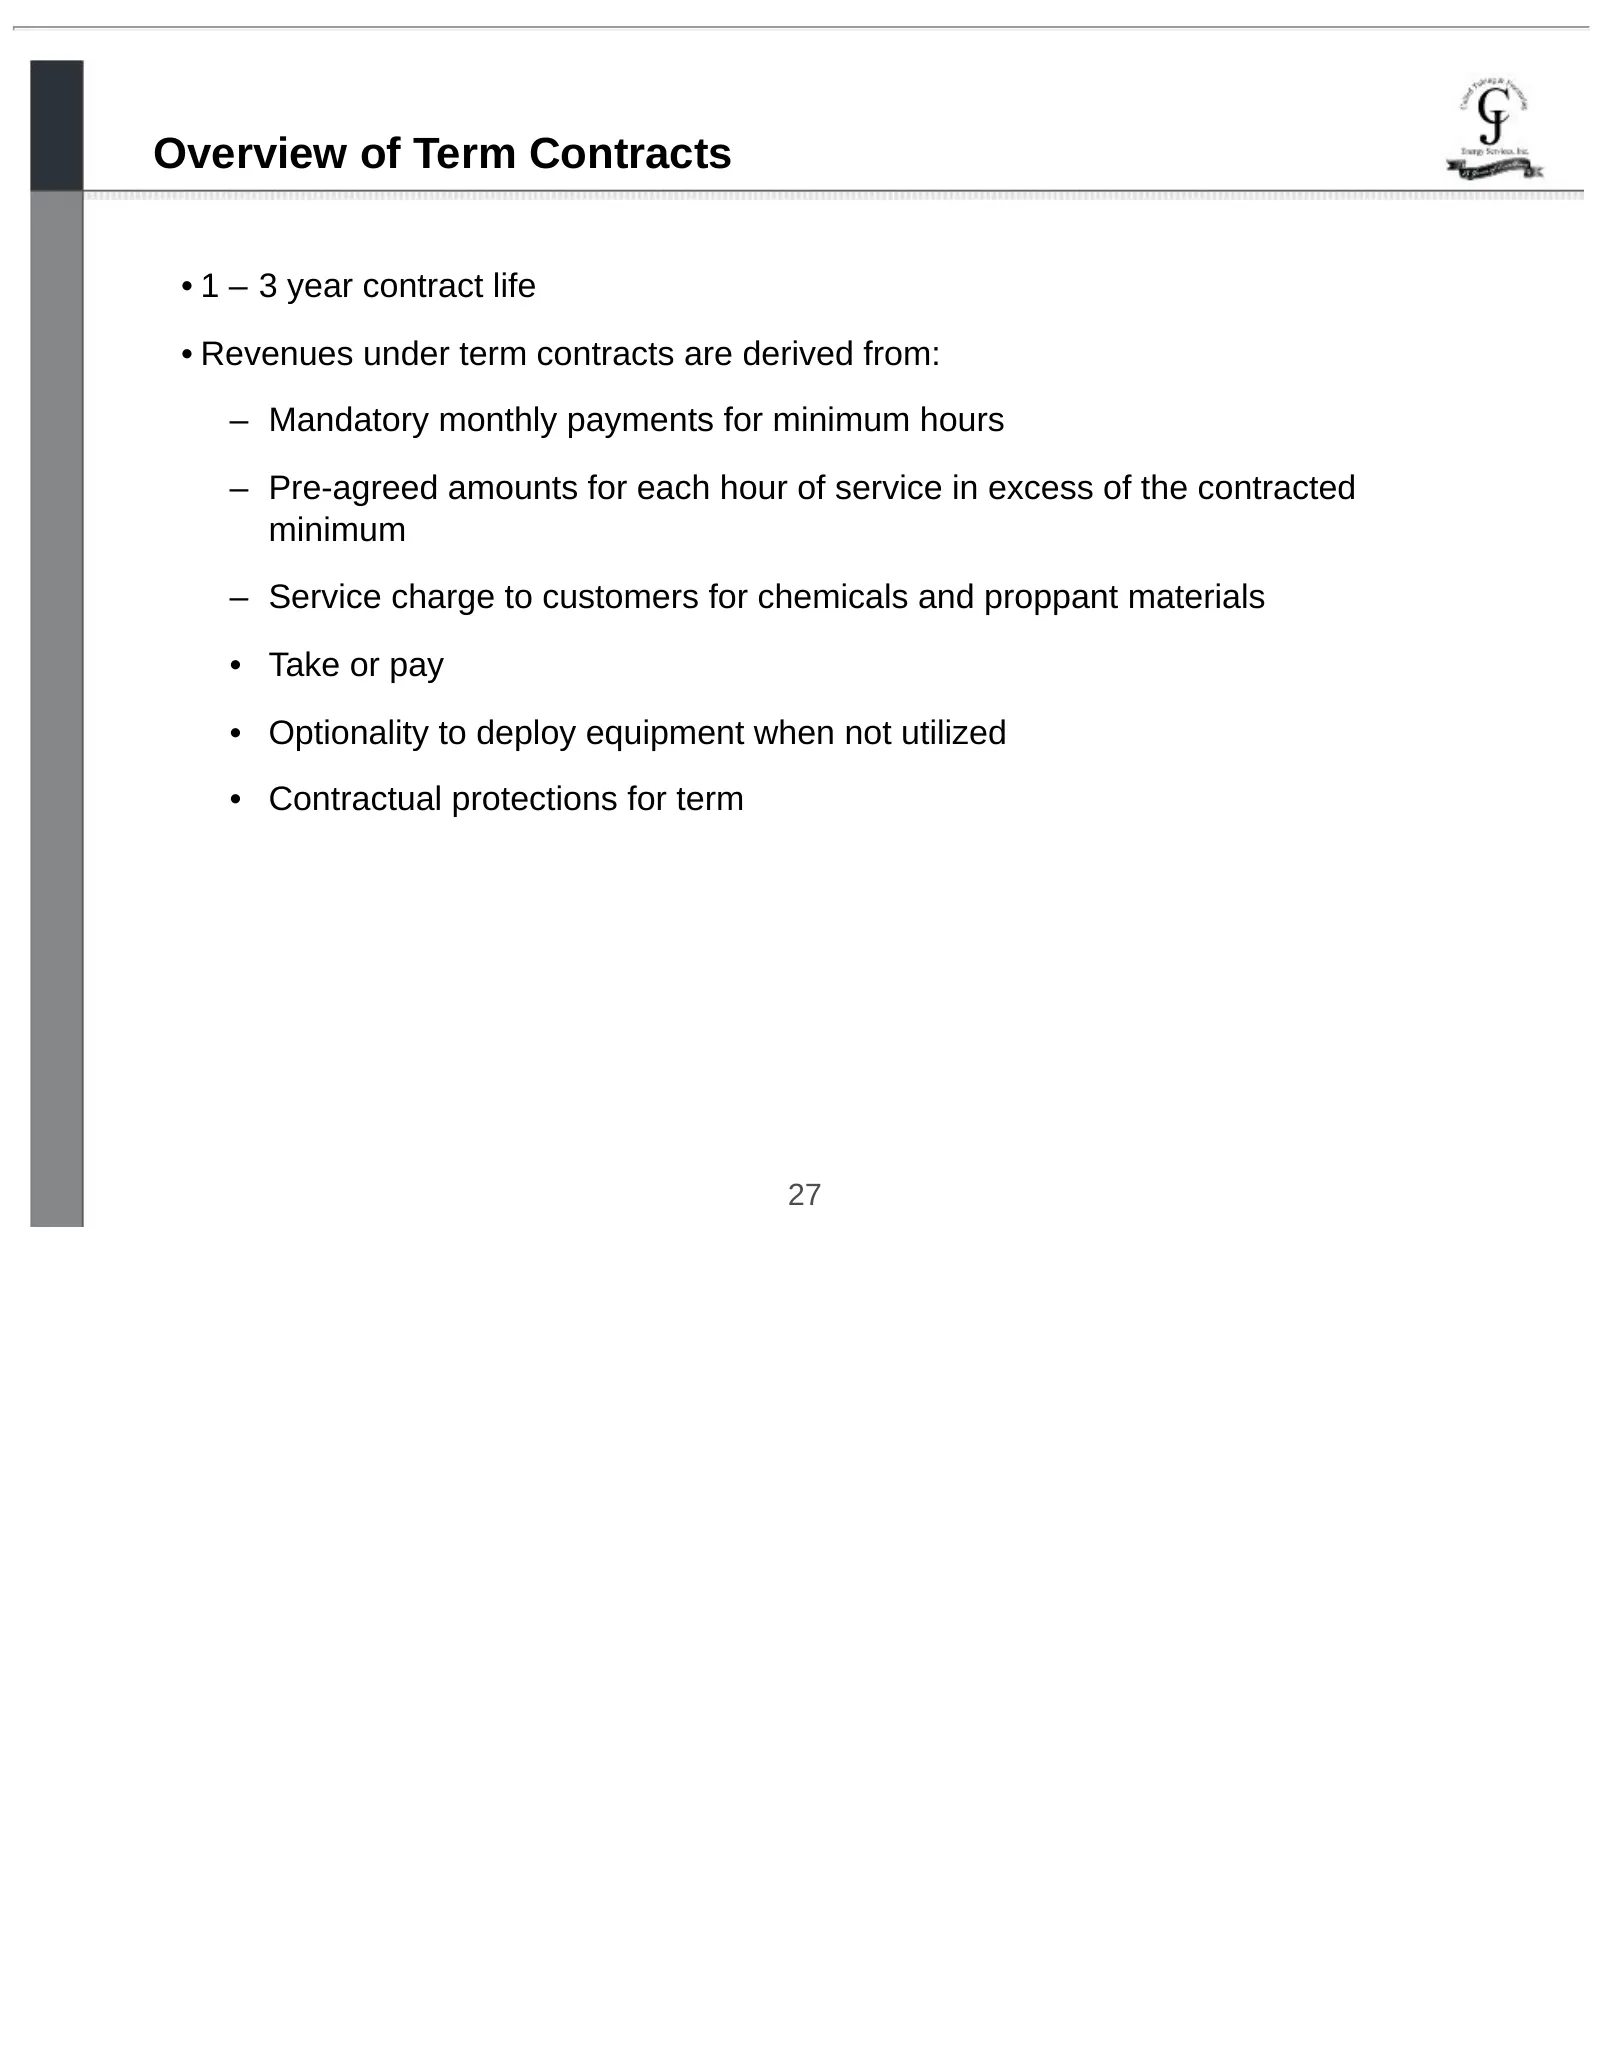
Overview of Term Contracts • 1 – 3 year contract life • Revenues under term contracts are derived from: – Mandatory monthly payments for minimum hours – Pre-agreed amounts for each hour of service in excess of the contracted minimum – Service charge to customers for chemicals and proppant materials
Slide 28: Total E&S Acquisition Facilitates Growth Strategy
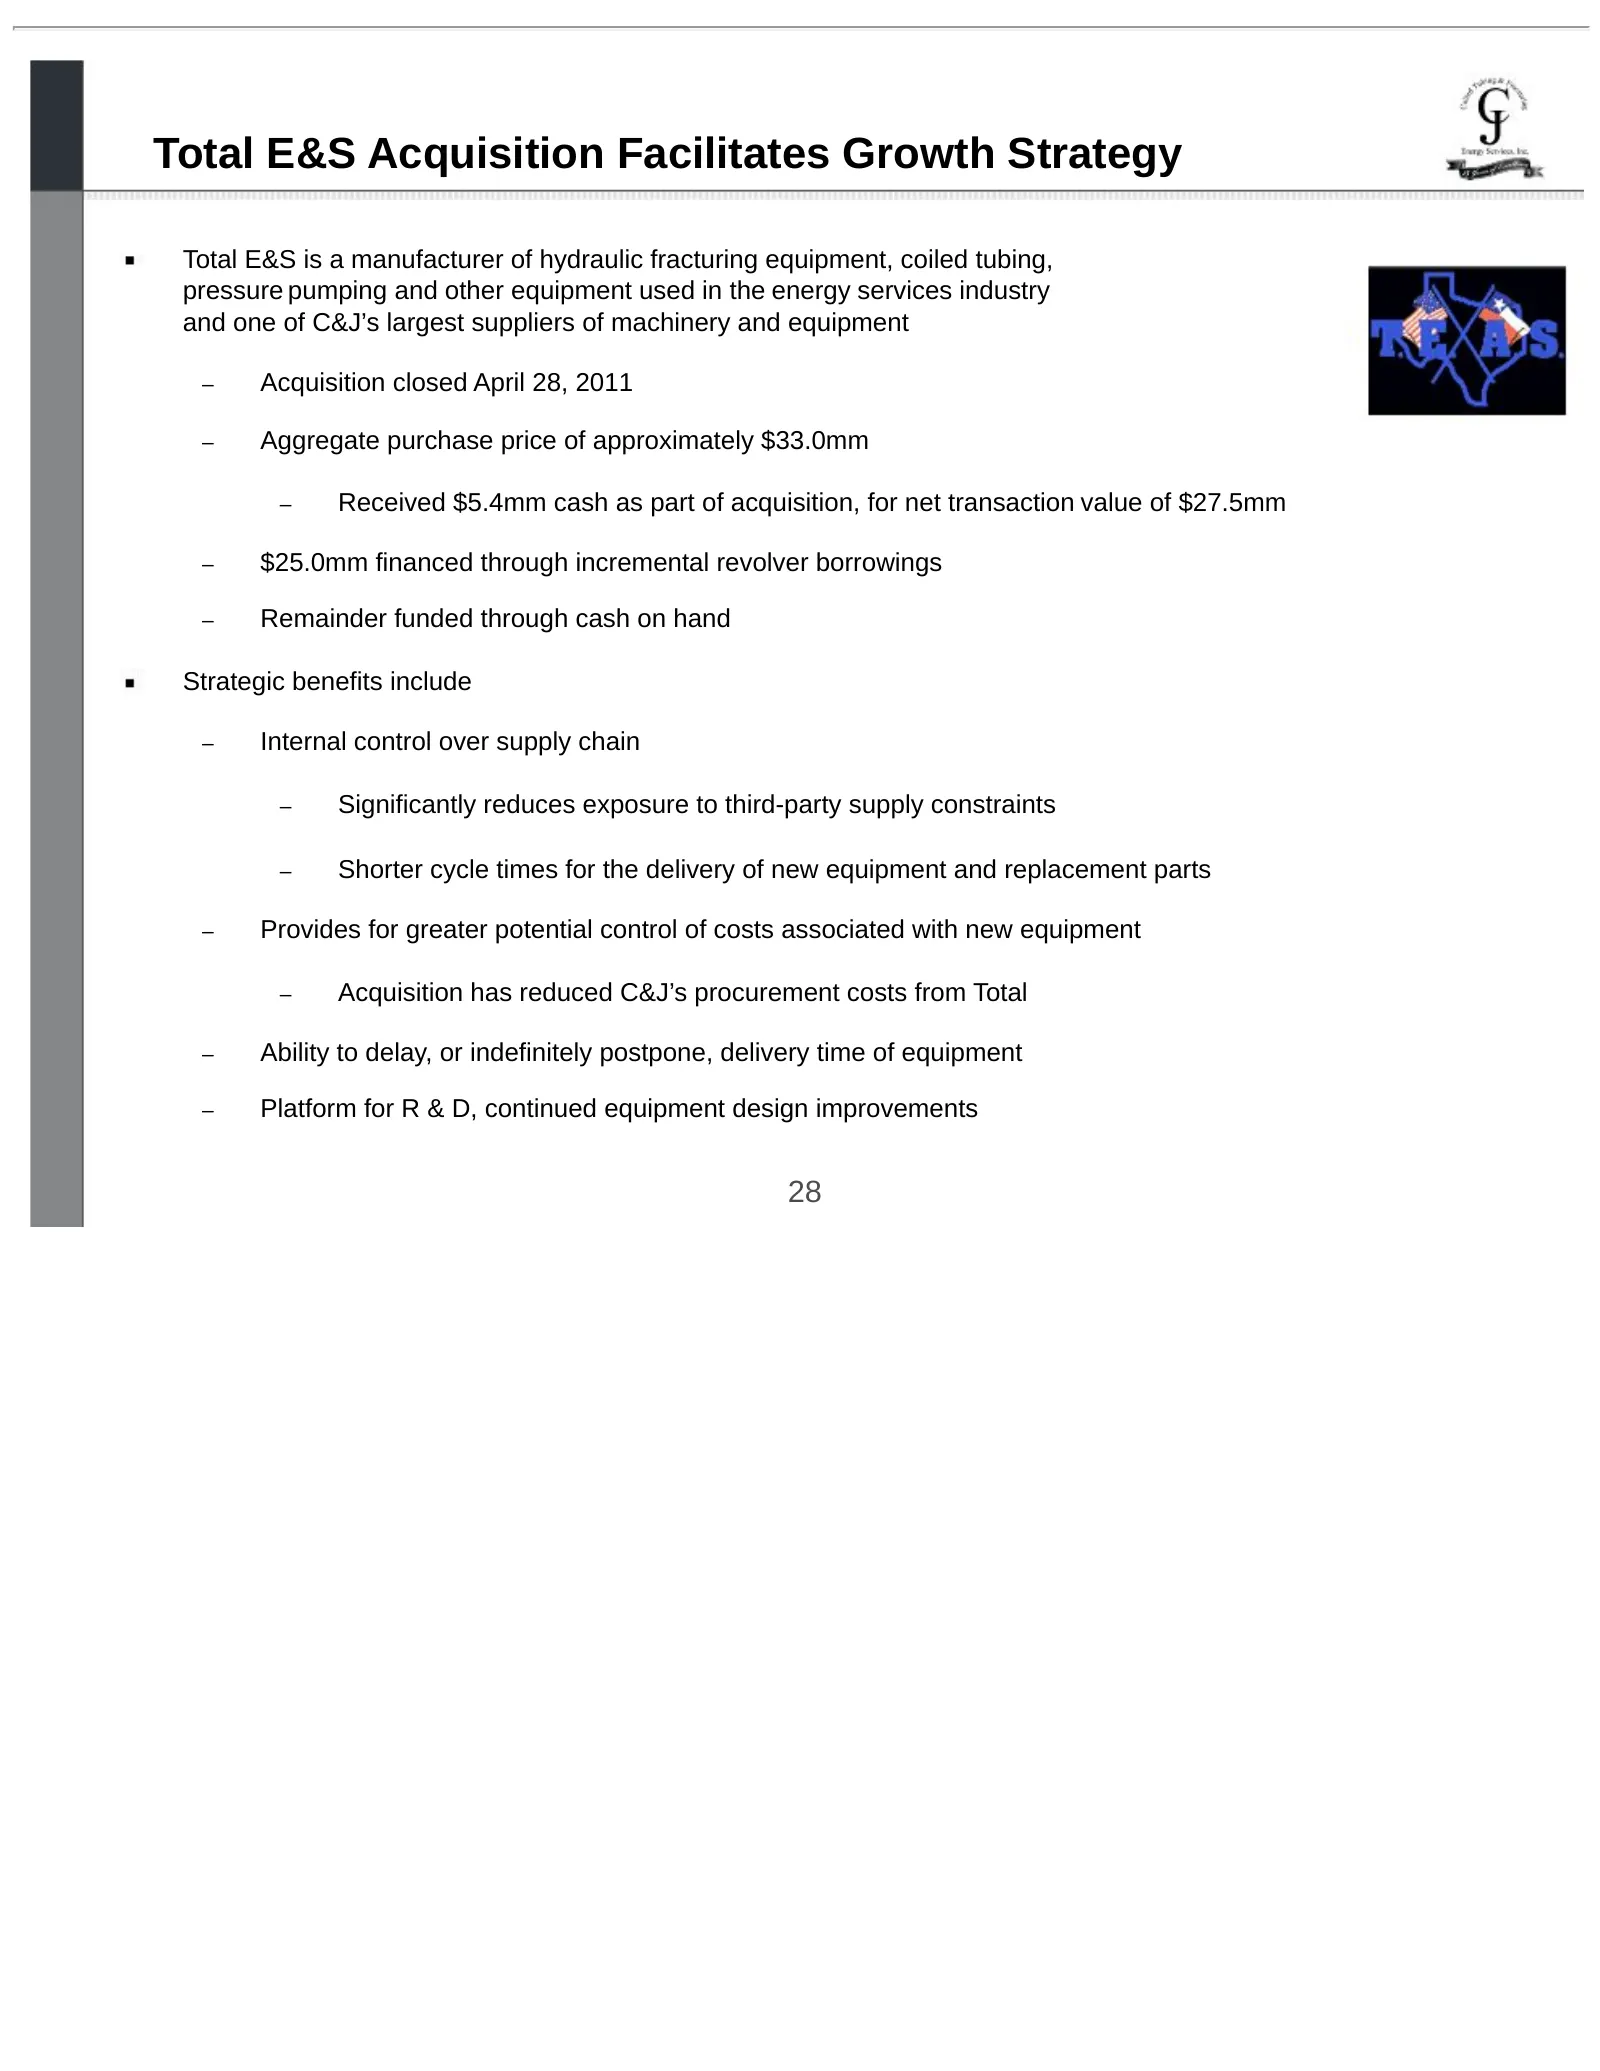
Total E&S Acquisition Facilitates Growth Strategy Total E&S is a manufacturer of hydraulic fracturing equipment, coiled tubing, pressure pumping and other equipment used in the energy services industry and one of C&J’s largest suppliers of machinery and equipment – Acquisition closed April 28, 2011
Slide 29: Strong Balance Sheet and Liquidity
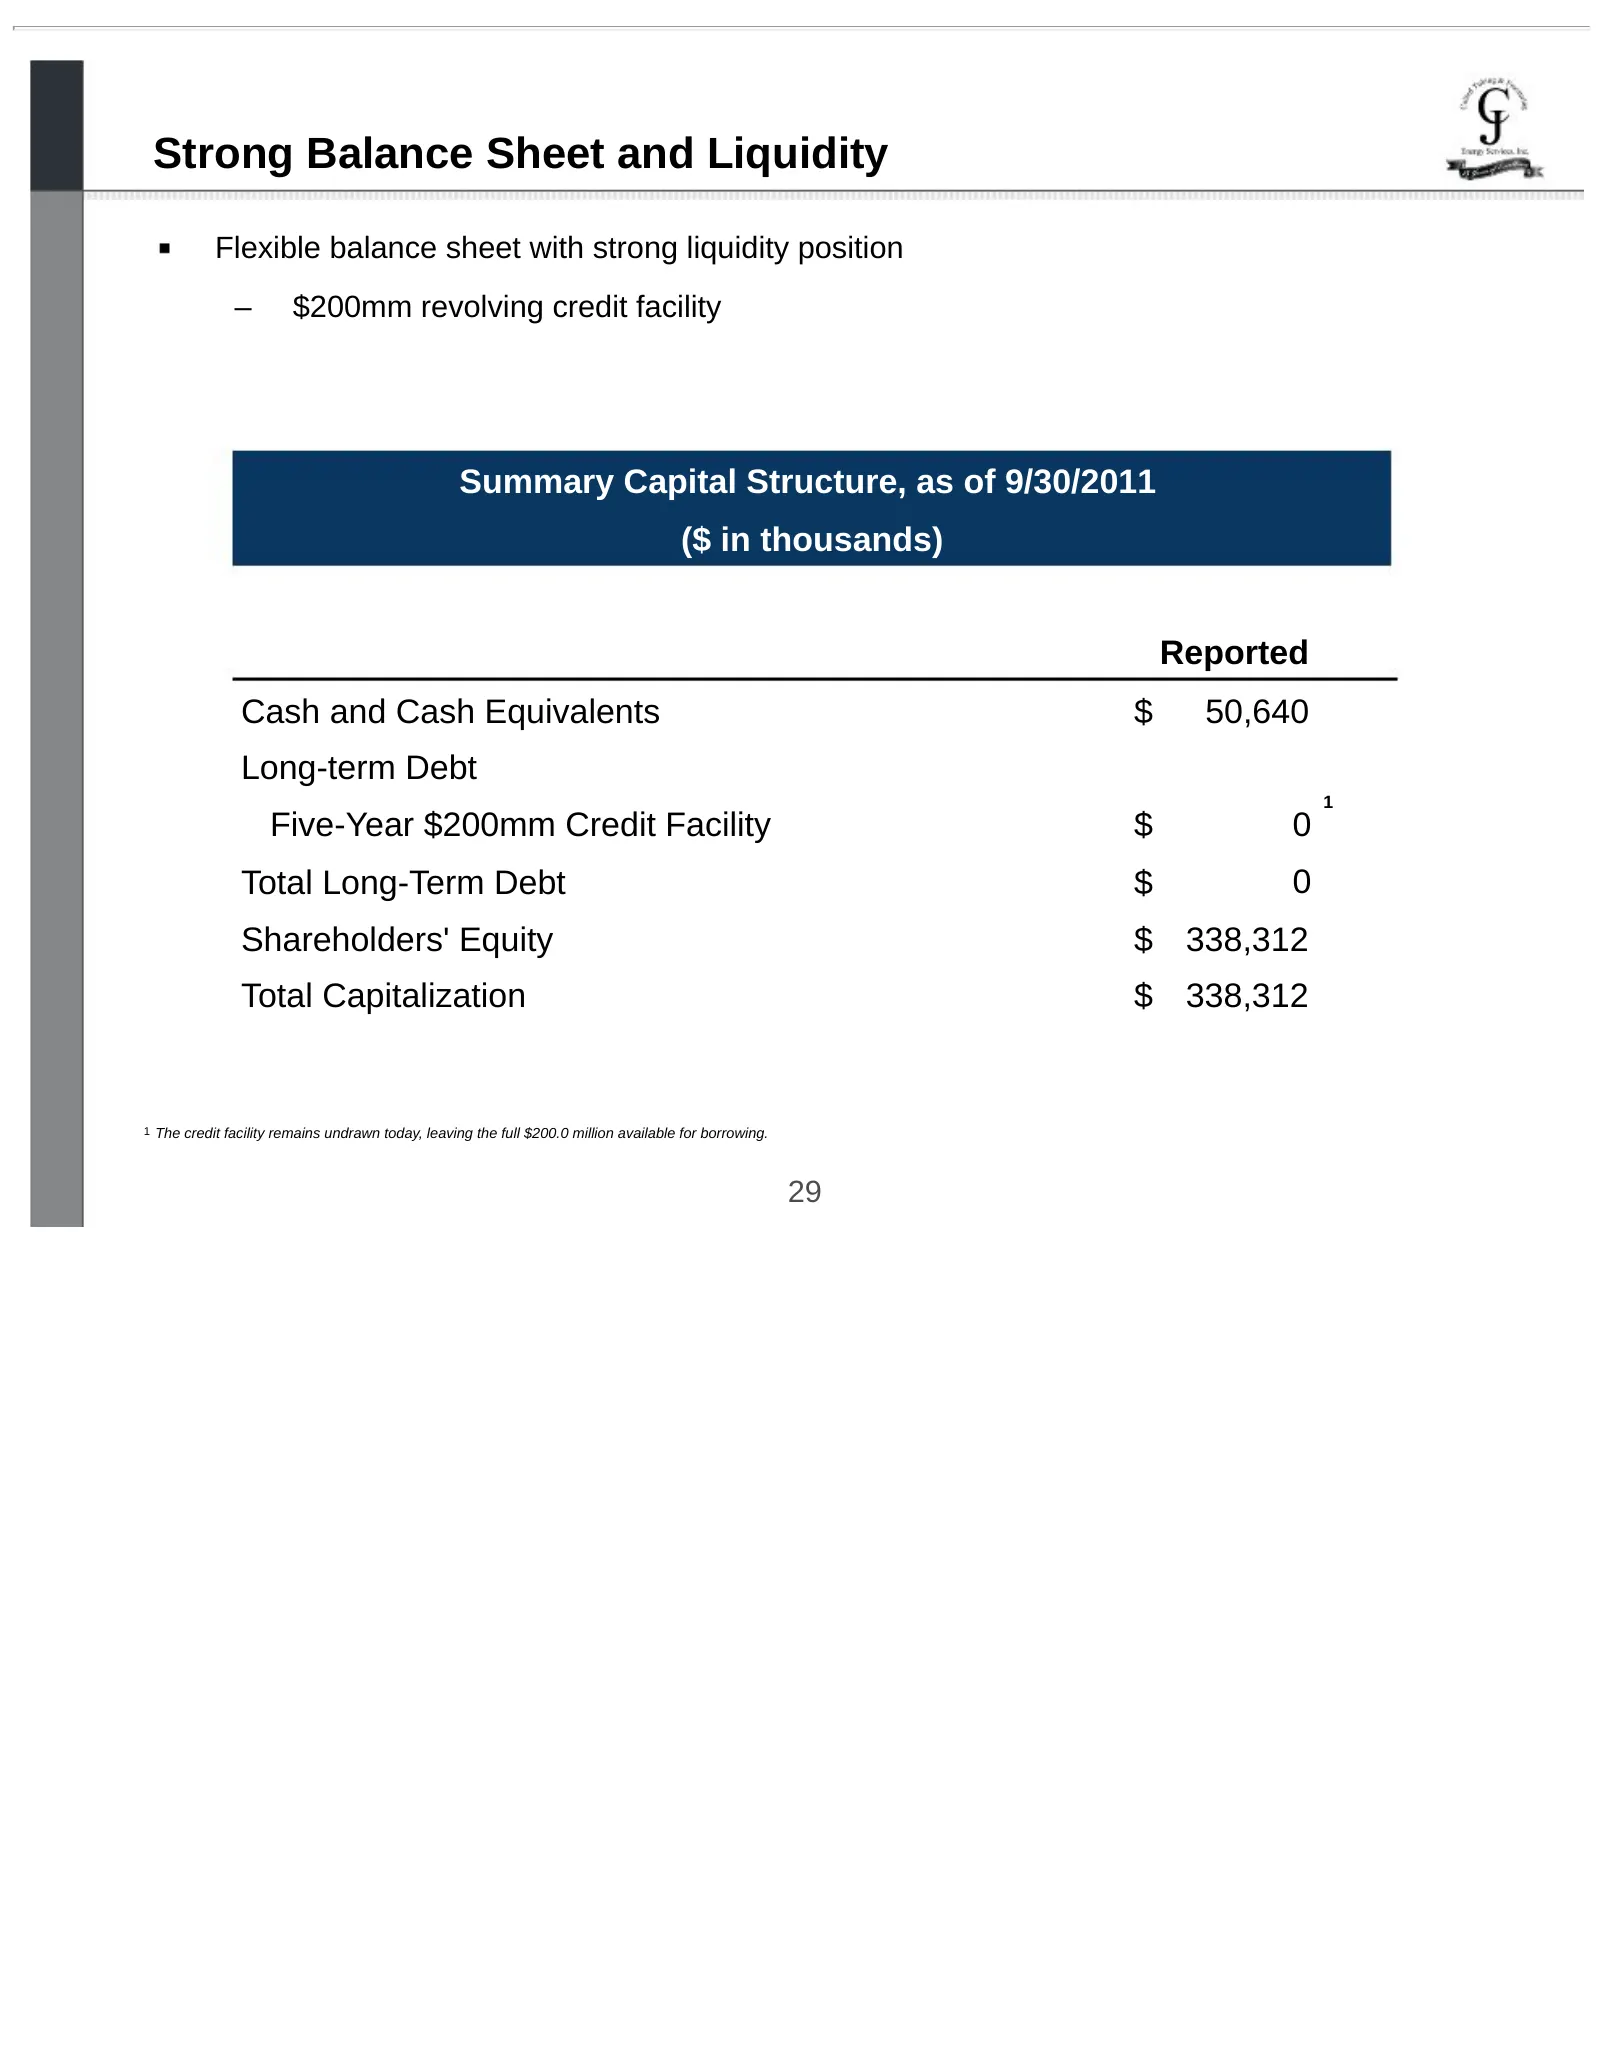
Strong Balance Sheet and Liquidity Flexible balance sheet with strong liquidity position – $200mm revolving credit facility Summary Capital Structure, as of 9/30/2011 ($ in thousands) Reported Cash and Cash Equivalents $ 50,640 Long-term Debt 1 Five-Year $200mm Credit Facility $ 0 Total Long-Term De
Slide 30: C&J Investment Highlights
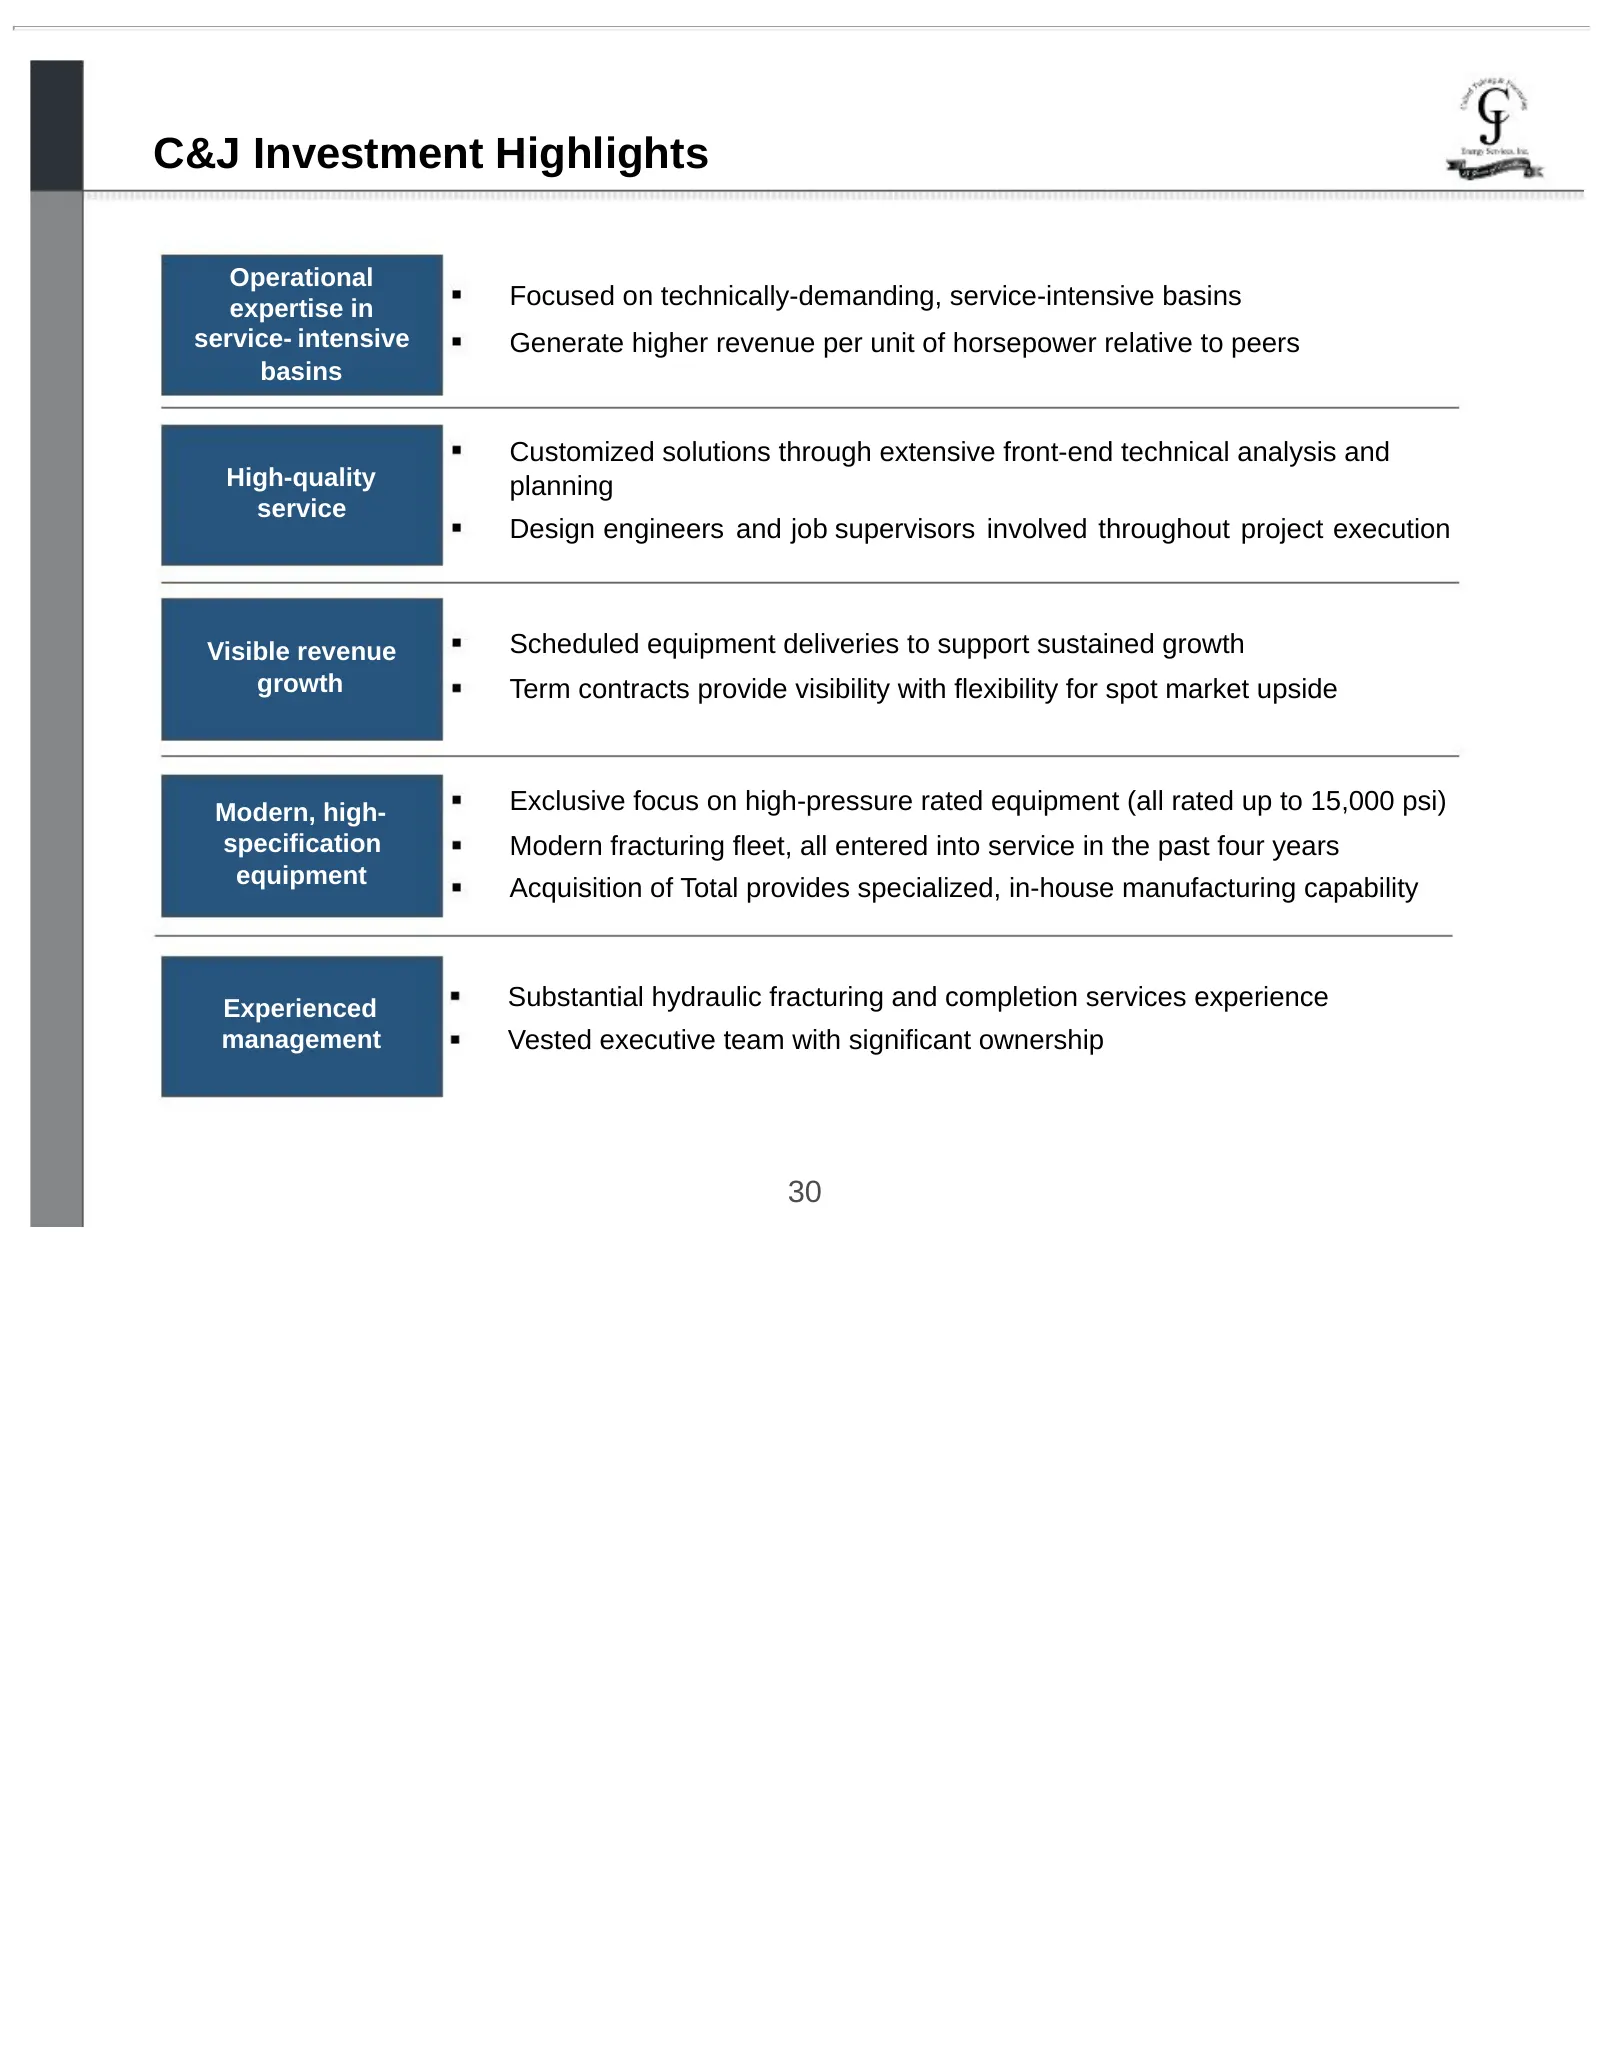
C&J Investment Highlights Operational expertise in Focused on technically-demanding, service-intensive basins service- intensive Generate higher revenue per unit of horsepower relative to peers basins Customized solutions through extensive front-end technical analysis and High-quality planning servi
Slide 31: Appendix
Appendix qs & Pn, Rs iy 5 (a) %,. 3 ae Energy Services, Inc. ek
Slide 32: Income Statements
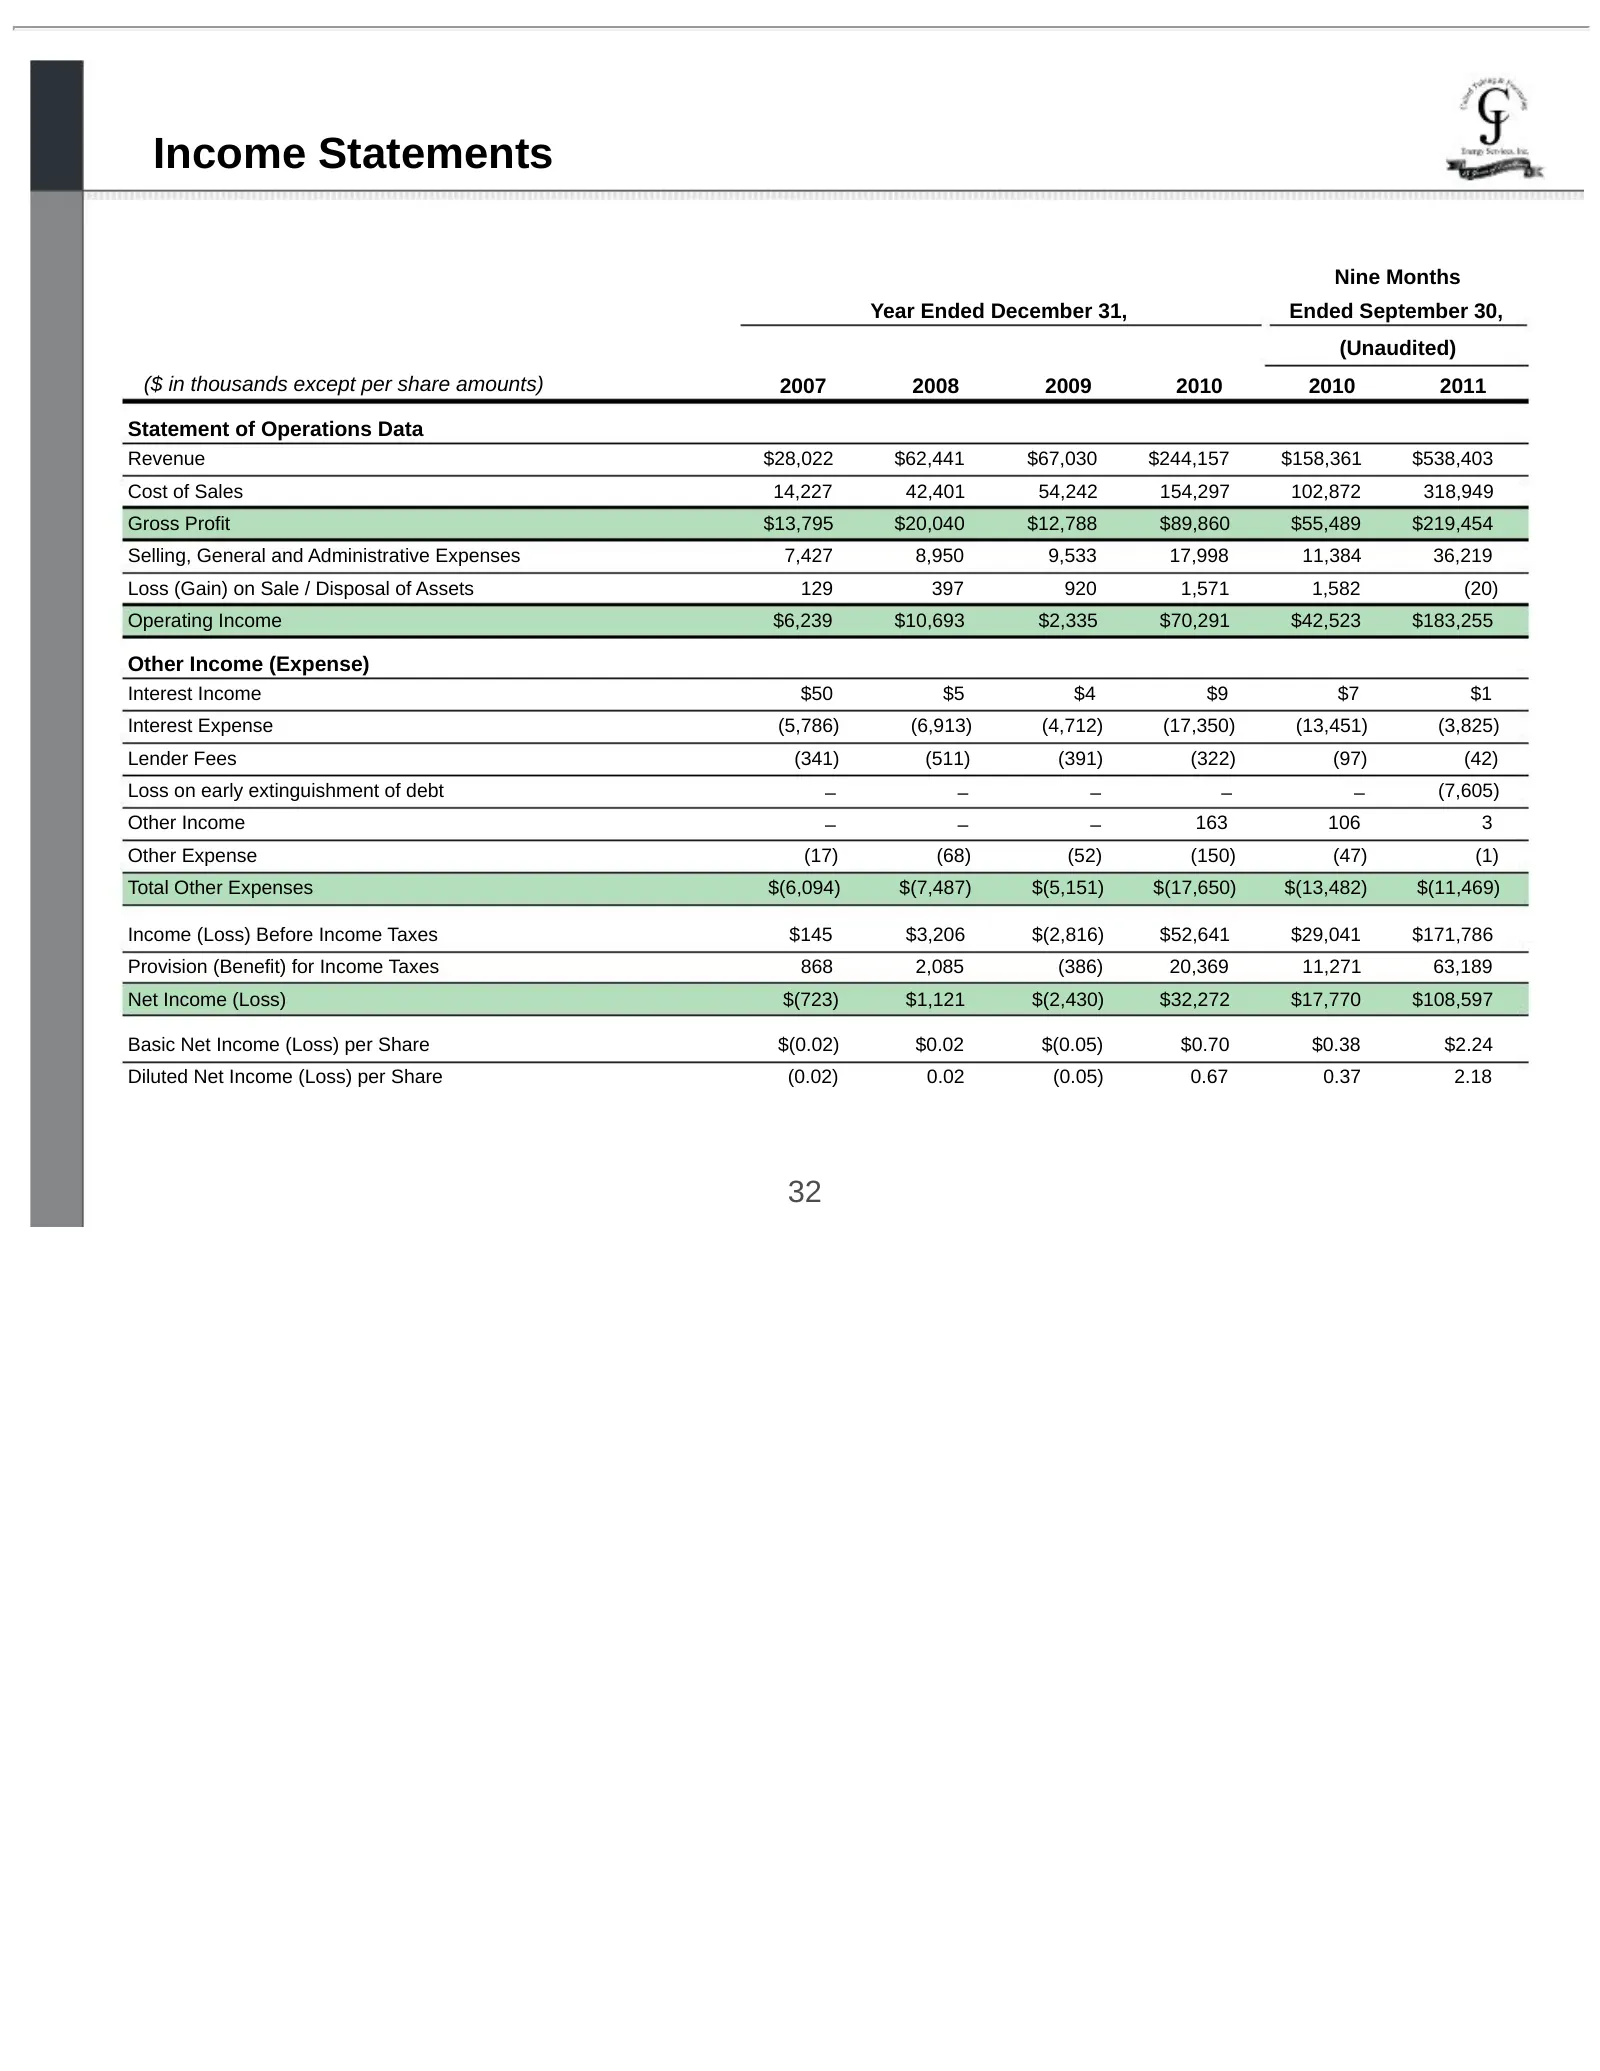
Income Statements Nine Months Year Ended December 31, Ended September 30, (Unaudited) ($ in thousands except per share amounts) 2007 2008 2009 2010 2010 2011 Statement of Operations Data Revenue $28,022 $62,441 $67,030 $244,157 $158,361 $538,403 Cost of Sales 14,227 42,401 54,242 154,297 102,872 318
Slide 33: Cash Flows
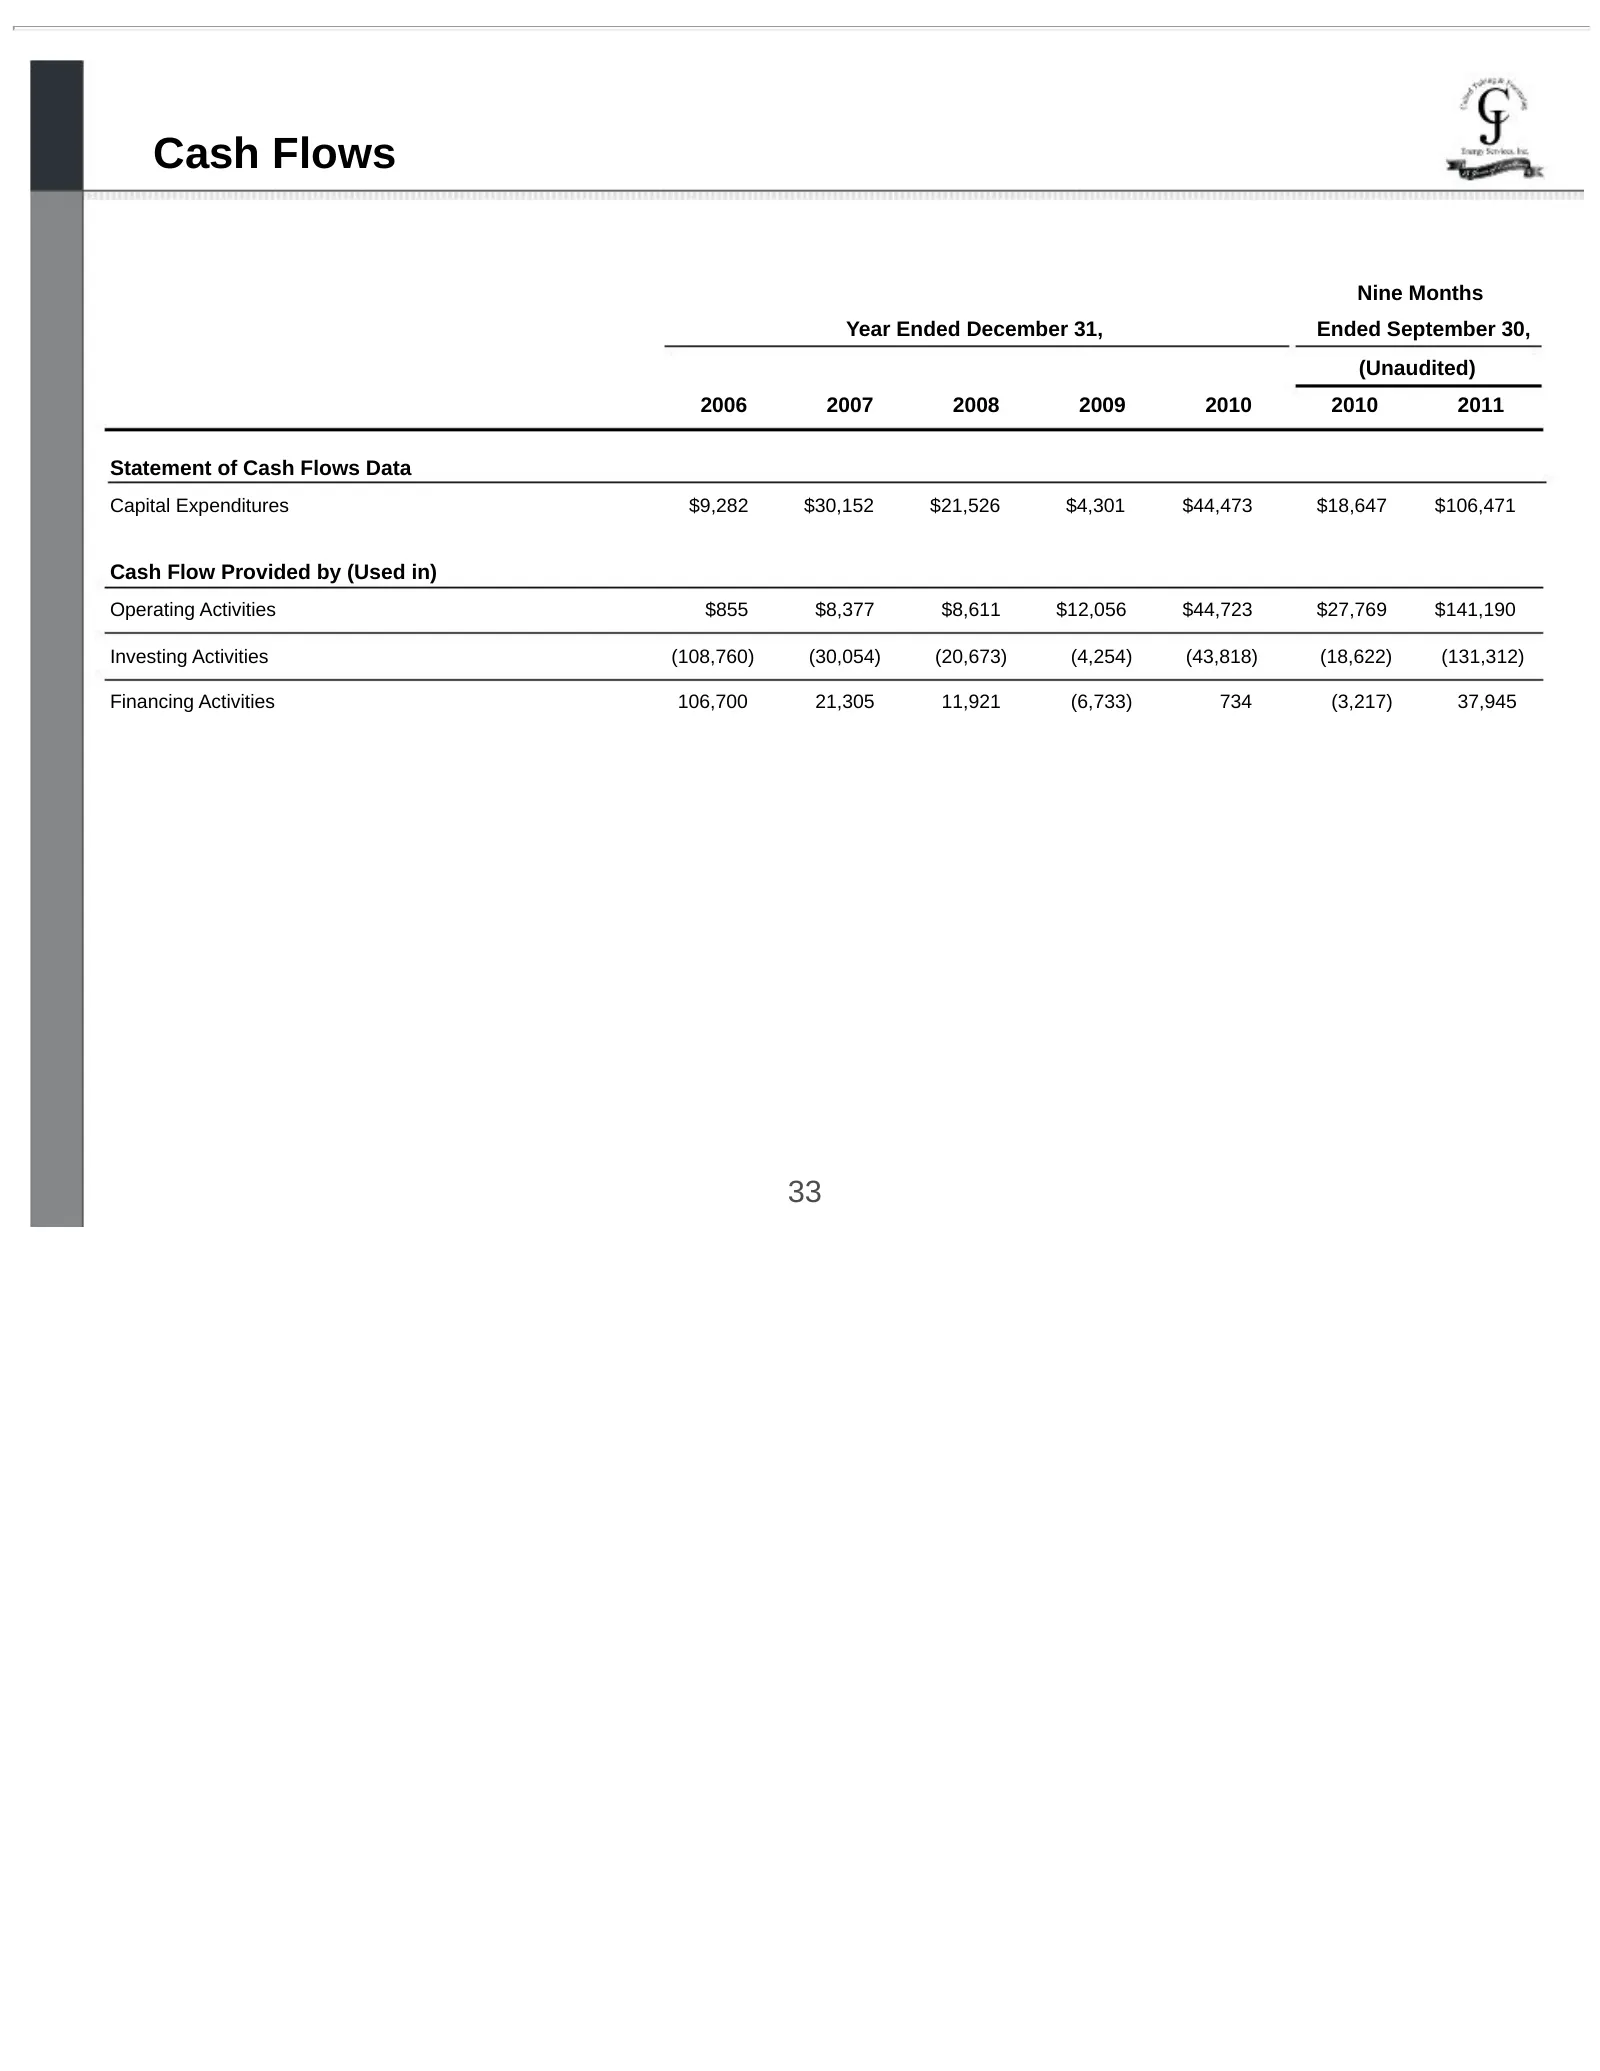
Cash Flows Nine Months Year Ended December 31, Ended September 30, (Unaudited) 2006 2007 2008 2009 2010 2010 2011 Statement of Cash Flows Data Capital Expenditures $9,282 $30,152 $21,526 $4,301 $44,473 $18,647 $106,471 Cash Flow Provided by (Used in) Operating Activities $855 $8,377 $8,611 $12,056 $
Slide 34: Balance Sheets
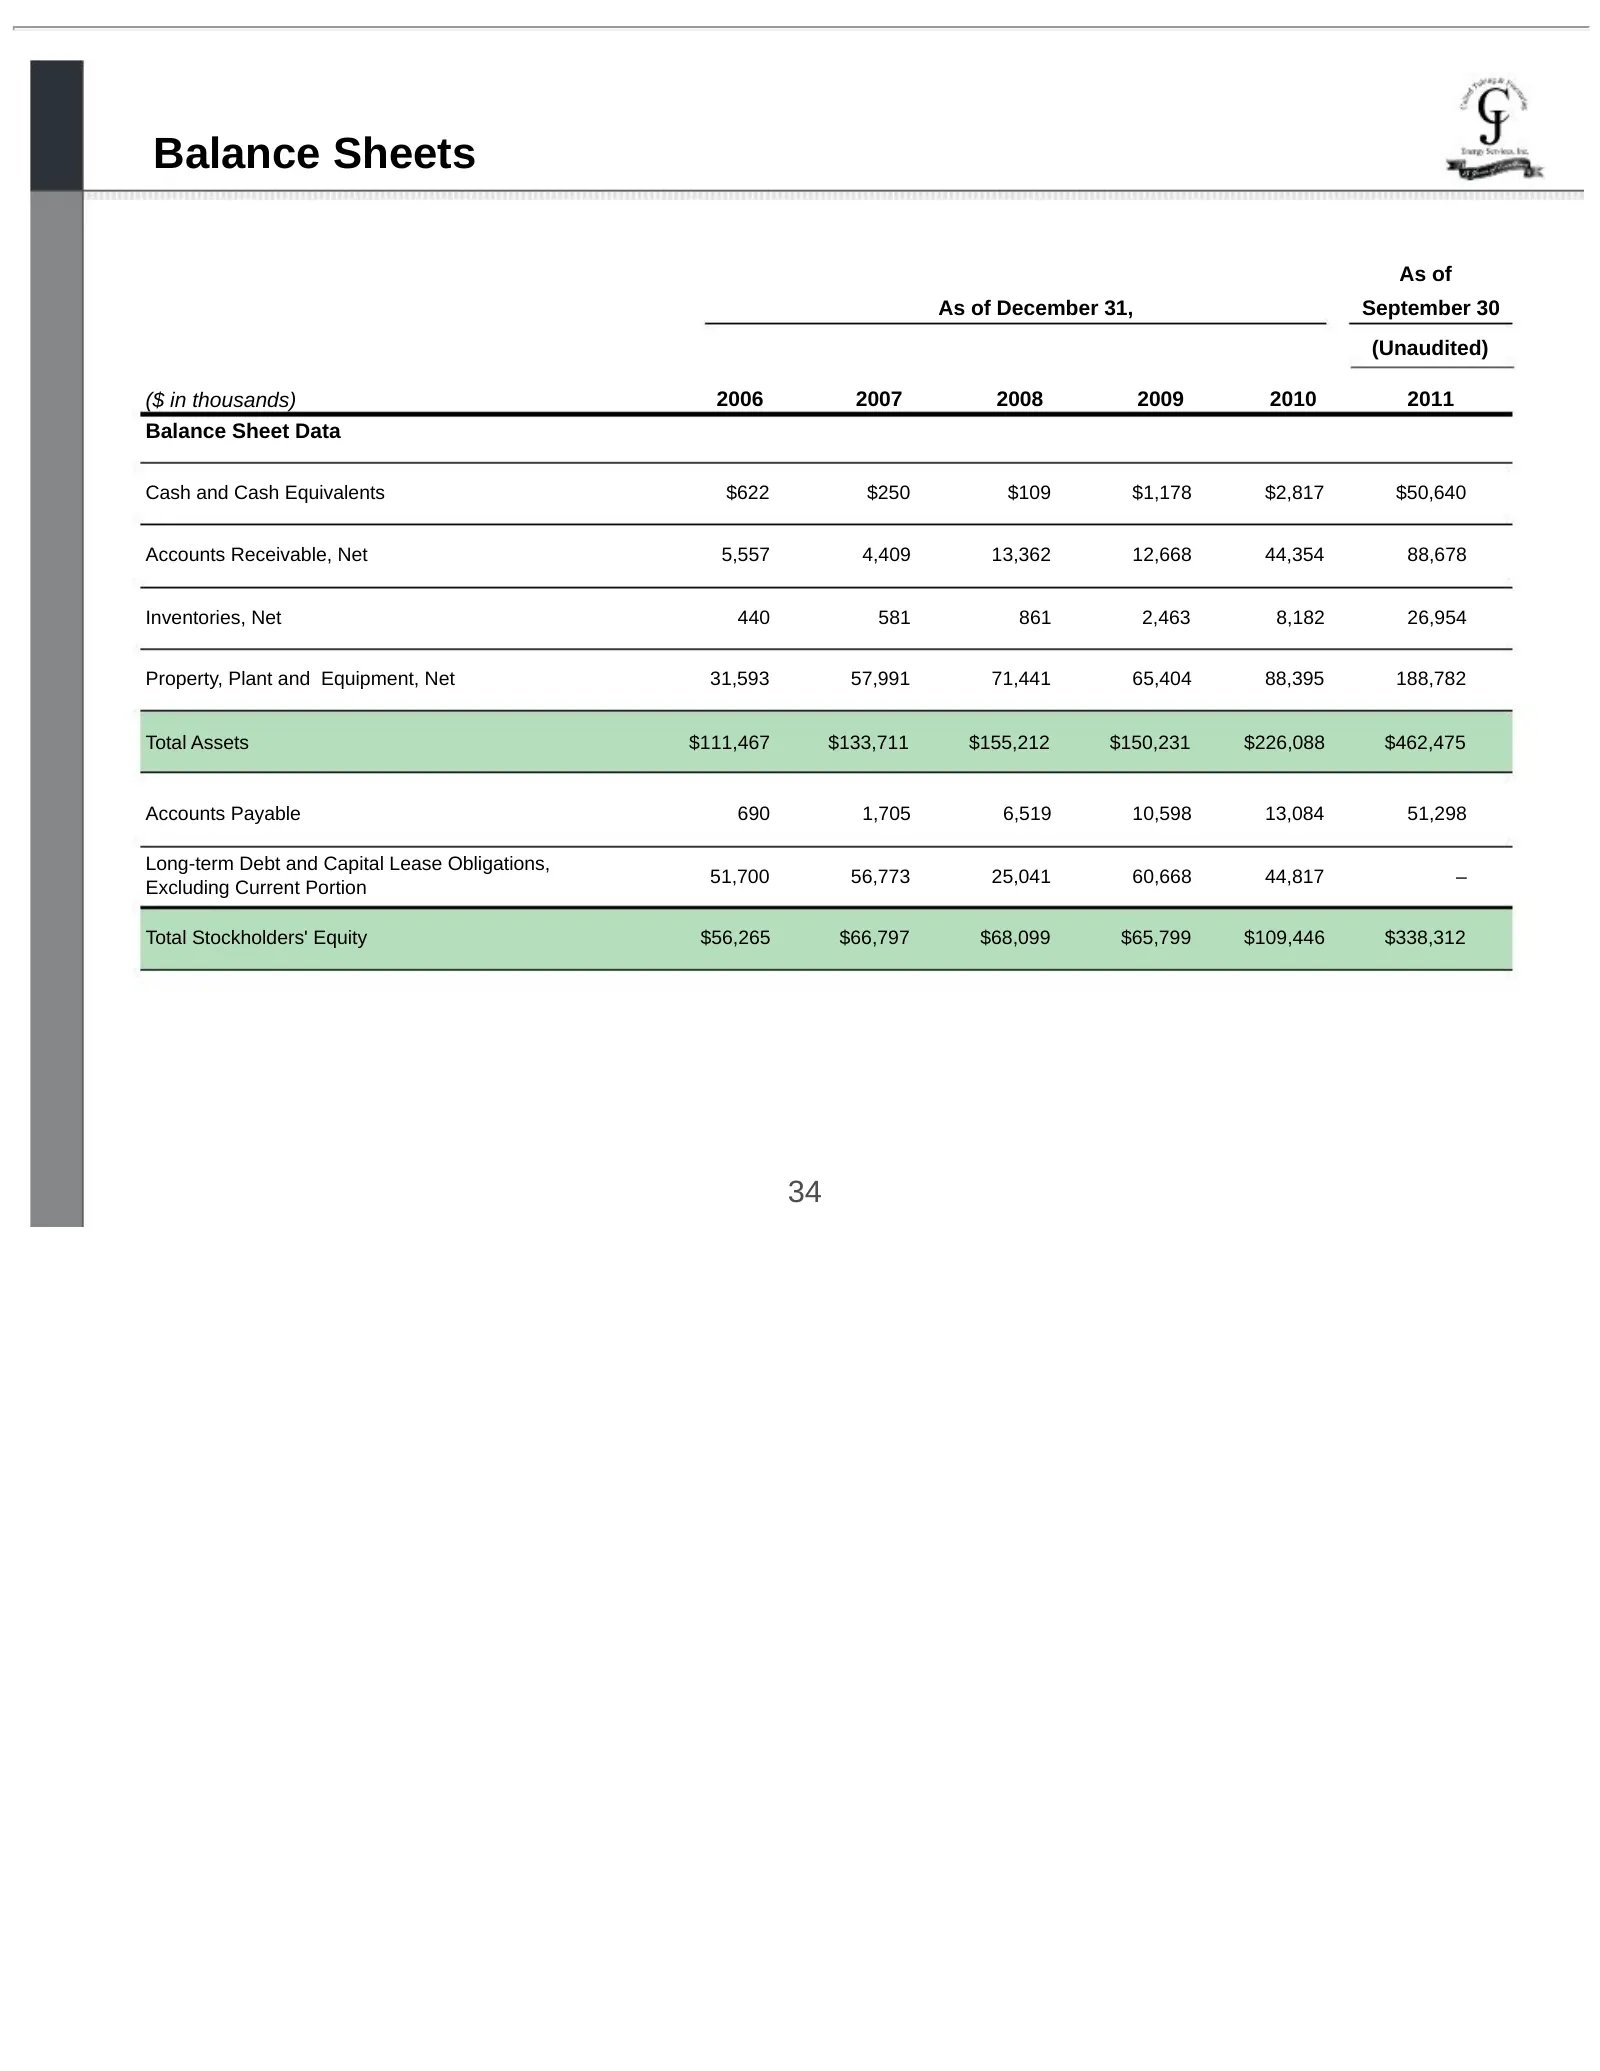
Balance Sheets As of As of December 31, September 30 (Unaudited) ($ in thousands) 2006 2007 2008 2009 2010 2011 Balance Sheet Data Cash and Cash Equivalents $622 $250 $109 $1,178 $2,817 $50,640 Accounts Receivable, Net 5,557 4,409 13,362 12,668 44,354 88,678 Inventories, Net 440 581 861 2,463 8,182
Slide 35: EBITDA Reconciliation
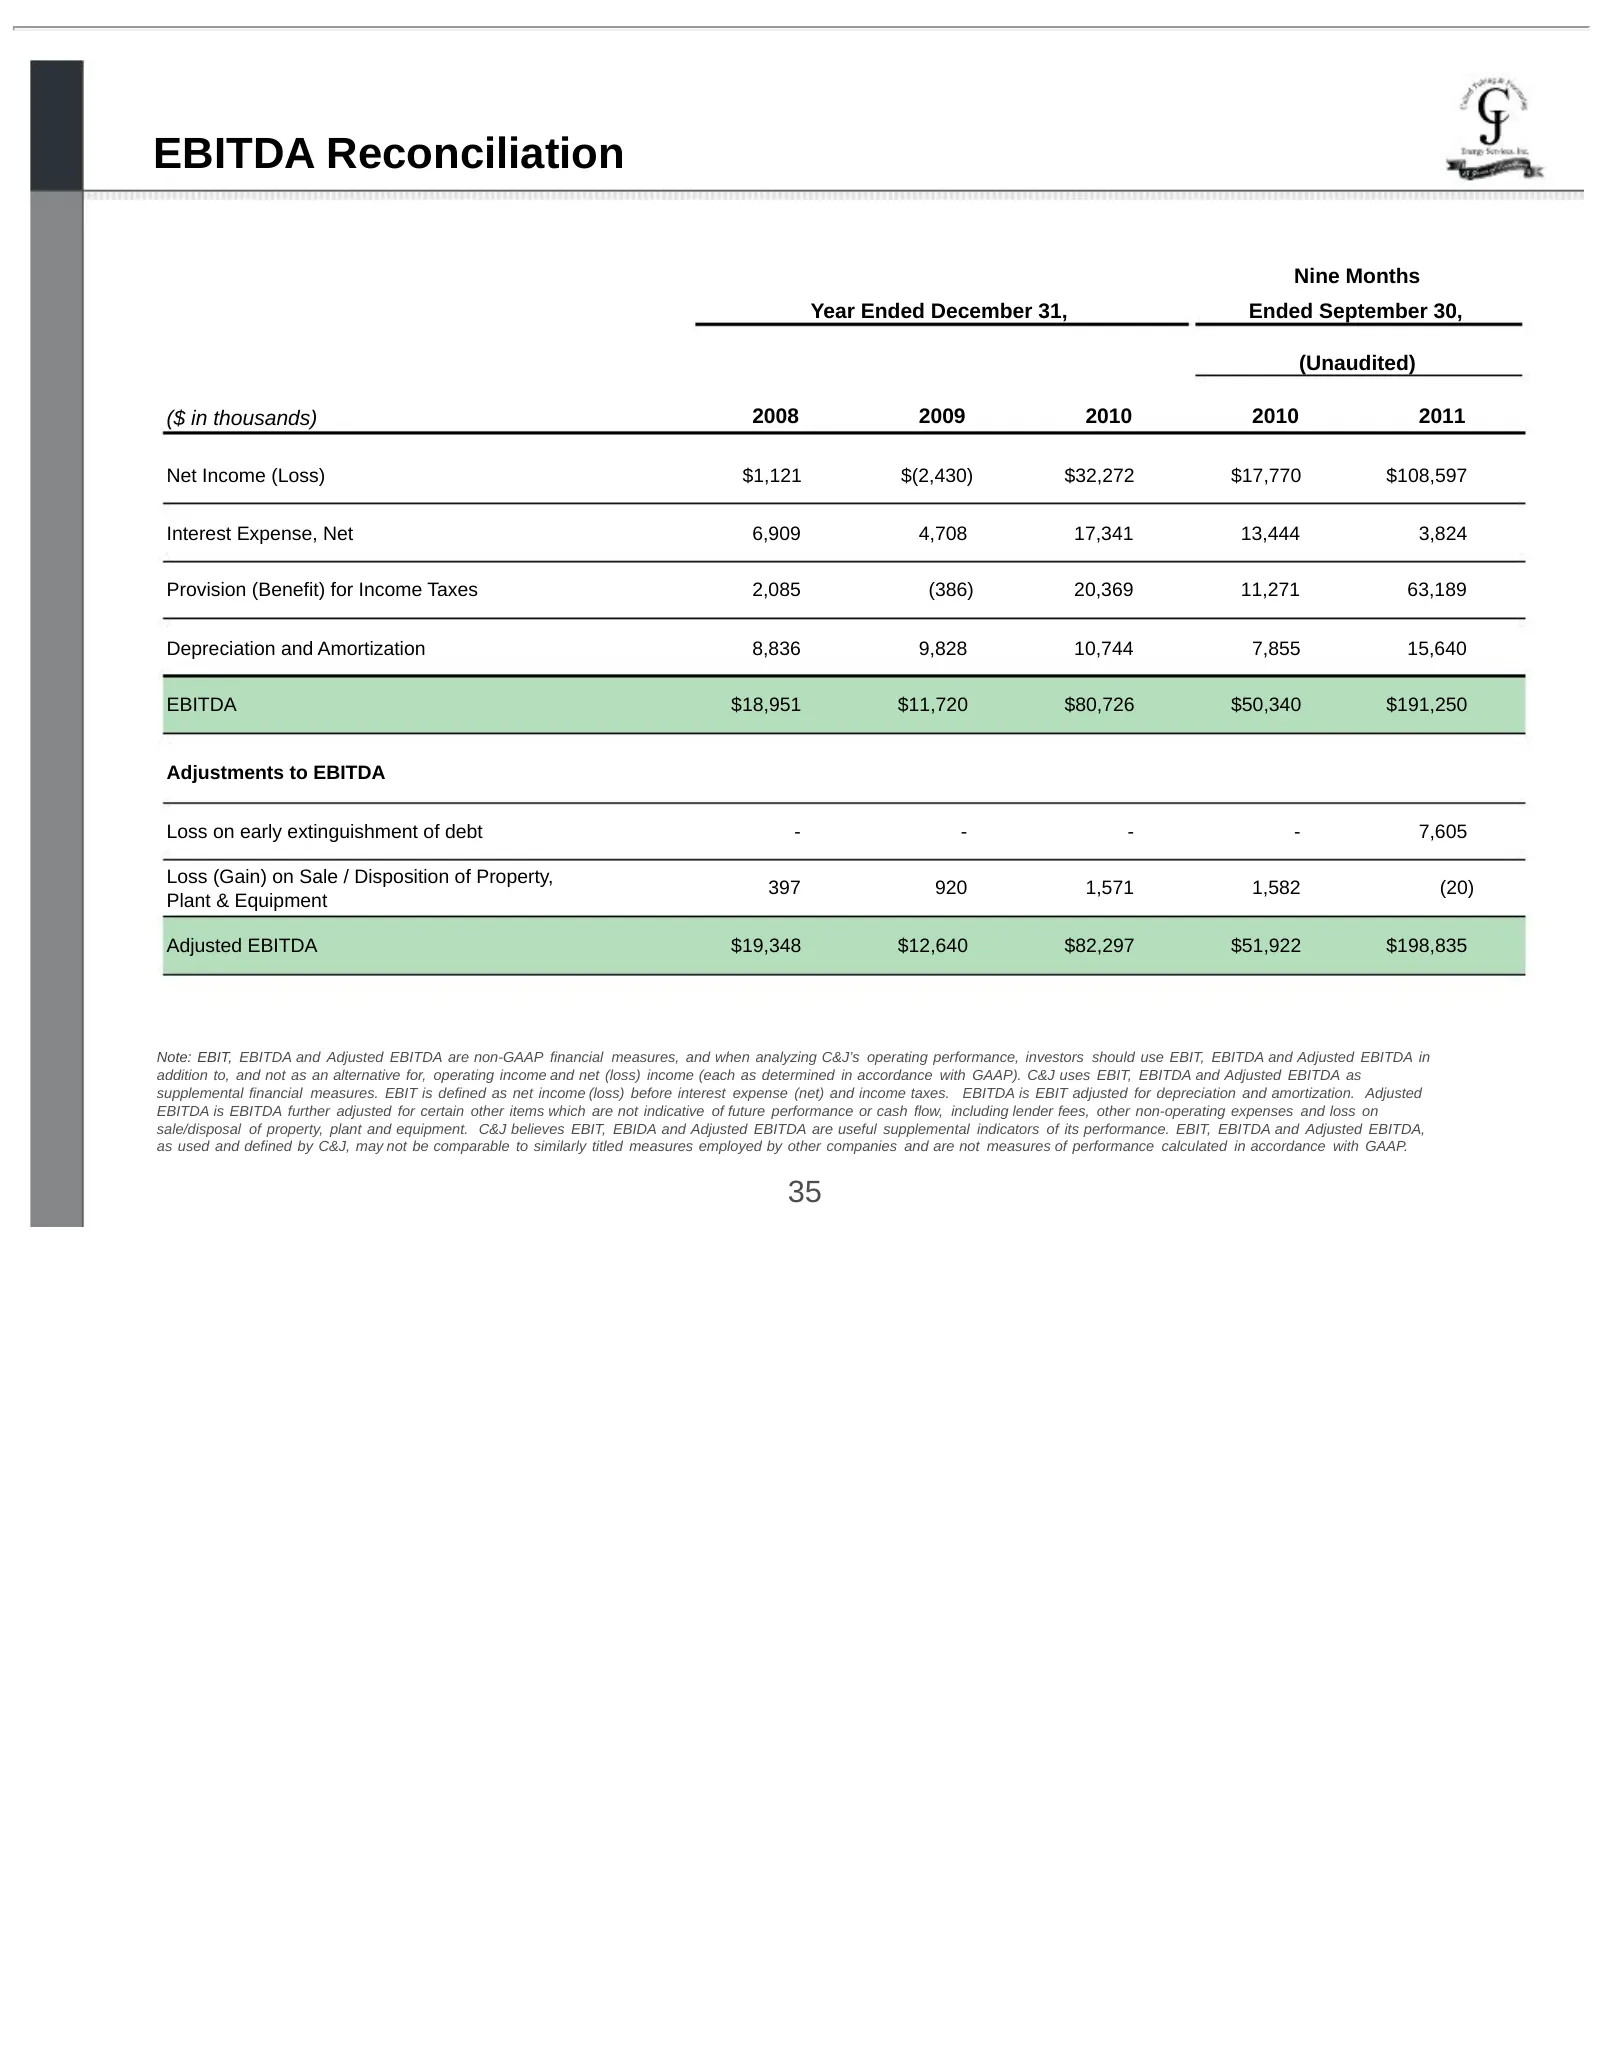
EBITDA Reconciliation Nine Months Year Ended December 31, Ended September 30, (Unaudited) ($ in thousands) 2008 2009 2010 2010 2011 Net Income (Loss) $1,121 $(2,430) $32,272 $17,770 $108,597 Interest Expense, Net 6,909 4,708 17,341 13,444 3,824 Provision (Benefit) for Income Taxes 2,085 (386) 20,369
Source: SEC EDGAR · 8-K filed Feb 9, 2012
More decks from C&J Energy Services Inc
 Barclays CEO Energy-Power Conference 201933 slides · Sep 3, 2019
 Q2 2019 Earnings Presentation42 slides · Aug 6, 2019
 Q2 2019 Earnings Presentation22 slides · Aug 6, 2019
 Merger or Acquisition (June 2019)20 slides · Jun 17, 2019
 Investor Presentation (May 2019)42 slides · May 14, 2019
 Q1 2019 Earnings Presentation21 slides · May 7, 2019