PHX Minerals — Investor Presentation (February 2023)
30 slides from PHX Minerals's investor presentation, Feb 8, 2023
Slide 1: Investor Presentation
Investor Presentation February 2022 NYSE: PHX Exhibit 99.2
Slide 2: Cautionary Statement Regarding Forward-Looking Statements
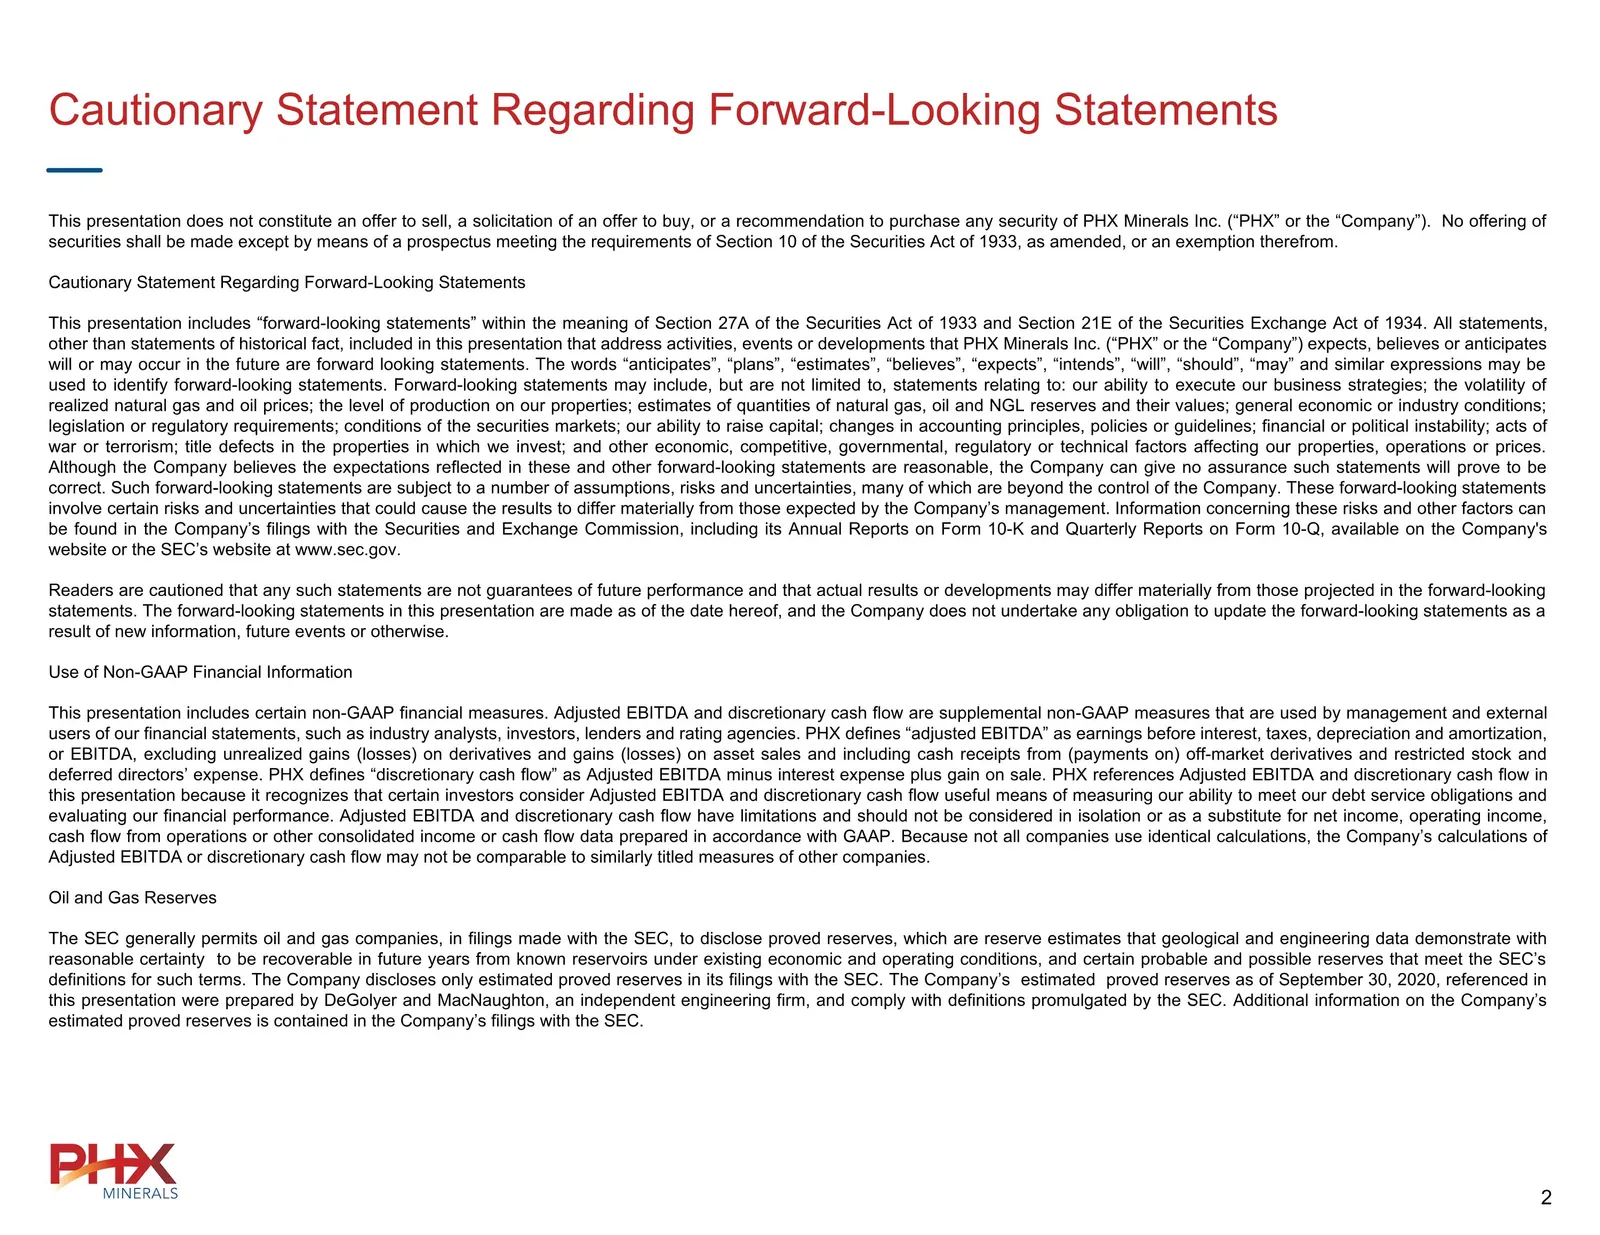
Cautionary Statement Regarding Forward-Looking Statements This presentation does not constitute an offer to sell, a solicitation of an offer to buy, or a recommendation to purchase any security of PHX Minerals Inc. (“PHX” or the “Company”). No offering of securities shall be made except by means of
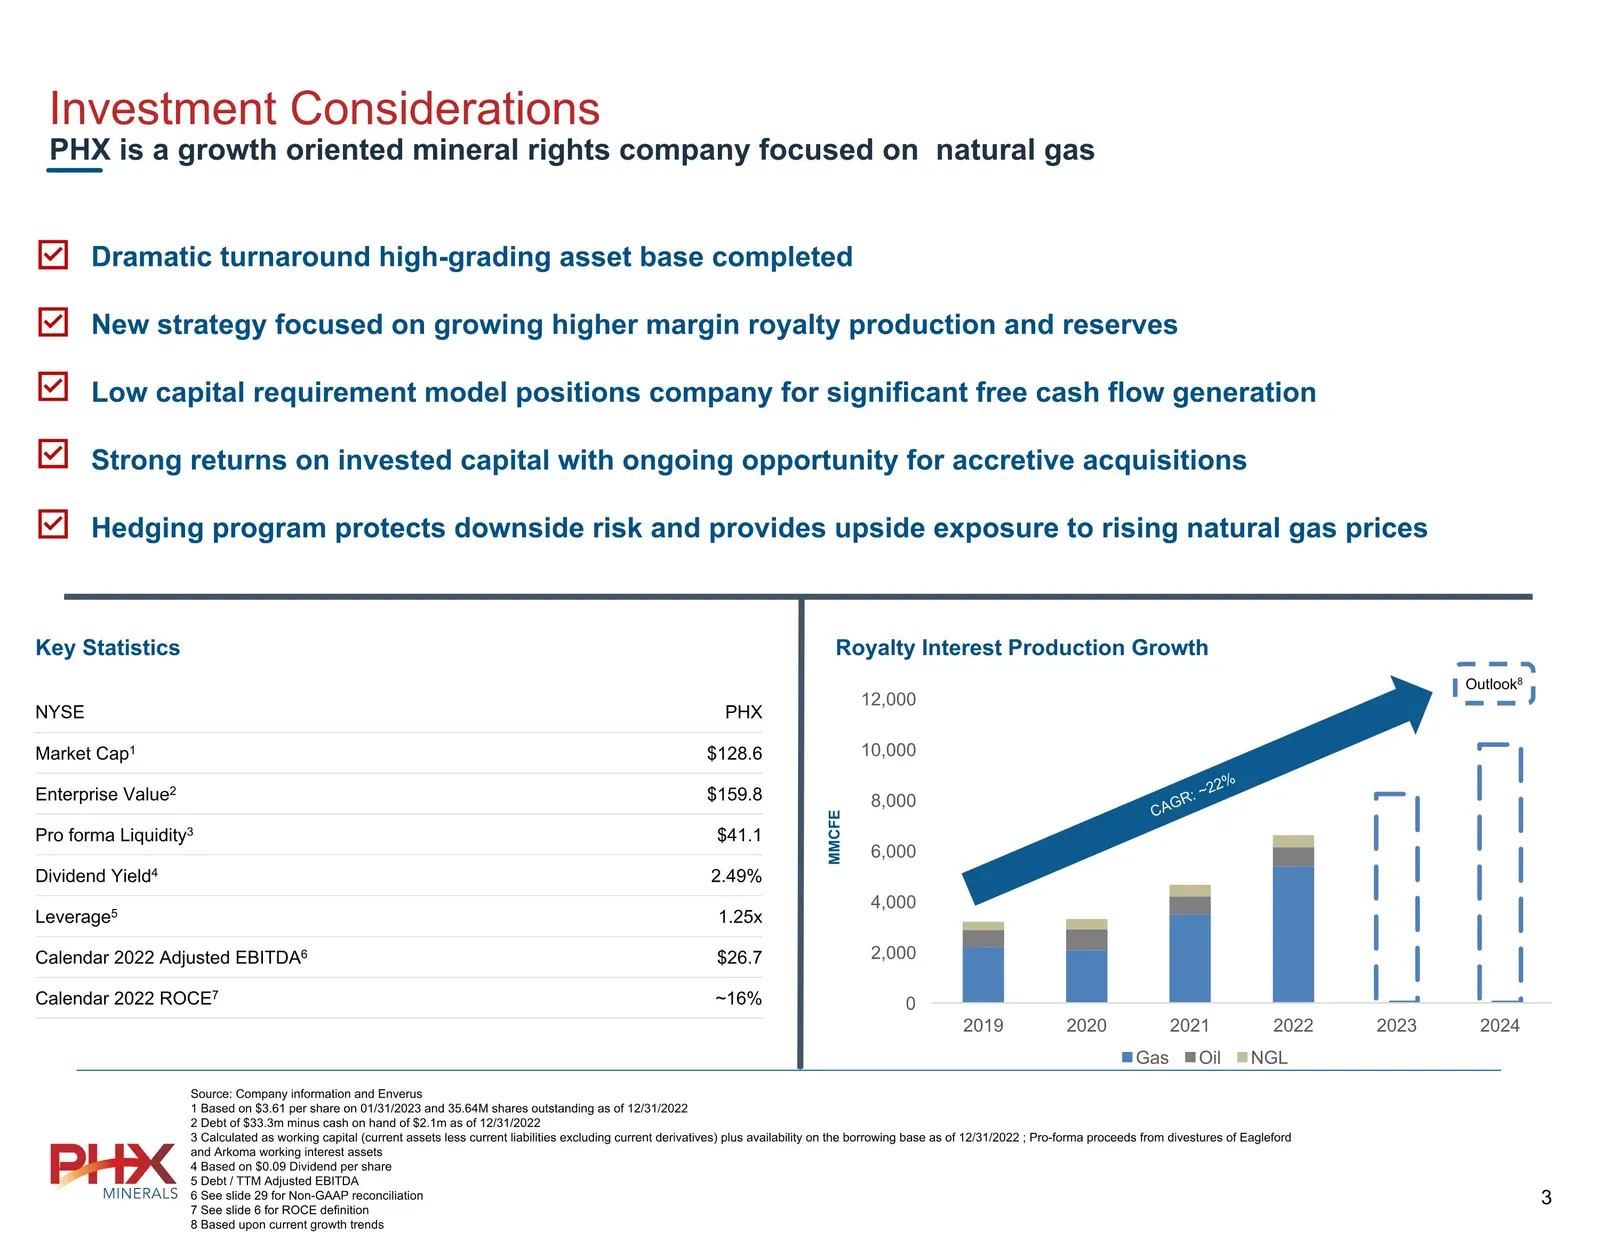
Slide 3: Investment Considerations and Key Statistics
Source: Company information and Enverus 1 Based on $3.61 per share on 01/31/2023 and 35.64M shares outstanding as of 12/31/2022 2 Debt of $33.3m minus cash on hand of $2.1m as of 12/31/2022 3 Calculated as working capital (current assets less current liabilities excluding current derivatives) plus a
Slide 4: Corporate Highlights
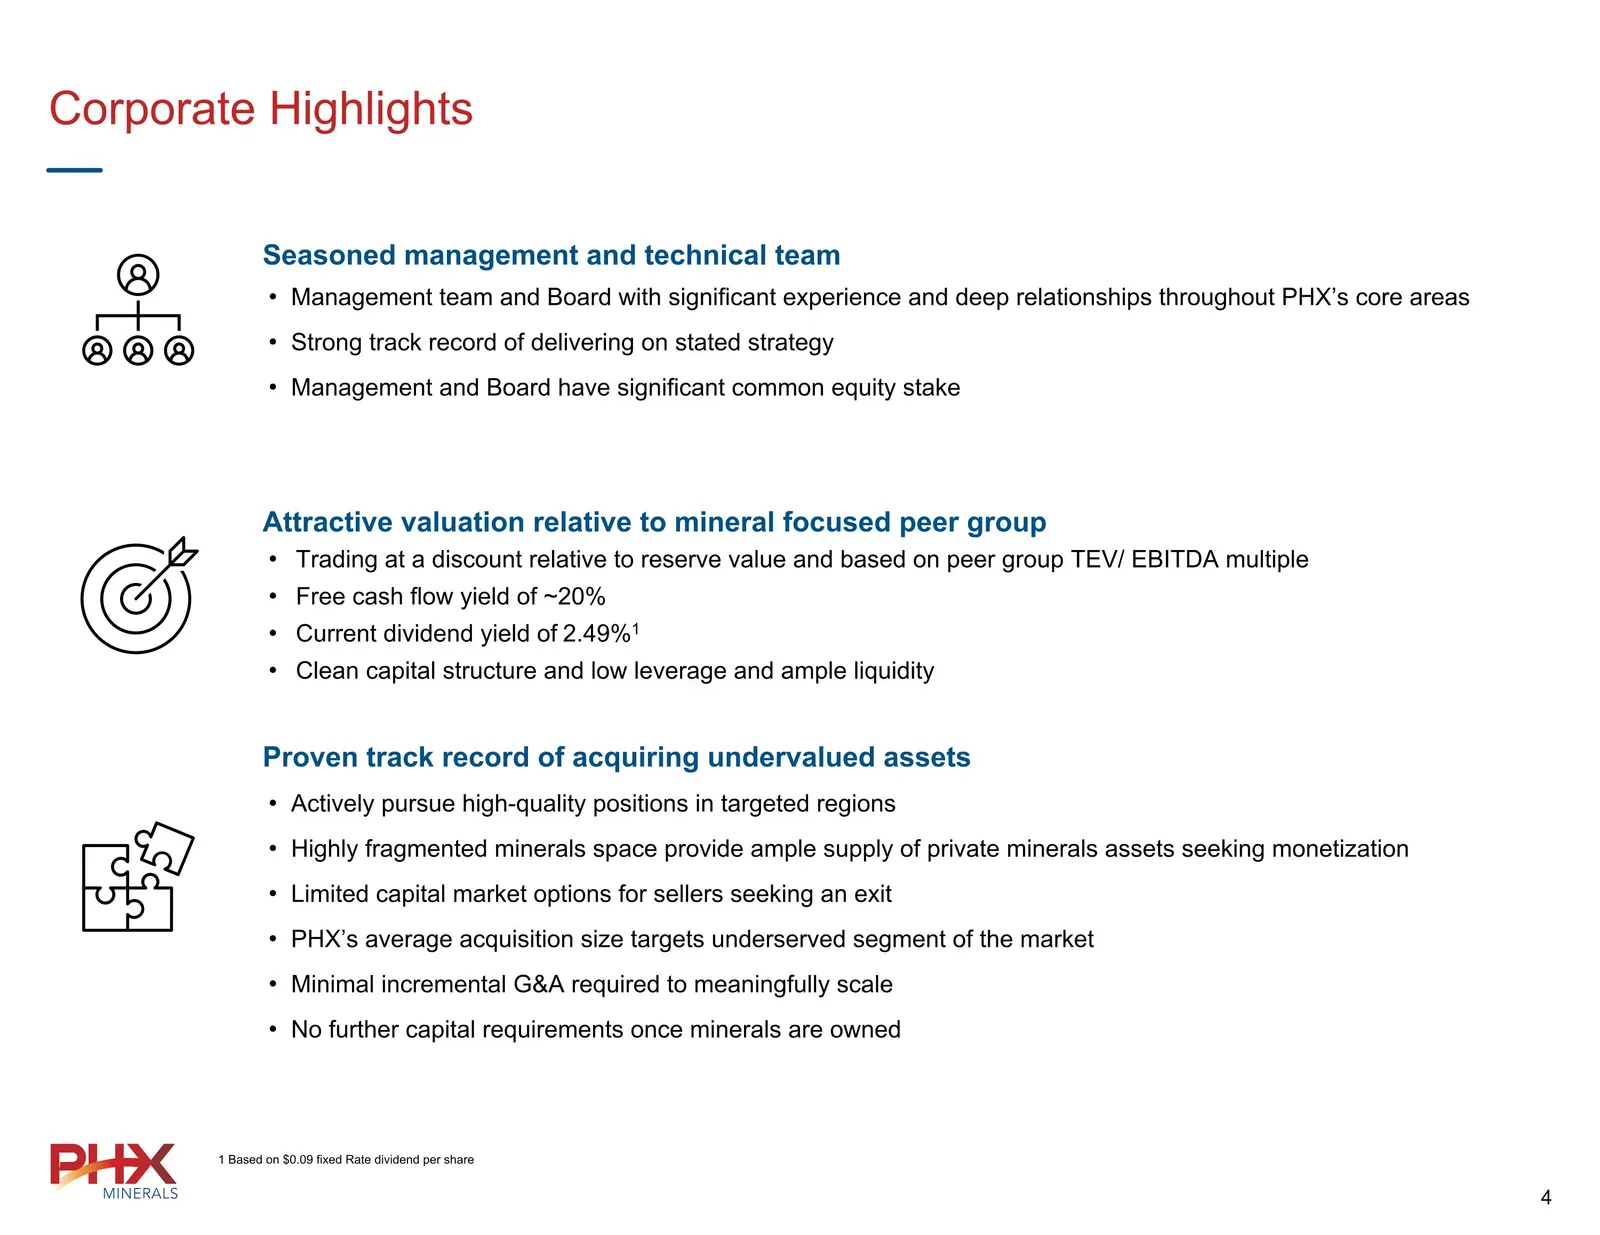
Corporate Highlights Seasoned management and technical team Management team and Board with significant experience and deep relationships throughout PHX’s core areas Strong track record of delivering on stated strategy Management and Board have significant common equity stake Attractive valuation rel
Slide 5: Strategy Execution
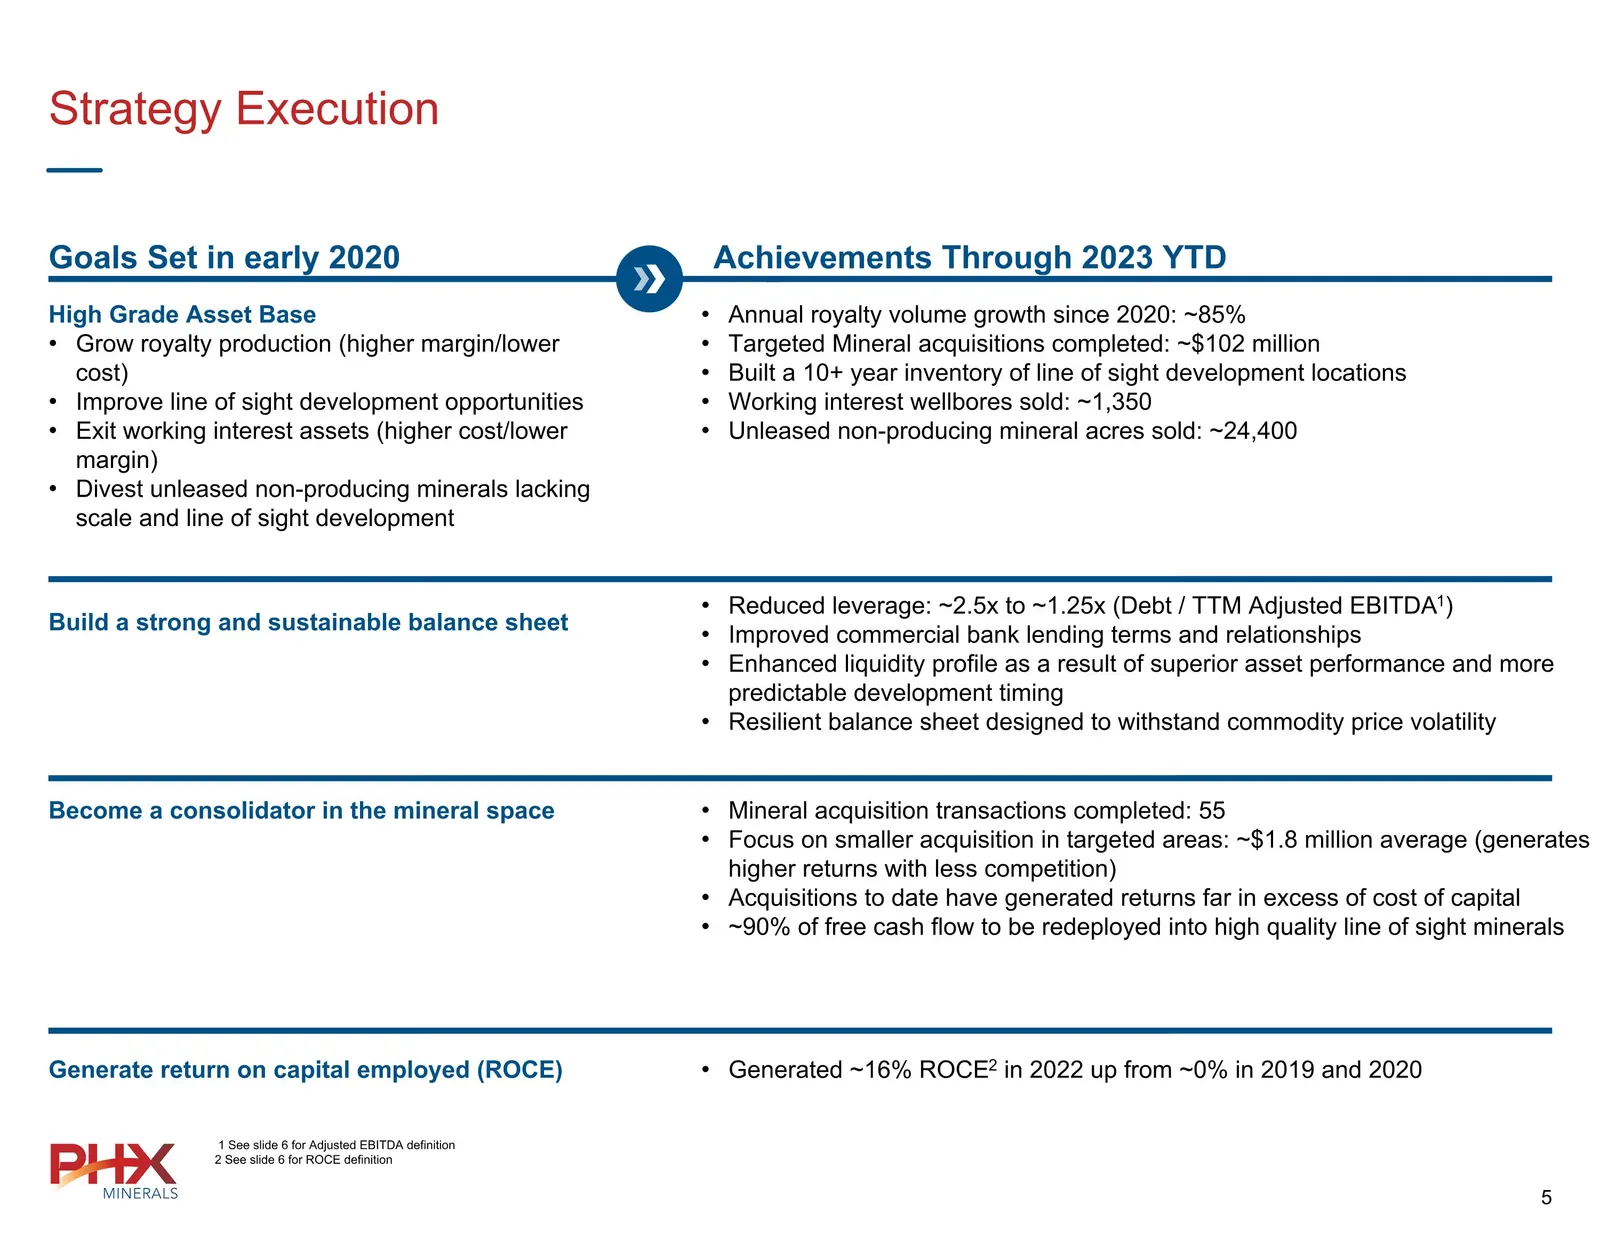
Strategy Execution Goals Set in early 2020 Achievements Through 2023 YTD High Grade Asset Base Grow royalty production (higher margin/lower cost) Improve line of sight development opportunities Exit working interest assets (higher cost/lower margin) Divest unleased non-producing minerals lacking sca
Slide 6: Royalty Cash Flow Driving Shareholder Value
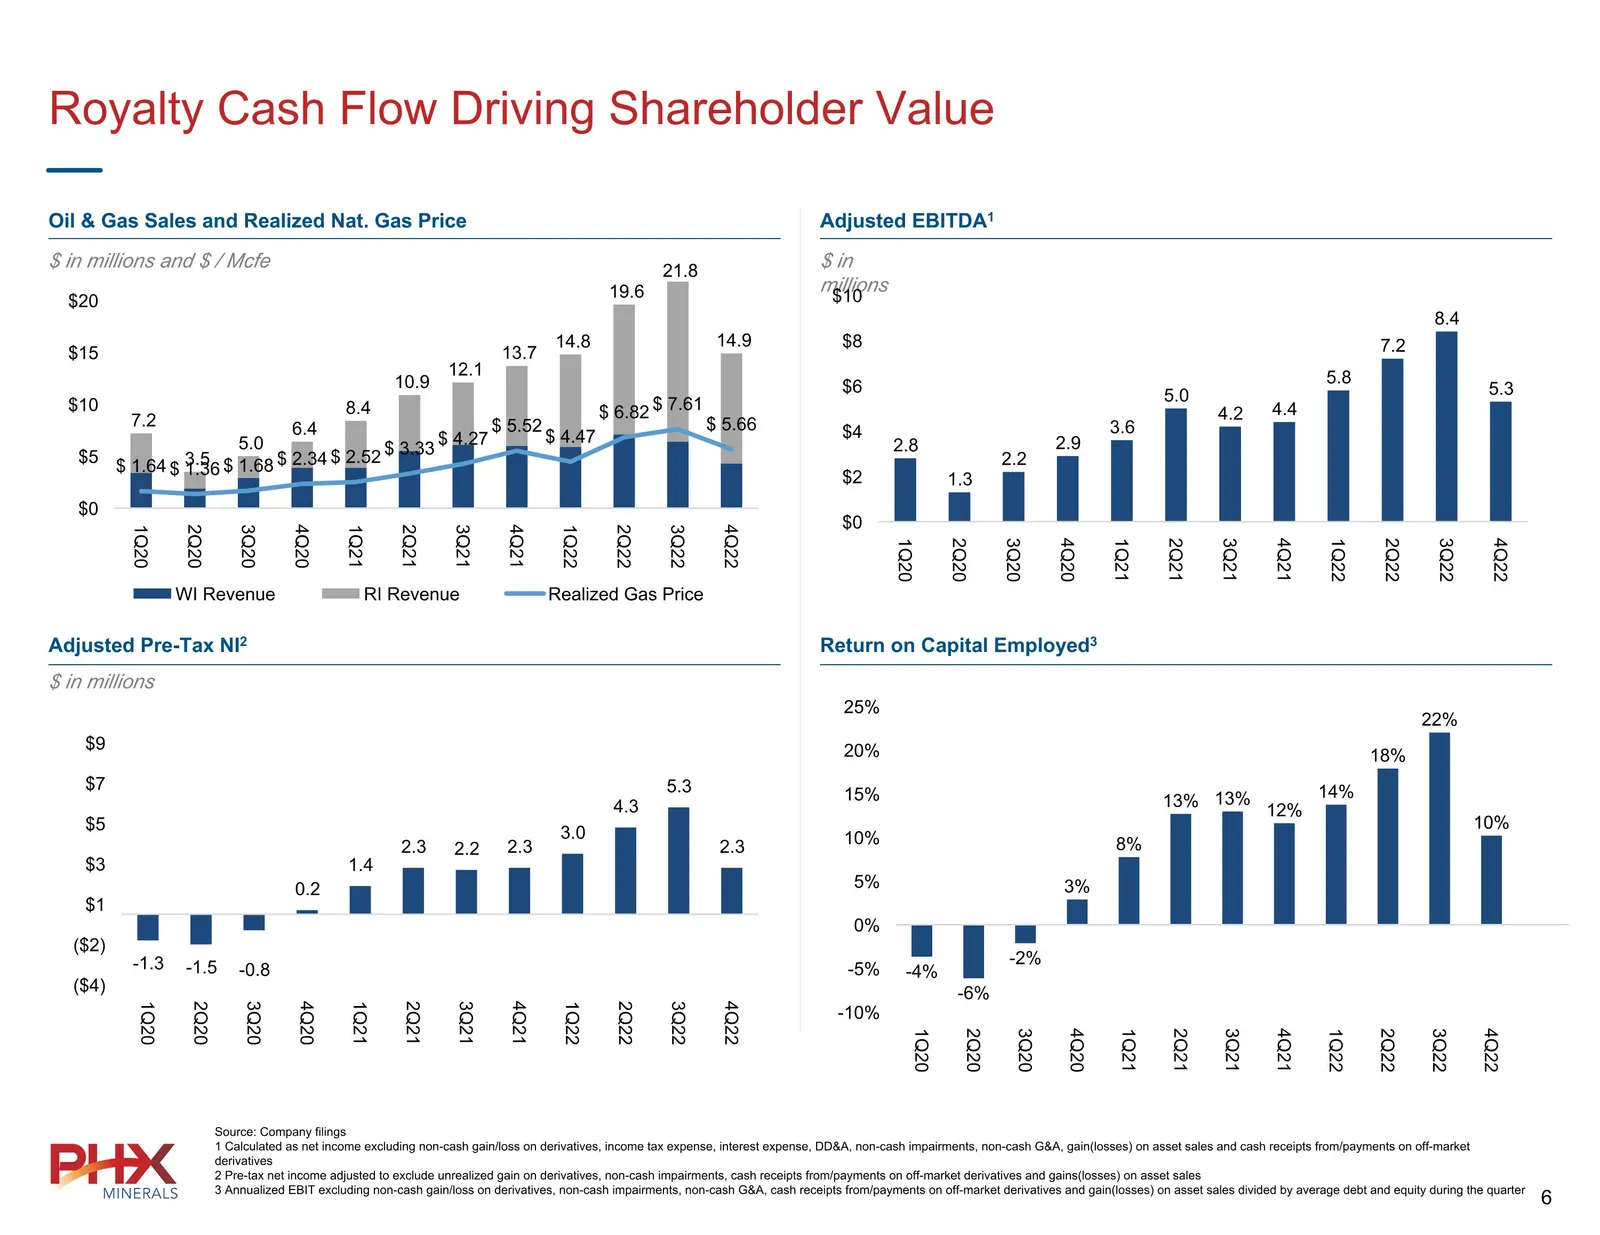
Royalty Cash Flow Driving Shareholder Value Oil & Gas Sales and Realized Nat. Gas Price Adjusted EBITDA1 Adjusted Pre-Tax NI2 Return on Capital Employed3 $ in millions and $ / Mcfe $ in millions $ in millions Source: Company filings 1 Calculated as net income excluding non-cash gain/loss on derivati
Slide 7: Stable Balance Sheet & Ample Liquidity
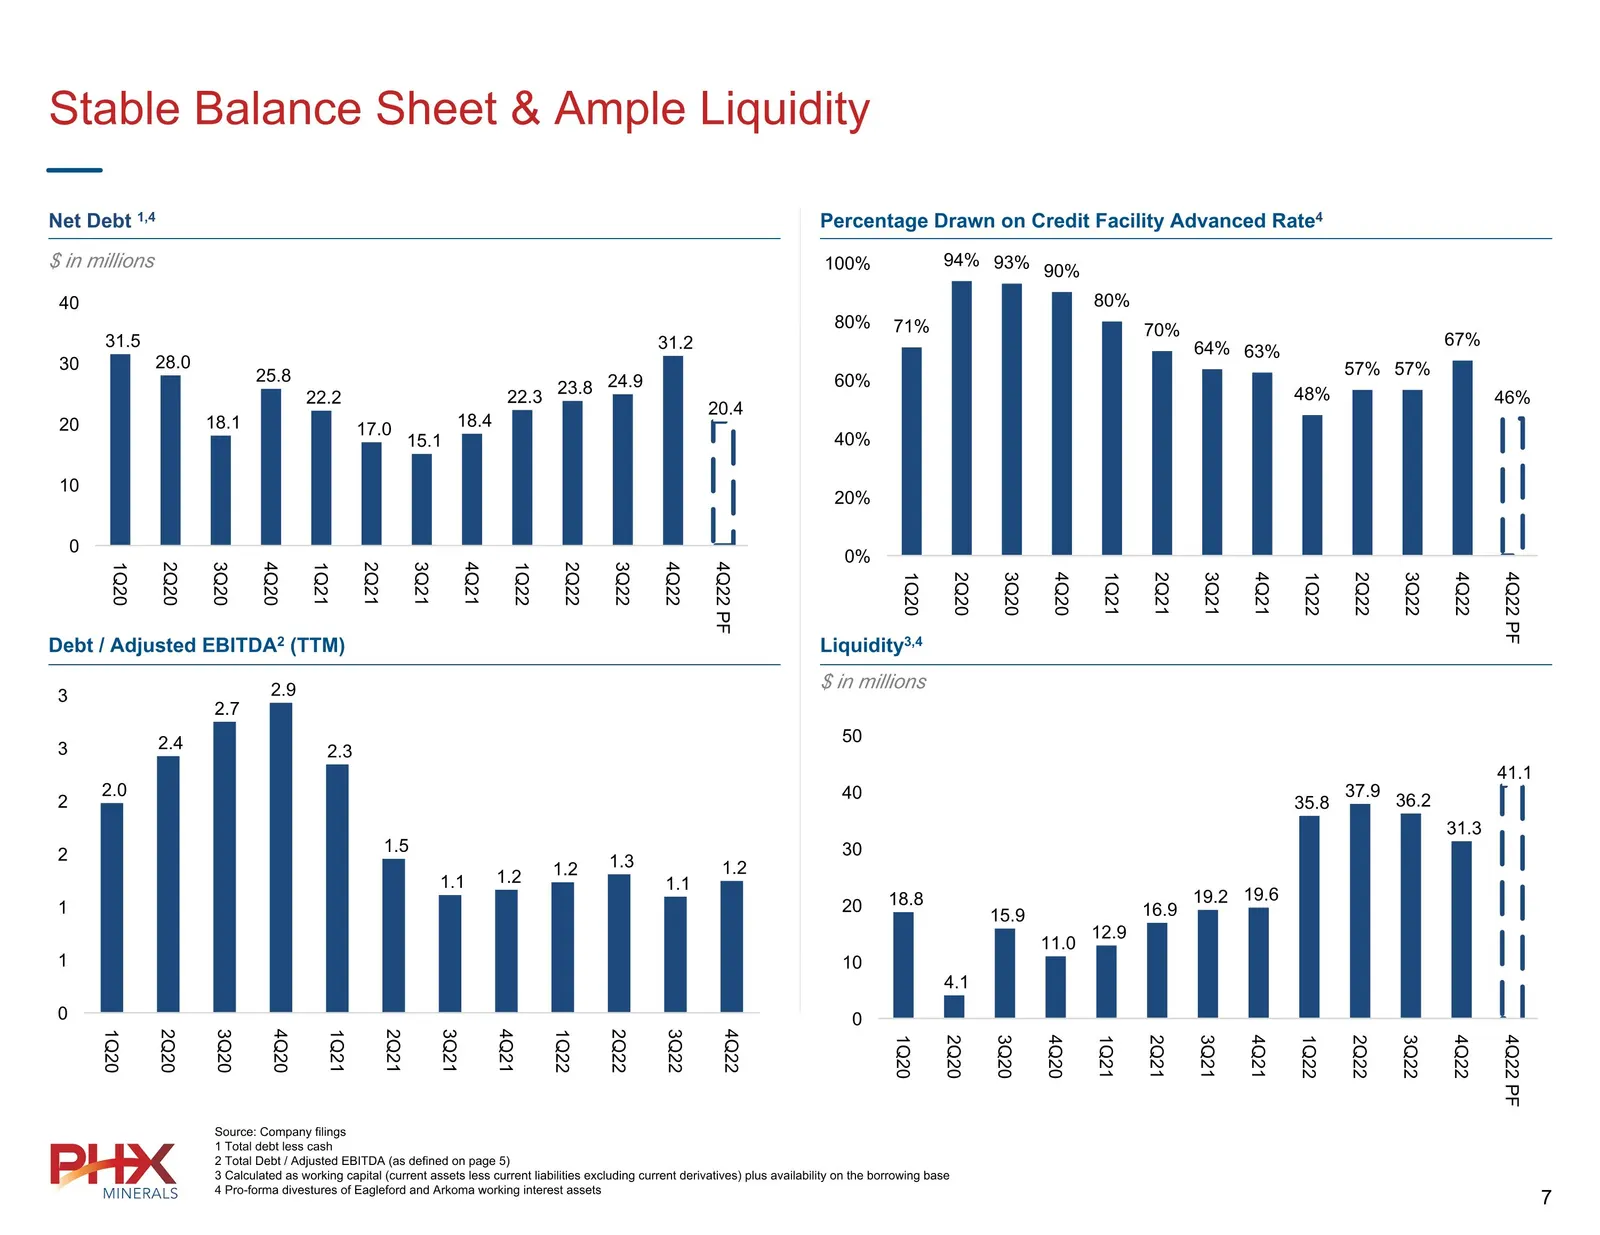
Stable Balance Sheet & Ample Liquidity Net Debt 1,4 Percentage Drawn on Credit Facility Advanced Rate4 Debt / Adjusted EBITDA2 (TTM) Liquidity3,4 $ in millions $ in millions Source: Company filings 1 Total debt less cash 2 Total Debt / Adjusted EBITDA (as defined on page 5) 3 Calculated as working c
Slide 8: PHX Operational Outlook
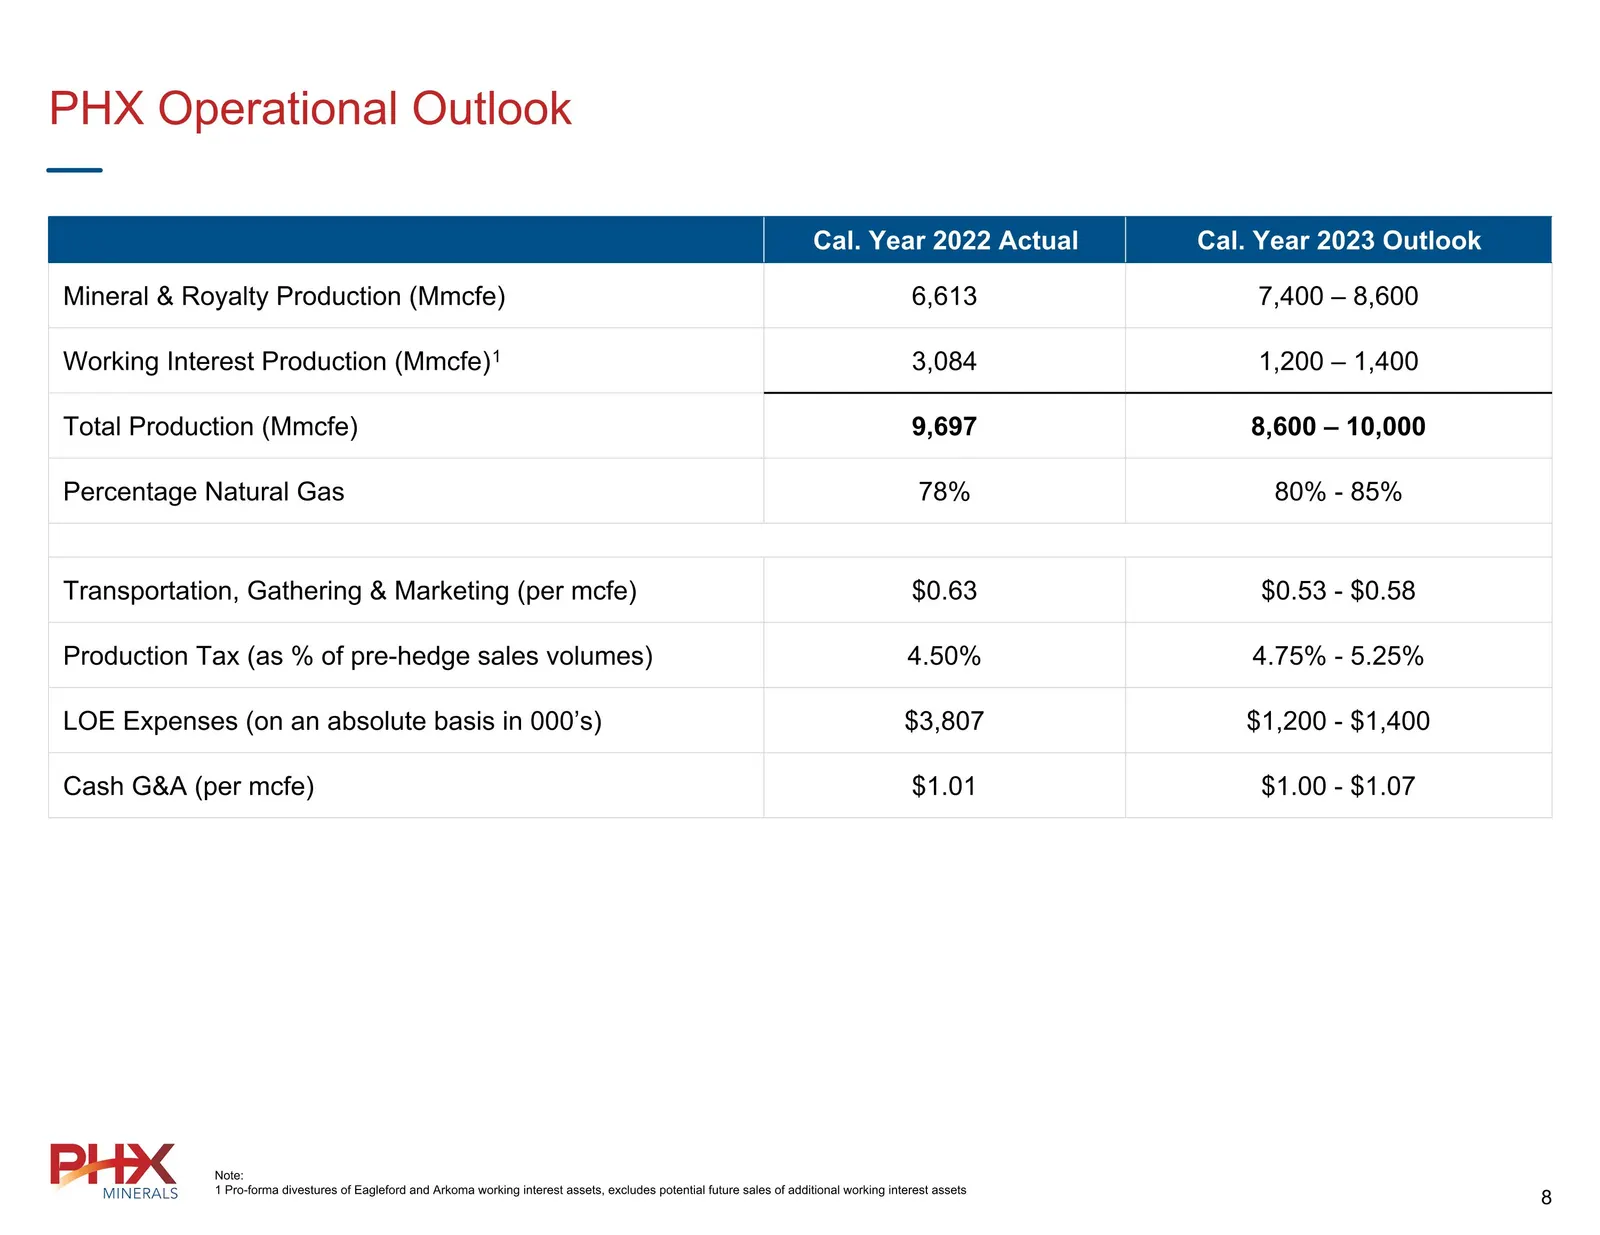
PHX Operational Outlook Note: 1 Pro-forma divestures of Eagleford and Arkoma working interest assets, excludes potential future sales of additional working interest assets Cal. Year 2022 Actual Cal. Year 2023 Outlook Mineral & Royalty Production (Mmcfe) 6,613 7,400 – 8,600 Working Interest Productio
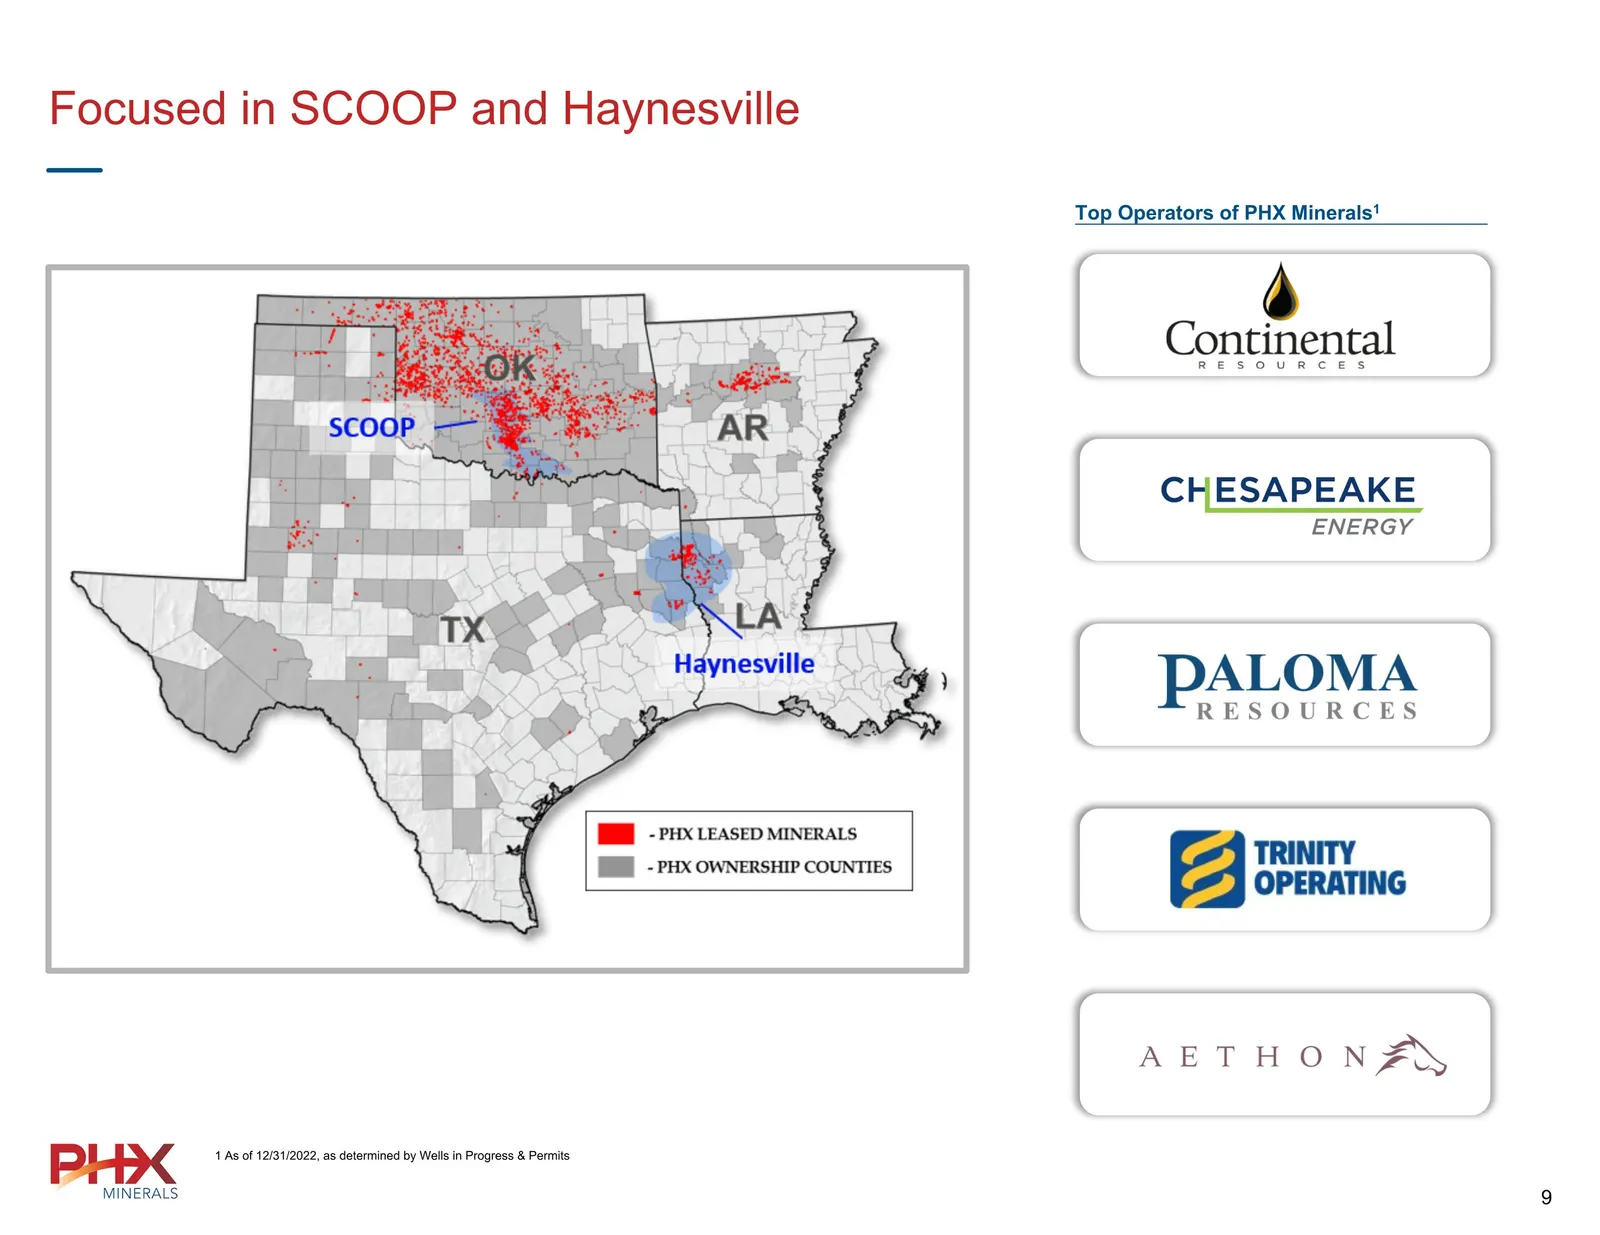
Slide 9: Focused in SCOOP and Haynesville
Focused in SCOOP and Haynesville Top Operators of PHX Minerals1 1 As of 12/31/2022, as determined by Wells in Progress & Permits
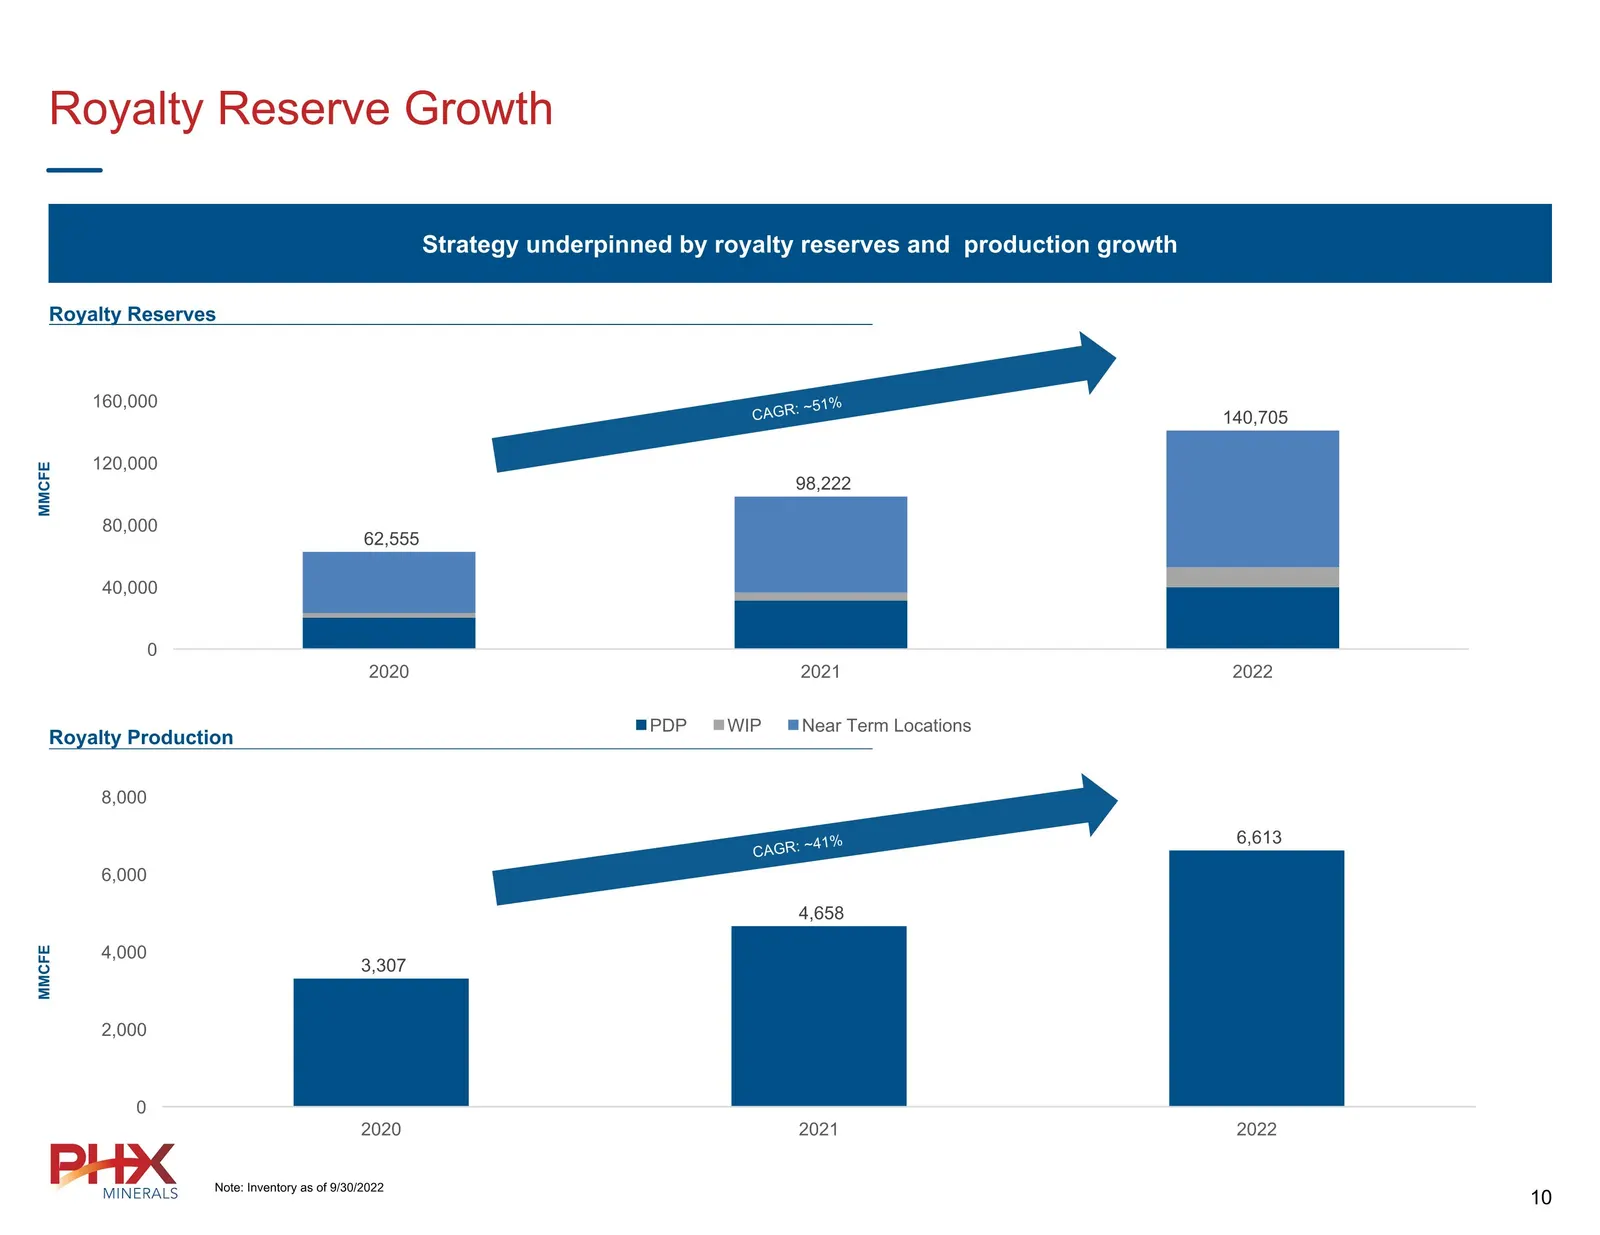
Slide 10: Royalty Reserve Growth
Royalty Reserve Growth Strategy underpinned by royalty reserves and production growth Royalty Reserves Royalty Production MMCFE CAGR: ~51% MMCFE CAGR: ~41% Note: Inventory as of 9/30/2022
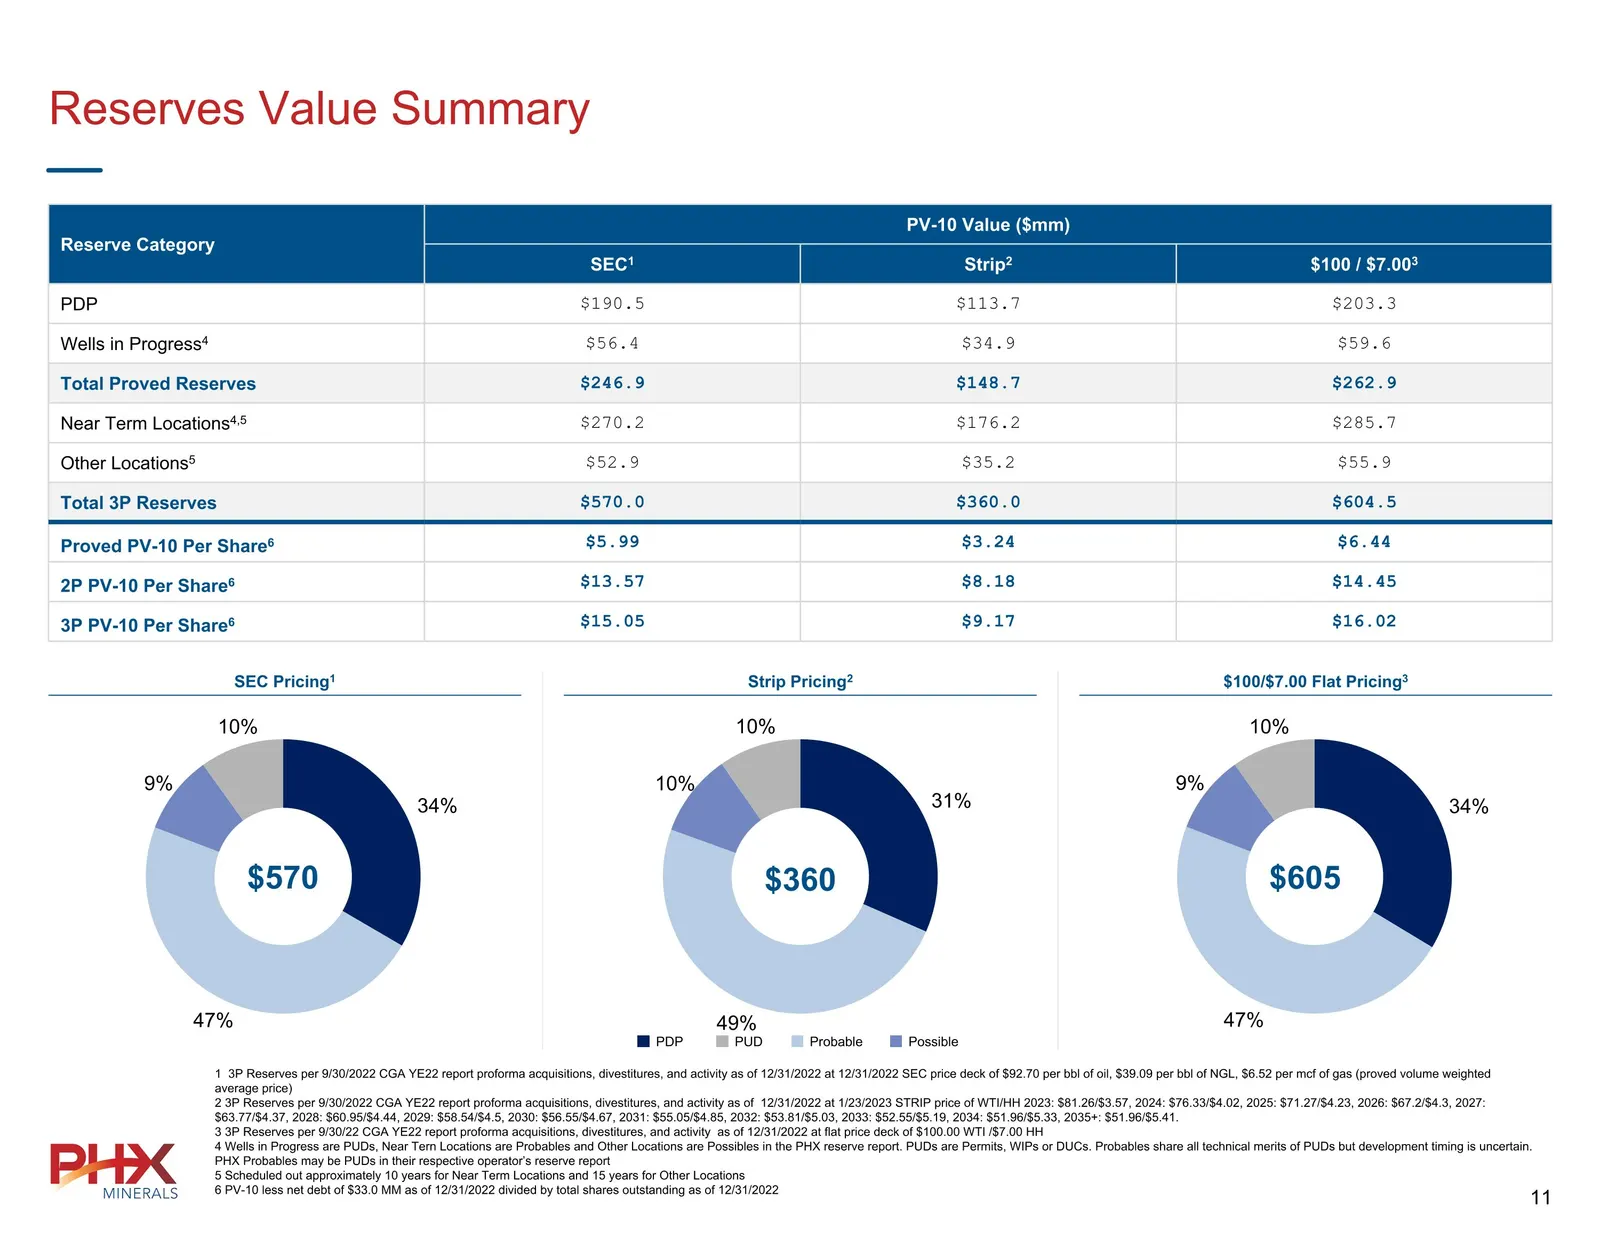
Slide 11: Reserves Value Summary
Reserves Value Summary SEC Pricing1 Strip Pricing2 $100/$7.00 Flat Pricing3 Reserve Category PV-10 Value ($mm) Reserve Category SEC1 Strip2 $100 / $7.003 PDP $190.5 $113.7 $203.3 Wells in Progress4 $56.4 $34.9 $59.6 Total Proved Reserves $246.9 $148.7 $262.9 Near Term Locations4,5 $270.2 $176.2 $285
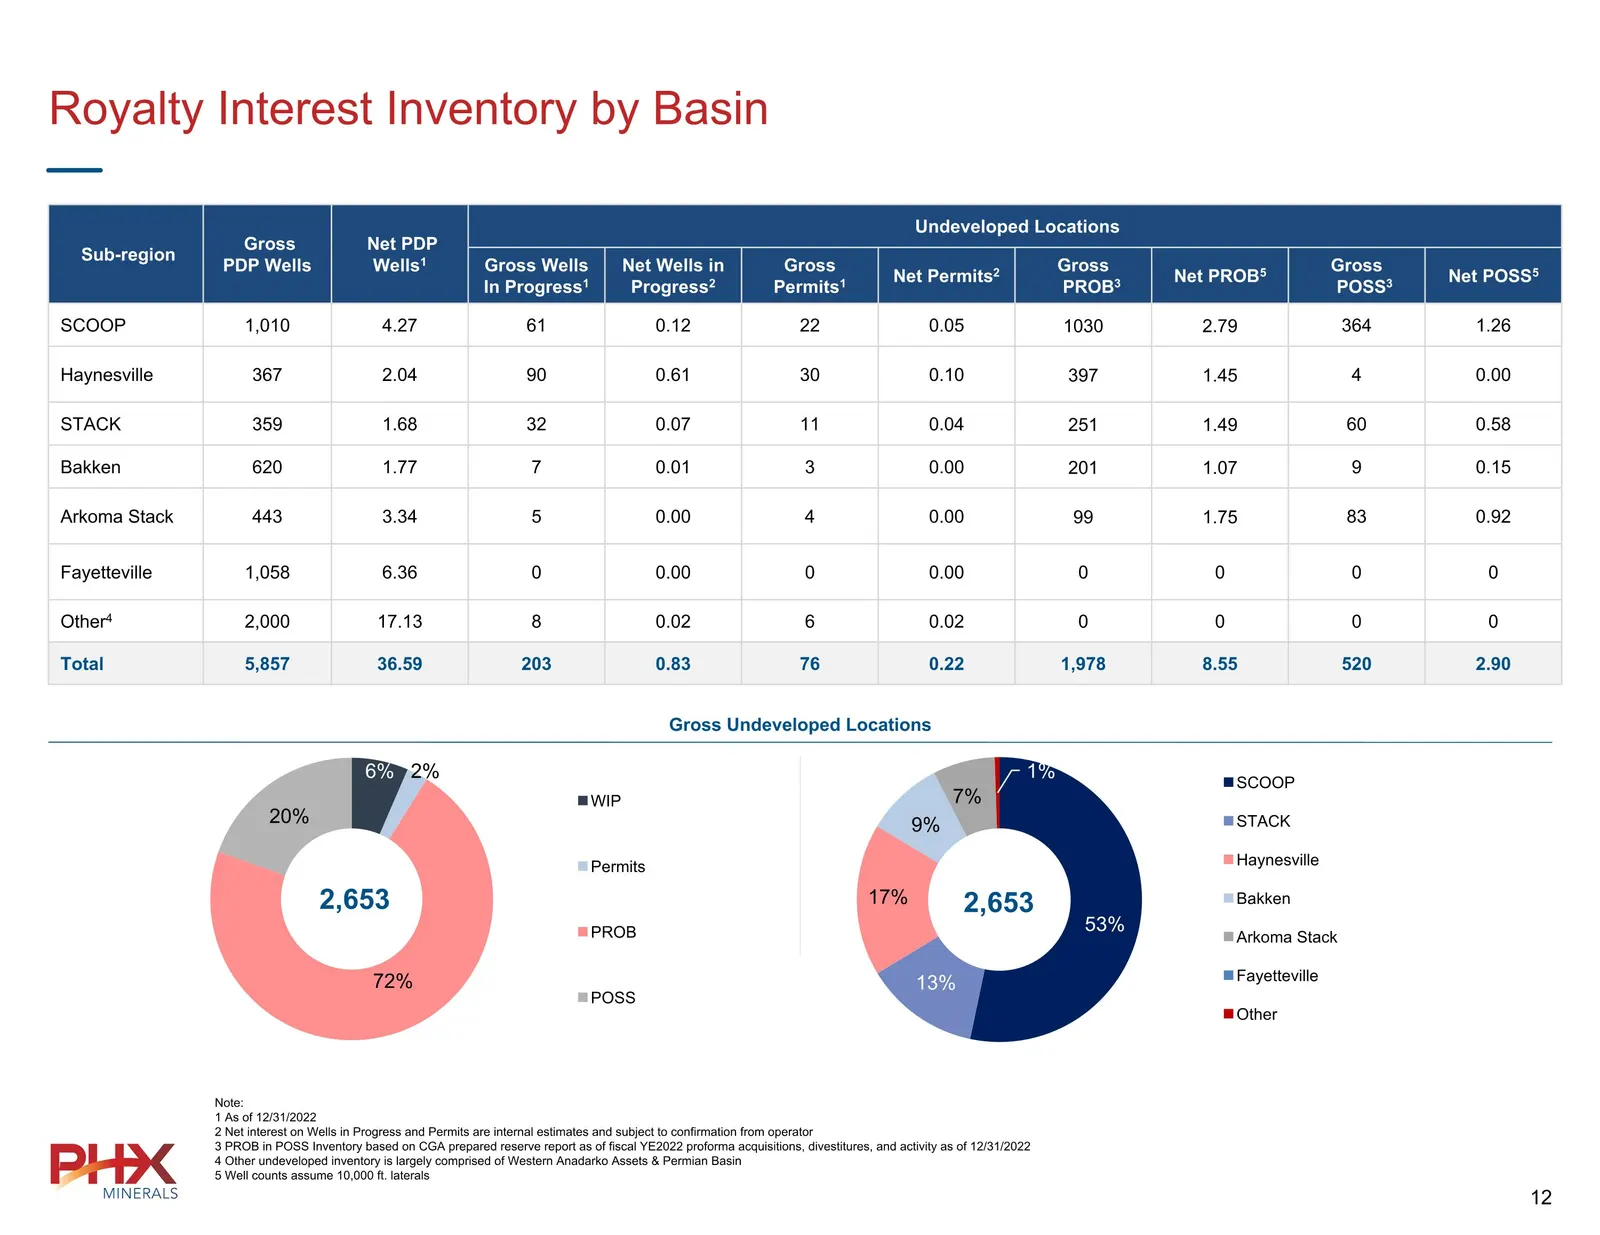
Slide 12: Royalty Interest Inventory by Basin Sub-region
Royalty Interest Inventory by Basin Sub-region Gross PDP Wells Net PDP Wells1 Undeveloped Locations Sub-region PDP Wells Average NRI1 Gross Wells In Progress1 Net Wells in Progress2 Gross Permits1 Net Permits2 Gross PROB3 Net PROB5 Gross POSS3 Net POSS5 SCOOP 1,010 4.27 61 0.12 22 0.05 1030 2.79 364
Slide 13: Yearly Conversions To Producing Wells
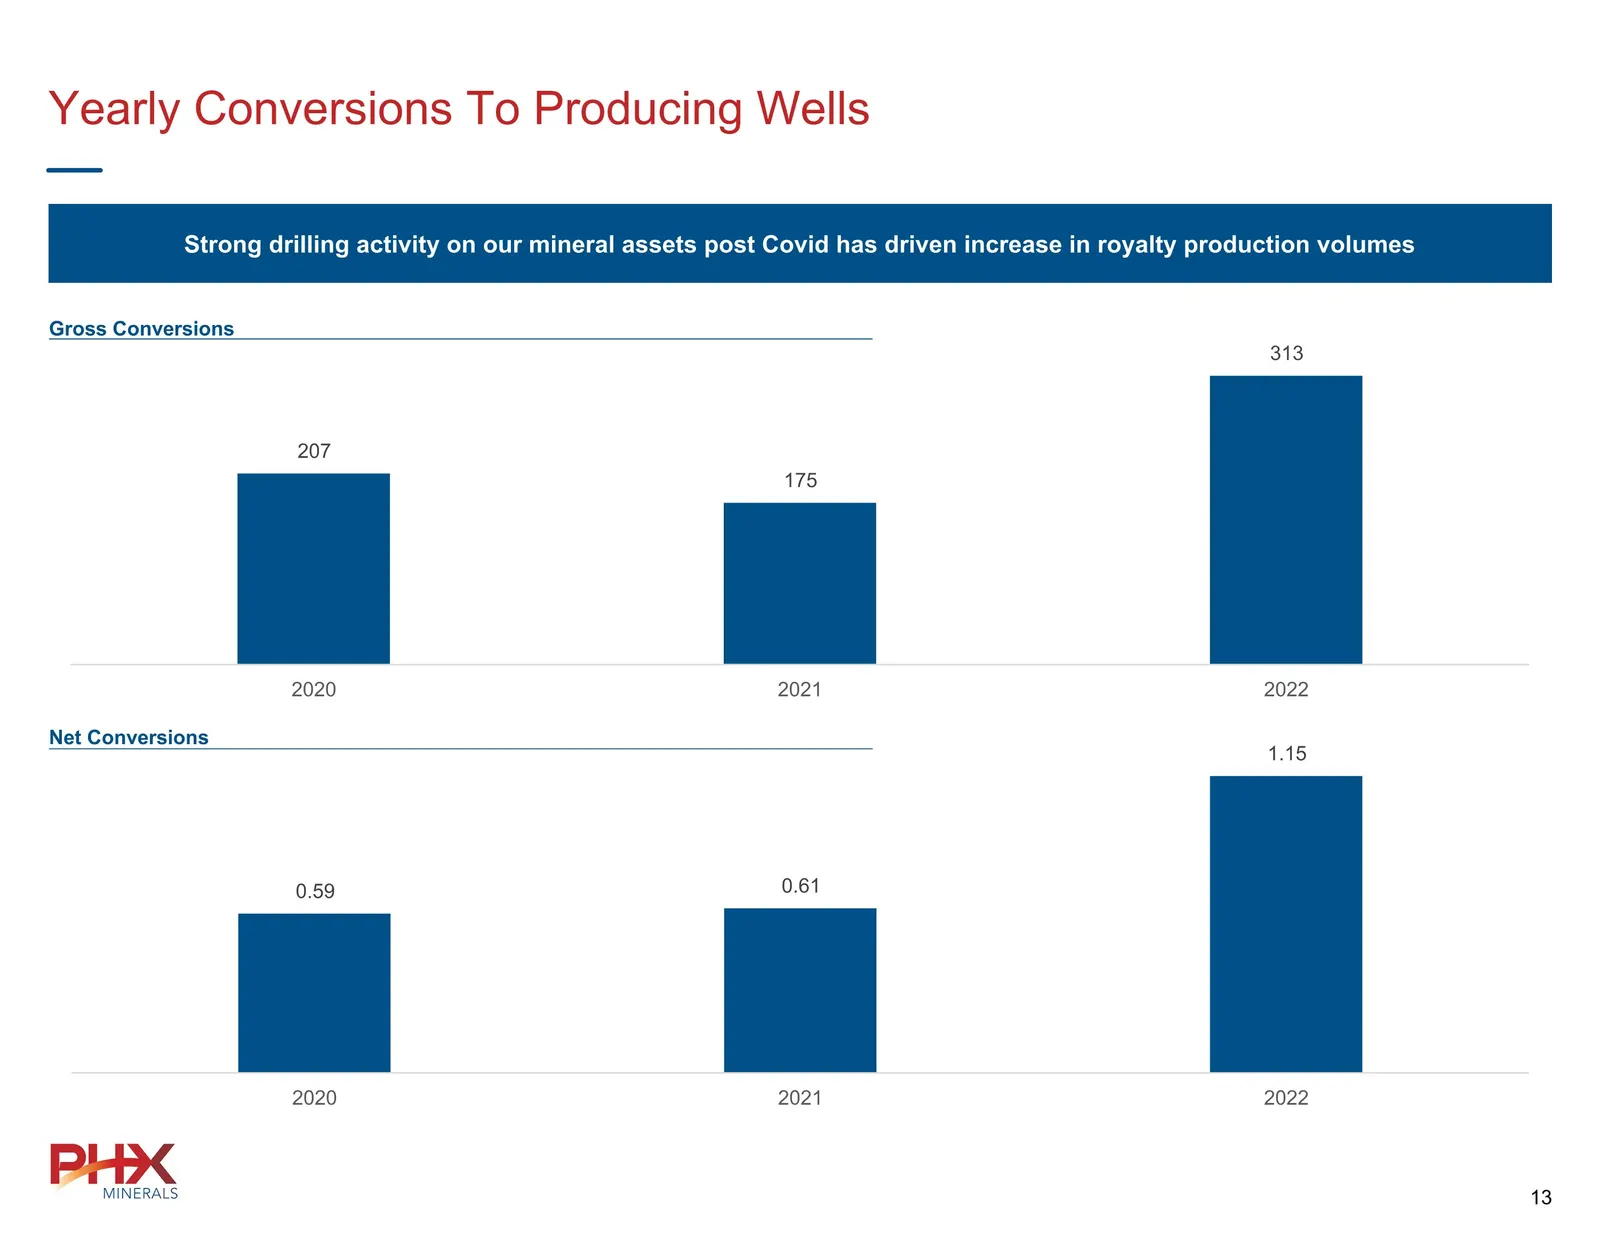
Yearly Conversions To Producing Wells Strong drilling activity on our mineral assets post Covid has driven increase in royalty production volumes Gross Conversions Net Conversions
Slide 14: Quarterly Near Term Drilling Inventory
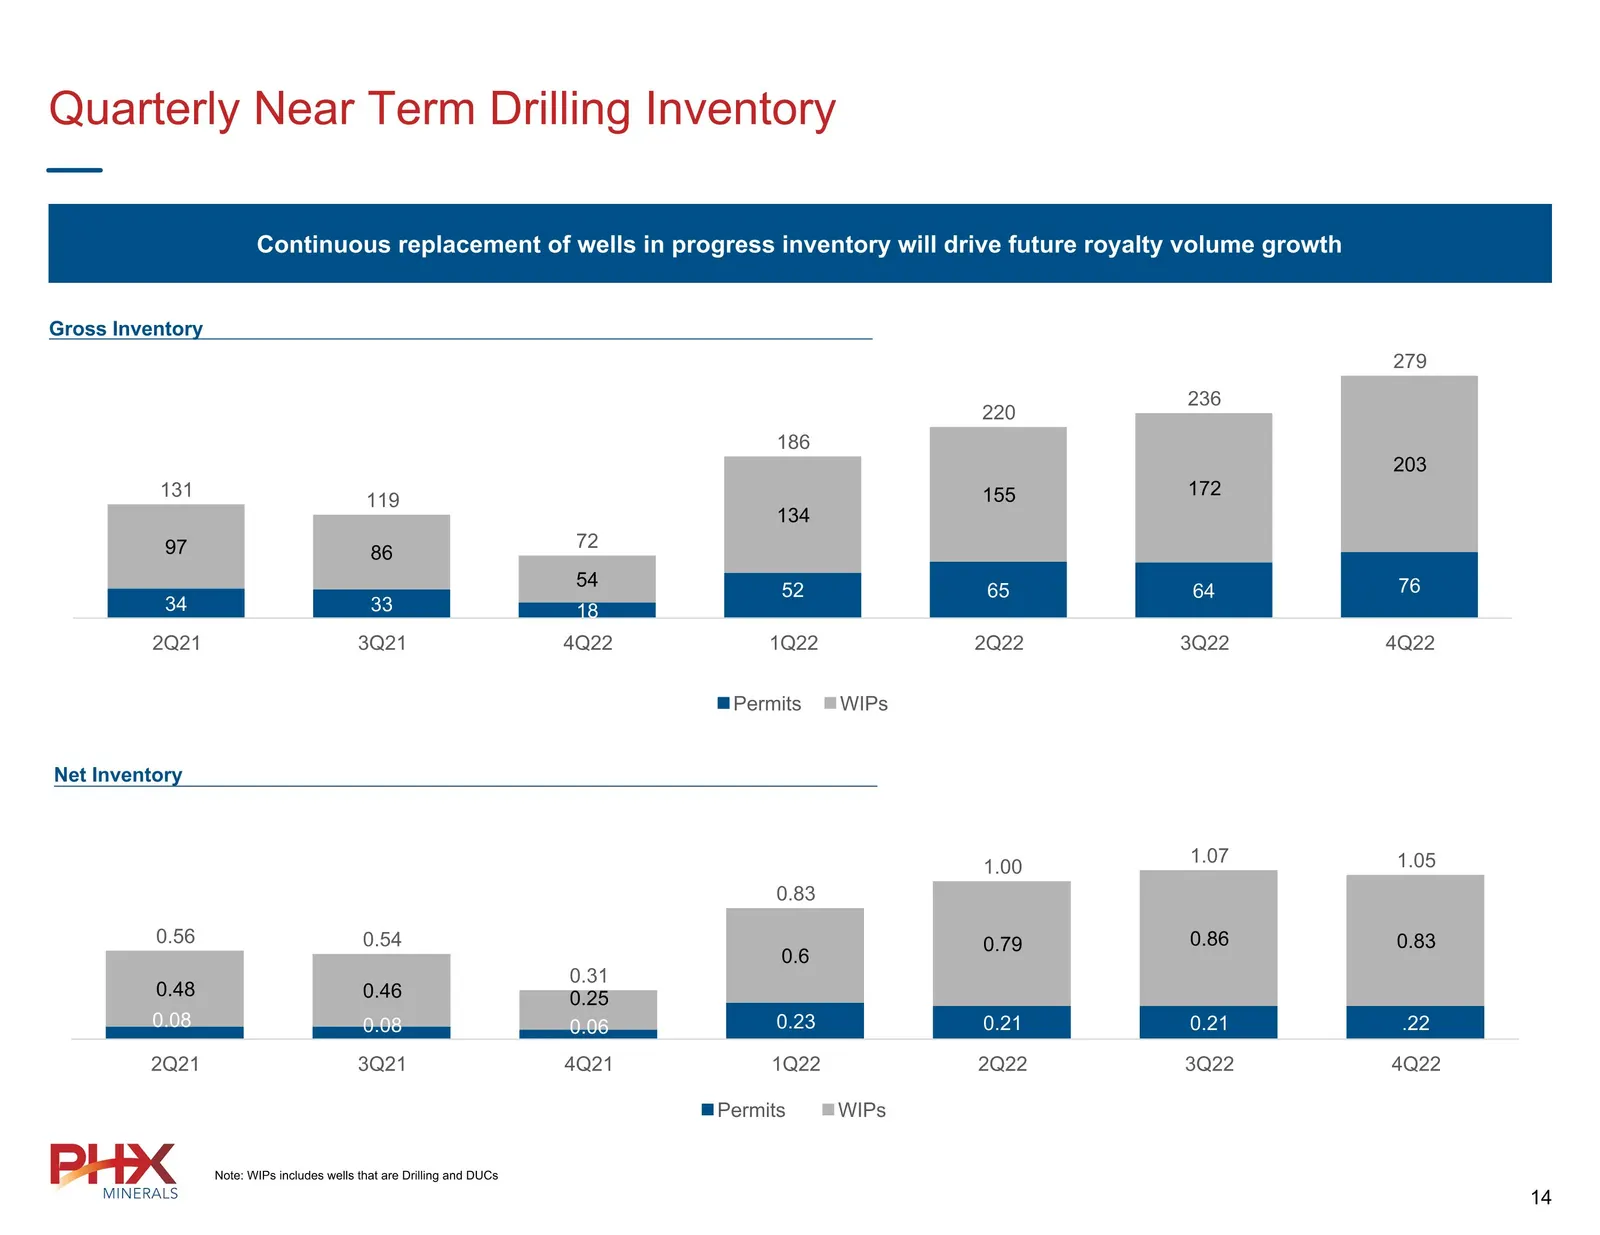
Quarterly Near Term Drilling Inventory Continuous replacement of wells in progress inventory will drive future royalty volume growth Gross Inventory Net Inventory Note: WIPs includes wells that are Drilling and DUCs
Slide 15: Acquisition Summary
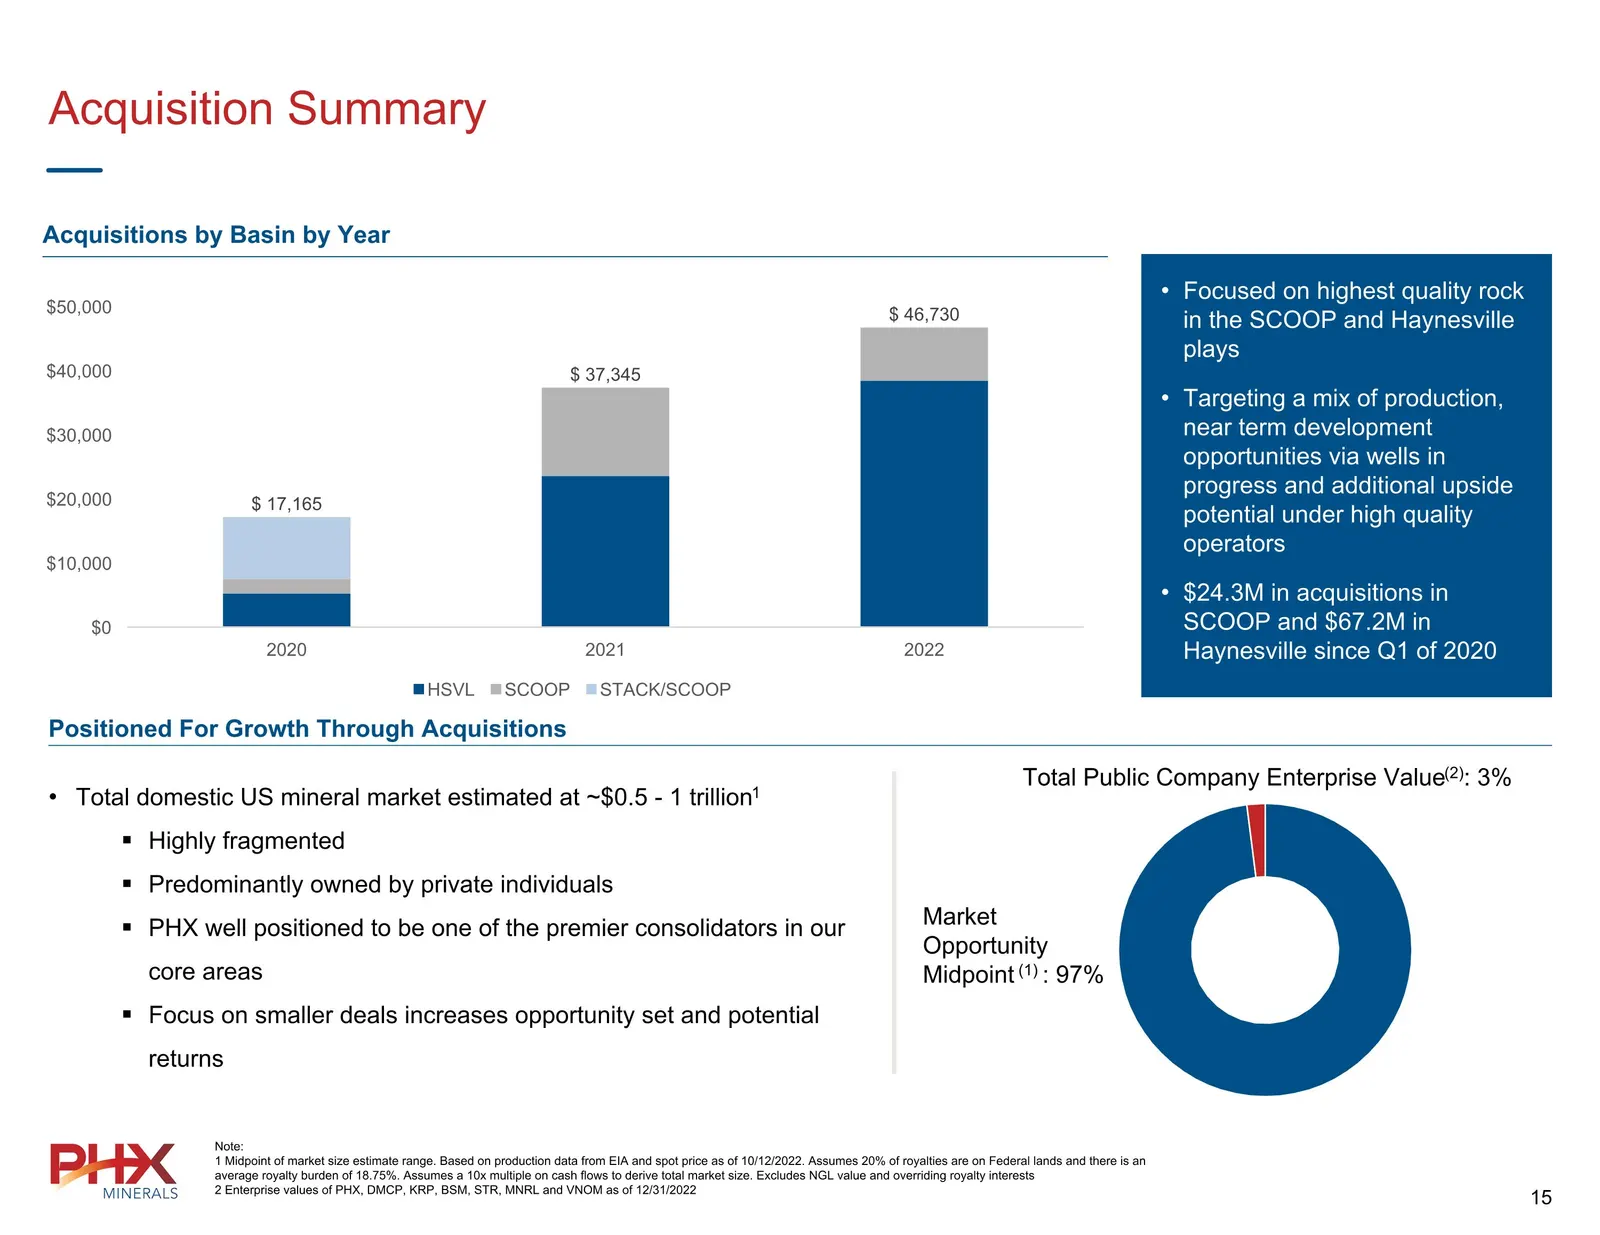
Acquisition Summary Acquisitions by Basin by Year Focused on highest quality rock in the SCOOP and Haynesville plays Targeting a mix of production, near term development opportunities via wells in progress and additional upside potential under high quality operators $24.3M in acquisitions in SCOOP a
Slide 16: Acquisition History - Haynesville
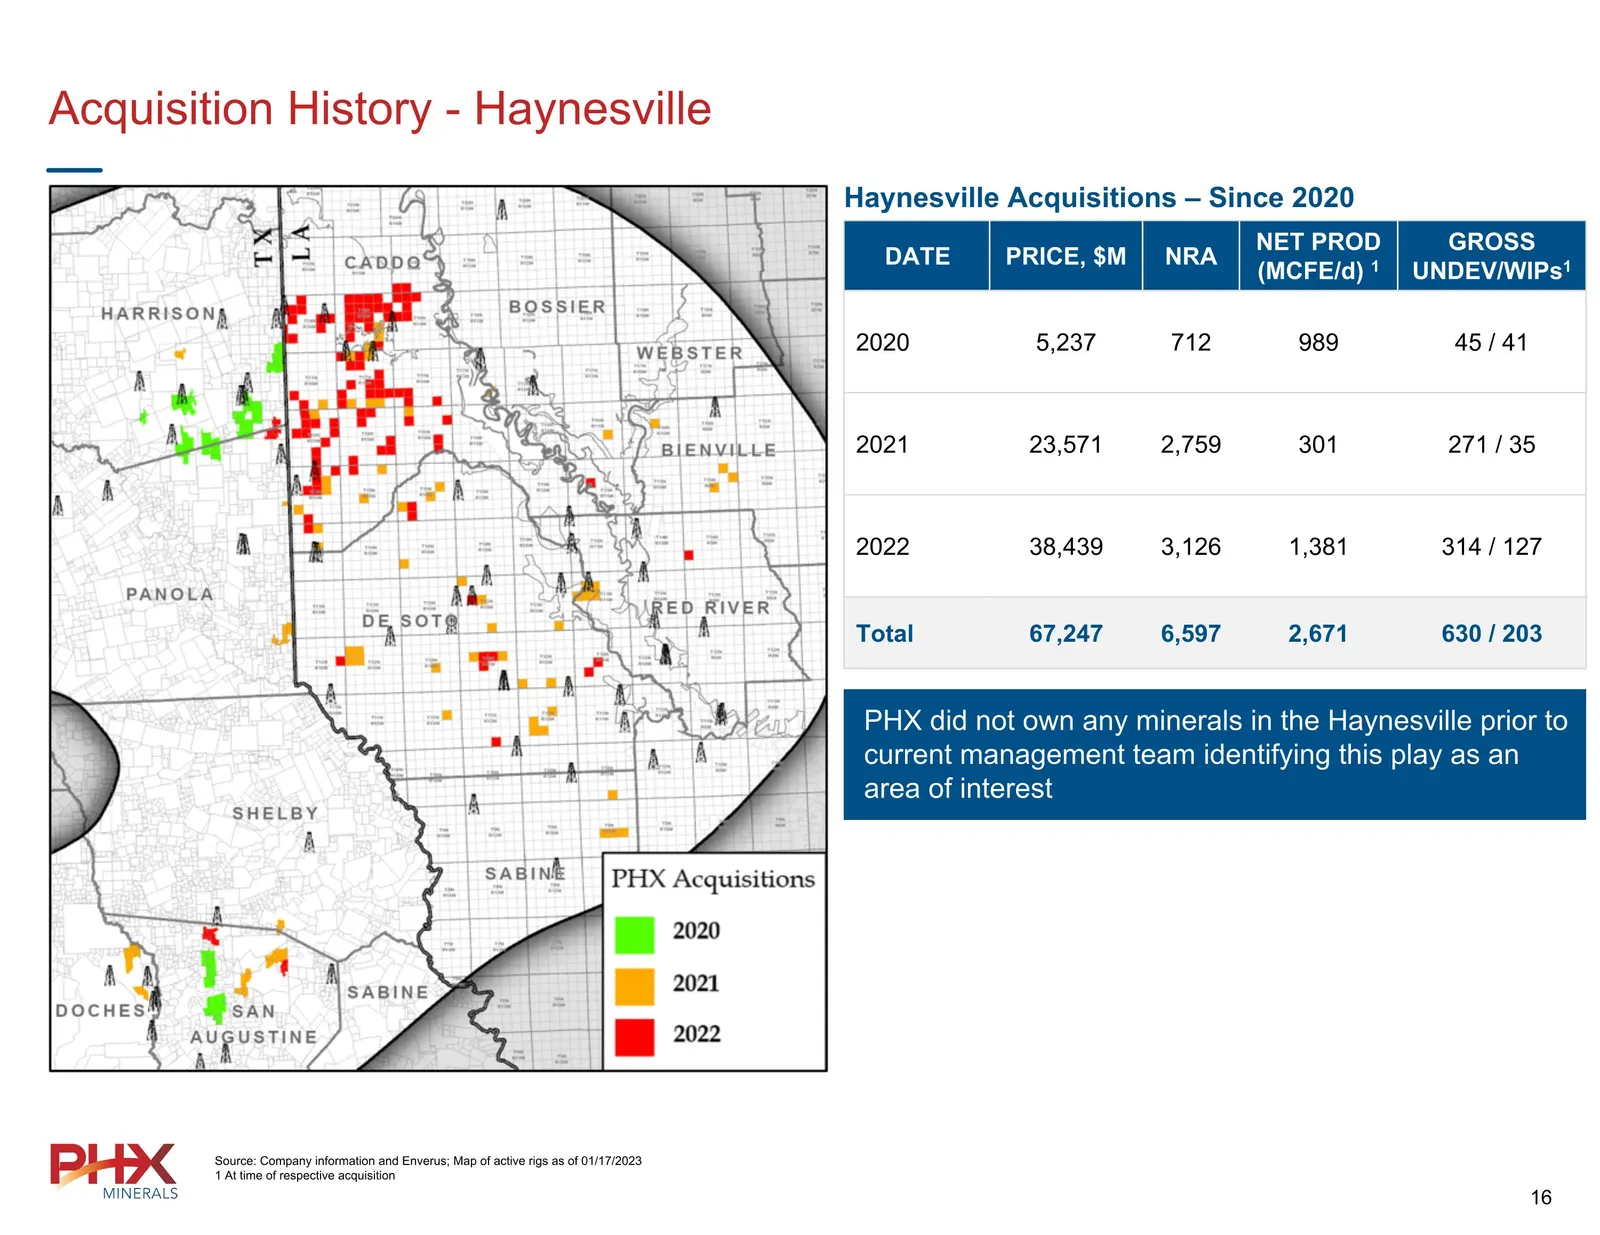
Acquisition History - Haynesville Source: Company information and Enverus; Map of active rigs as of 01/17/2023 1 At time of respective acquisition Haynesville Acquisitions – Since 2020 DATE PRICE, $M NRA NET PROD (MCFE/d) 1 GROSS UNDEV/WIPs1 2020 5,237 712 989 45 / 41 2021 23,571 2,759 301 271 / 35
Slide 17: North Haynesville Update
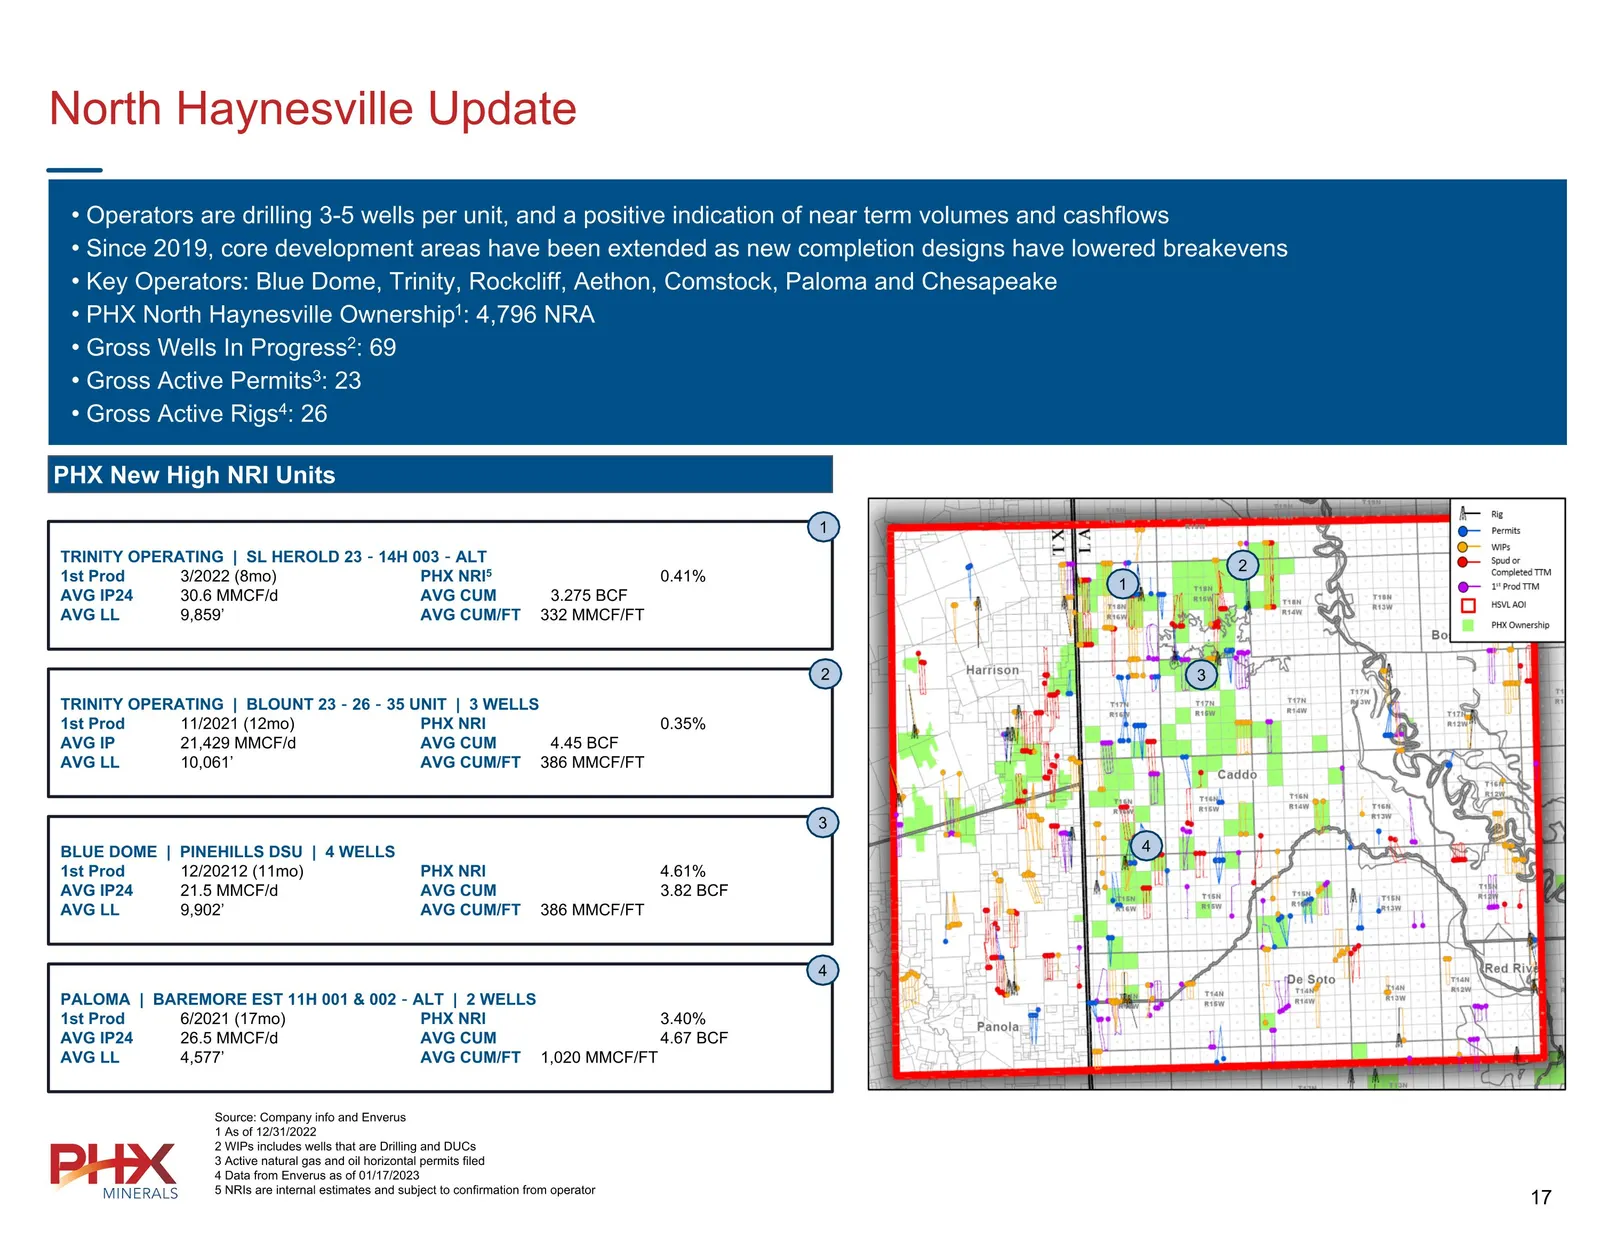
North Haynesville Update PHX New High NRI Units TRINITY OPERATING | BLOUNT 23‐26‐35 UNIT | 3 WELLS 1st Prod 11/2021 (12mo) PHX NRI 0.35% AVG IP 21,429 MMCF/d AVG CUM 4.45 BCF AVG LL 10,061’ AVG CUM/FT 386 MMCF/FT BLUE DOME | PINEHILLS DSU | 4 WELLS 1st Prod 12/20212 (11mo) PHX NRI 4.61% AVG IP24 21.
Slide 18: Acquisition History – SCOOP
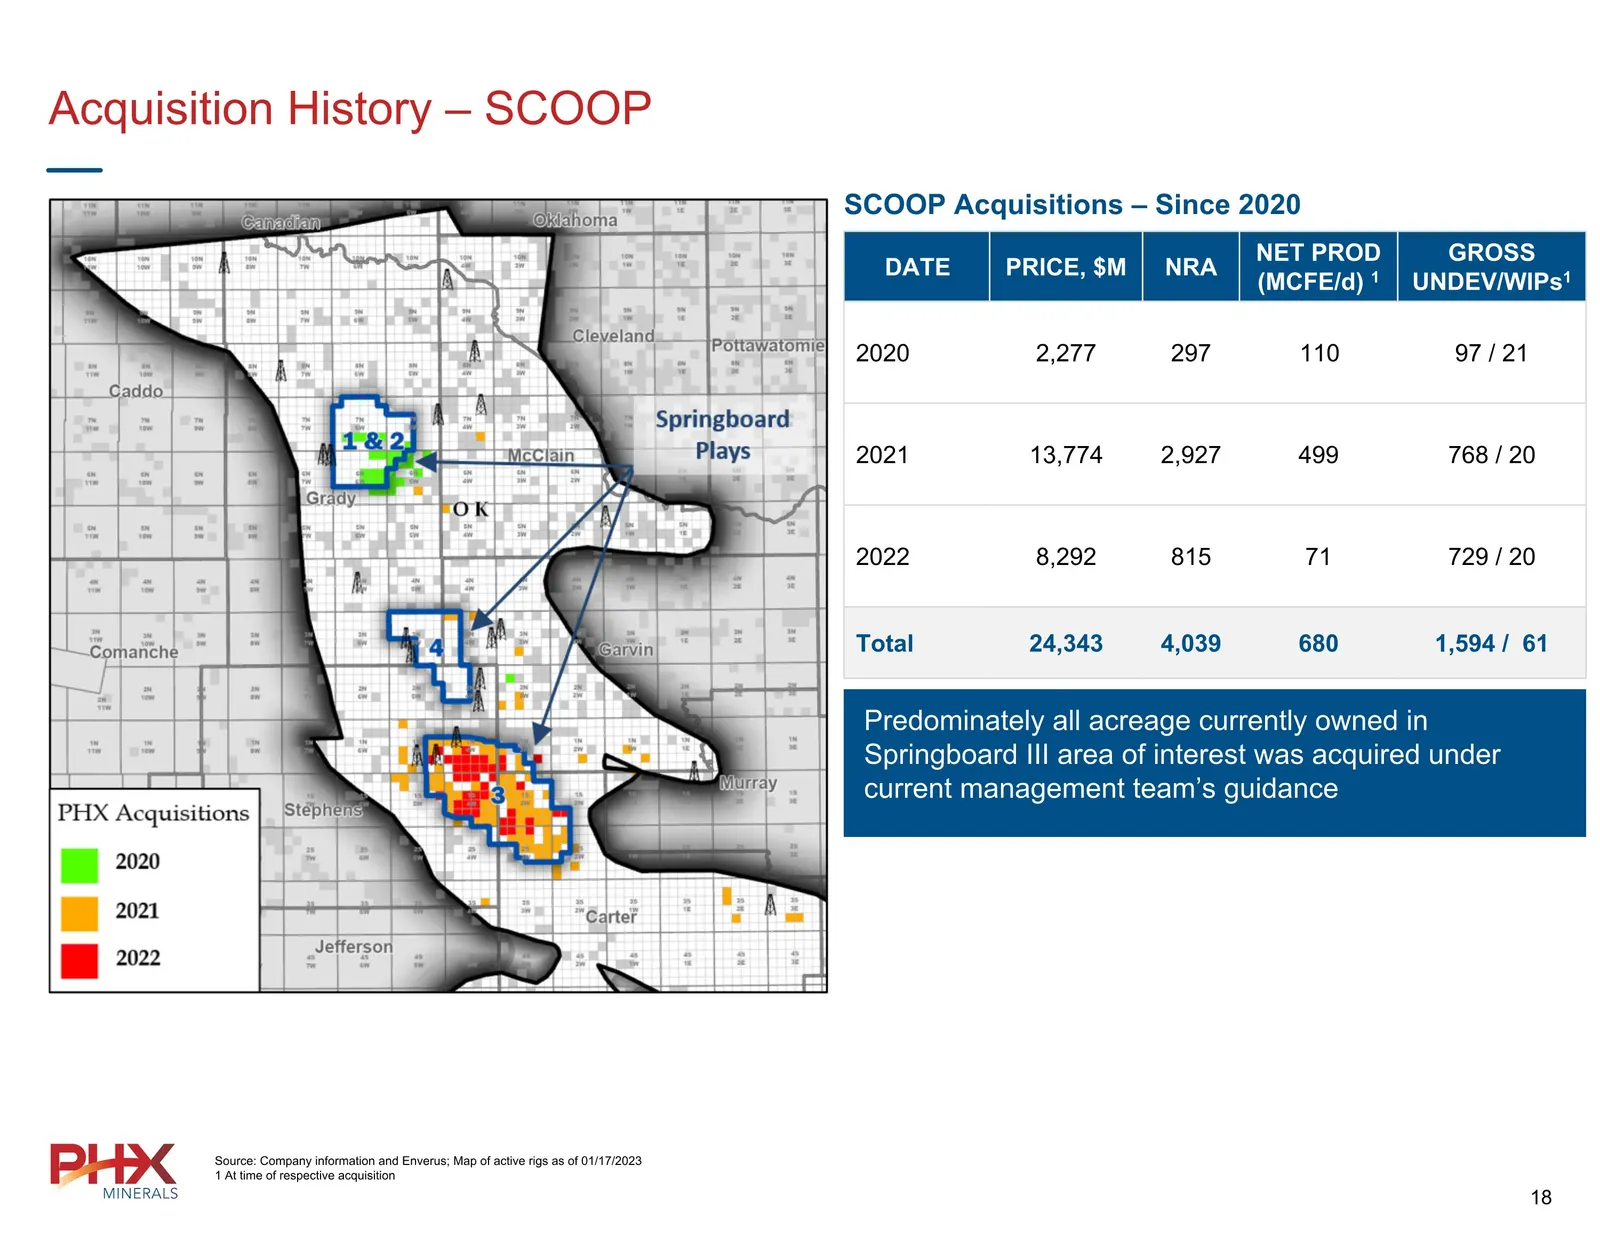
Acquisition History – SCOOP SCOOP Acquisitions – Since 2020 DATE PRICE, $M NRA NET PROD (MCFE/d) 1 GROSS UNDEV/WIPs1 2020 2,277 297 110 97 / 21 2021 13,774 2,927 499 768 / 20 2022 8,292 815 71 729 / 20 Total 24,343 4,039 680 1,594 / 61 Predominately all acreage currently owned in Springboard III are
Slide 19: Springboard III Update
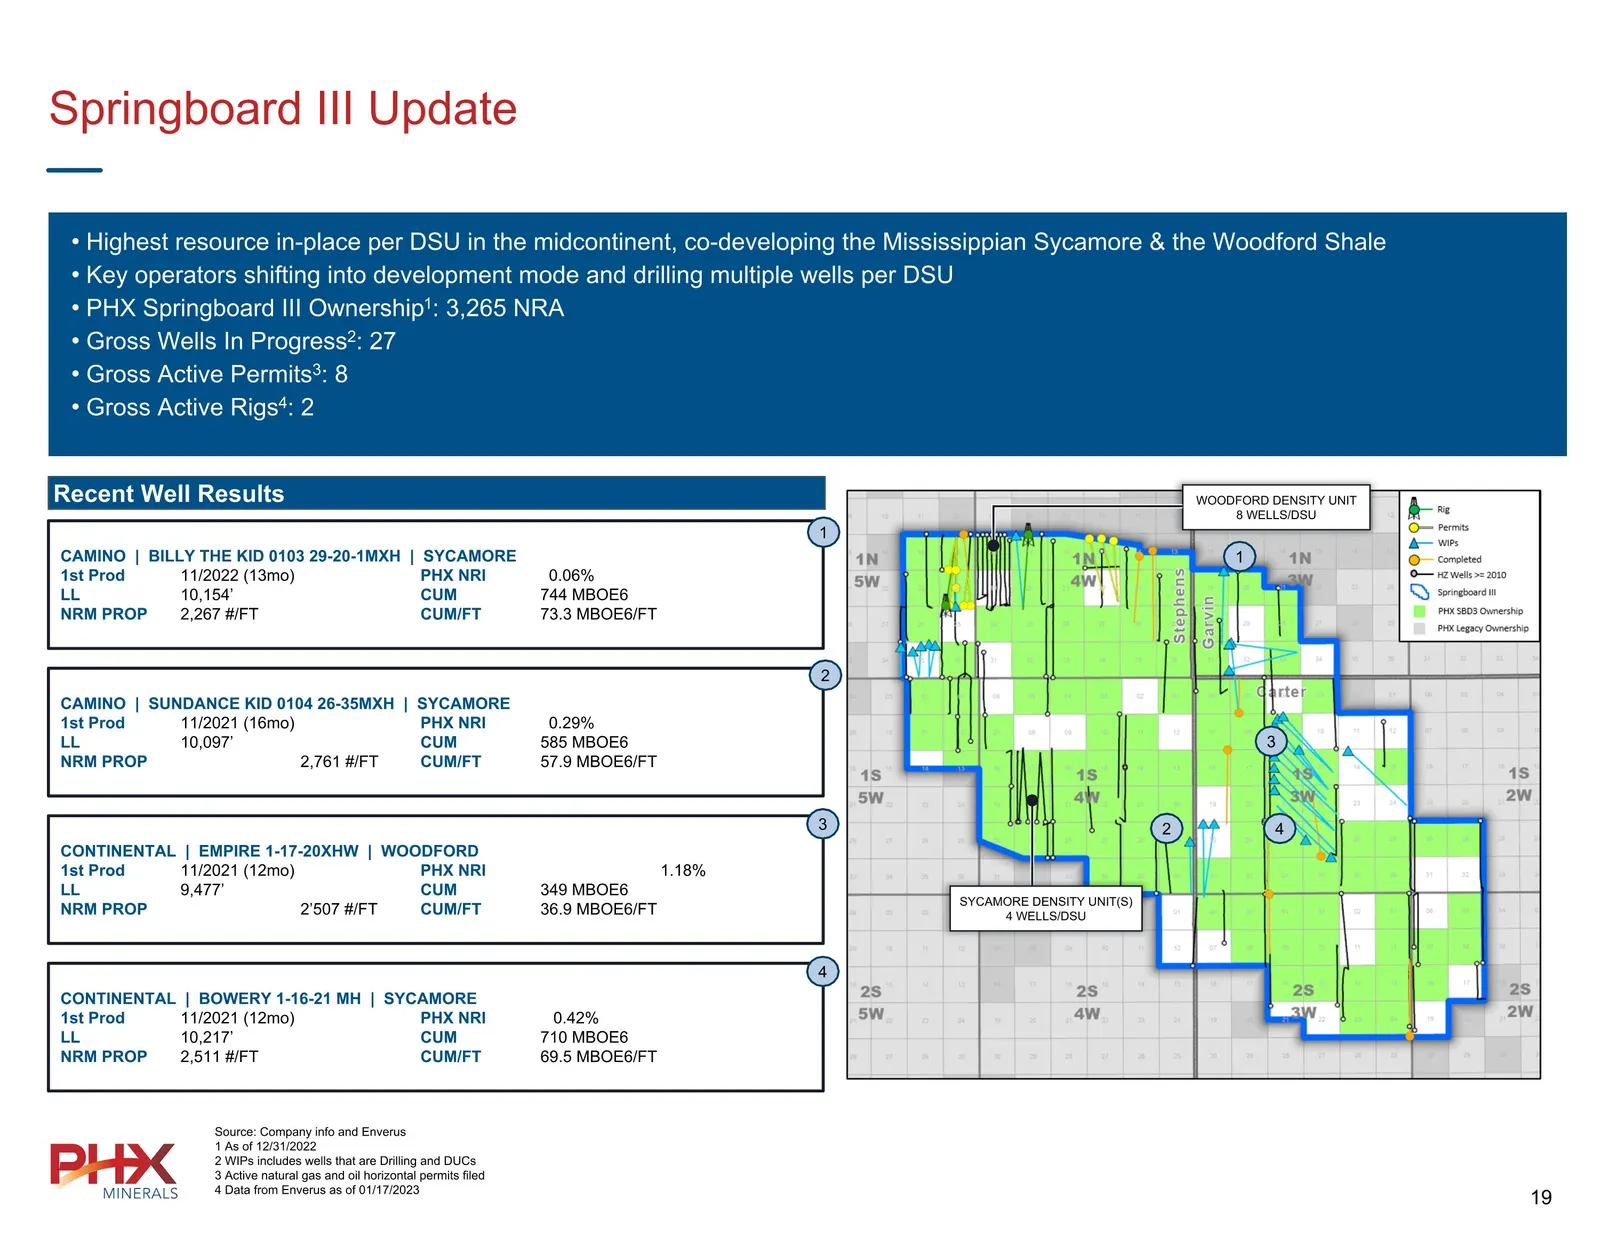
WOODFORD DENSITY UNIT 8 WELLS/DSU SYCAMORE DENSITY UNIT(S) 4 WELLS/DSU Springboard III Update Highest resource in-place per DSU in the midcontinent, co-developing the Mississippian Sycamore & the Woodford Shale Key operators shifting into development mode and drilling multiple wells per DSU PHX Spri
Slide 20: SCOOP Springboard Plays
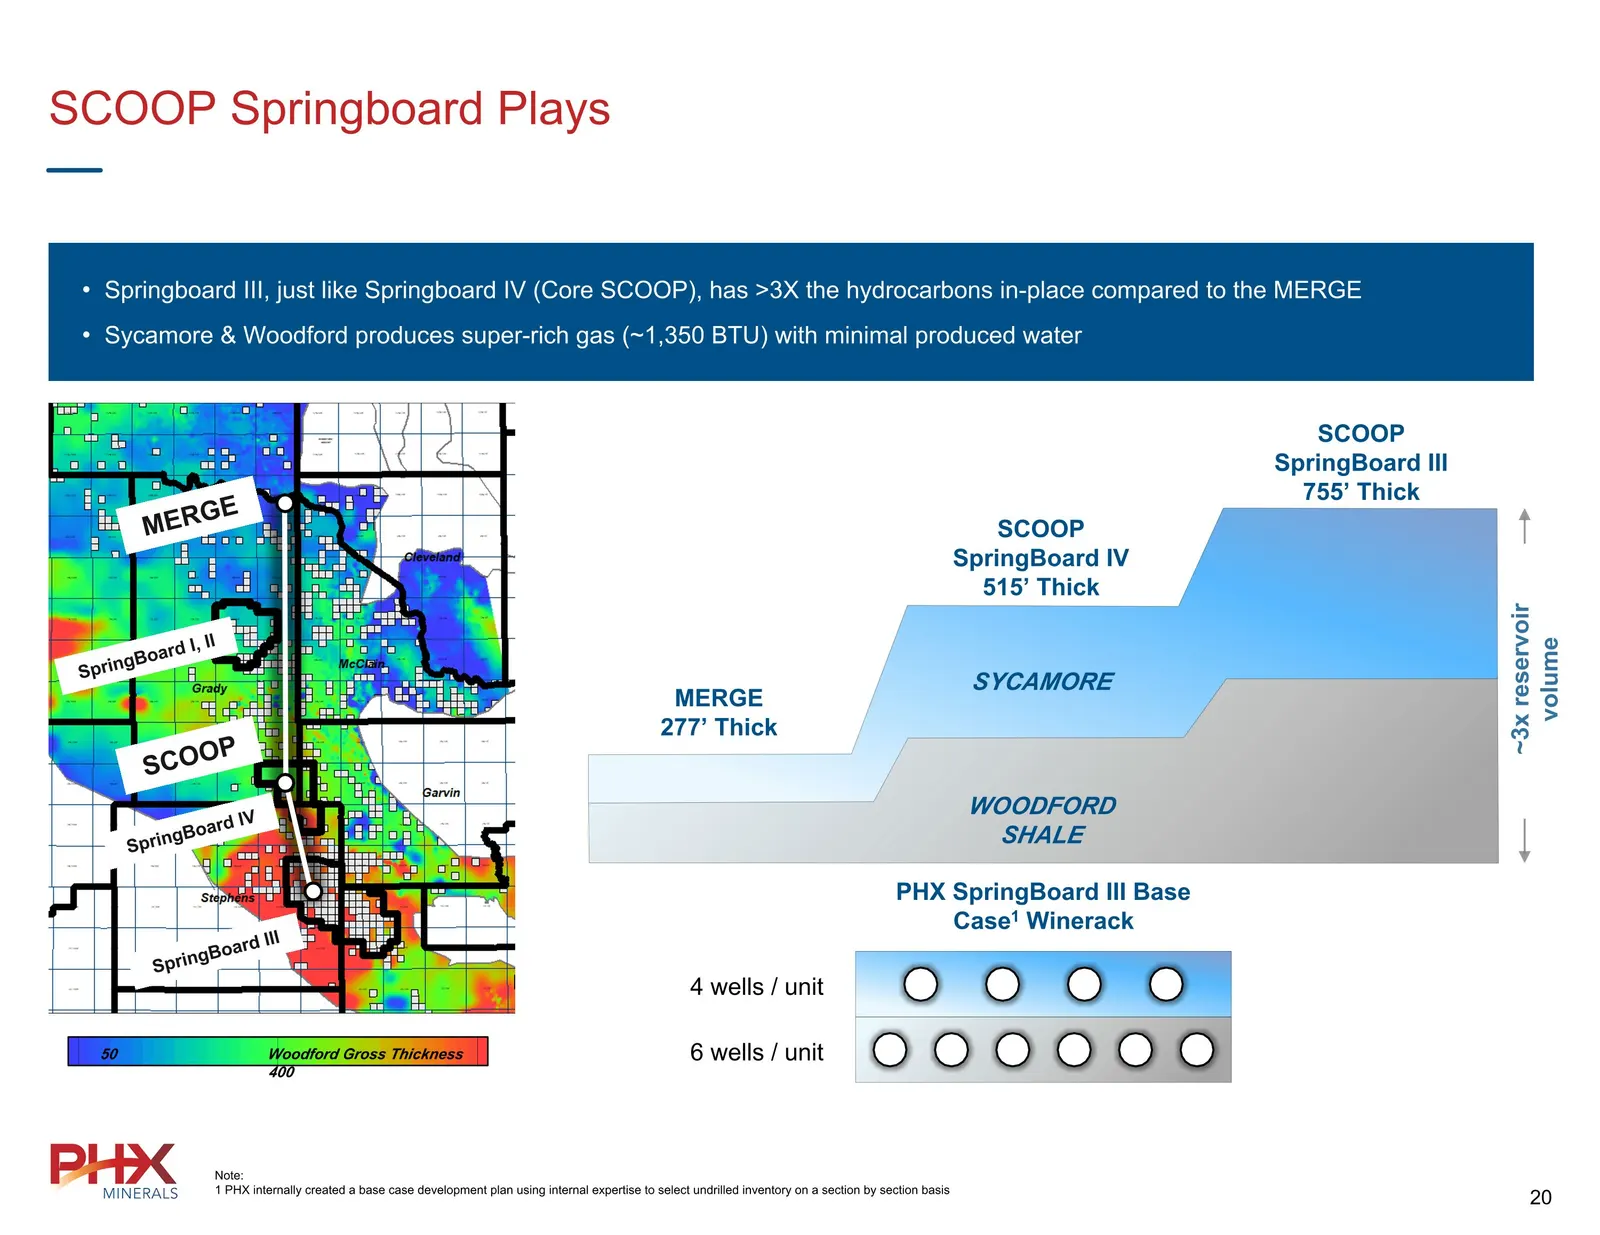
SCOOP Springboard Plays 50 Woodford Gross Thickness 400 MERGE SCOOP SpringBoard I, II SpringBoard III SpringBoard IV Springboard III, just like Springboard IV (Core SCOOP), has >3X the hydrocarbons in-place compared to the MERGE Sycamore & Woodford produces super-rich gas (~1,350 BTU) with minimal p
Slide 21: Company Leadership
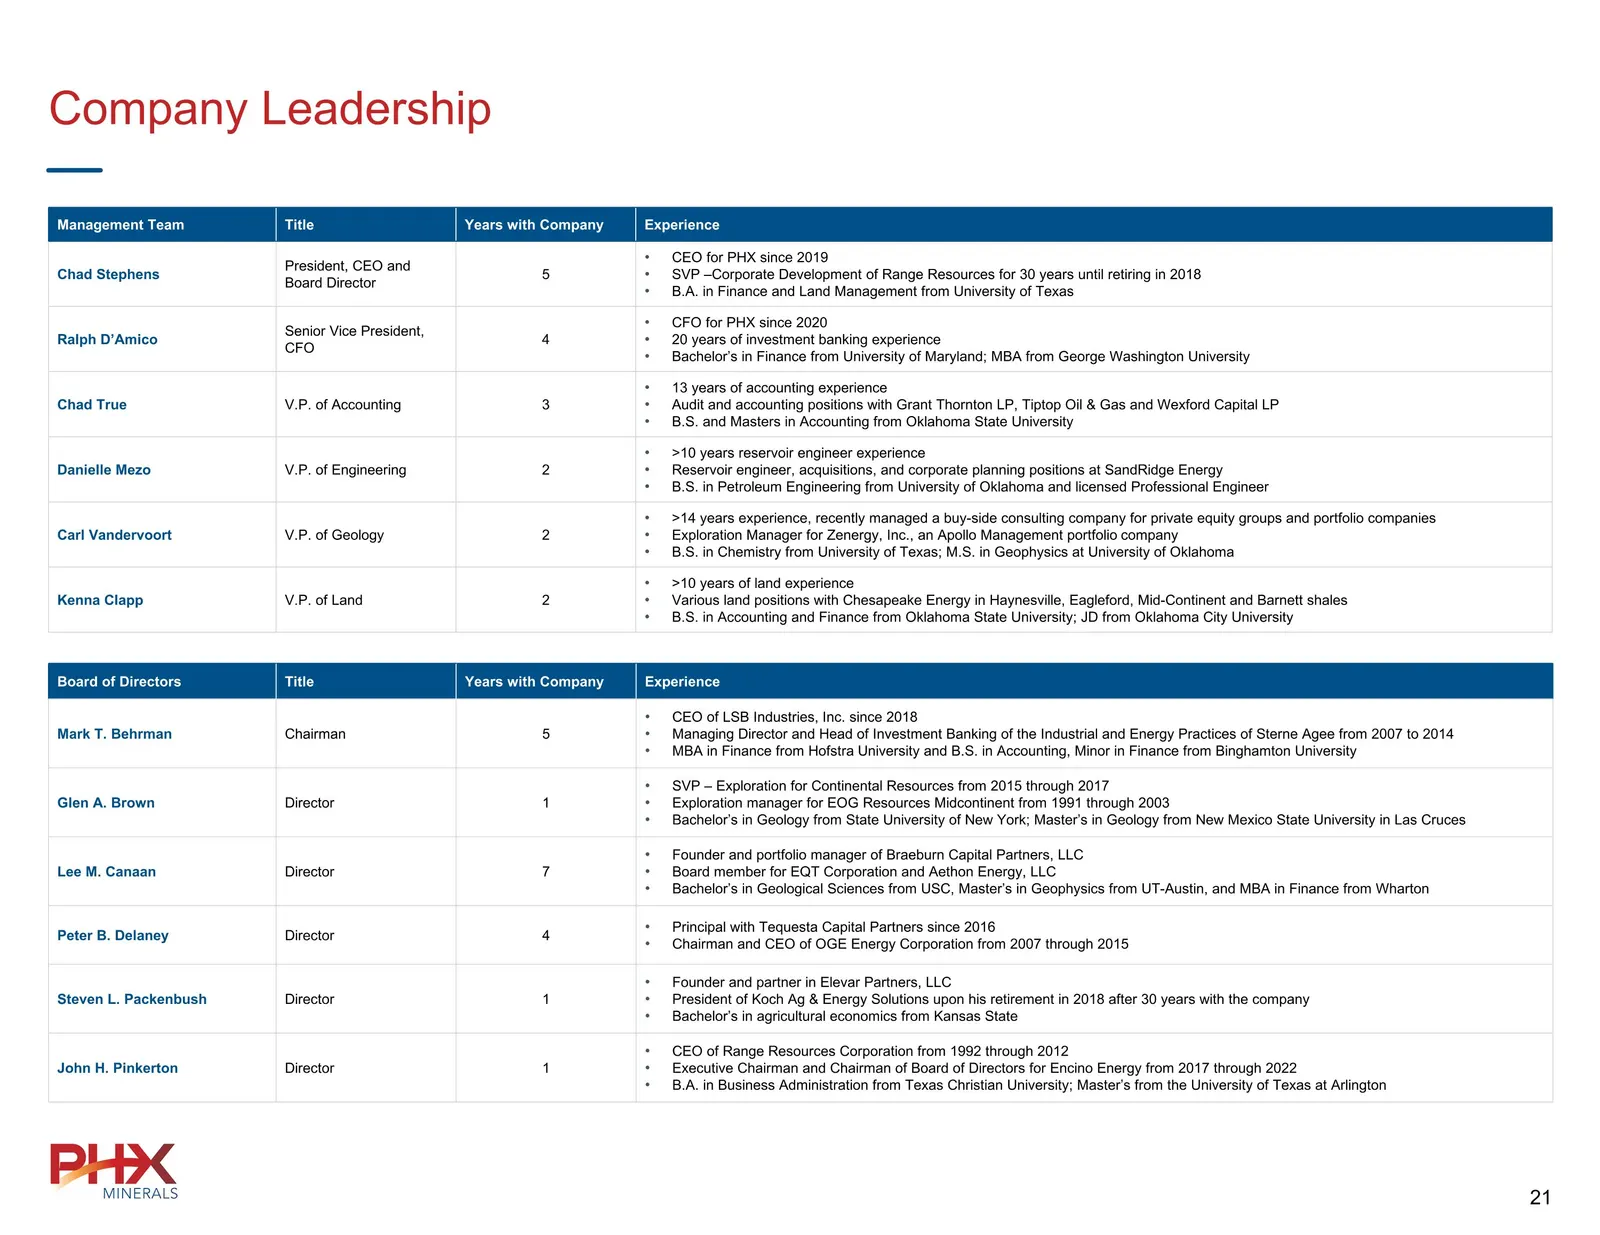
Company Leadership Management Team Title Years with Company Experience Chad Stephens President, CEO and Board Director 5 CEO for PHX since 2019 SVP –Corporate Development of Range Resources for 30 years until retiring in 2018 B.A. in Finance and Land Management from University of Texas Ralph D’Amico
Slide 22: Analyst Coverage
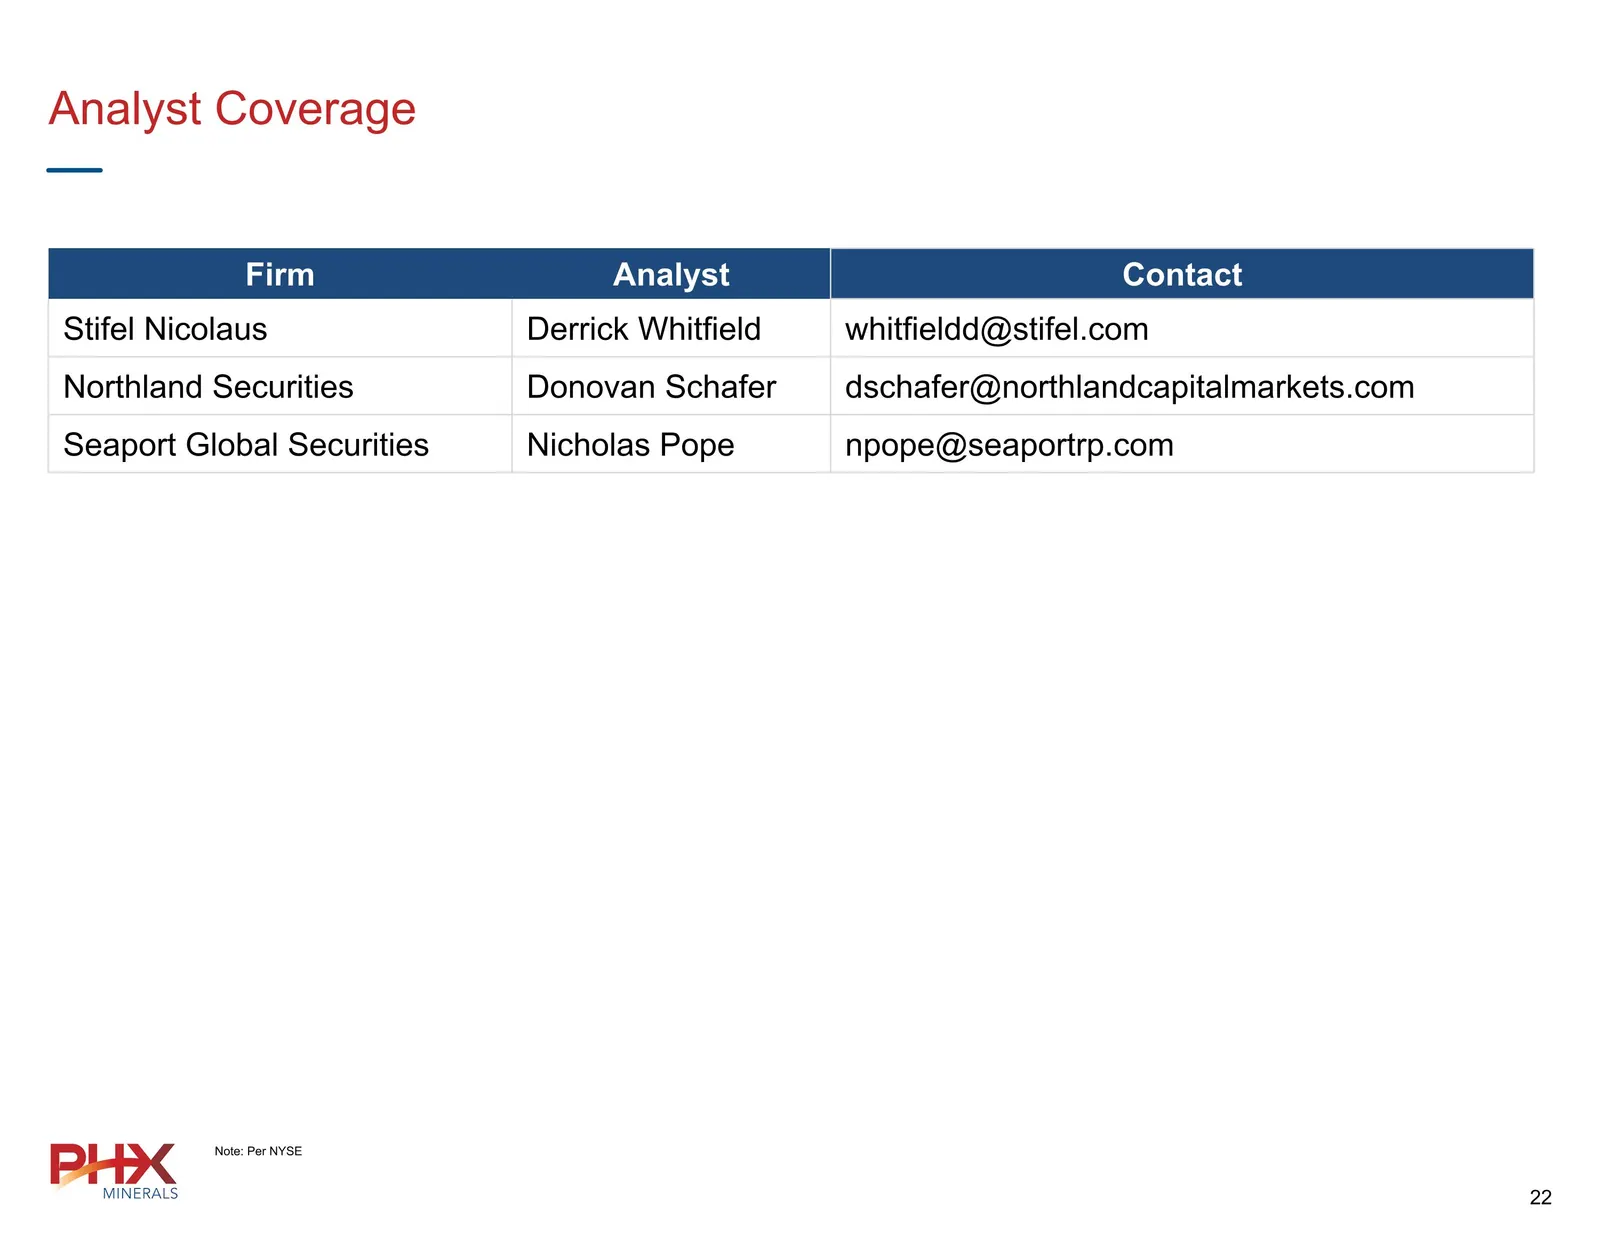
Analyst Coverage Note: Per NYSE Firm Analyst Contact Stifel Nicolaus Derrick Whitfield whitfieldd@stifel.com Northland Securities Donovan Schafer dschafer@northlandcapitalmarkets.com Seaport Global Securities Nicholas Pope npope@seaportrp.com
Slide 23: Appendix
Appendix 23 MINERALS.
Slide 24: Current Hedging Analysis
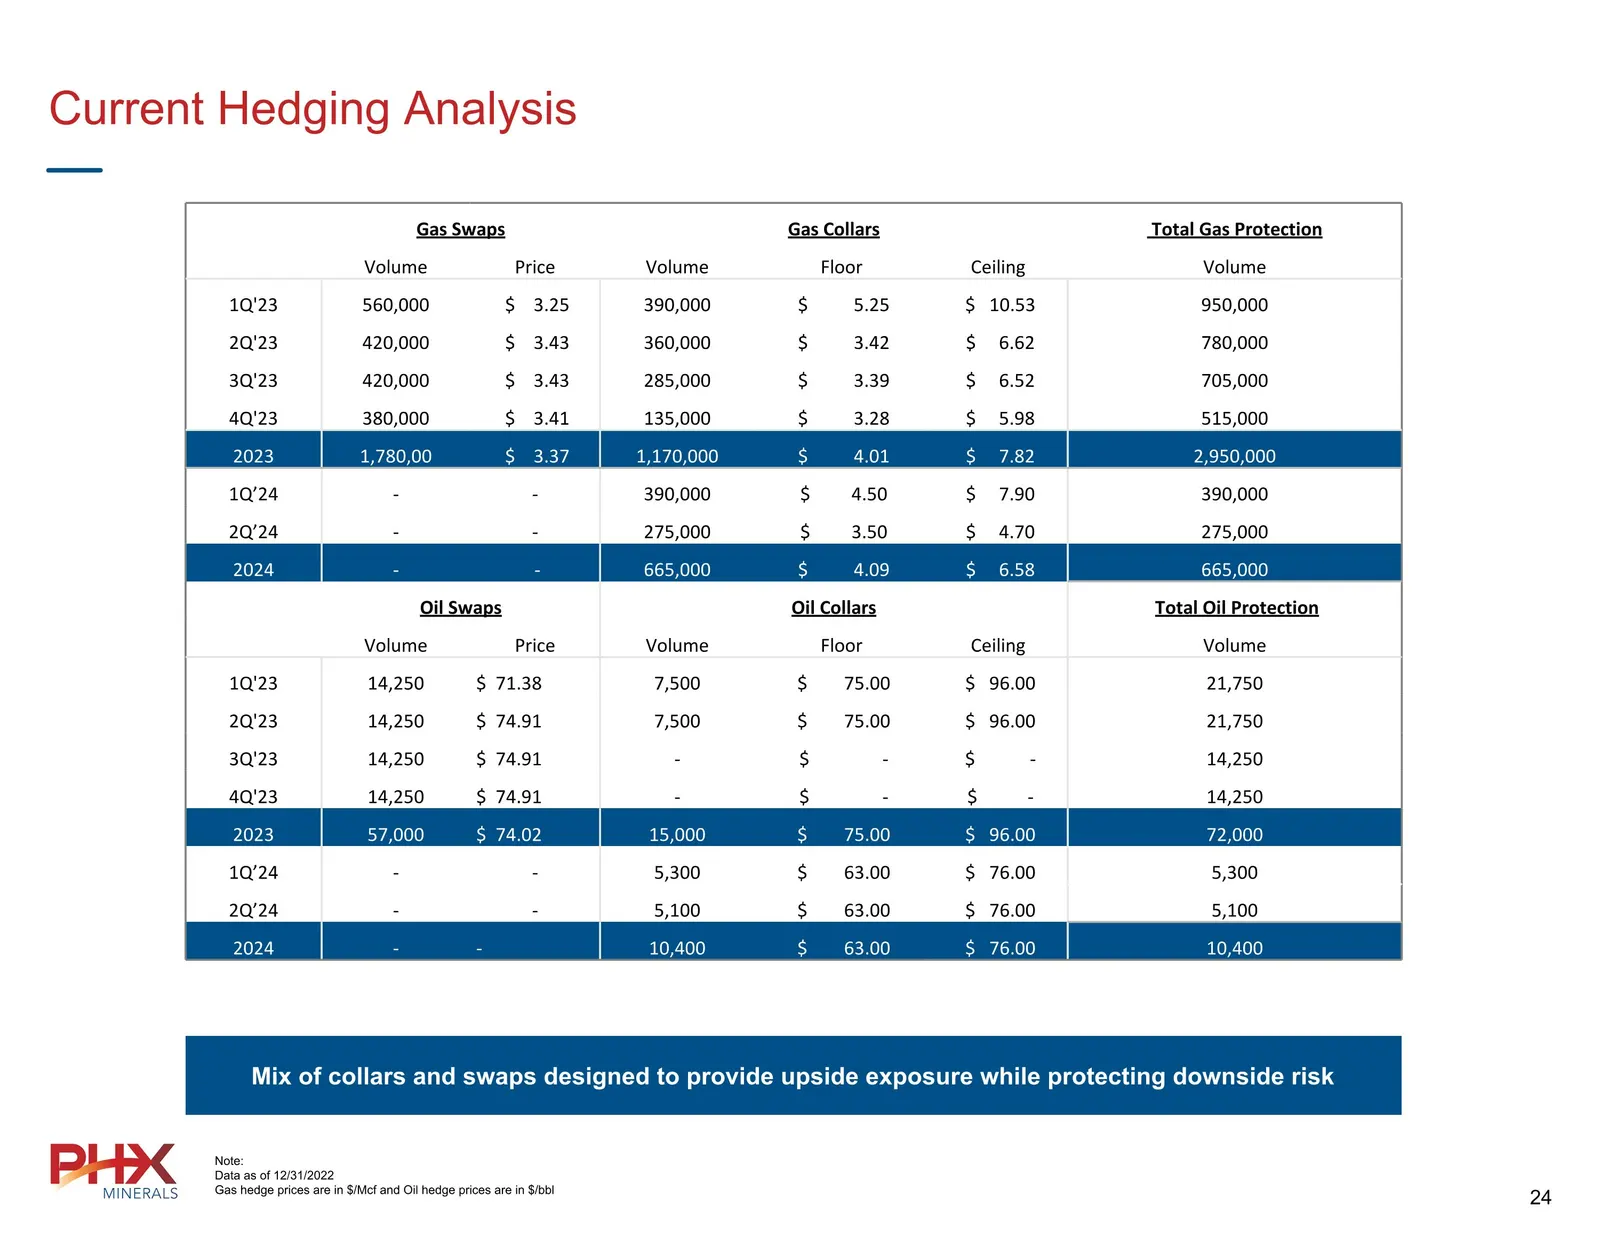
Current Hedging Analysis Note: Data as of 12/31/2022 Gas hedge prices are in $/Mcf and Oil hedge prices are in $/bbl Mix of collars and swaps designed to provide upside exposure while protecting downside risk Gas Swaps Gas Collars Total Gas Protection Volume Price Volume Floor Ceiling Volume 1Q'23 5
Slide 25: Natural Gas – Demand
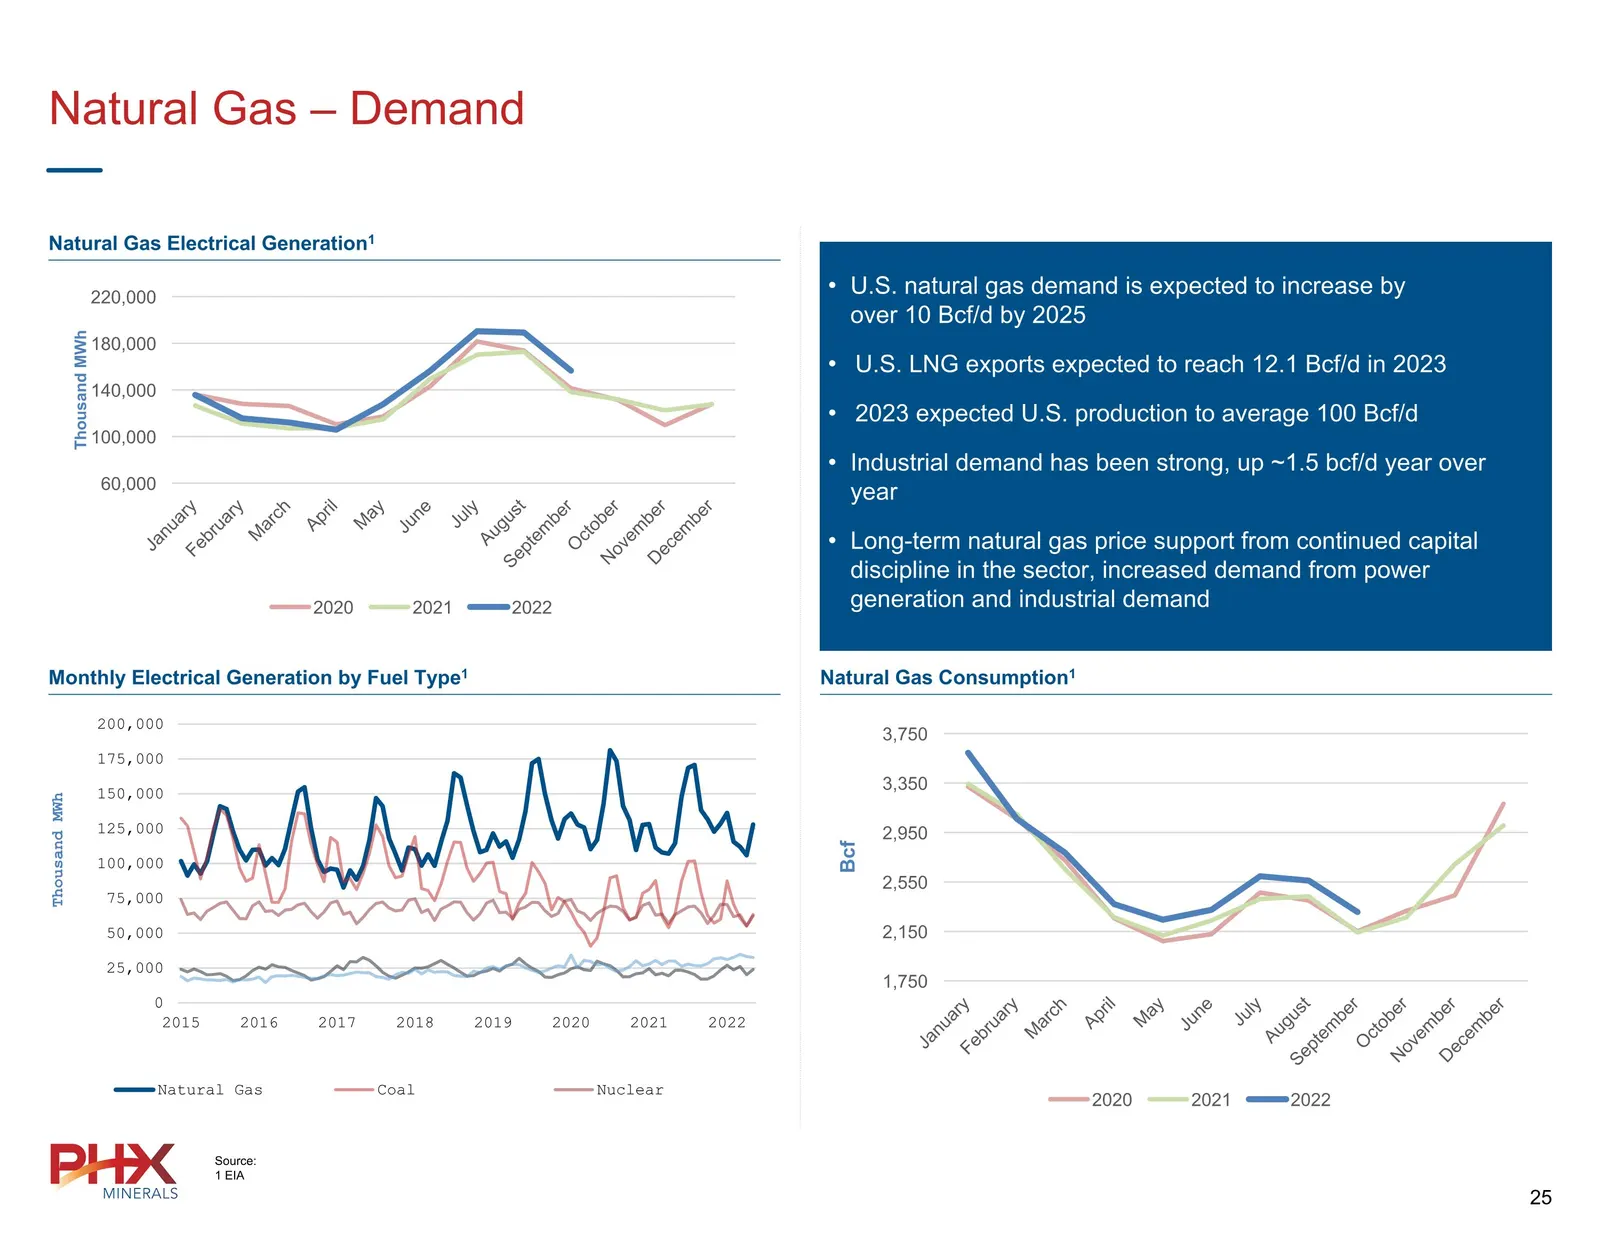
Natural Gas – Demand Natural Gas Electrical Generation1 Monthly Electrical Generation by Fuel Type1 Natural Gas Consumption1 U.S. natural gas demand is expected to increase by over 10 Bcf/d by 2025 U.S. LNG exports expected to reach 12.1 Bcf/d in 2023 2023 expected U.S. production to average 100 Bcf
Slide 26: Natural Gas – LNG
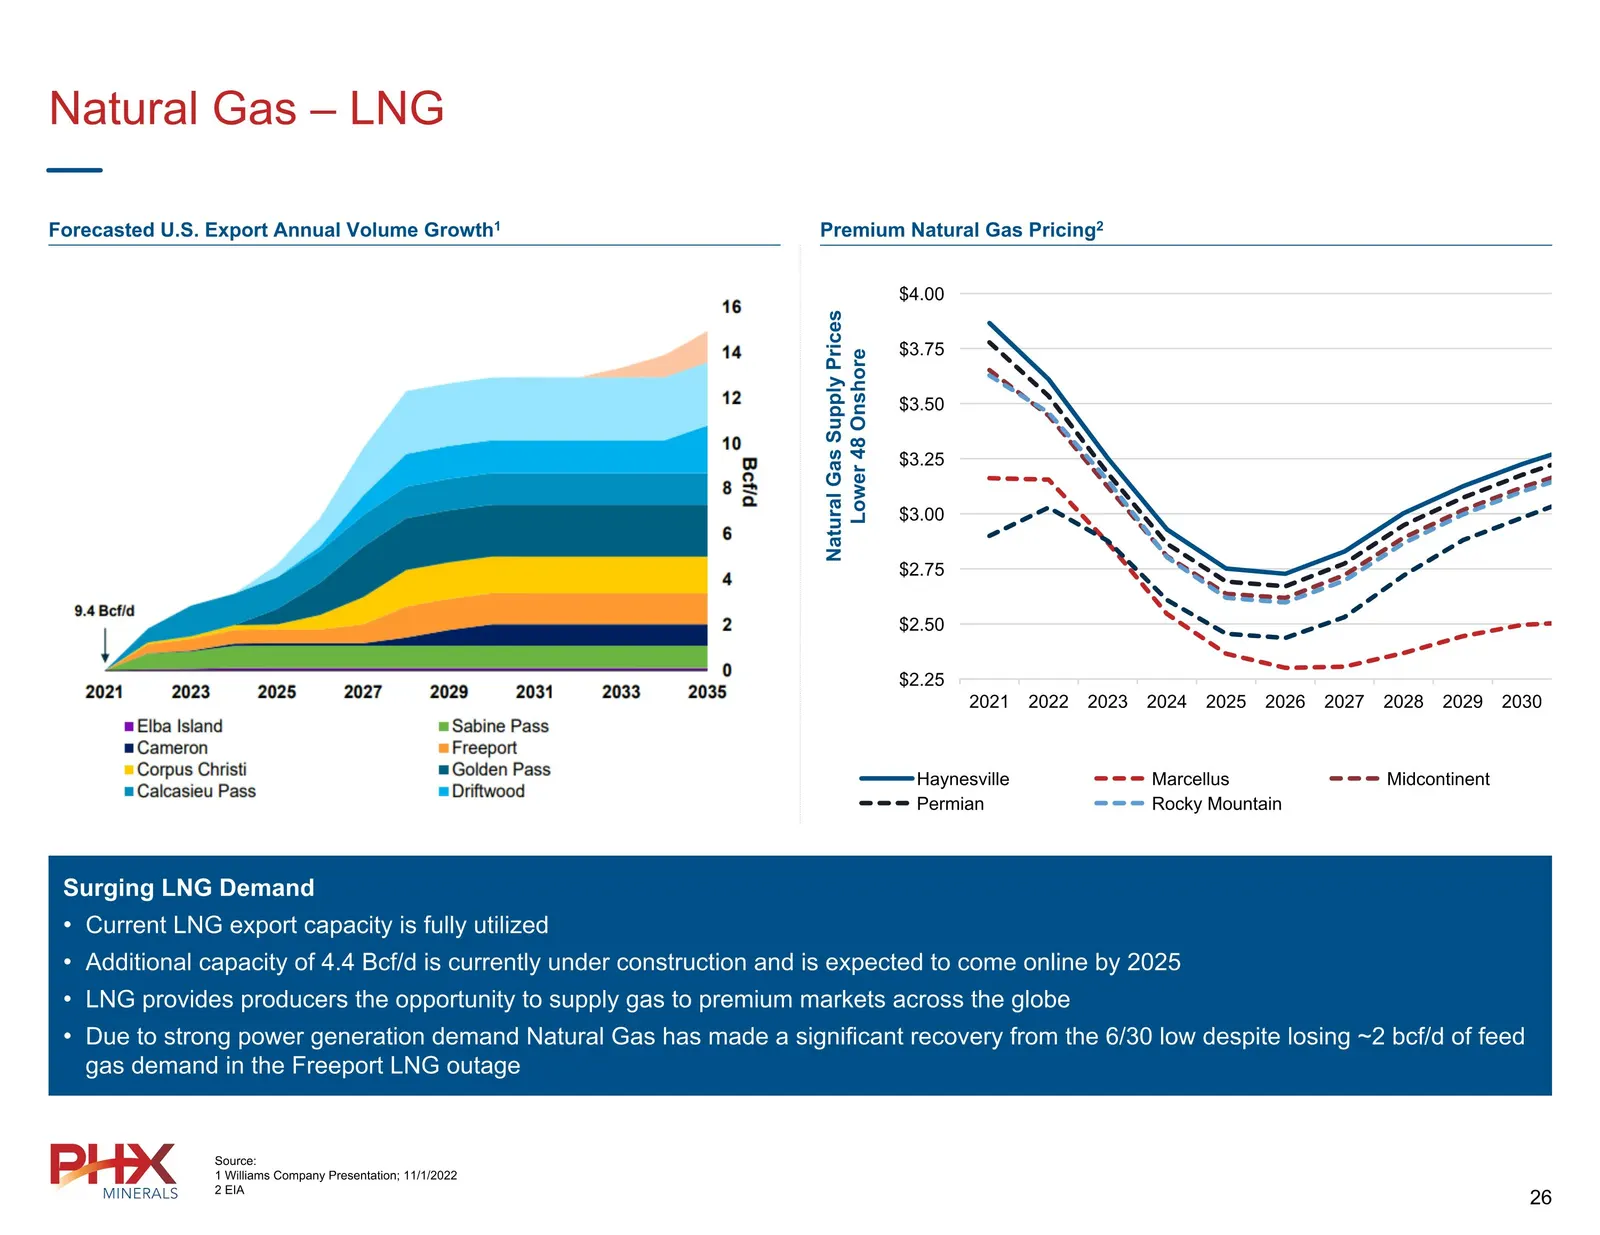
Natural Gas – LNG Forecasted U.S. Export Annual Volume Growth1 Premium Natural Gas Pricing2 Surging LNG Demand Current LNG export capacity is fully utilized Additional capacity of 4.4 Bcf/d is currently under construction and is expected to come online by 2025 LNG provides producers the opportunity
Slide 27: Portfolio Overview by Basin
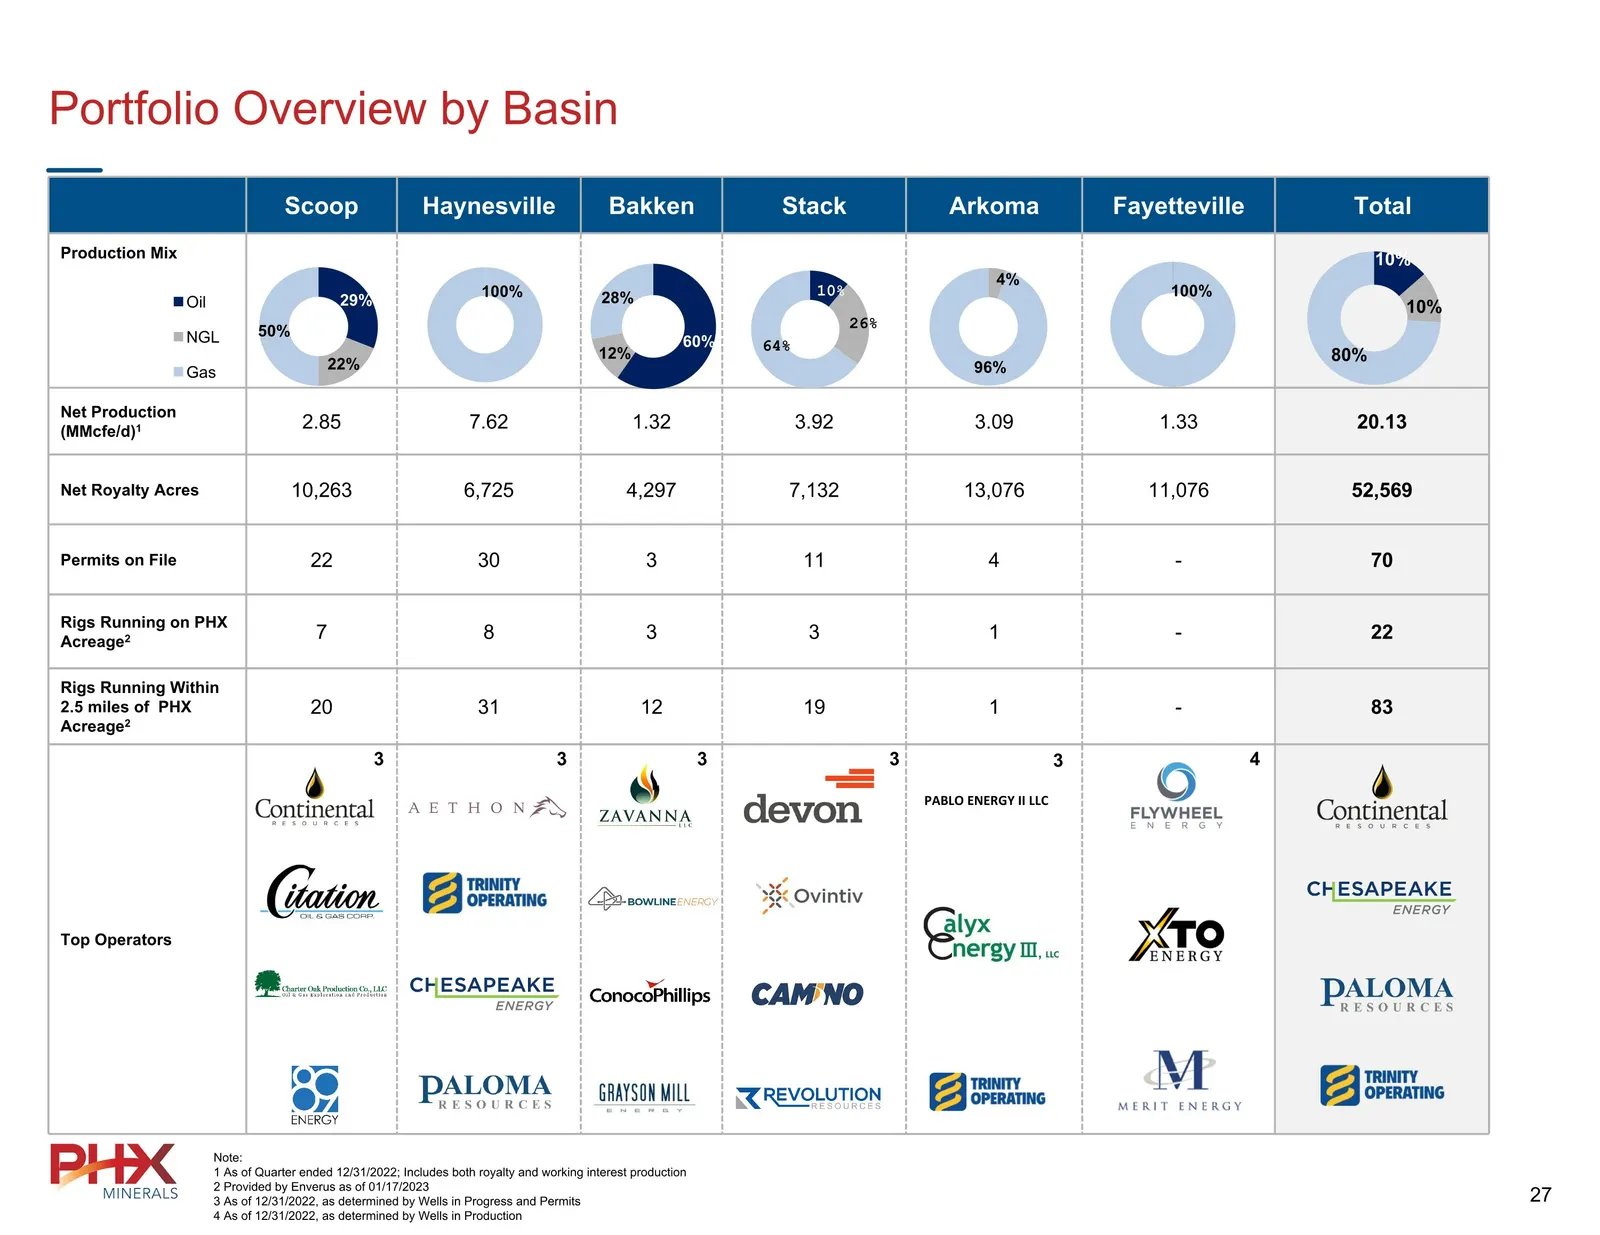
Scoop Haynesville Bakken Stack Arkoma Fayetteville Total Production Mix Net Production (MMcfe/d)1 2.85 7.62 1.32 3.92 3.09 1.33 20.13 Net Royalty Acres 10,263 6,725 4,297 7,132 13,076 11,076 52,569 Permits on File 22 30 3 11 4 - 70 Rigs Running on PHX Acreage2 7 8 3 3 1 - 22 Rigs Running Within 2.5
Slide 28: Mineral Interests - Primer
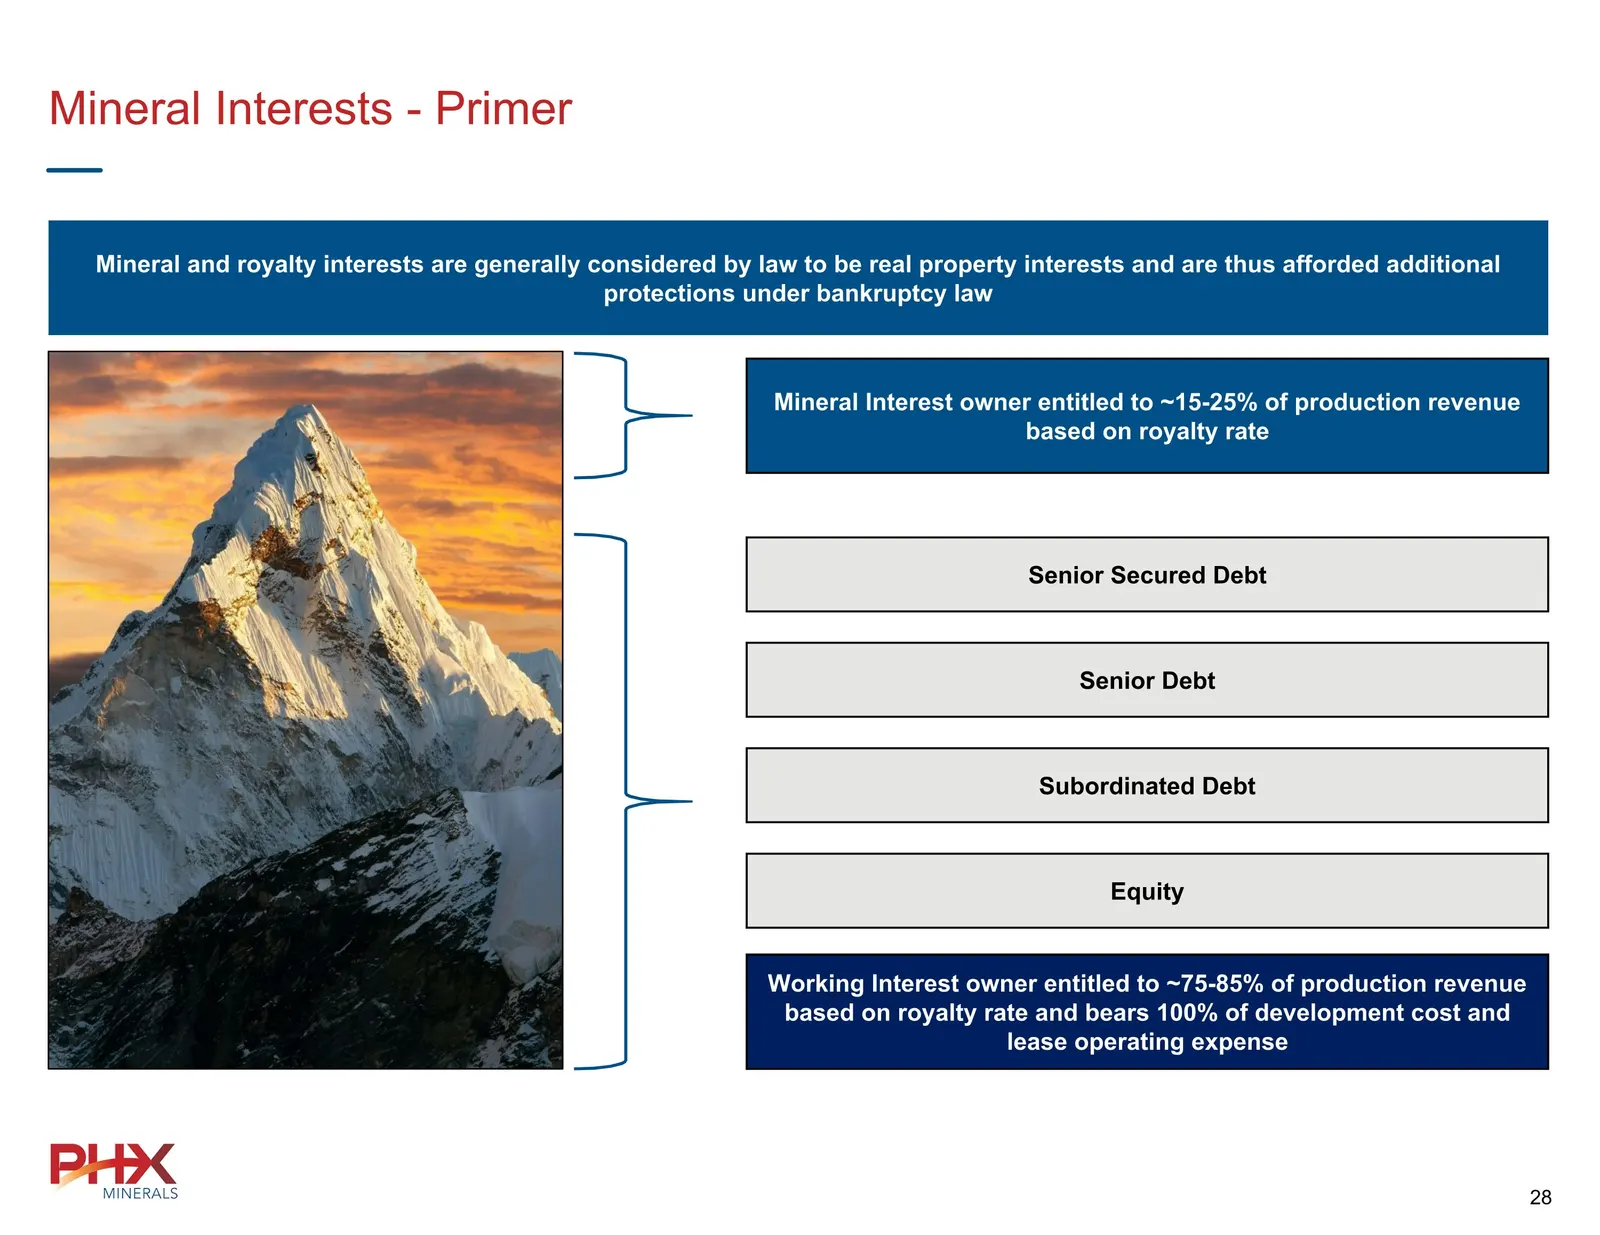
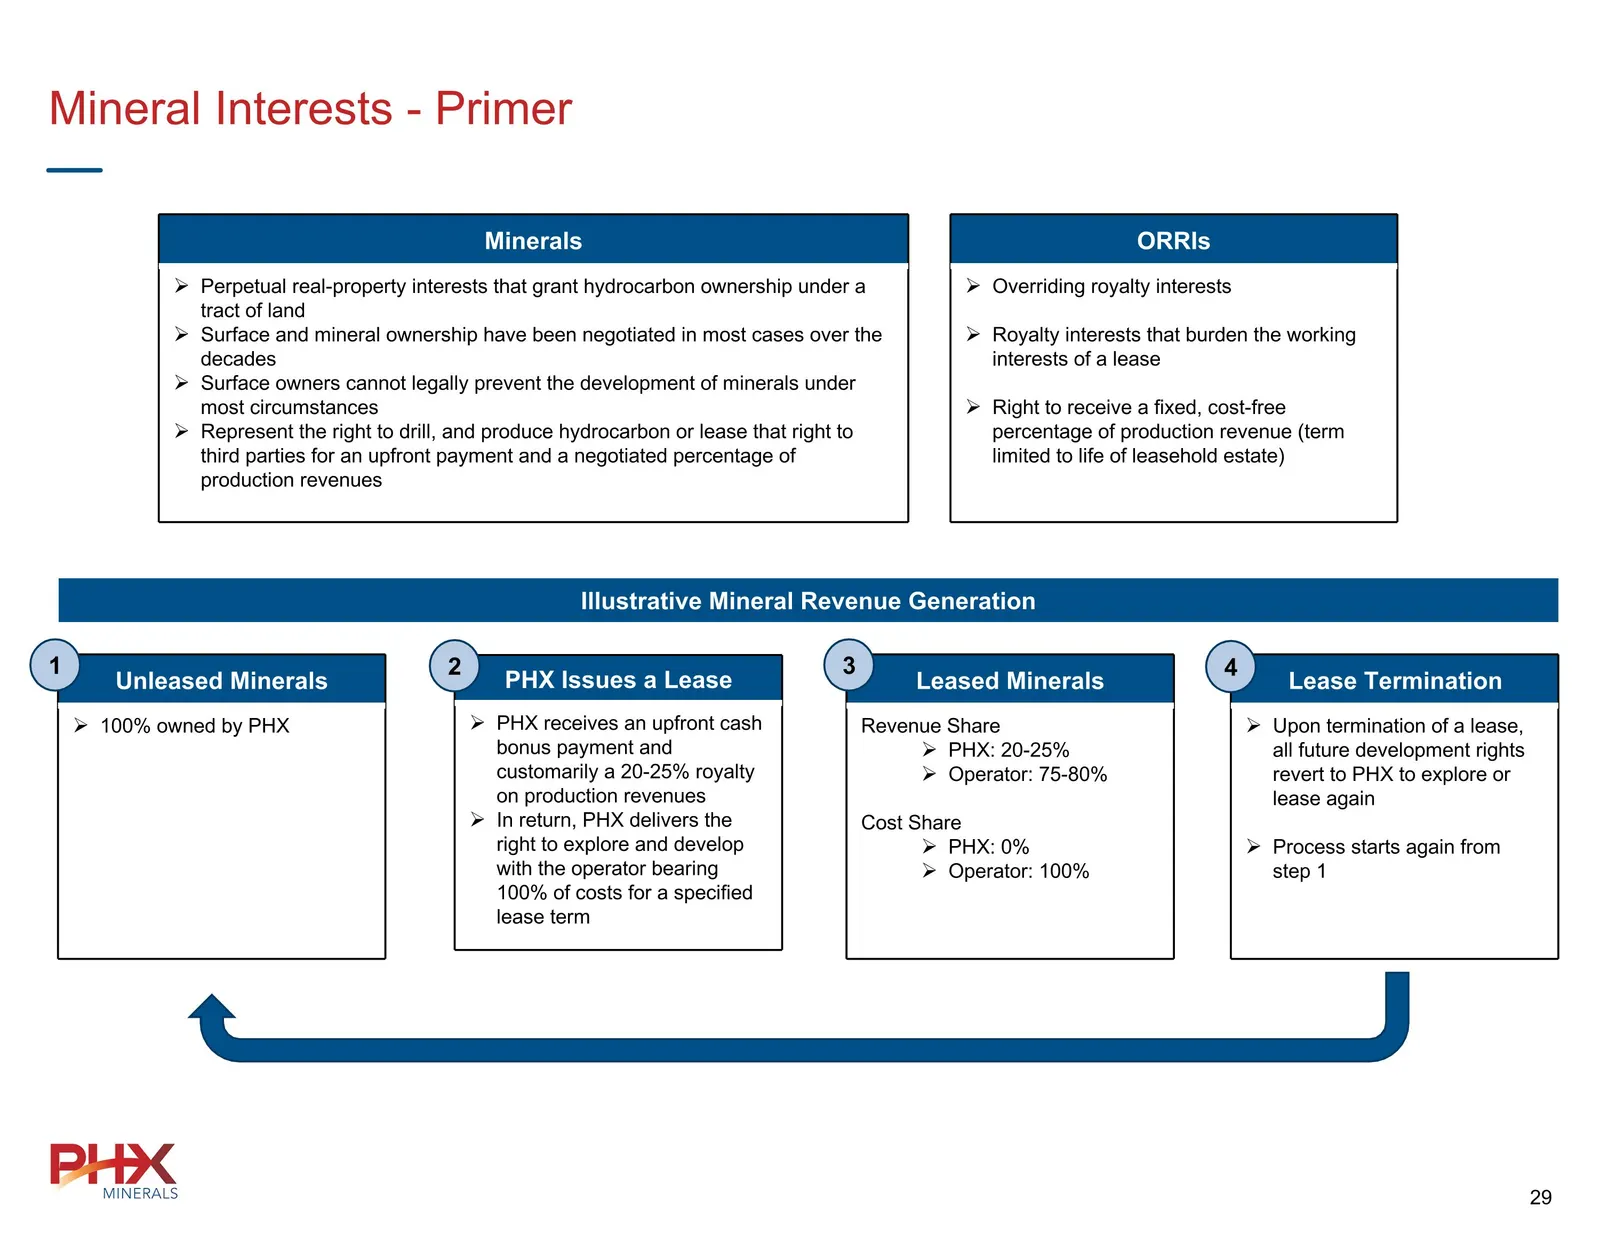
Mineral Interests - Primer Mineral and royalty interests are generally considered by law to be real property interests and are thus afforded additional protections under bankruptcy law Working Interest owner entitled to ~75-85% of production revenue based on royalty rate and bears 100% of developmen
Slide 29: Mineral Interests - Primer: Illustrative Mineral Revenue Generation
Mineral Interests - Primer Illustrative Mineral Revenue Generation Unleased Minerals 100% owned by PHX PHX Issues a Lease PHX receives an upfront cash bonus payment and customarily a 20-25% royalty on production revenues In return, PHX delivers the right to explore and develop with the operator bear
Slide 30: Reconciliation of Non-GAAP Financial Measures
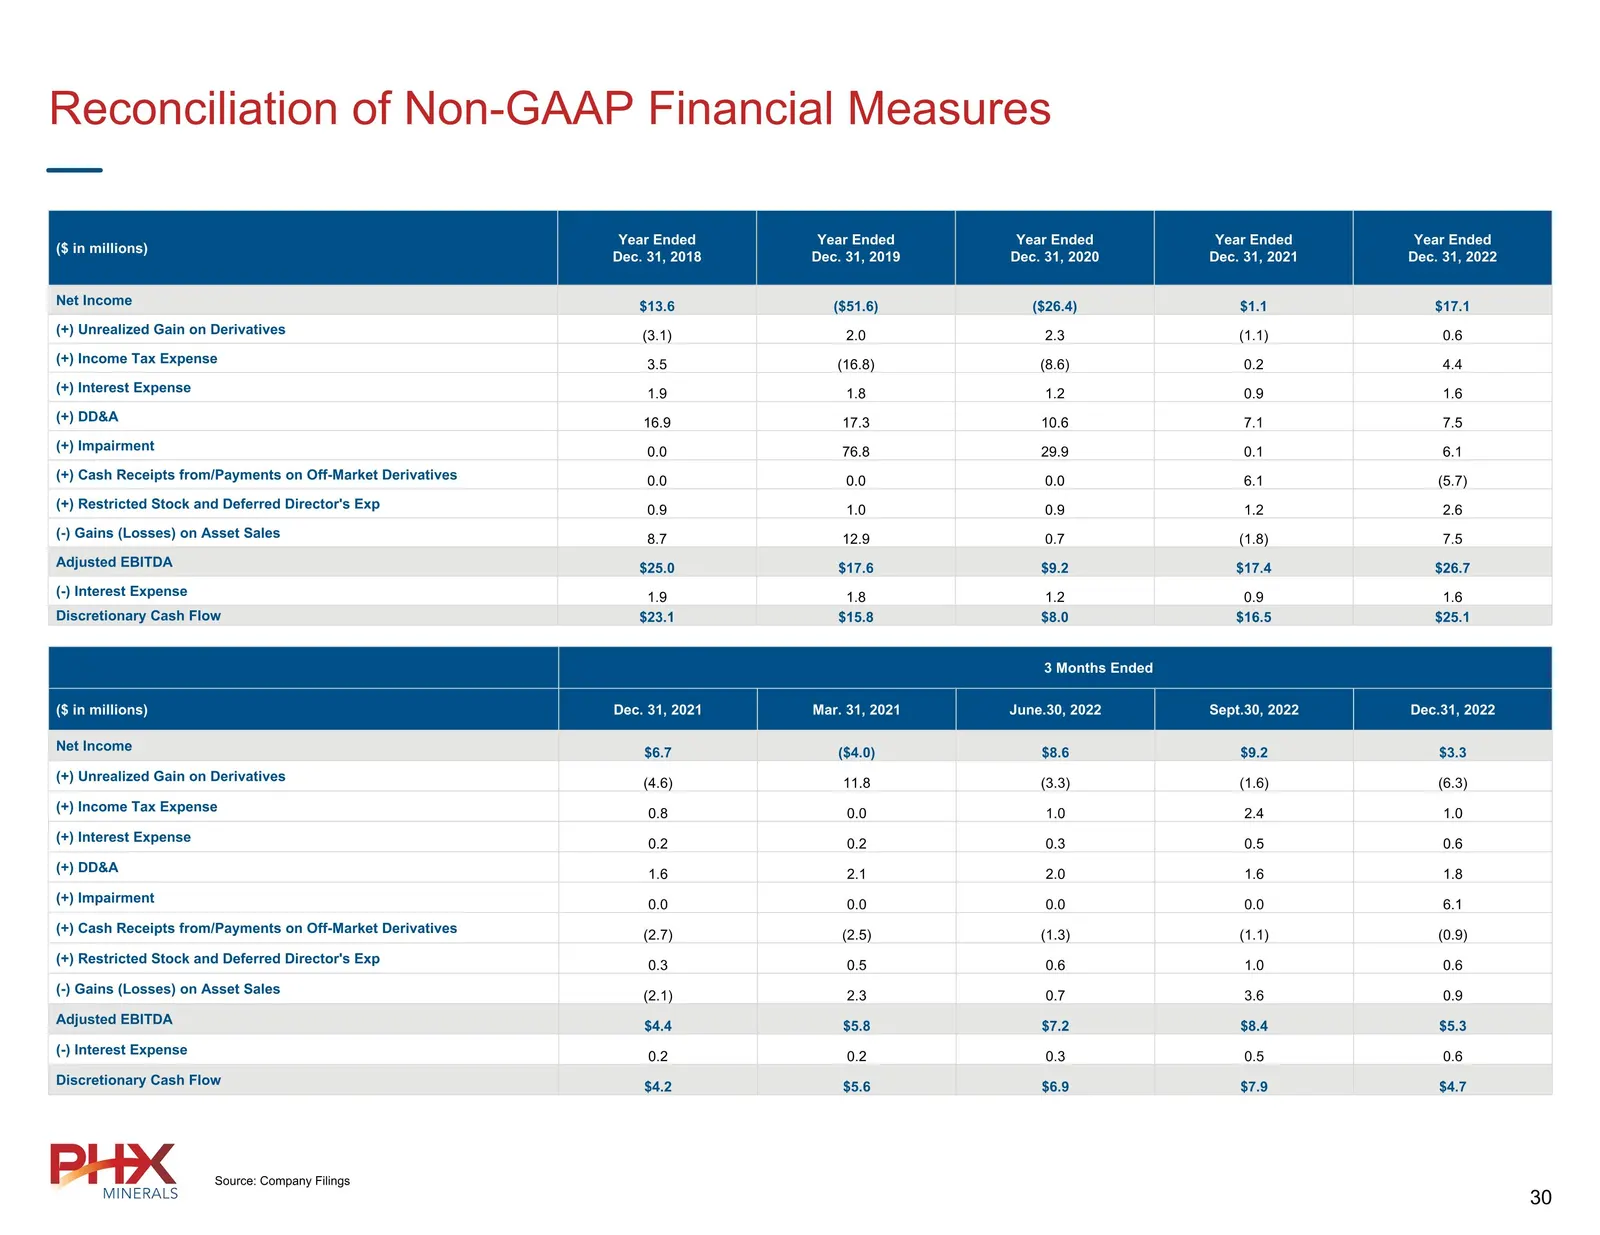
Reconciliation of Non-GAAP Financial Measures ($ in millions) Year Ended Dec. 31, 2018 Year Ended Dec. 31, 2019 Year Ended Dec. 31, 2020 Year Ended Dec. 31, 2021 Year Ended Dec. 31, 2022 Net Income $13.6 ($51.6) ($26.4) $1.1 $17.1 (+) Unrealized Gain on Derivatives (3.1) 2.0 2.3 (1.1) 0.6 (+) Income
Source: SEC EDGAR · 8-K filed Feb 8, 2023
More decks from PHX Minerals Inc
 Investor Presentation (March 2025)29 slides · Mar 12, 2025
 Investor Presentation (November 2024)33 slides · Nov 6, 2024
 Investor Presentation (August 2024)33 slides · Aug 7, 2024
 Investor Presentation (May 2024)33 slides · May 8, 2024
 Investor Presentation (March 2024)33 slides · Mar 12, 2024
 Investor Presentation (November 2023)40 slides · Nov 8, 2023