Intercorp Financial Services Inc. · NYSE:IFS
Intercorp Financial Services — Q3 2026 Earnings Presentation
54 slides from Intercorp Financial Services's earnings presentation, November 2026

Slide 1: 3Q26 IFS earnings presentation
3Q26 IFS earnings presentation is.com.pe
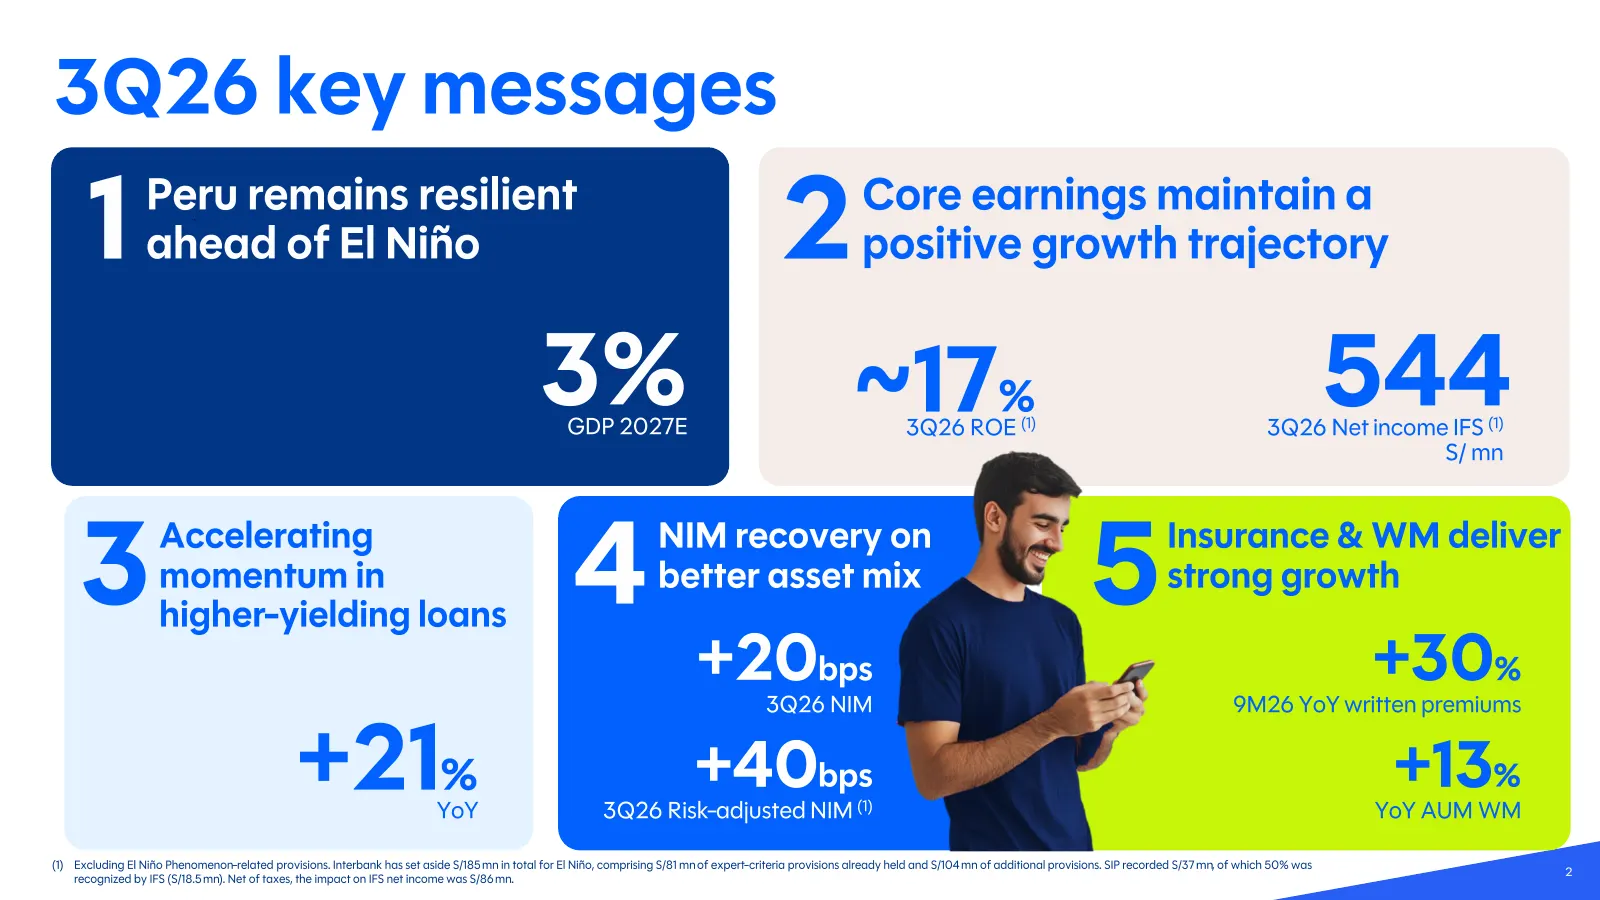
Slide 2: 3Q26 key messages
3Q26 key messages 1 Resilient despite profitability Peru remains ahead prudent resilient of El Niño provisioning 2 Core earnings maintain a positive growth trajectory 3% GDP 2027E ~17% 3Q26 ROE (1) 544 3Q26 Net income IFS (1) S/ mn 3 Accelerating momentum in higher -yielding loans 4 NIM recovery on
Slide 3: Peru remains resilient ahead of El Niño
Peru remains resilient ahead of El Niño 3
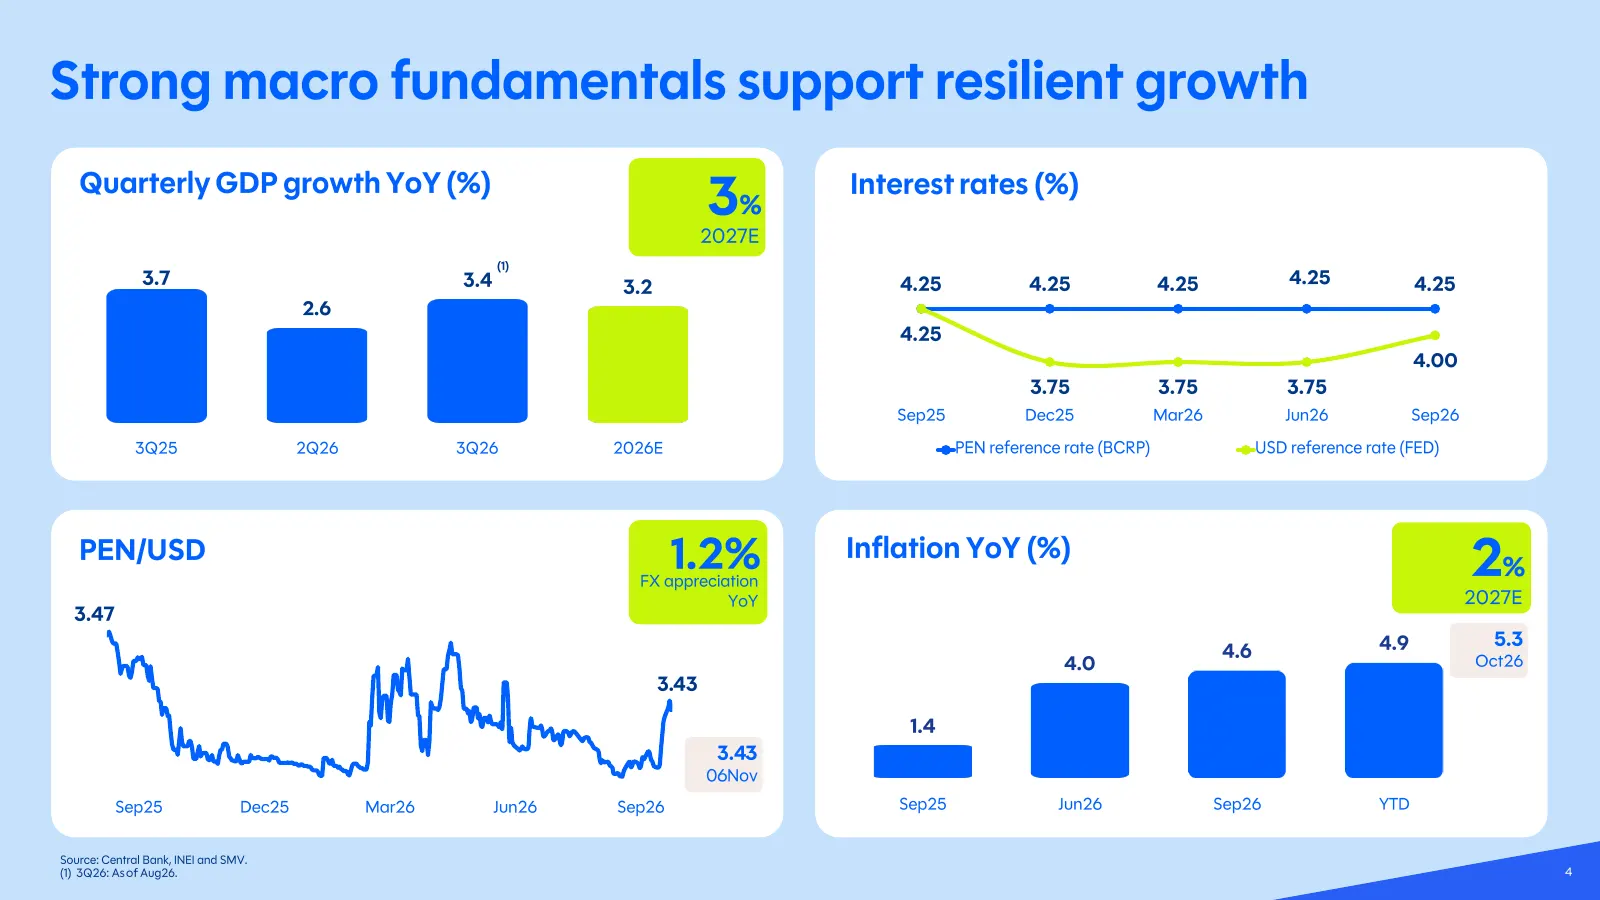
Slide 4: Strong macro fundamentals support resilient growth
Strong macro fundamentals support resilient growth Quarterly GDP growth YoY (%) Interest rates (%) 3% 2027E (1) 3.7 3.4 3.2 4.25 4.25 4.25 4.25 4.25 2.6 4.25 4.00 3.75 3.75 3.75 Sep25 Dec25 Mar26 Jun26 Sep26 3Q25 2Q26 3Q26 2026E PEN reference rate (BCRP) USD reference rate (FED) PEN/USD 1.2% FX appr
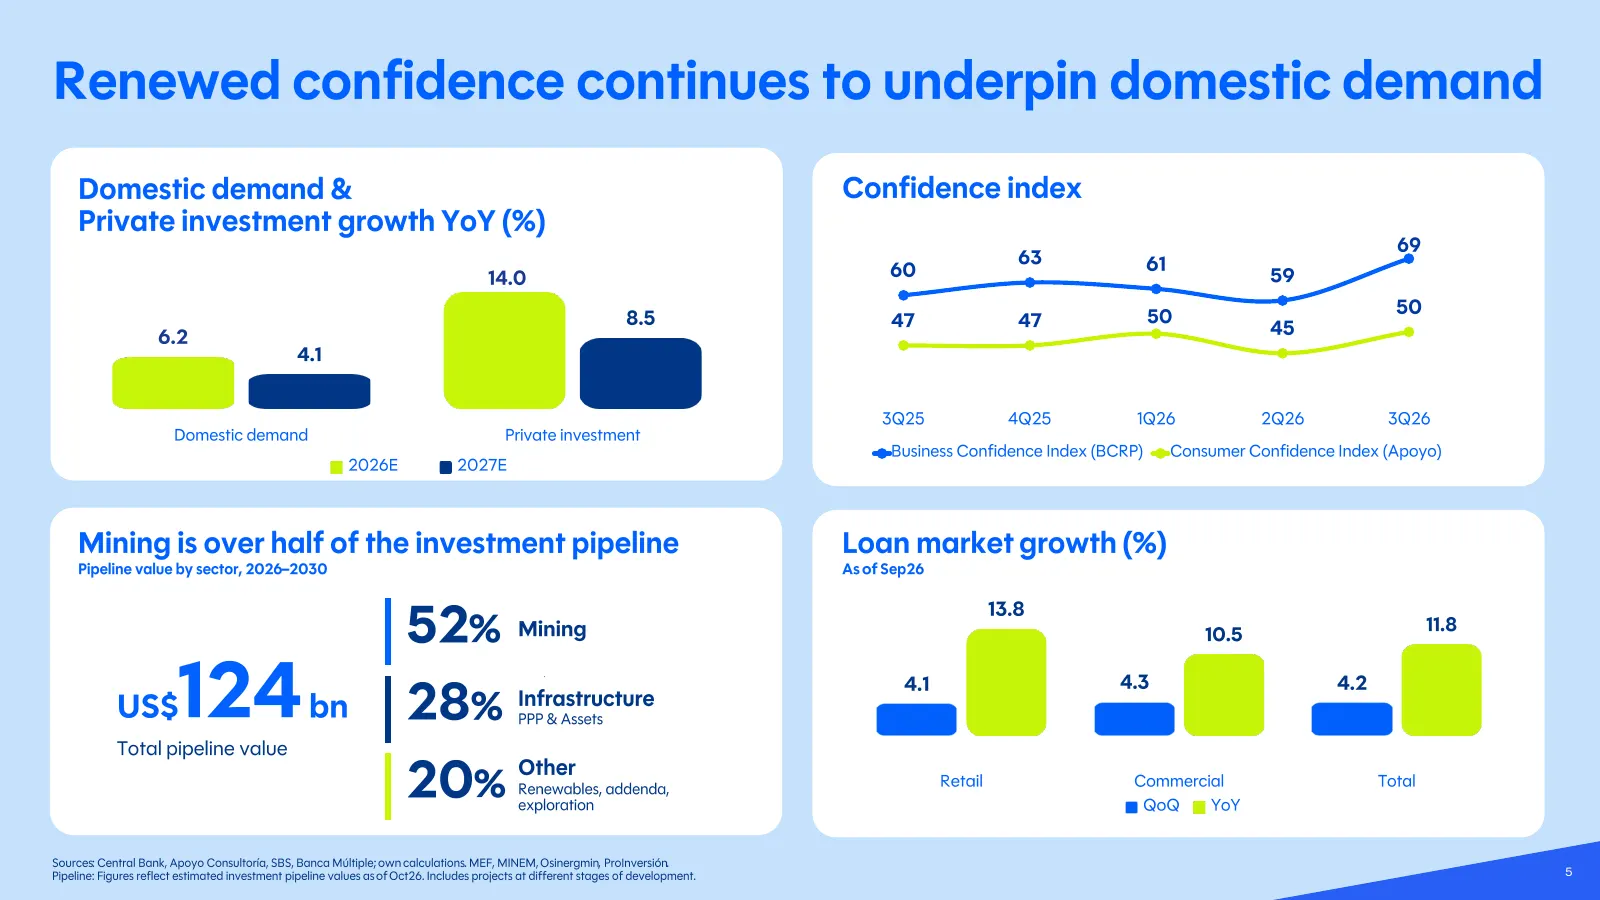
Slide 5: Renewed confidence continues to underpin domestic demand
Renewed confidence continues to underpin domestic demand Domestic demand & Confidence index Private investment growth YoY (%) 69 63 61 14.0 60 59 50 50 8.5 47 47 6.2 45 4.1 3Q25 4Q25 1Q26 2Q26 3Q26 Domestic demand Private investment Business Confidence Index (BCRP) Consumer Confidence Index (Apoyo)
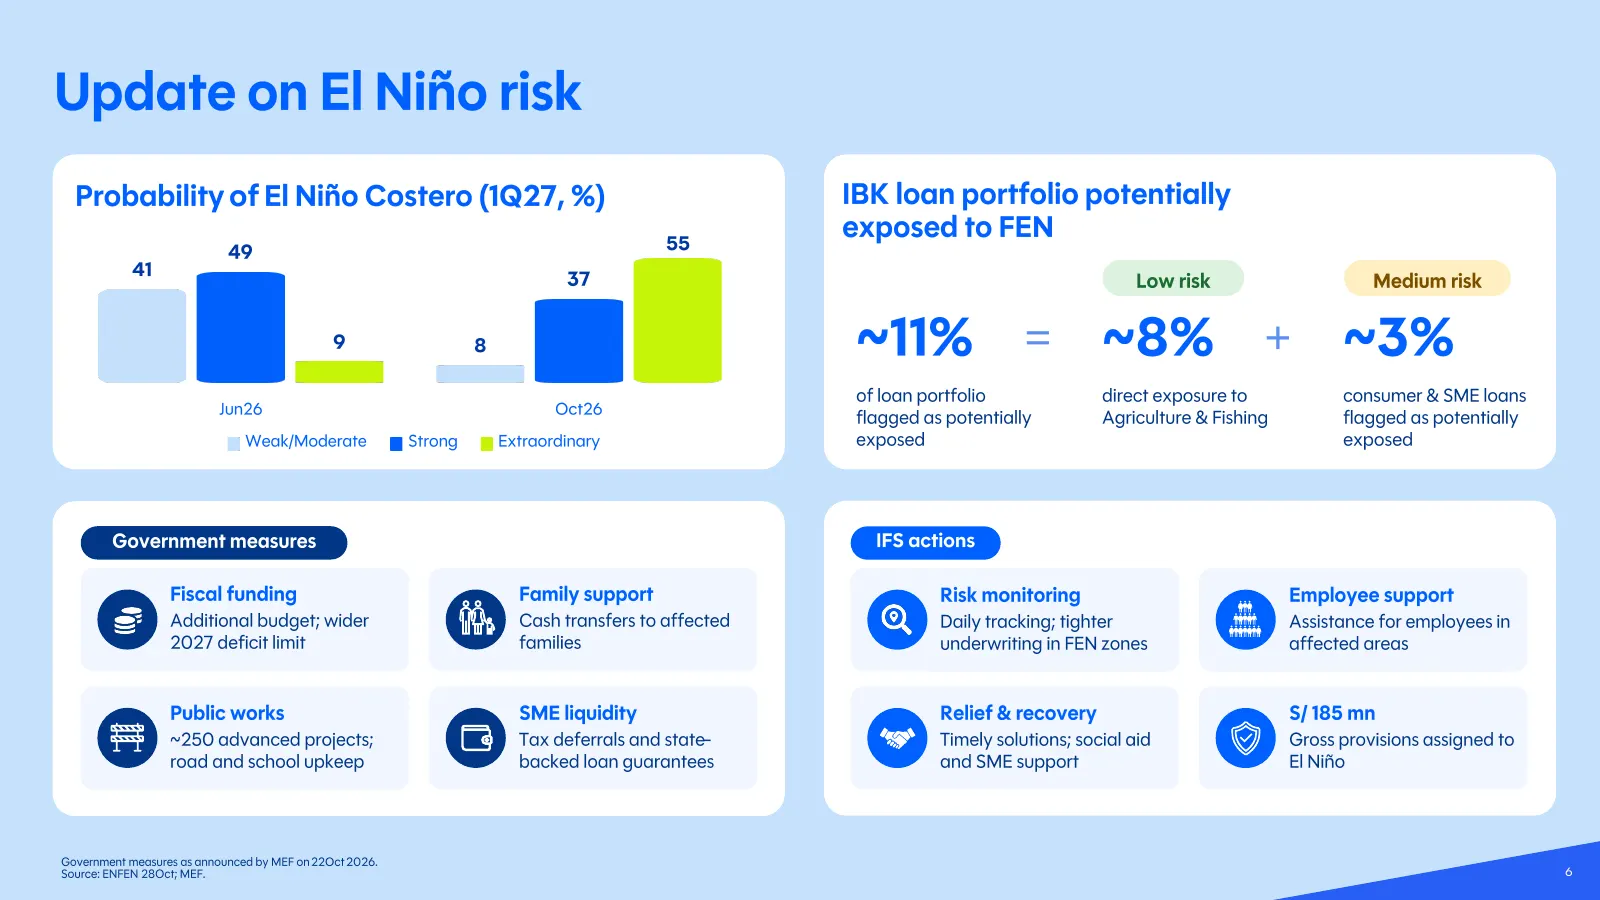
Slide 6: Update on El Niño risk
Update on El Niño risk Probability of El Niño Costero (1Q27, %) IBK loan portfolio potentially 55 exposed to FEN 49 41 37 Low risk Medium risk 9 8 ~11% = ~8% + ~3% of loan portfolio direct exposure to consumer & SME loans Jun26 Oct26 flagged as potentially Agriculture & Fishing flagged as potentiall
Slide 7: Core earnings maintain a positive growth trajectory
Core earnings maintain a positive growth trajectory 7
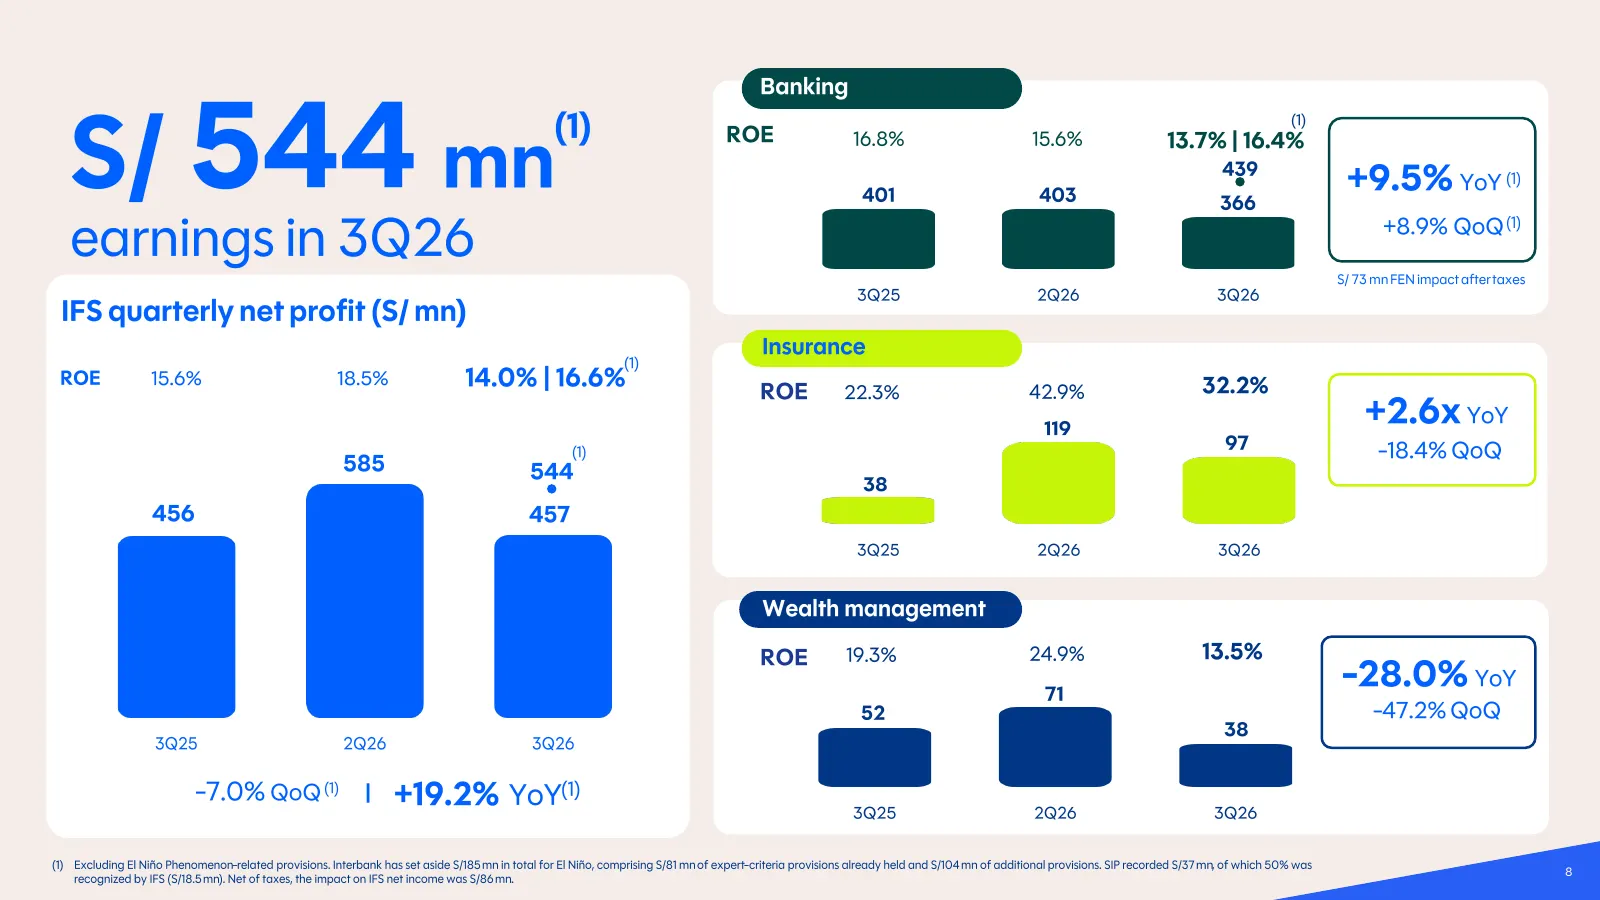
Slide 8: S/ 544 mn IFS quarterly net profit
Banking S/ 544 mn (1) (1) ROE 16.8% 15.6% 13.7% | 16.4% 439 401 403 +9.5% YoY (1) 366 earnings in 3Q26 +8.9% QoQ (1) S/ 73 mn FEN impact after taxes 3Q25 2Q26 3Q26 IFS quarterly net profit (S/ mn) Insurance (1) ROE 15.6% 18.5% 14.0% | 16.6% ROE 22.3% 42.9% 32.2% 119 +2.6x YoY (1) 97 -18.4% QoQ 585 5
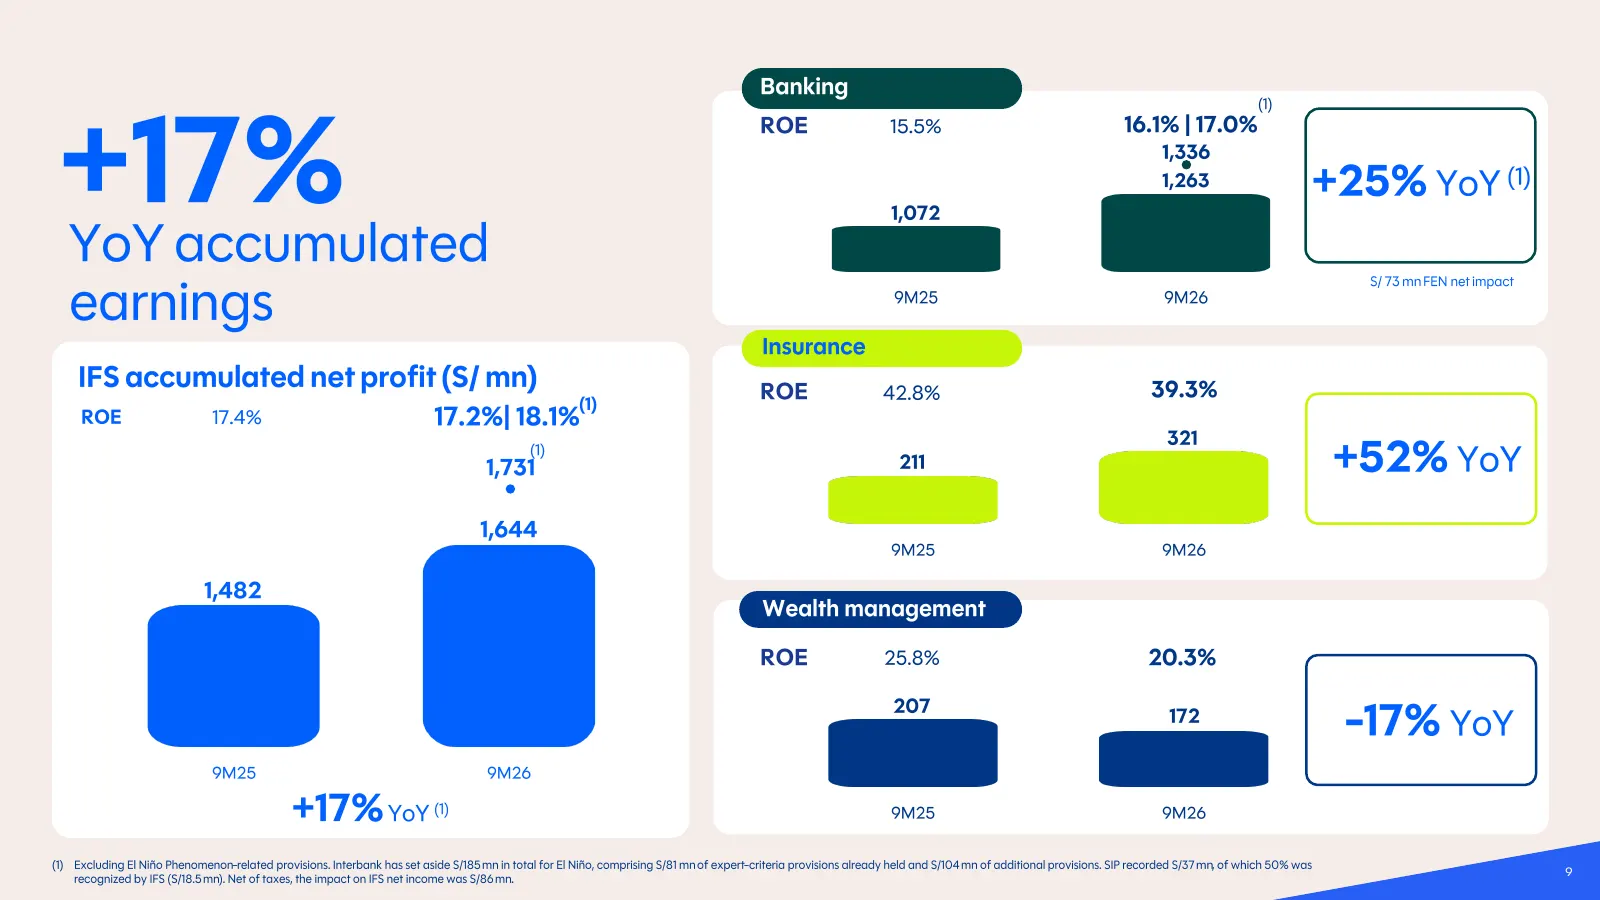
Slide 9: YoY accumulated earnings
Banking (1) +17% ROE 15.5% 16.1% | 17.0% 1,336 1,263 +25% YoY (1) 1,072 YoY accumulated S/ 73 mn FEN net impact earnings 9M25 9M26 Insurance IFS accumulated net profit (S/ mn) ROE 42.8% 39.3% (1) ROE 17.4% 17.2%| 18.1% 321 1,731 (1) 211 +52% YoY 1,644 9M25 9M26 1,482 Wealth management ROE 25.8% 20.3
Slide 10: YoY increase in revenues
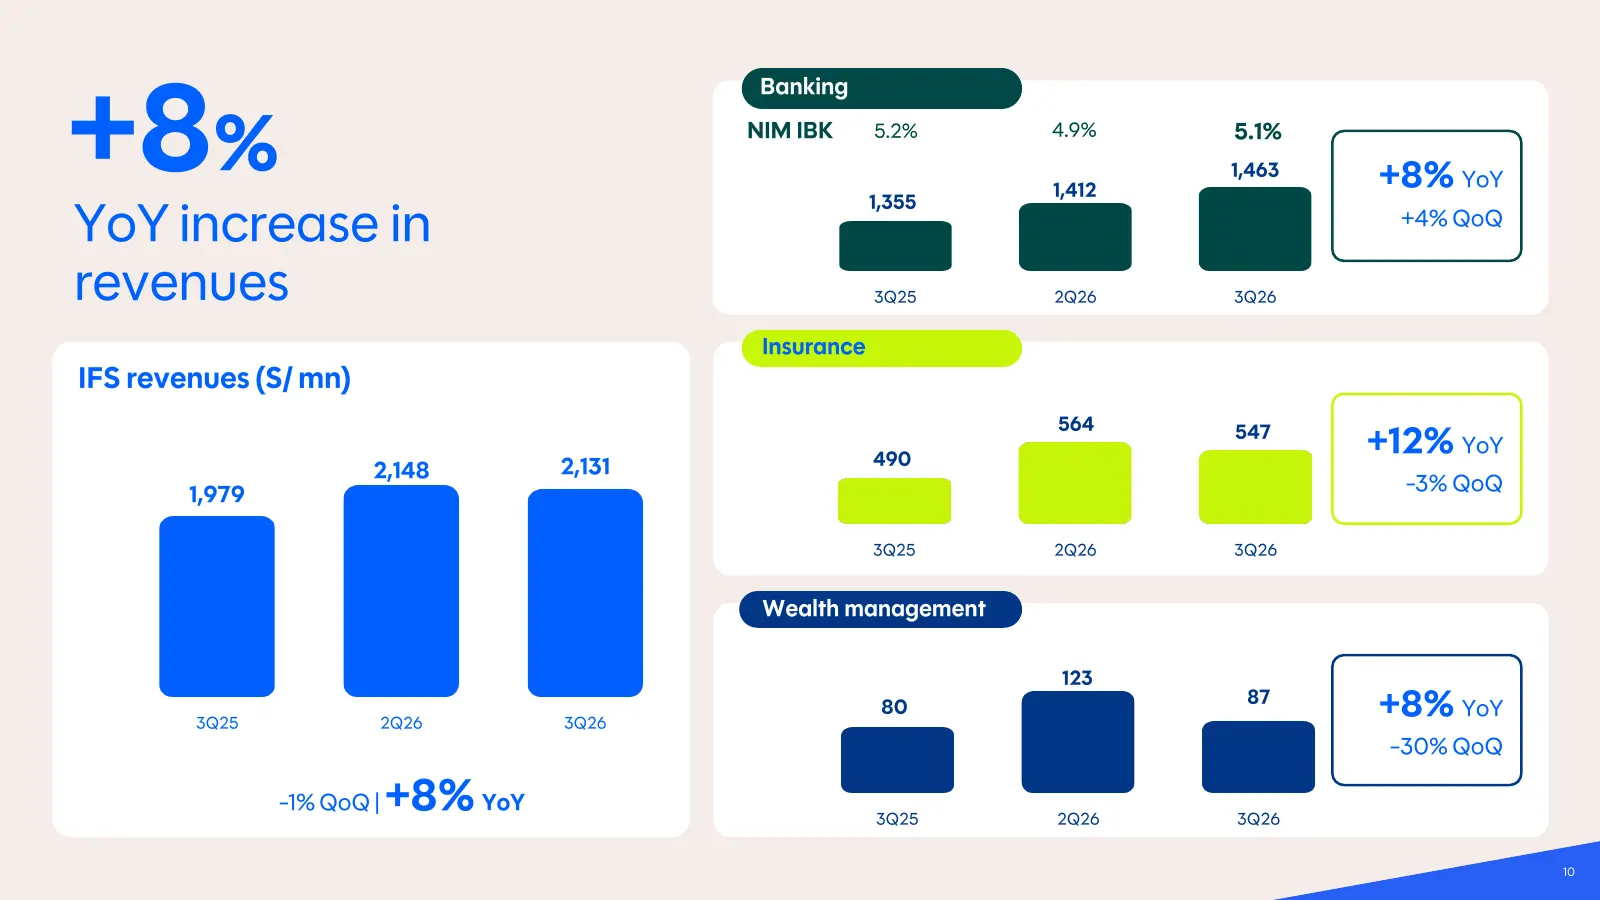
+8 % Banking NIM IBK 5.2% 4.9% 5.1% 1,412 1,463 +8% YoY 1,355 YoY increase in +4% QoQ revenues 3Q25 2Q26 3Q26 Insurance IFS revenues (S/ mn) 564 547 490 +12% YoY 2,148 2,131 1,979 -3% QoQ 3Q25 2Q26 3Q26 Wealth management 123 3Q25 2Q26 3Q26 80 87 +8% YoY -30% QoQ +8% YoY -1% QoQ | 3Q25 2Q26 3Q26 10
Slide 11: Continuous investment in technology and talent
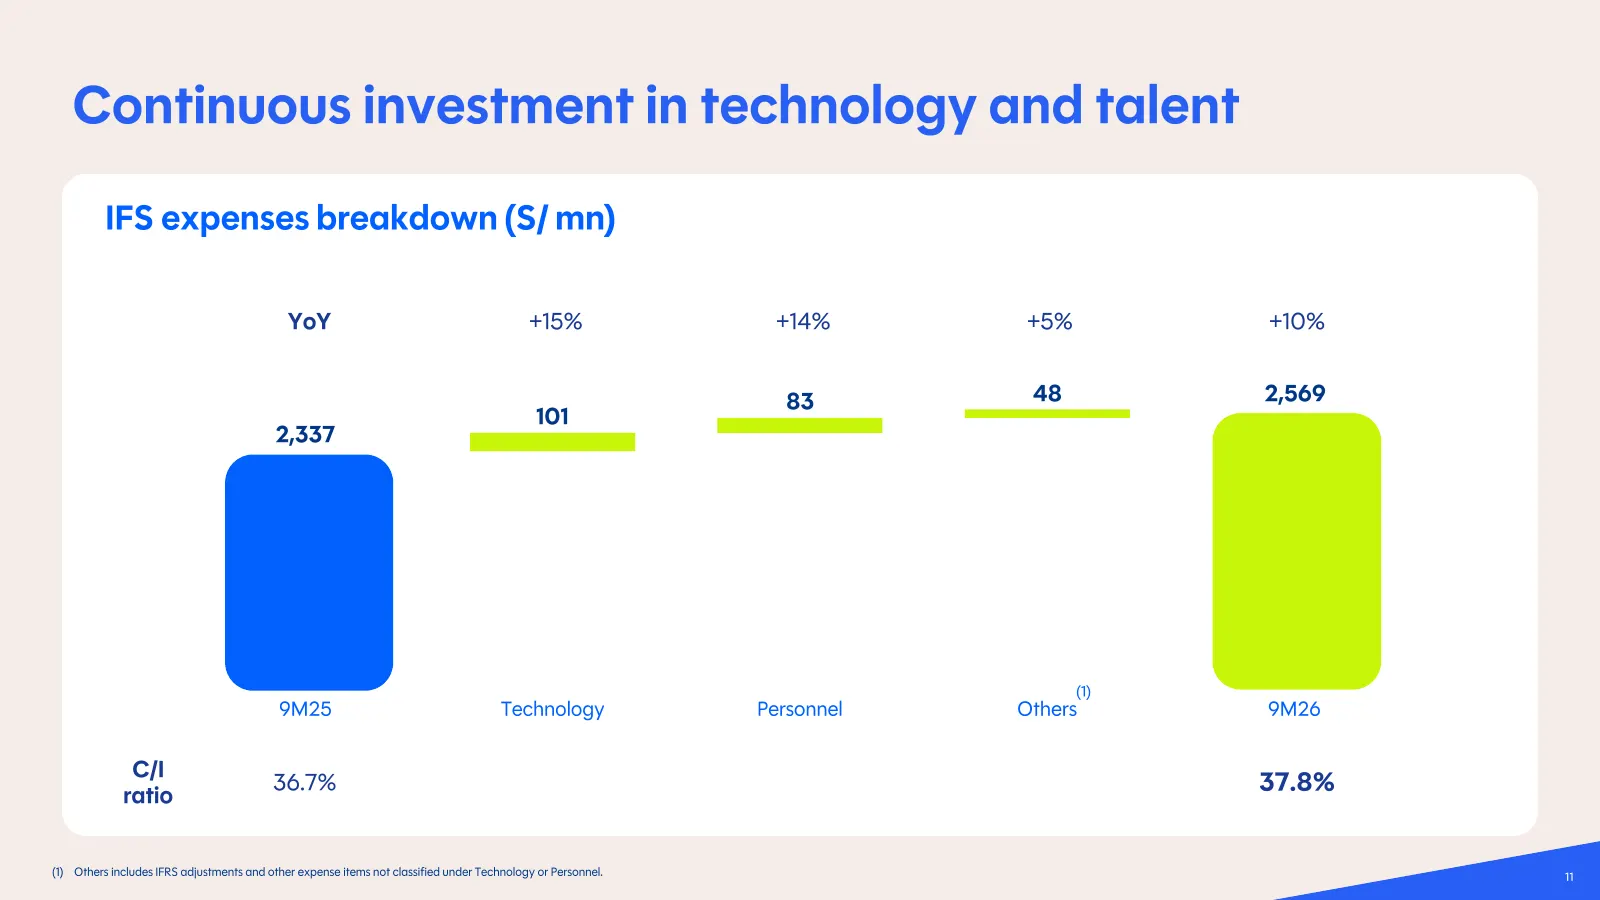
Continuous investment in technology and talent IFS expenses breakdown (S/ mn) YoY +15% +14% +5% +10% 83 48 2,569 101 2,337 (1) 9M25 Technology Personnel Others 9M26 C/I ratio 36.7% 37.8% (1) Others includes IFRS adjustments and other expense items not classified under Technology or Personnel. 11
Slide 12: Accelerating momentum in higher-yielding loans
Accelerating momentum in higher - yielding loans 12
Slide 13: Higher-yielding segments accelerate growth
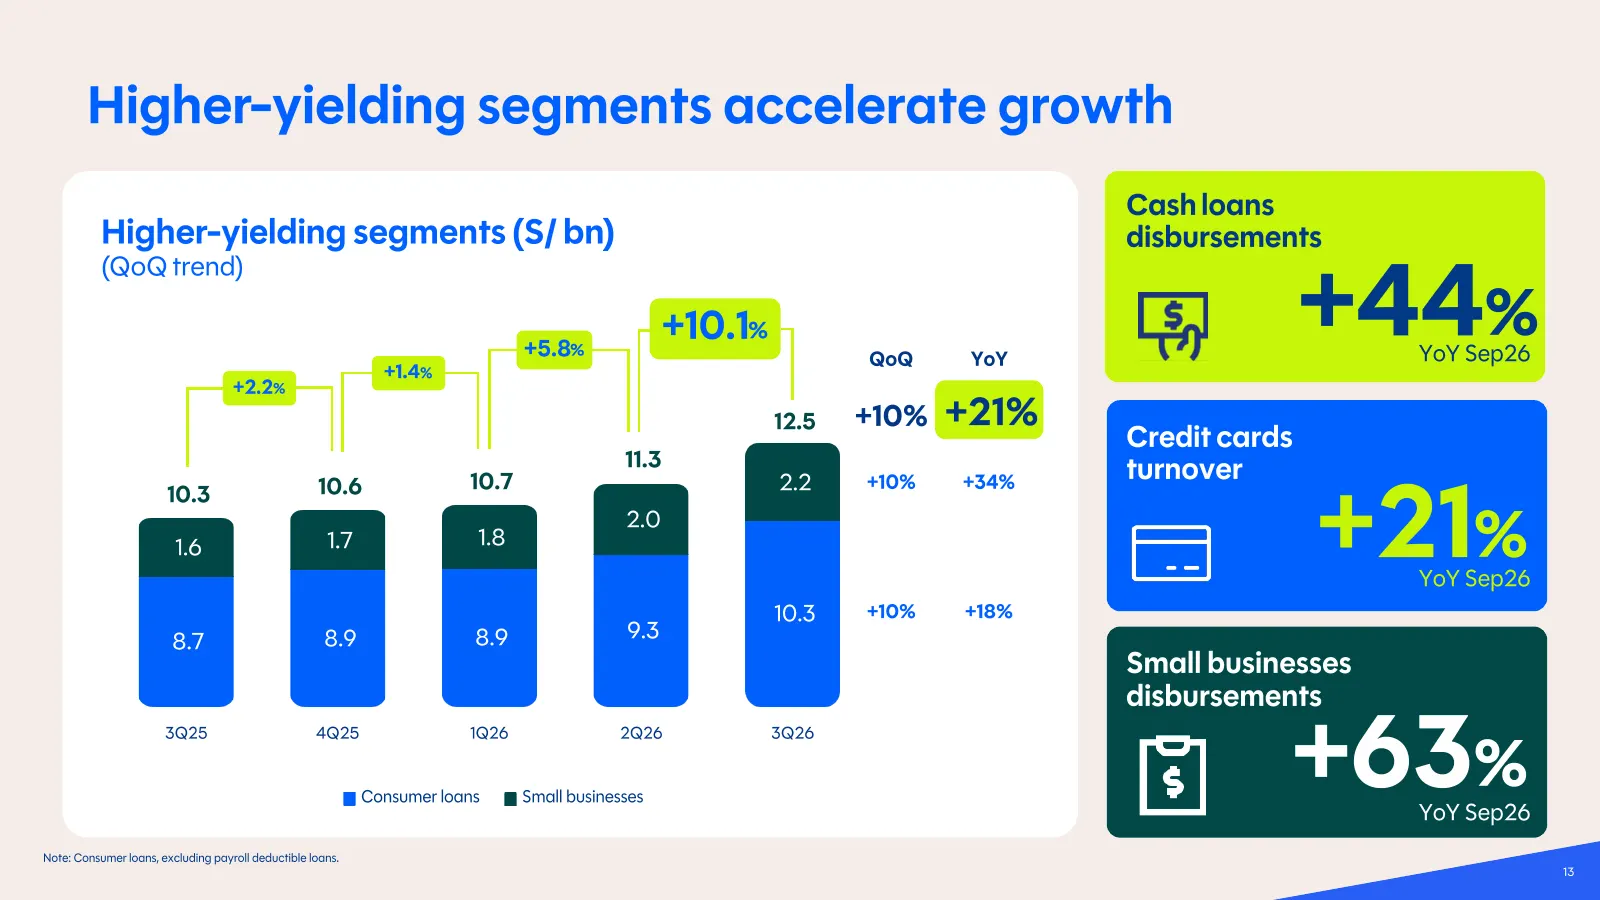
Higher -yielding segments accelerate growth Cash loans Higher -yielding segments (S/ bn) disbursements (QoQ trend ) +1.4% +5.8 % +10.1% QoQ YoY +44 % YoY Sep26 YoY Sep26 +2.2 % 12.5 +10% +21% Credit cards 11.3 10.6 10.7 2.2 +10% +34% turnover +21% 10.3 2.0 1.6 1.7 1.8 YoY Sep26 10.3 +10% +18% 8.7 8.
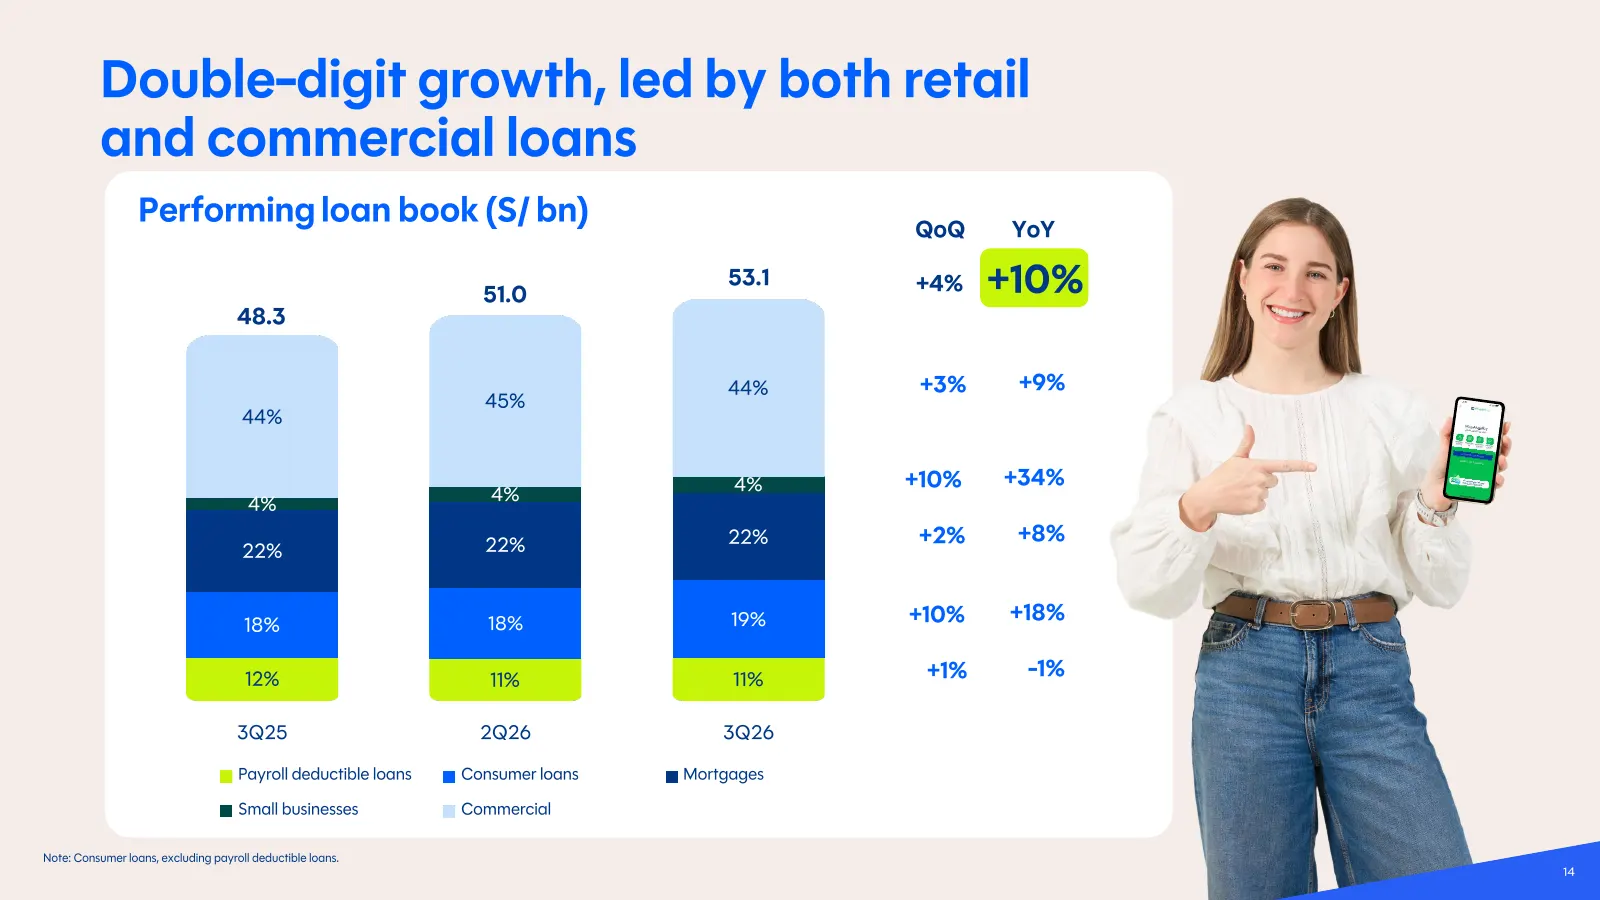
Slide 14: Double-digit growth, led by both retail and commercial loans
Double -digit growth, led by both retail and commercial loans Performing loan book (S/ bn) QoQ YoY 51.0 53.1 +4% +10% 48.3 44% +3% +9% 45% 44% 4% +10% +34% 4% 4% 22% 22% +2% +8% 22% 18% 18% 19% +10% +18% 12% 11% 11% +1% -1% 3Q25 2Q26 3Q26 Payroll deductible loans Consumer loans Mortgages Small busin
Slide 15: NIM recovery on better asset mix
NIM recovery on better asset mix 15
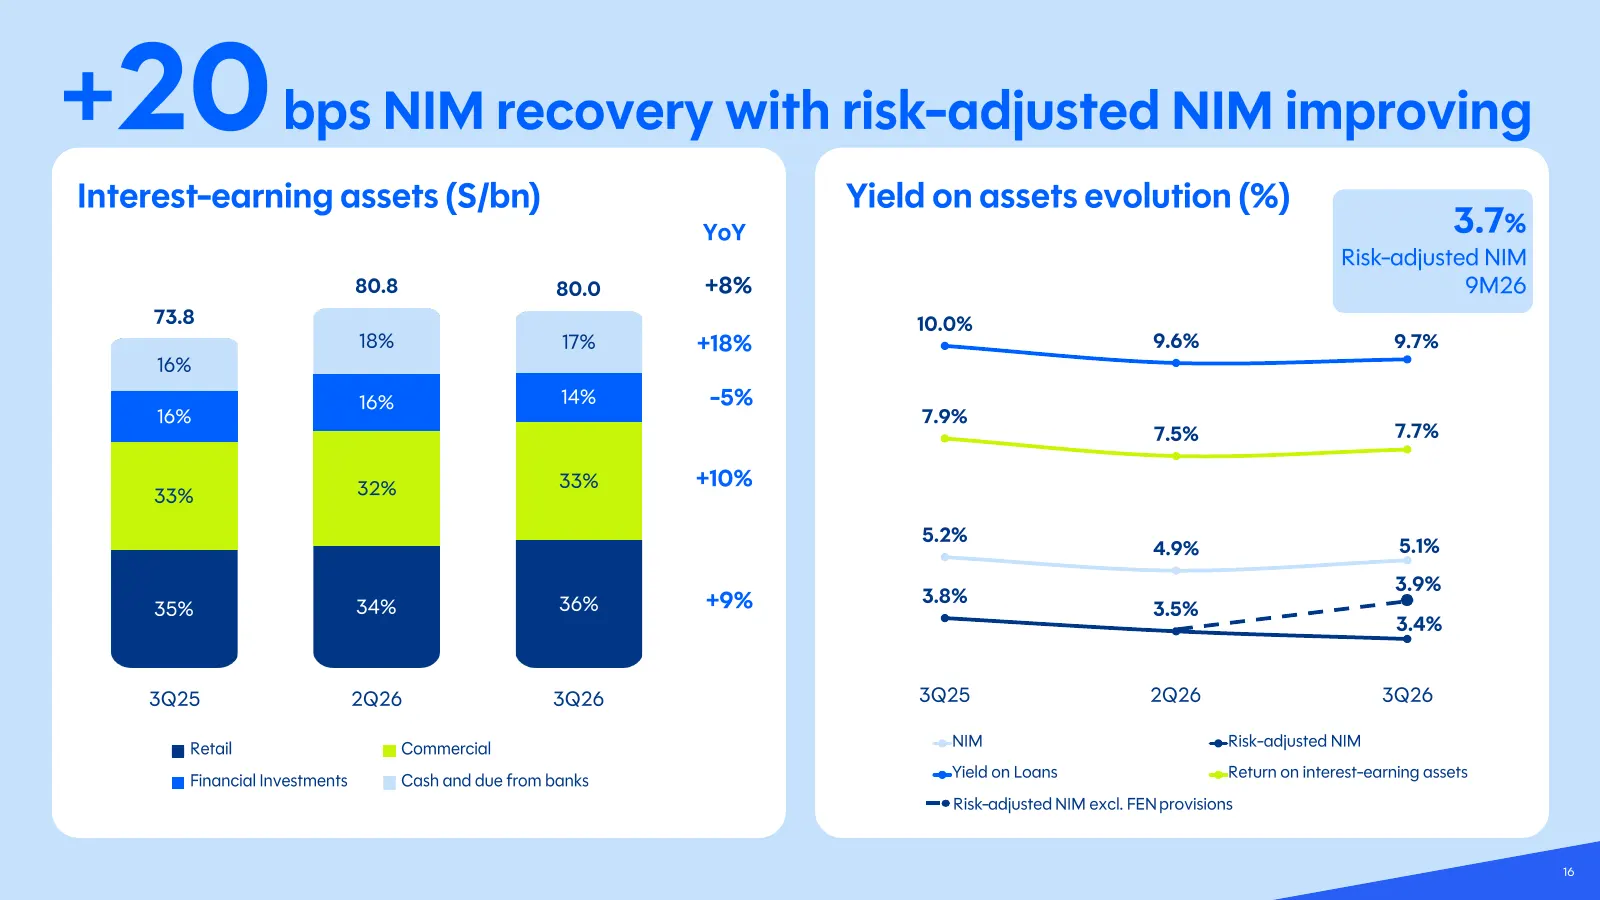
Slide 16: +20 bps NIM recovery with risk-adjusted NIM improving
+ 20 bps NIM recovery with risk -adjusted NIM improving Interest -earning assets (S/bn) Yield on assets evolution (%) YoY 3.7 % Risk -adjusted NIM 80.8 80.0 +8% 9M26 73.8 10.0% 18% 17% +18% 9.6% 9.7% 16% 16% 14% -5% 16% 7.9% 7.5% 7.7% 32% 33% +10% 33% 5.2% 4.9% 5.1% 3.9% 36% +9% 3.8% 35% 34% 3.5% 3.
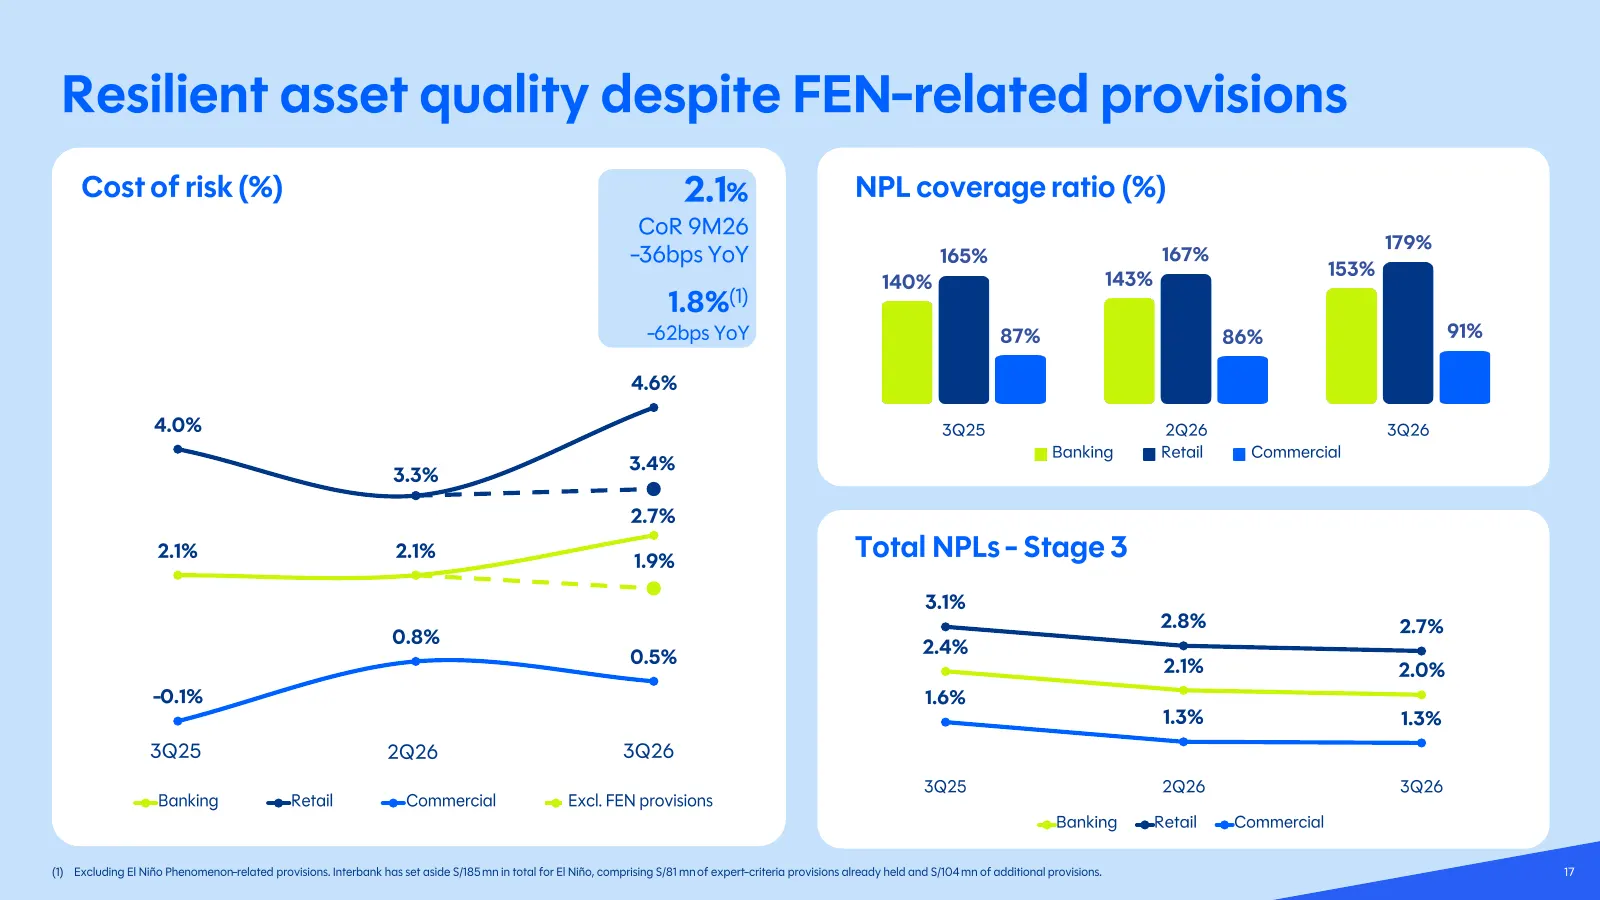
Slide 17: Resilient asset quality despite FEN-related provisions
Resilient asset quality despite FEN -related provisions Cost of risk (%) 2.1% NPL coverage ratio (%) CoR 9M26 179% -36bps YoY 165% 167% 153% 140% 143% 1.8%(1) -62bps YoY 87% 86% 91% 4.6% 4.0% 3Q25 2Q26 3Q26 Banking Retail Commercial 3.4% 3.3% 2.7% 2.1% 2.1% 1.9% Total NPLs - Stage 3 3.1% 2.8% 2.7% 0
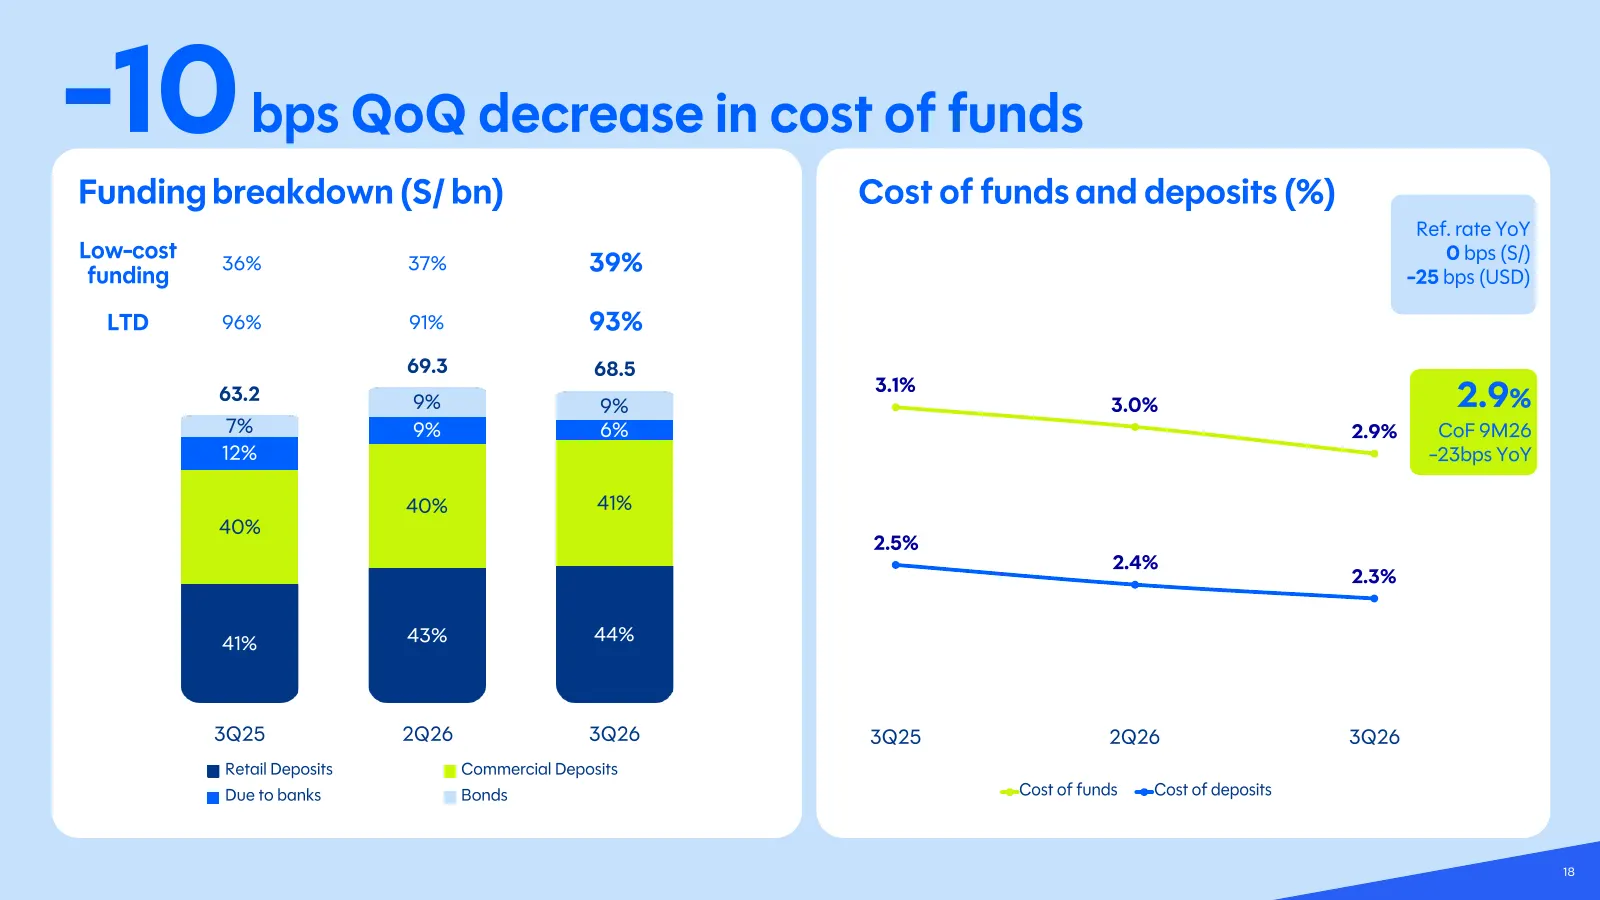
Slide 18: -10 bps QoQ decrease in cost of funds
-10 bps QoQ decrease in cost of funds Funding breakdown (S/ bn) Cost of funds and deposits (%) Ref. rate YoY Low -cost 0 bps (S/) funding 36% 37% 39% -25 bps (USD) LTD 96% 91% 93% 69.3 68.5 3.1% 63.2 9% 9% 3.0% 2.9 % 7% 9% 6% 2.9% CoF 9M26 12% -23bps YoY 40% 41% 40% 2.5% 2.4% 2.3% 41% 43% 44% 3Q25 2
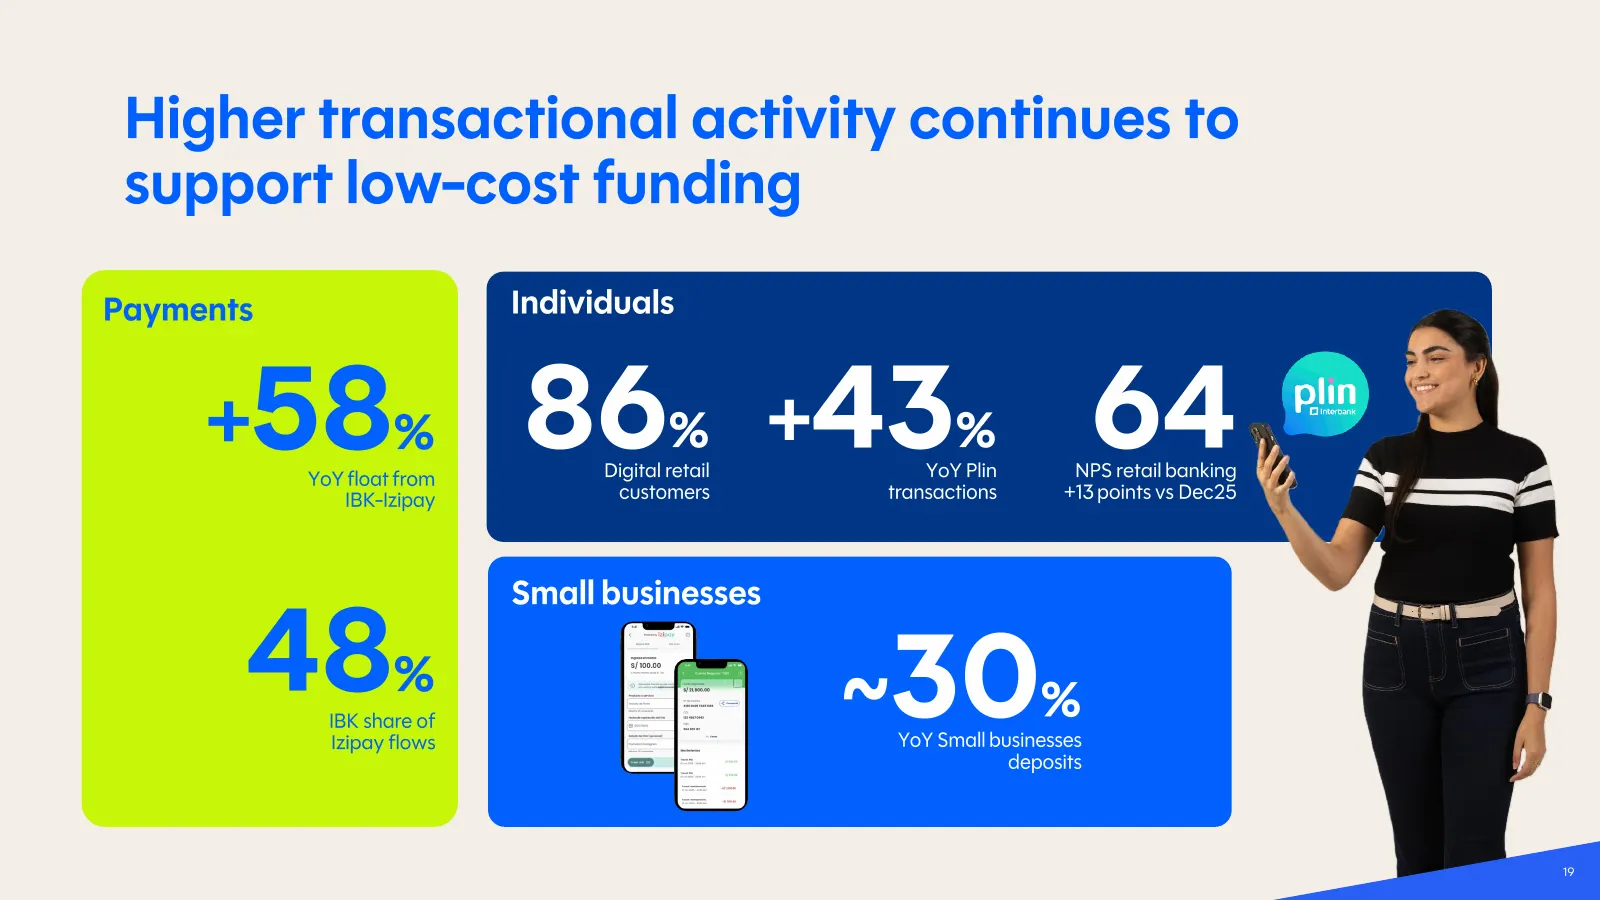
Slide 19: Higher transactional activity continues to support low-cost funding
Higher transactional activity continues to support low -cost funding Payments Individuals + 58 %YoY float from IBK -Izipay 86 % + 43 % 64 Digital retail customers YoY Plin transactions NPS retail banking +13 points vs Dec25 Small businesses 48 % IBK share of Izipay flows ~ 30 % YoY Small businesses
Slide 20: Insurance & WM continue to deliver strong growth
Insurance & WM continue to deliver strong growth 20
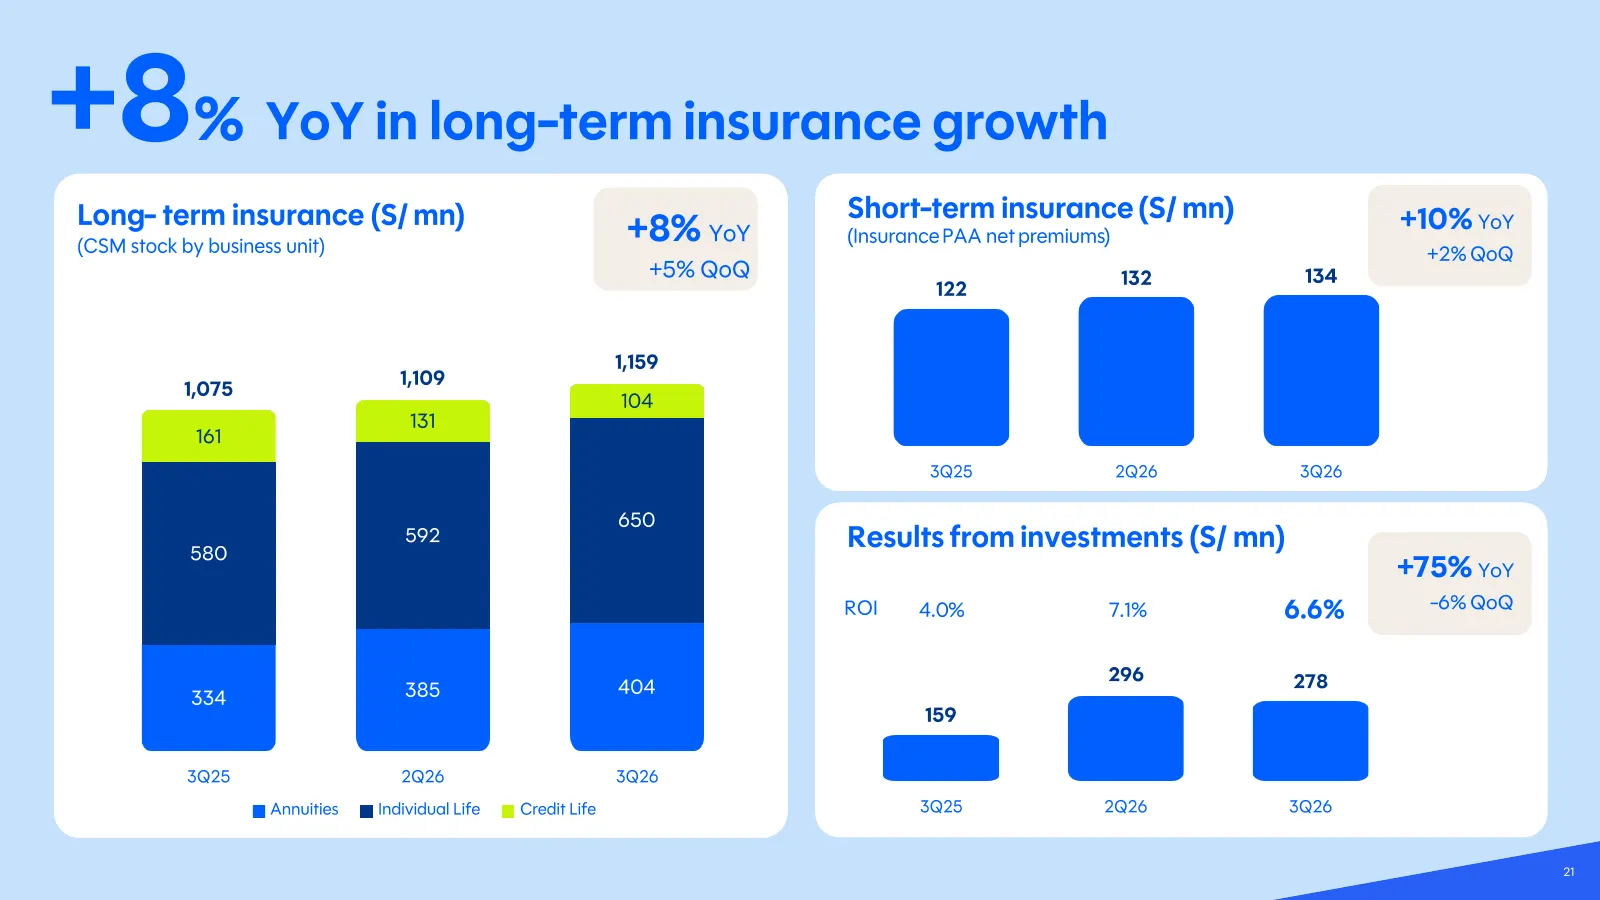
Slide 21: +8% YoY in long-term insurance growth
+8 % YoY in long -term insurance growth Long - term insurance (S/ mn) Short -term insurance (S/ mn) +10% YoY (CSM stock by business unit) +8 % YoY (Insurance PAA net premiums ) +2% QoQ +5% QoQ 132 134 122 1,159 1,109 1,075 104 131 161 3Q25 2Q26 3Q26 650 580 592 Results from investments (S/ mn) +75 %
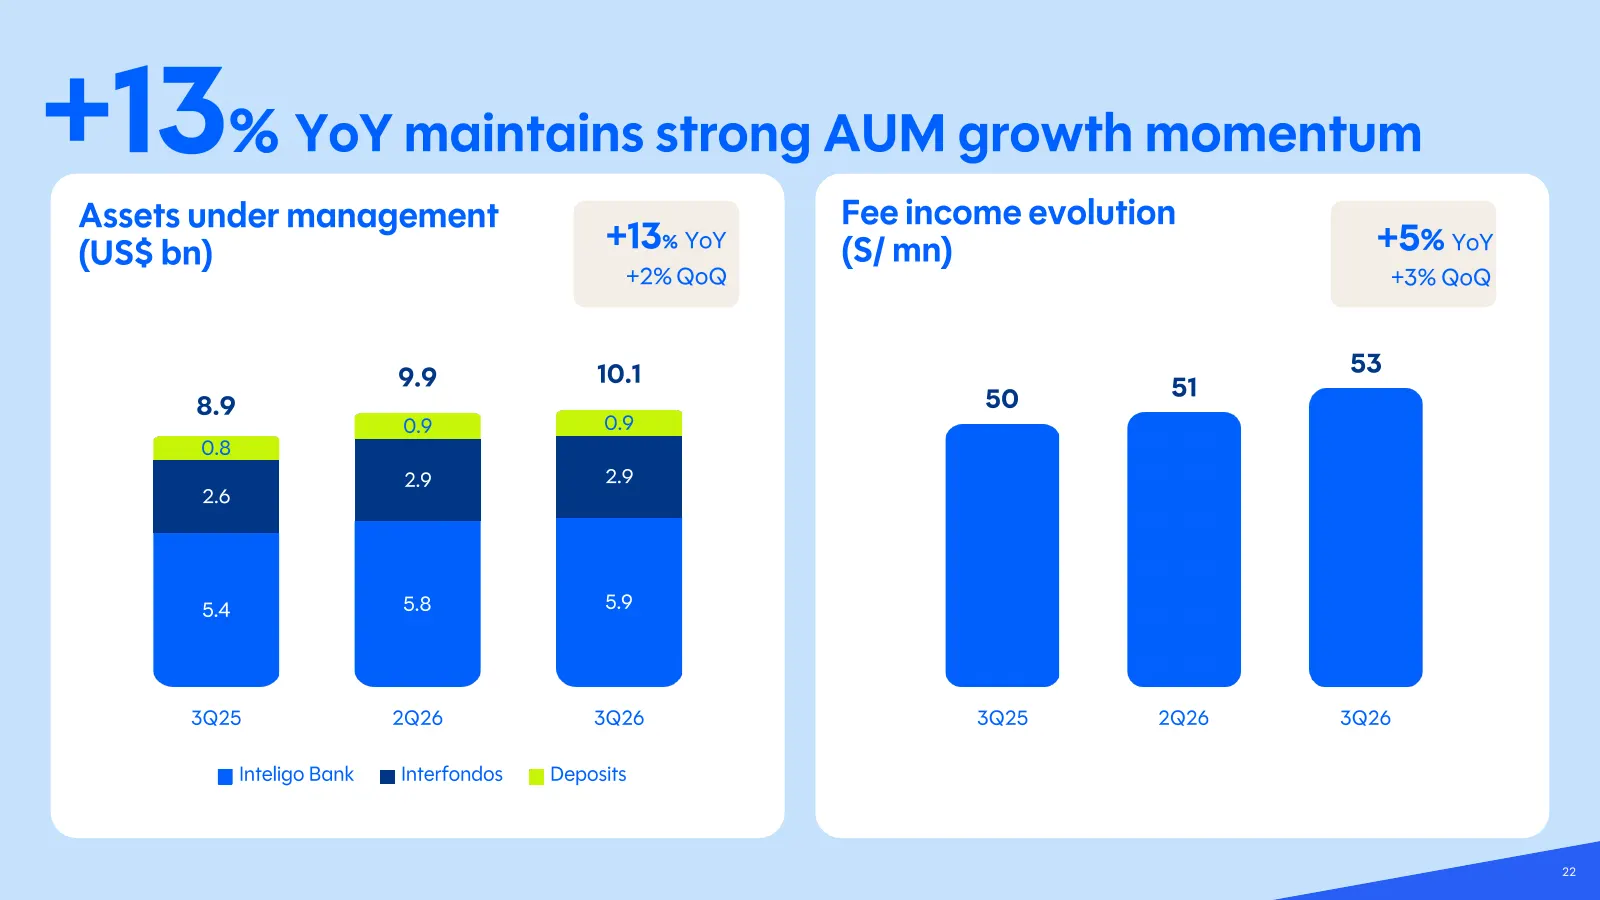
Slide 22: +13% YoY maintains strong AUM growth momentum
No Image +13% YoY maintains strong AUM growth momentum Assets under management Fee income evolution (US$ bn) +13% YoY (S/ mn) +5 % YoY +2% QoQ +3% QoQ 10.1 53 9.9 51 8.9 50 0.9 0.9 0.8 2.9 2.9 2.6 5.4 5.8 5.9 3Q25 2Q26 3Q26 3Q25 2Q26 3Q26 Inteligo Bank Interfondos Deposits 22
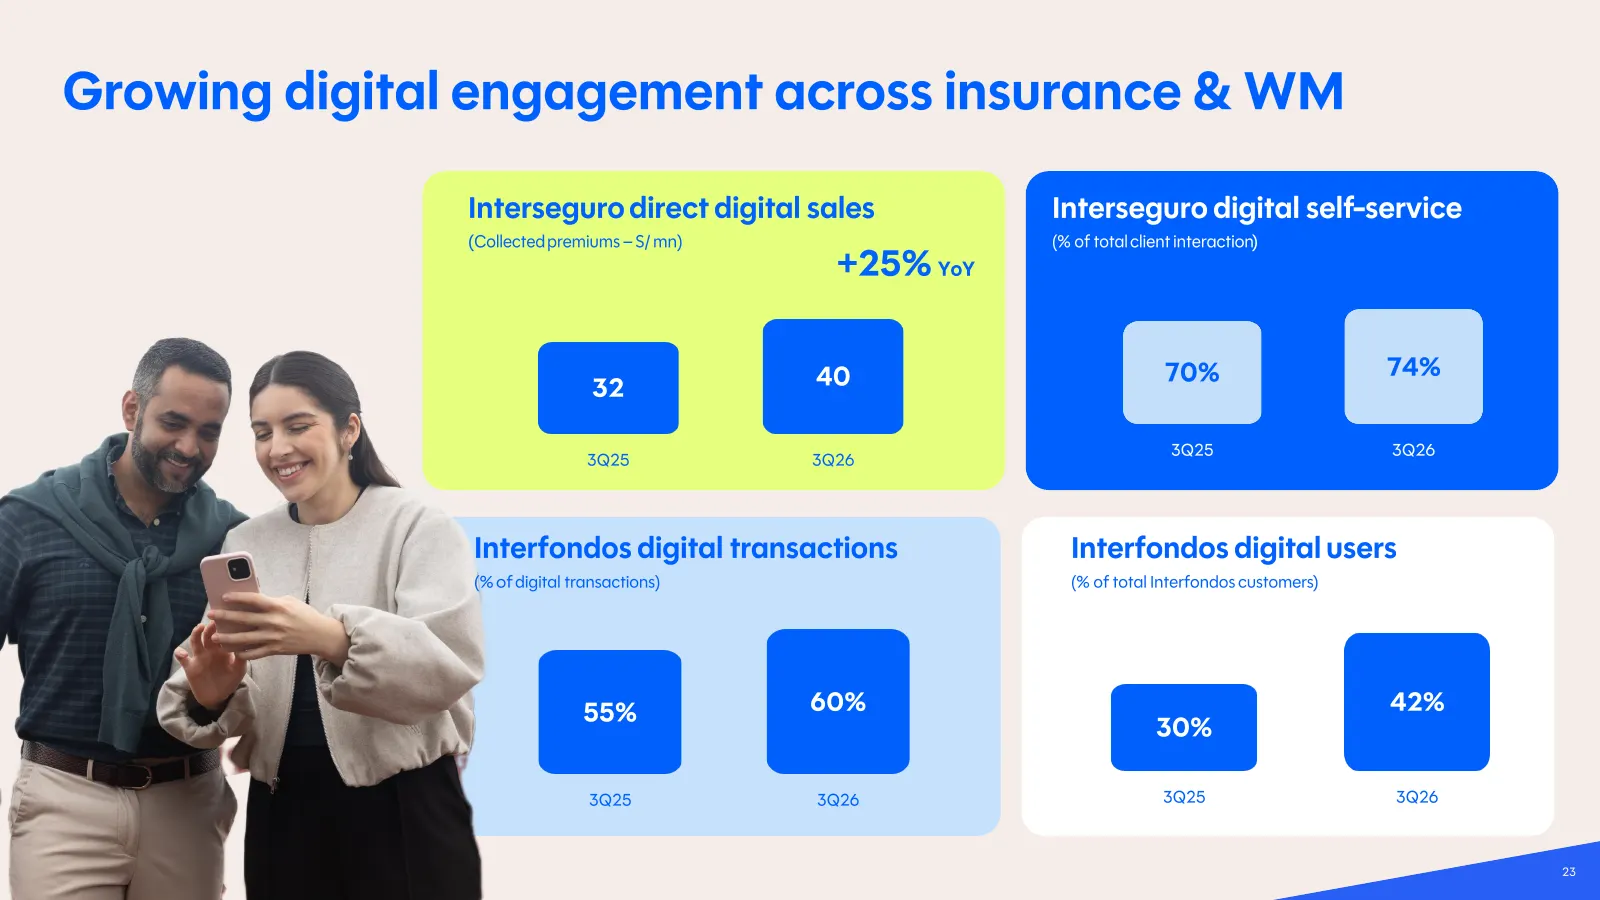
Slide 23: Growing digital engagement across insurance & WM
Growing digital engagement across insurance & WM Interseguro direct digital sales Interseguro digital self -service (Collected premiums – S/ mn) (% of total client interaction ) +25% YoY 40 70% 74% 32 3Q25 3Q26 3Q25 3Q26 Interfondos digital transactions Interfondos digital users (% of digital transa

Slide 24: Takeaways
Takeaways 24 is.com.pe 24
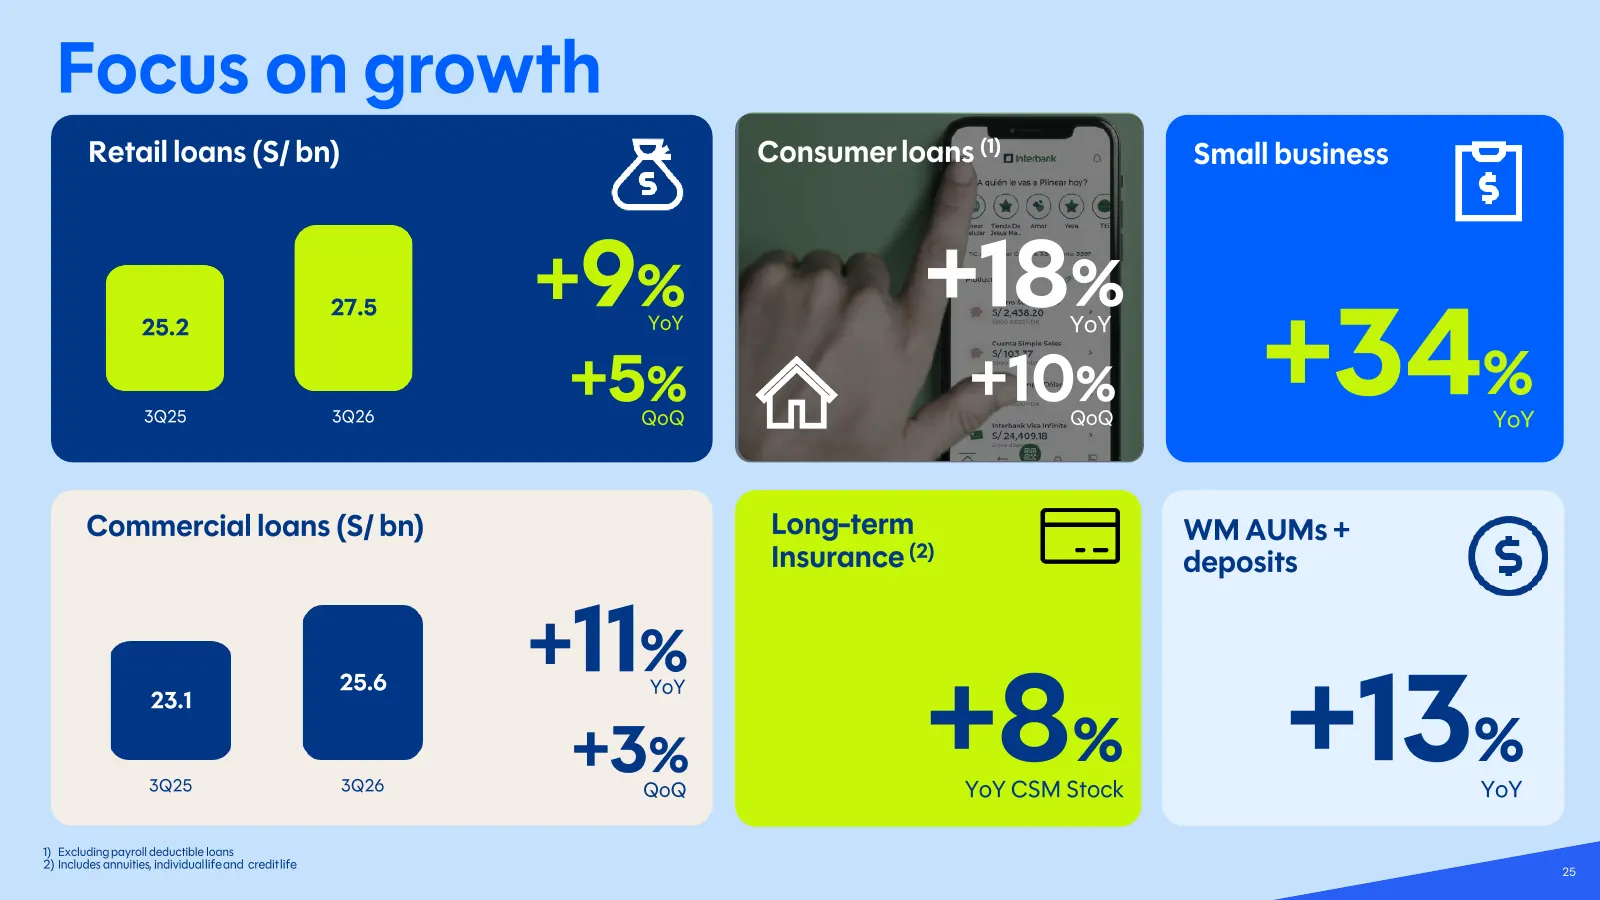
Slide 25: Focus on growth
Focus on growth Retail loans (S/ bn) Consumer loans (1) Small business 27.5 +9 % +18% YoY +34 % 25.2 YoY 3Q25 3Q26 +5 % QoQ +10 % QoQ YoY Commercial loans (S/ bn) Long -term WM AUMs + Insurance (2) deposits + 11% +8 % +13% 25.6 YoY 23.1 3Q25 3Q26 +3 % QoQ YoY CSM Stock YoY 1) Excluding payroll deduc
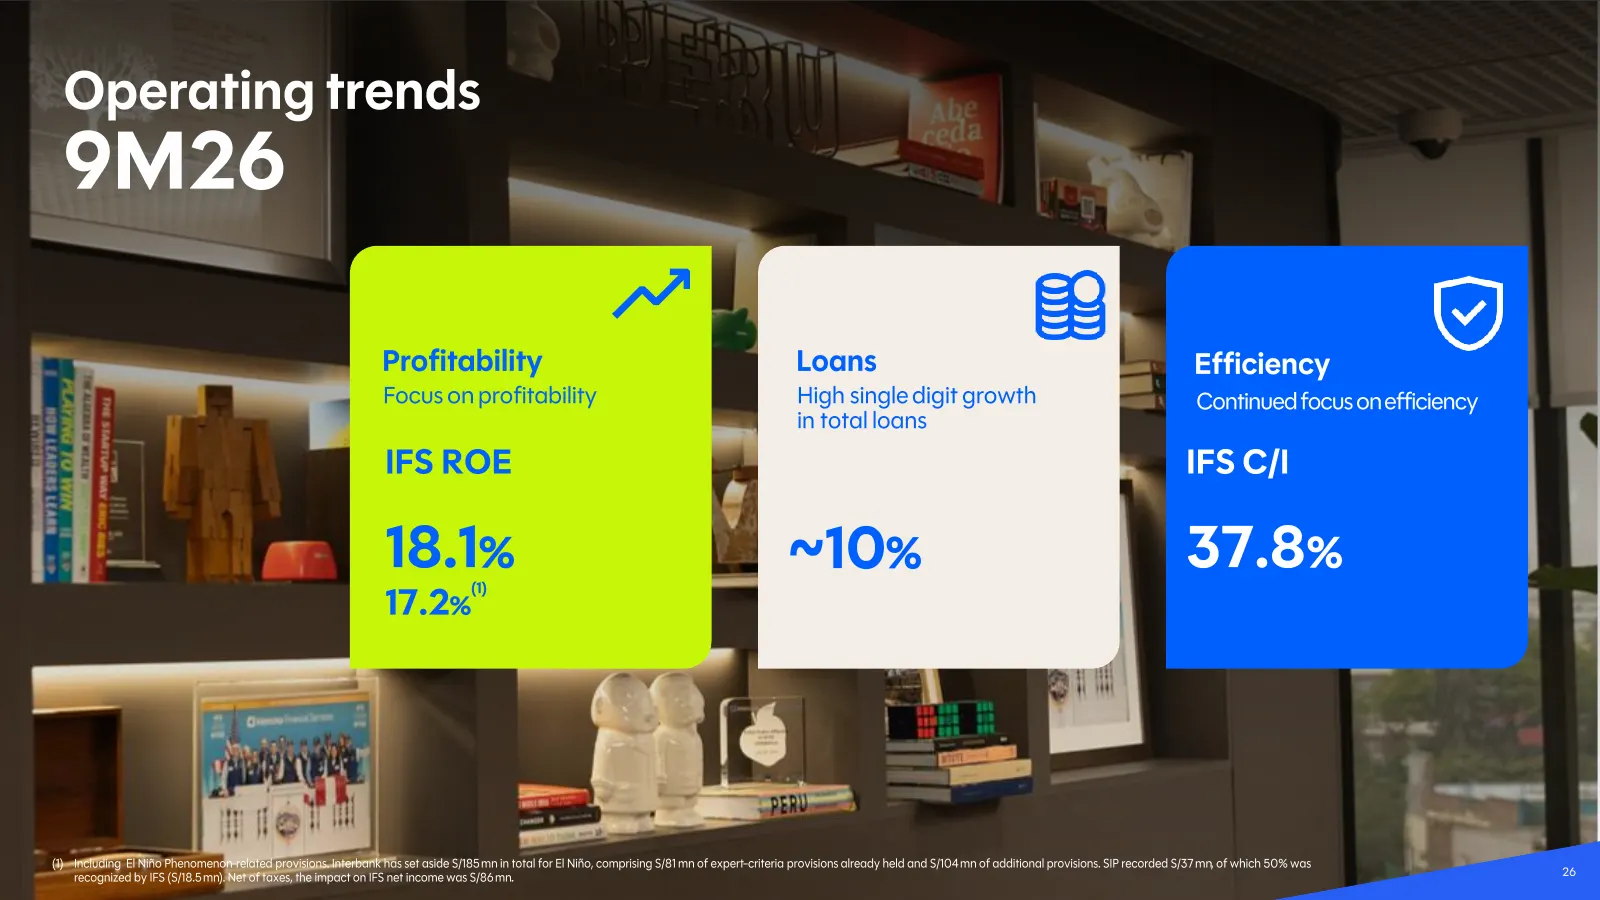
Slide 26: Operating trends 9M26
Operating trends 9M26 Profitability Loans Efficiency Focus on profitability High single digit growth Continued focus on efficiency in total loans IFS ROE IFS C/I 18.1% (1) ~10 % 37.8 % 17.2% (1) Including El Niño Phenomenon -related provisions. Interbank has set aside S/185 mn in total for El Niño,
Slide 27: 3Q26 key messages
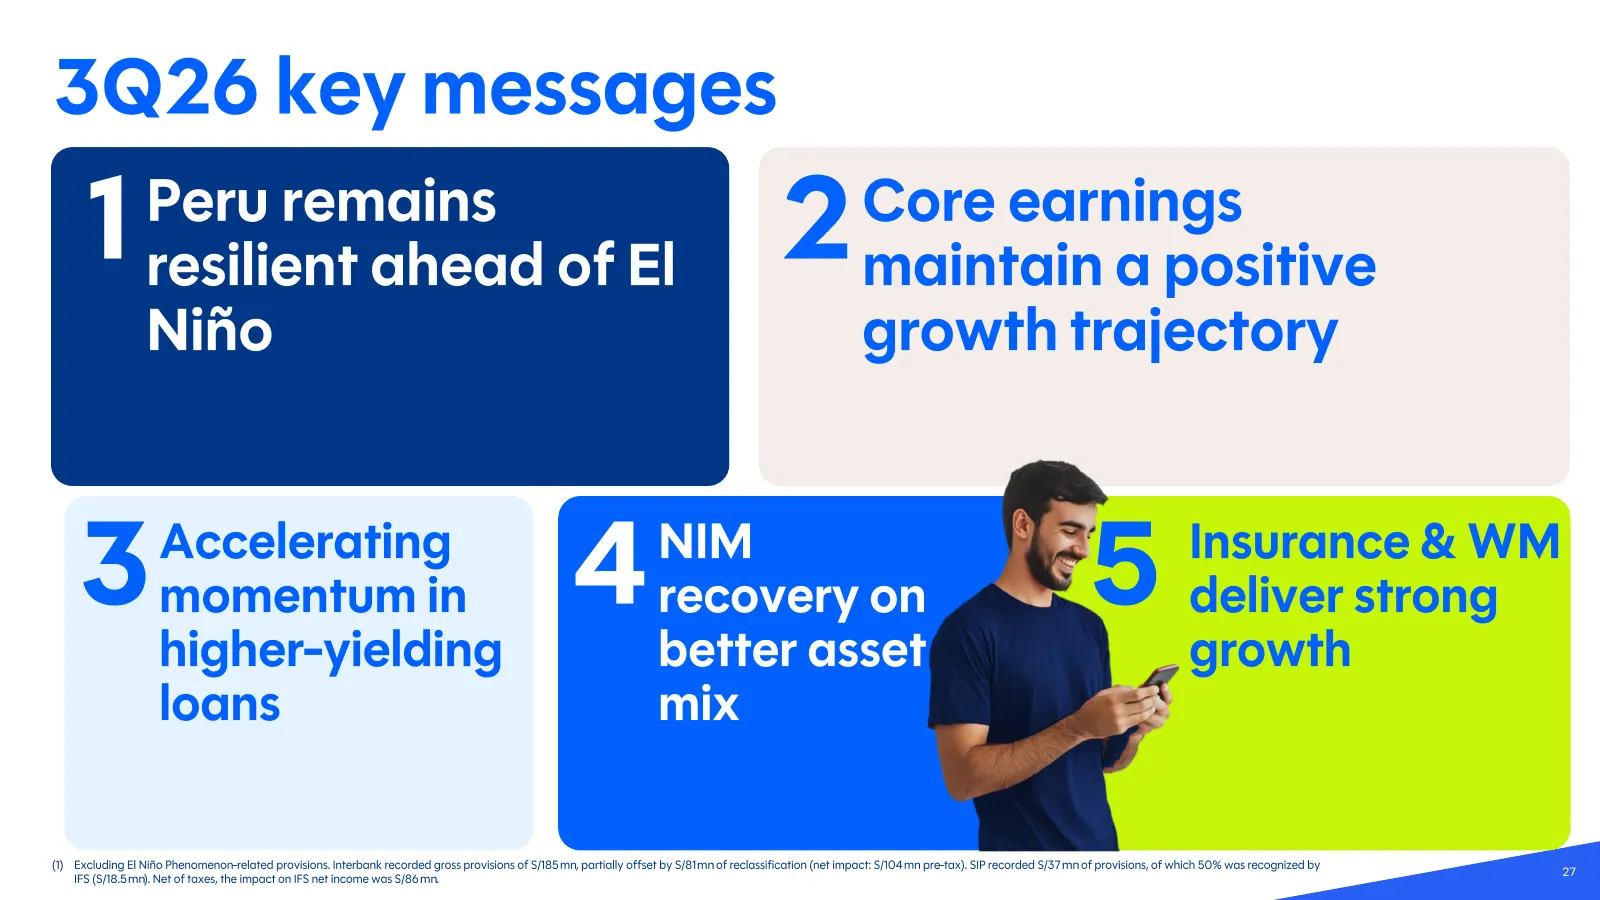
3Q26 key messages 1 Peru Resilient Peru despite remains profitability remains ahead prudent resilient of El Niño resilient ahead of El provisioning 2 maintain a positive Core earnings Core earnings maintain a positive growth trajectory Niño growth trajectory 3.0% GDP 2027E ~17% 3Q26 ROE (1) 543 3Q26
Slide 28: Appendix
Appendix 28 28
Slide 29: Sustainability update
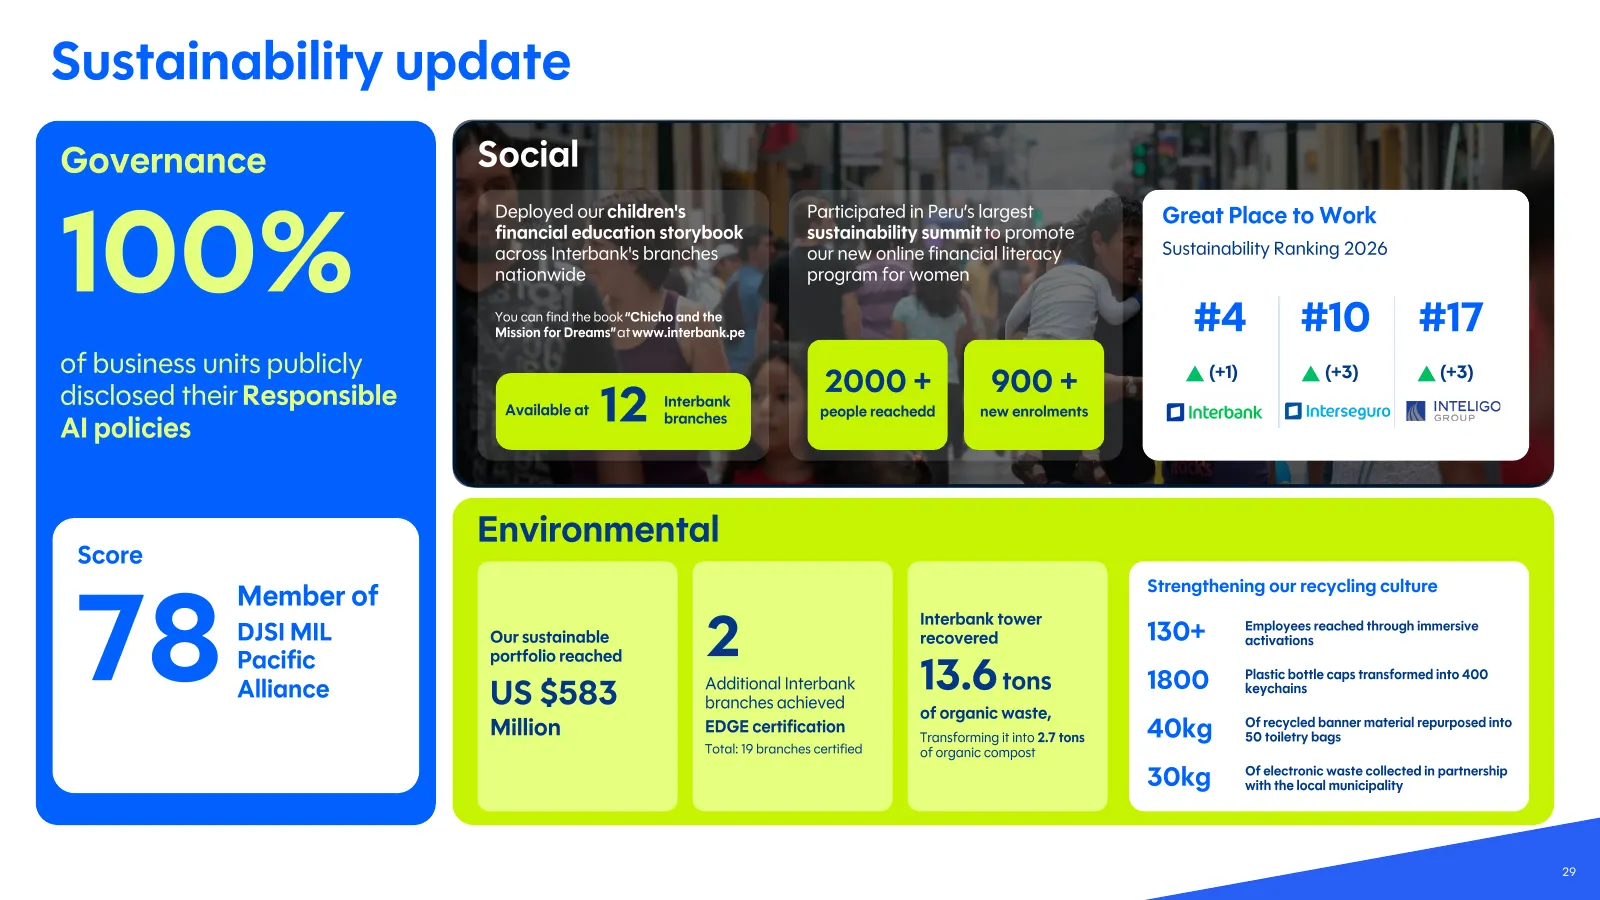
Sustainability update Governance Social 100% Deployed our children's Participated in Peru’s largest Great Place to Work financial education storybook sustainability summit to promote across Interbank's branches our new online financial literacy Sustainability Ranking 2026 nationwide program for wome
Slide 30: Our strategy
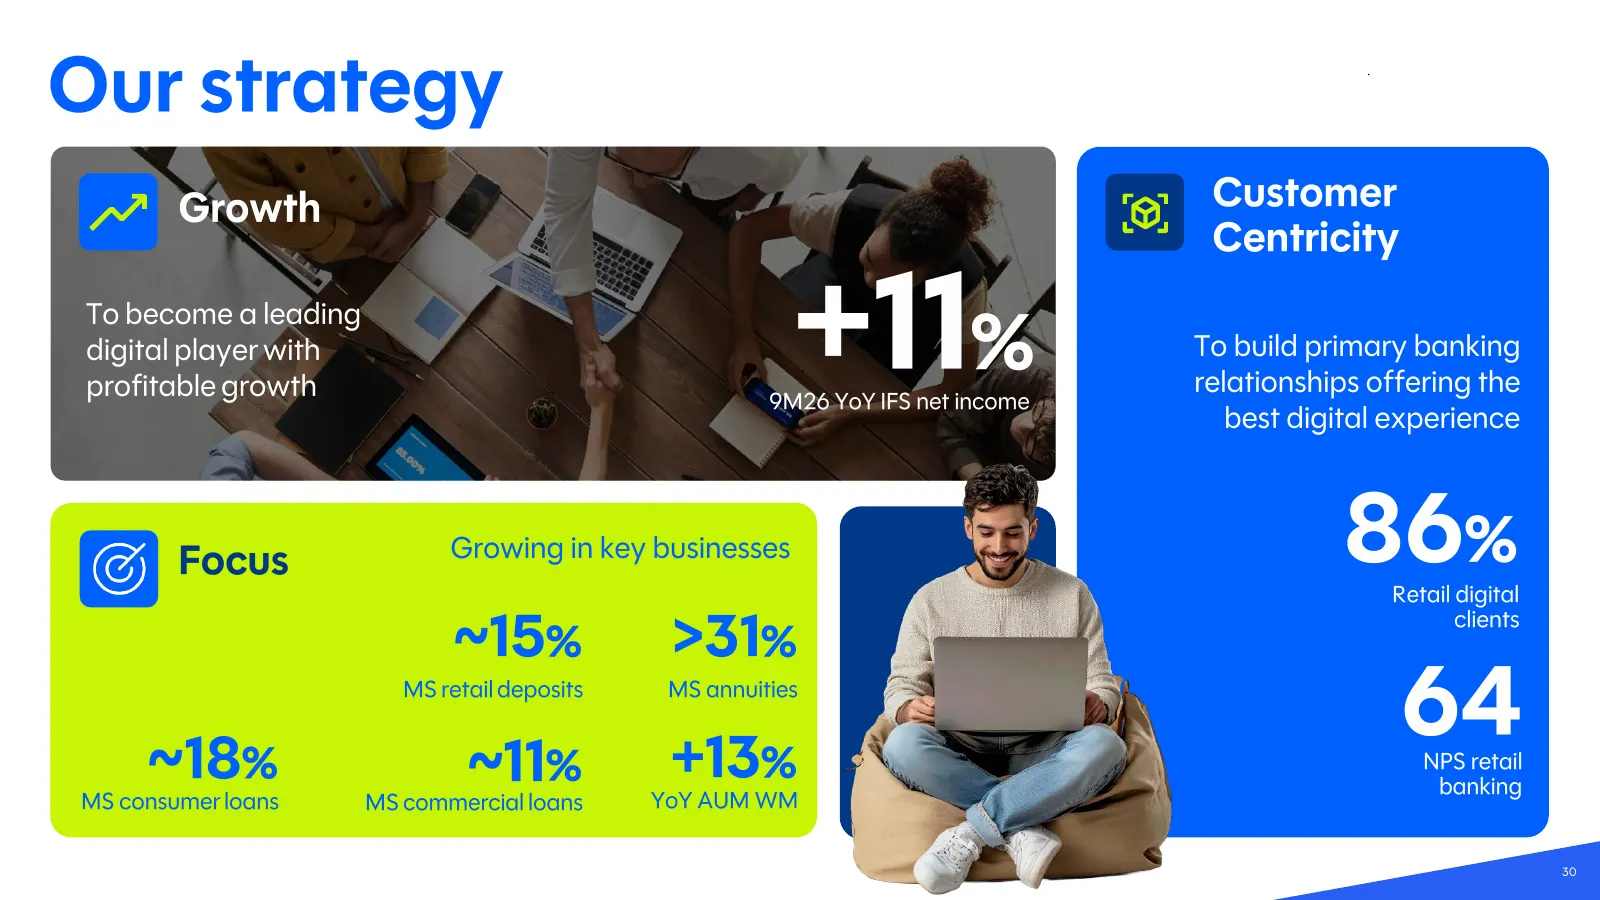
Our strategy Growth Customer Centricity To become a leading digital player with profitable growth +11% 9M26 YoY IFS net income To build primary banking relationships offering the best digital experience Focus Growing in key businesses 86 %Retail digital clients ~ 15% >31% ~ 18% MS retail deposits ~
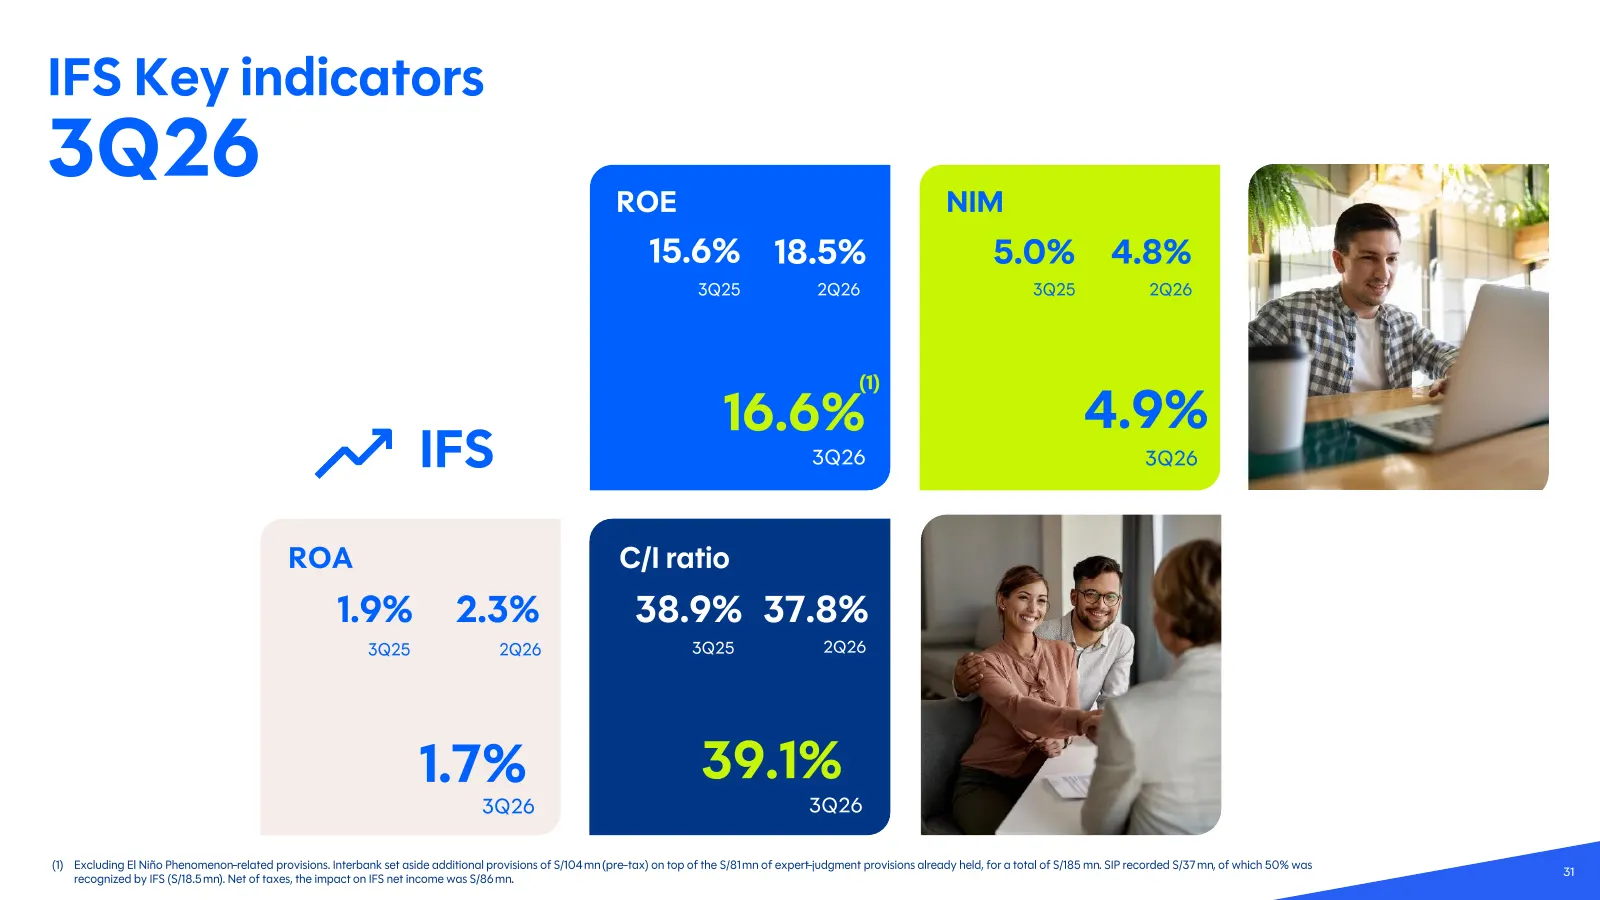
Slide 31: IFS Key indicators 3Q26
IFS Key indicators 3Q26 ROE NIM 15.6% 18.5% 5.0% 4.8% 3Q25 2Q26 3Q25 2Q26 (1) 16.6% 4.9% IFS 3Q26 3Q26 ROA C/I ratio 1.9% 2.3% 38.9% 37.8% 3Q25 2Q26 3Q25 2Q26 1.7% 39.1% 3Q26 3Q26 (1) Excluding El Niño Phenomenon -related provisions. Interbank set aside additional provisions of S/104 mn (pre-tax) on
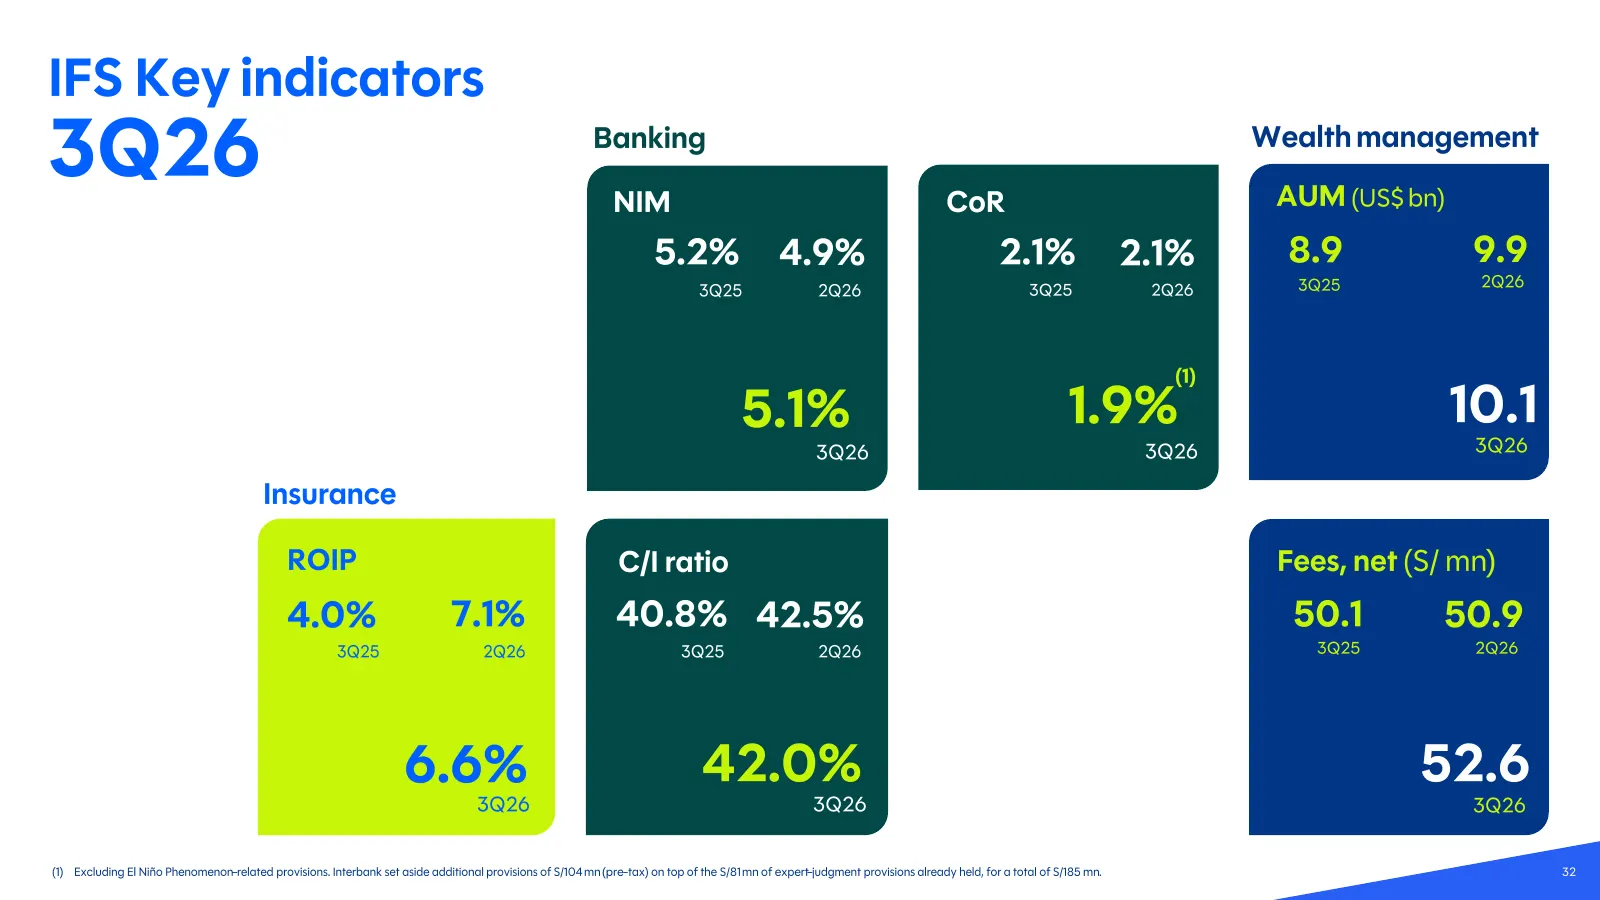
Slide 32: IFS Key indicators 3Q26
IFS Key indicators 3Q26 Banking NIM CoR Wealth management AUM (US$ bn) 5.2% 4.9% 2.1% 2.1% 8.9 9.9 3Q25 2Q26 3Q25 2Q26 3Q25 2Q26 (1) 5.1% 1.9% 10.1 3Q26 3Q26 3Q26 Insurance ROIP C/I ratio Fees, net (S/ mn) 4.0% 7.1% 40.8% 42.5% 50.1 50.9 3Q25 2Q26 3Q25 2Q26 3Q25 2Q26 6.6% 42.0% 52.6 3Q26 3Q26 3Q26 (
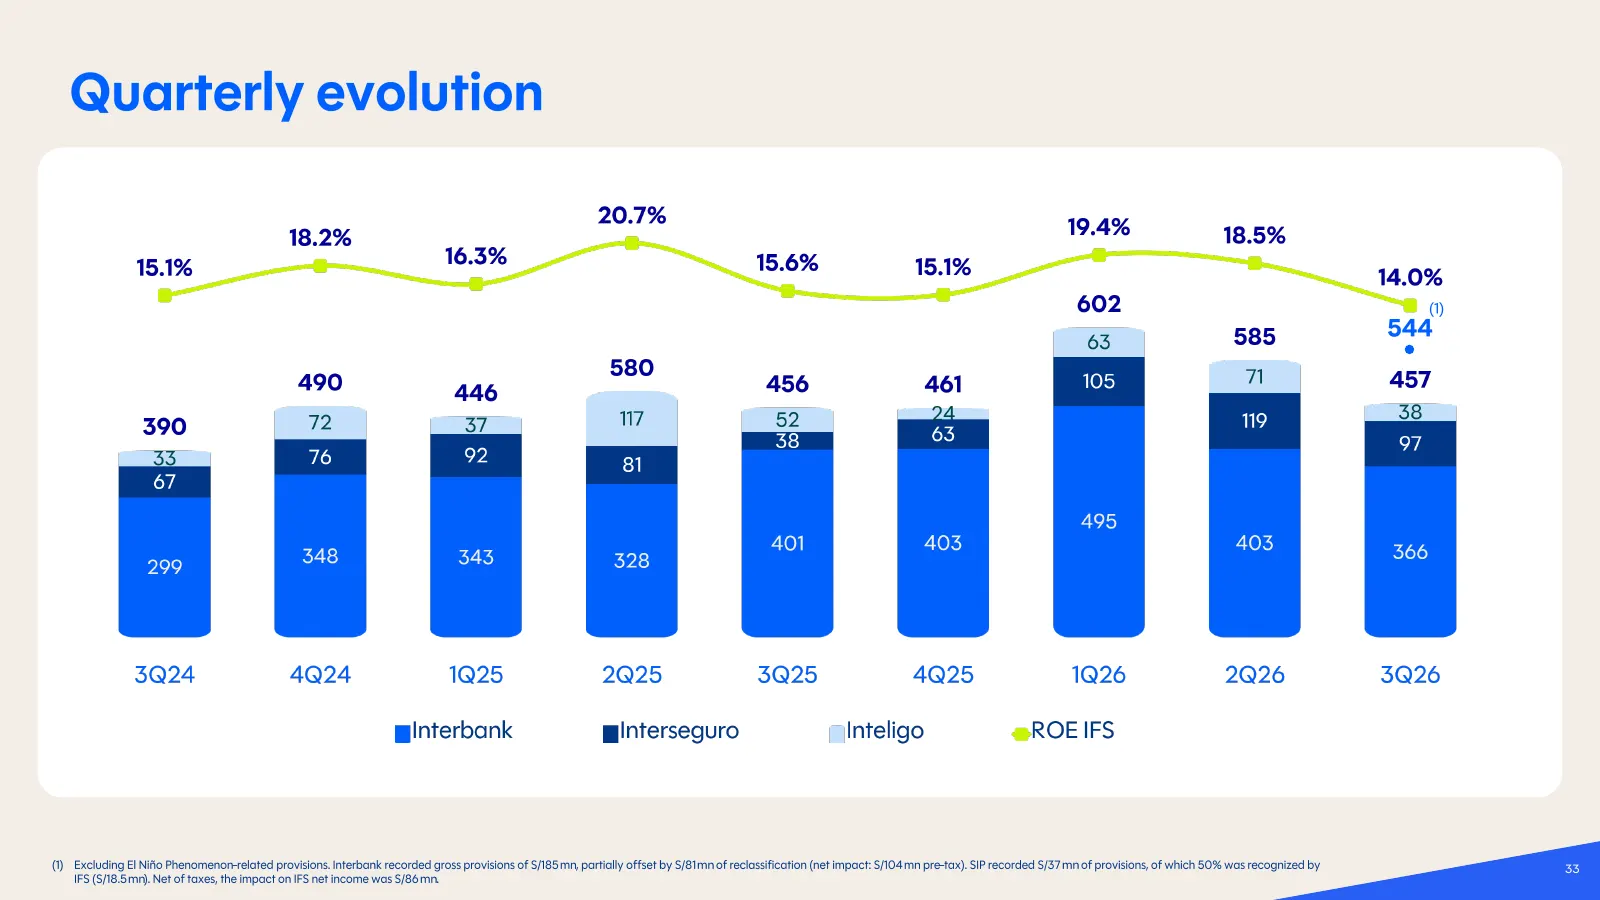
Slide 33: Quarterly evolution
Quarterly evolution (1) 544 (1) Excluding El Niño Phenomenon -related provisions. Interbank recorded gross provisions of S/185 mn, partially offset by S/81 mn of reclassification (net impact: S/104 mn pre-tax). SIP recorded S/37 mn of provisions, of which 50% was recognized by 33 IFS (S/18.5 mn). Ne
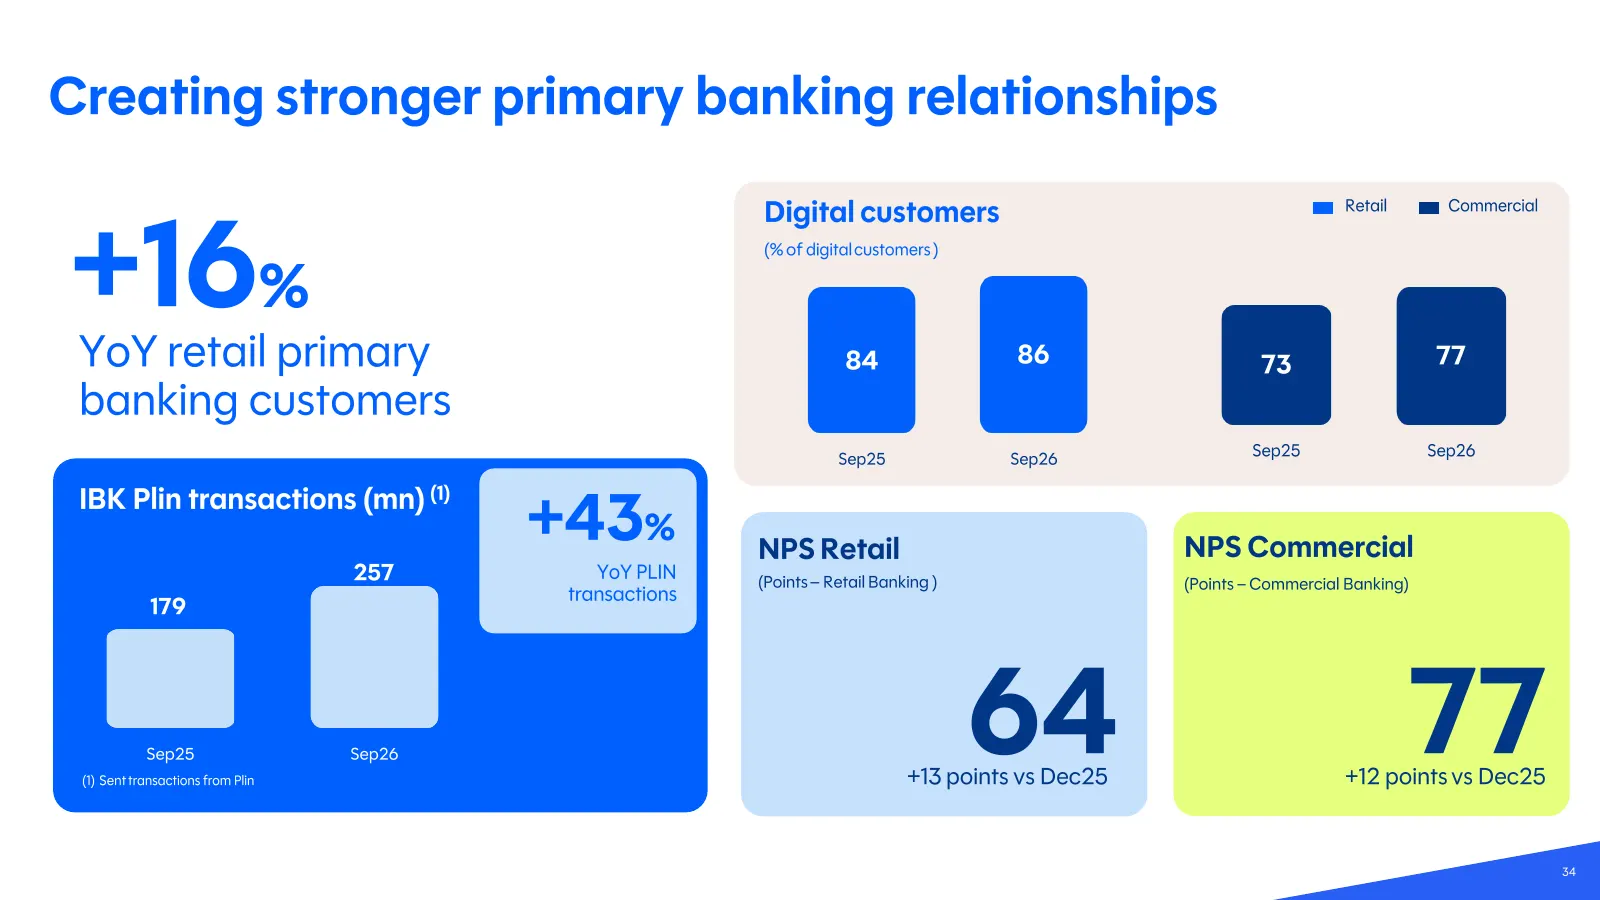
Slide 34: Creating stronger primary banking relationships
Creating stronger primary banking relationships Retail Commercial Digital customers +16% YoY retail primary (% of digital customers ) 86 77 84 73 banking customers Sep25 Sep26 Sep25 Sep26 IBK Plin transactions (mn) (1) +43 % NPS Retail NPS Commercial 257 YoY PLIN (Points – Retail Banking ) (Points –
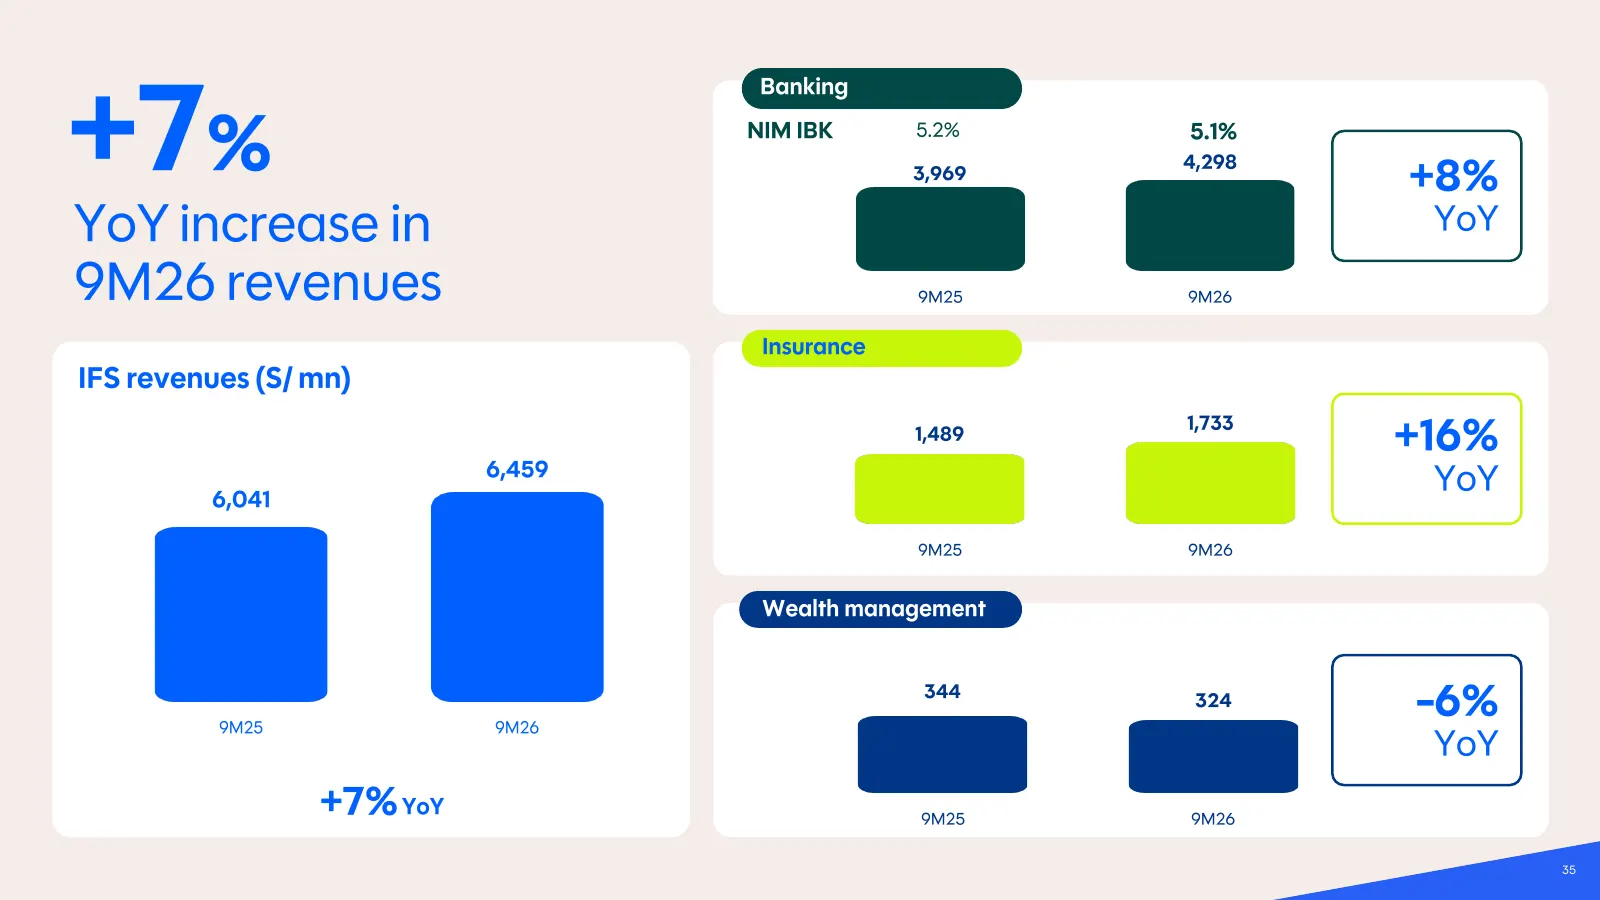
Slide 35: YoY increase in 9M26 revenues
+7 % Banking NIM IBK 5.2% 5.1% 4,298 3,969 +8% YoY increase in YoY 9M26 revenues 9M25 9M26 Insurance IFS revenues (S/ mn) 1,733 1,489 +16% 6,459 6,041 YoY 9M25 9M26 Wealth management 9M25 9M26 344 324 -6% YoY +7% YoY 9M25 9M26 35
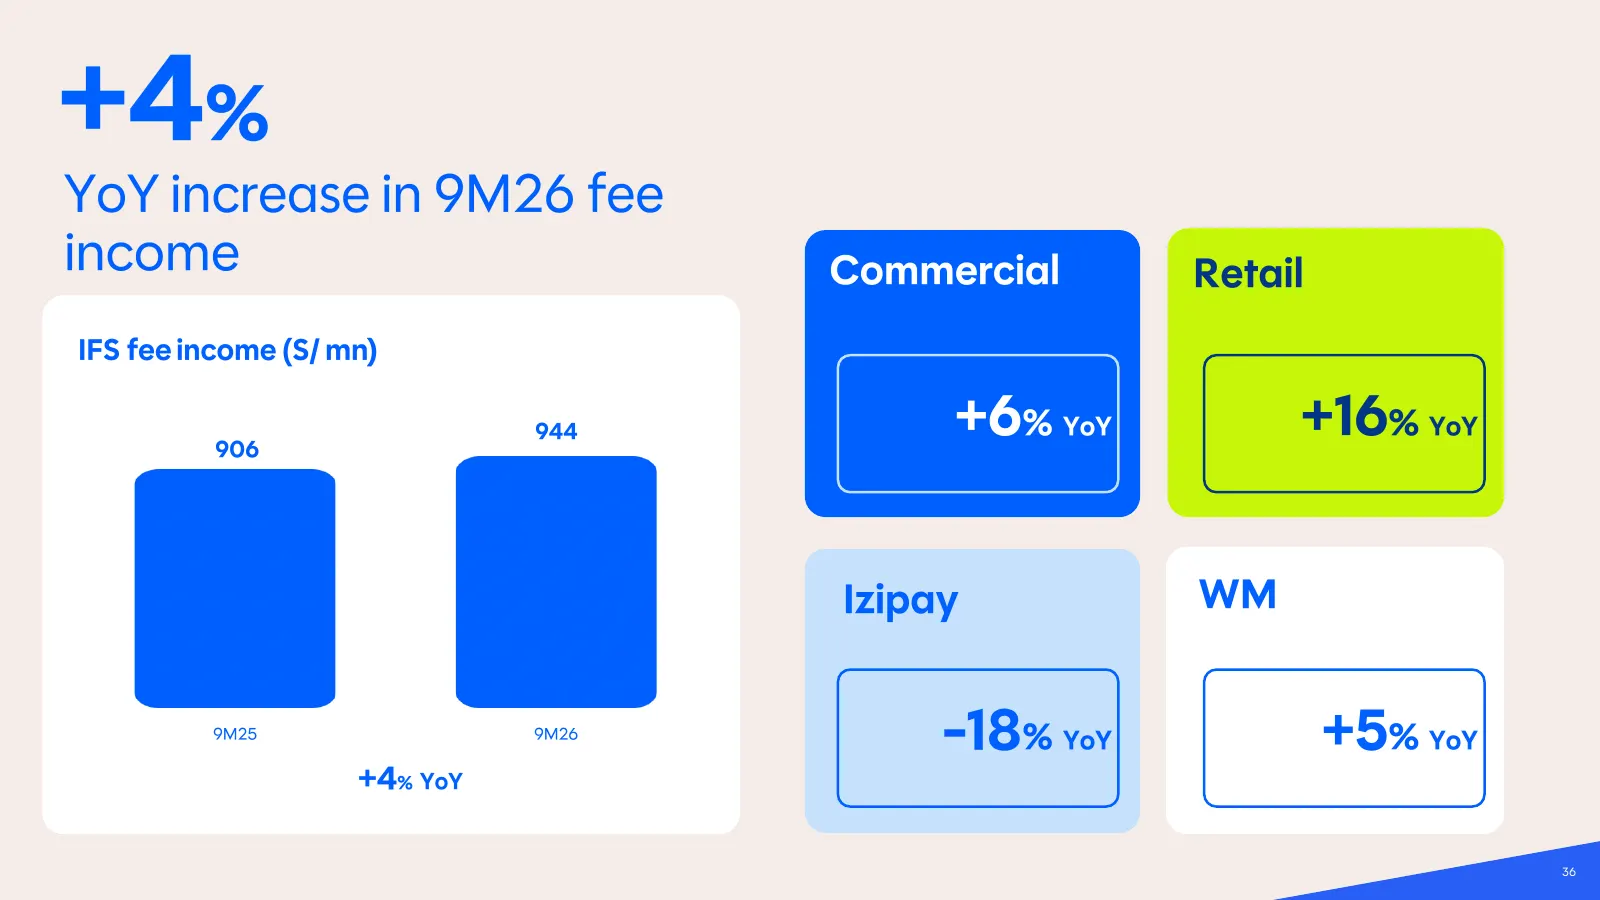
Slide 36: YoY increase in 9M26 fee income
+4 % YoY increase in 9M26 fee income Commercial Retail IFS fee income (S/ mn) 906 944 +6 % YoY +16% YoY Izipay WM 9M25 9M26 -18% YoY +5 % YoY +4 % YoY 36
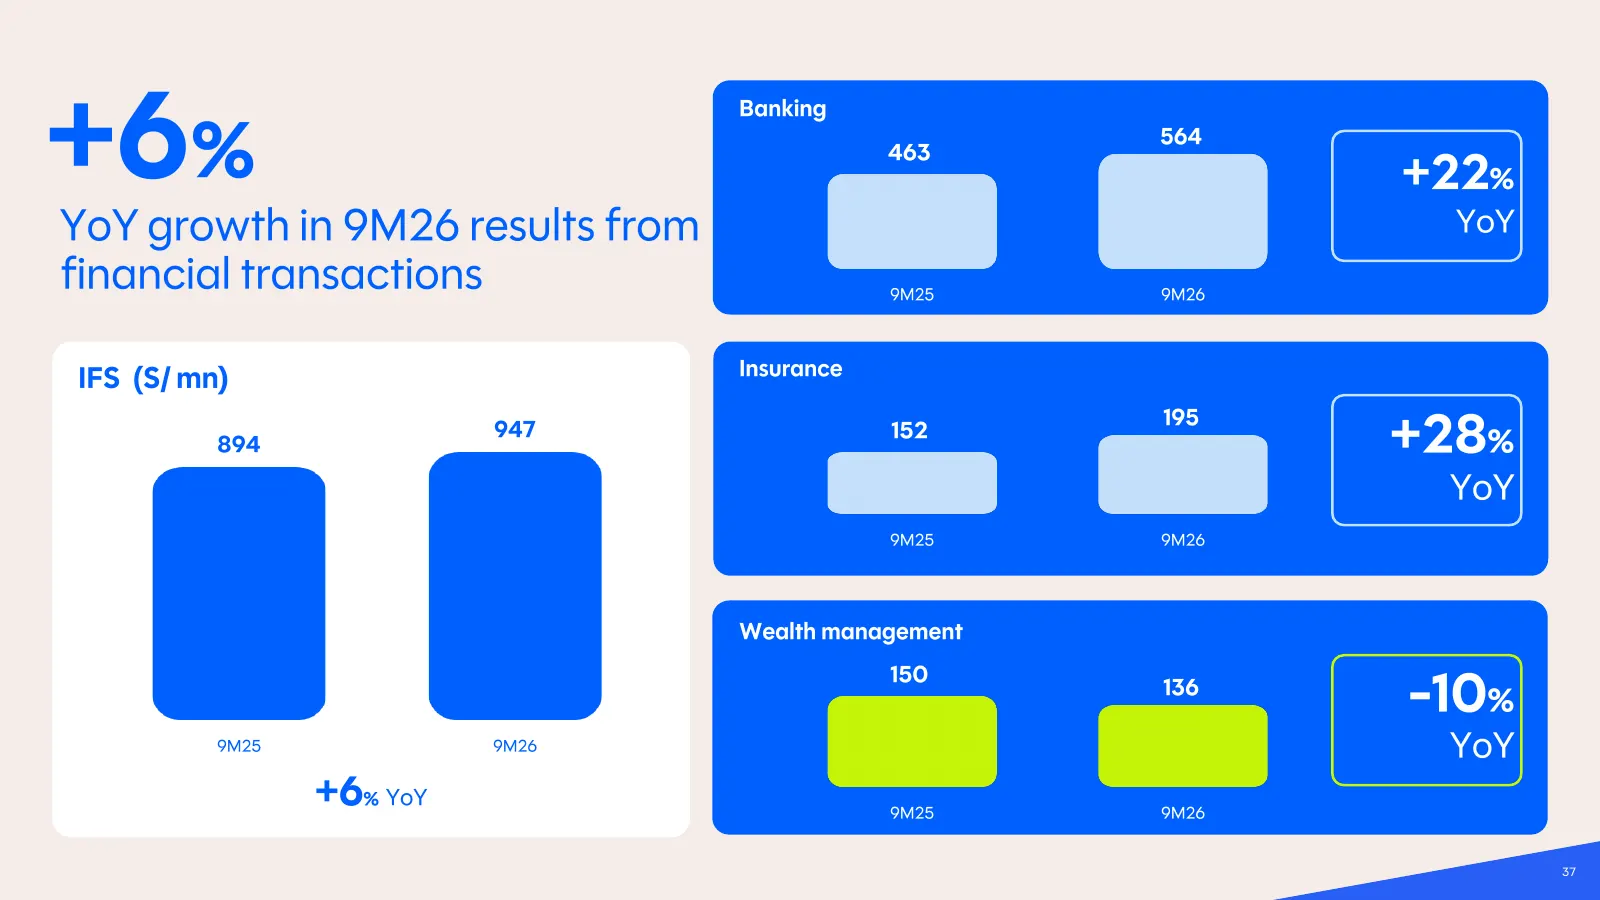
Slide 37: YoY growth in 9M26 results from financial transactions
+6 % Banking 463 564 +22 % YoY growth in 9M26 results from YoY financial transactions 9M25 9M26 IFS (S/ mn) Insurance 195 894 947 152 +28 % YoY 9M25 9M26 Wealth management 150 136 -10% 9M25 9M26 YoY +6 % YoY 9M25 9M26 37
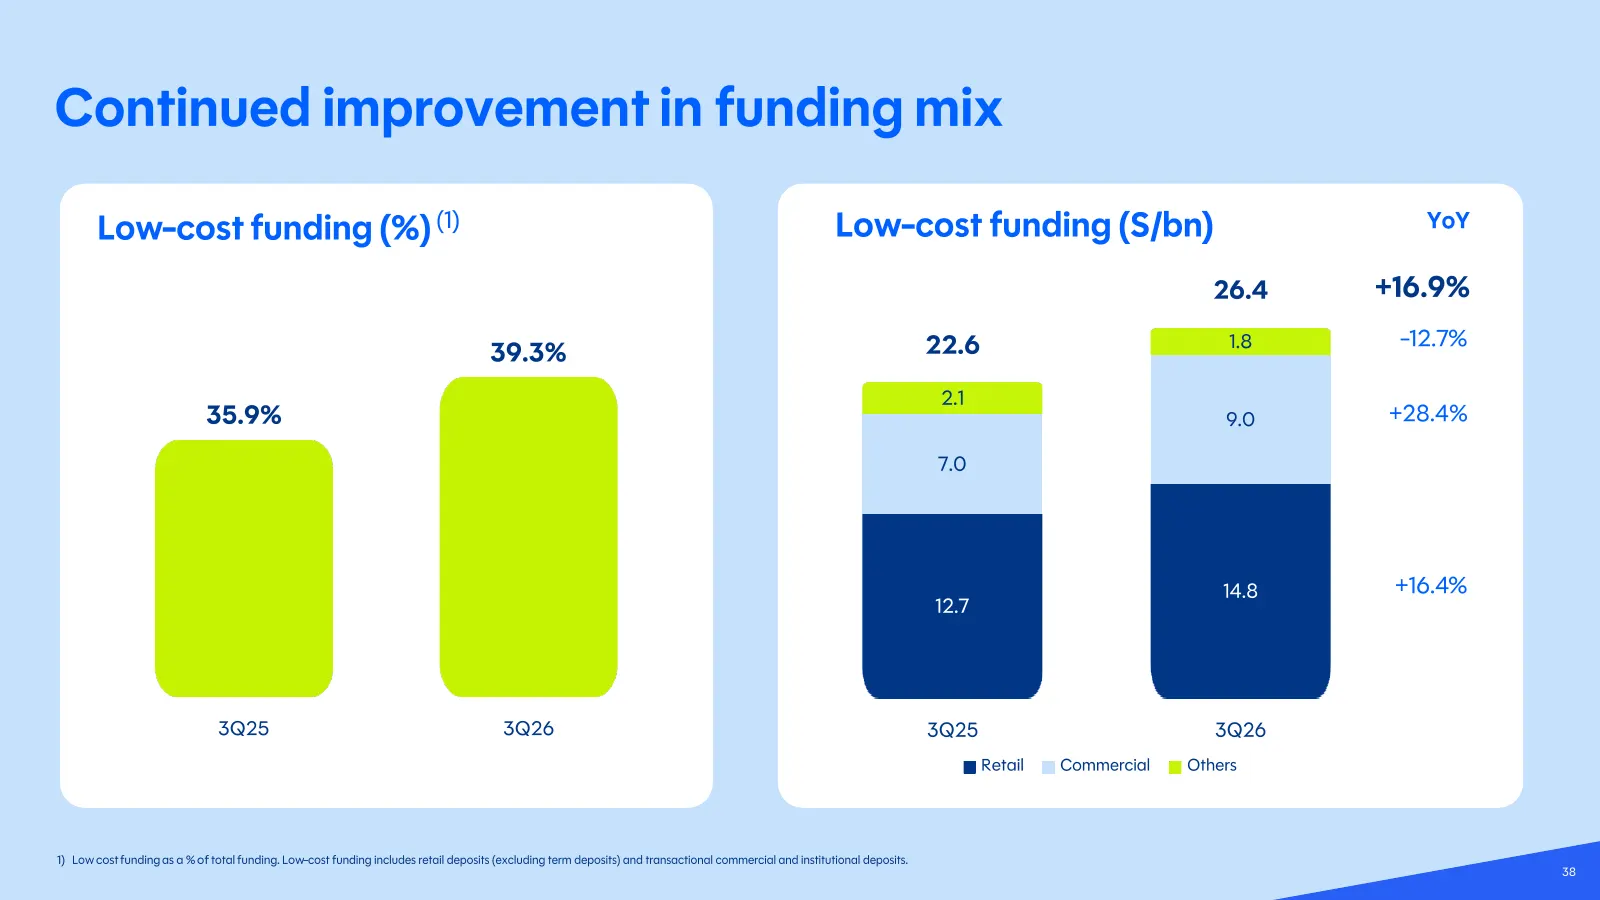
Slide 38: Continued improvement in funding mix
Continued improvement in funding mix Low -cost funding (%) (1) Low -cost funding (S/bn) YoY 26.4 +16.9% 22.6 1.8 -12.7% 39.3% 2.1 35.9% 9.0 +28.4% 7.0 14.8 +16.4% 12.7 3Q25 3Q26 3Q25 3Q26 Retail Commercial Others 1) Low cost funding as a % of total funding . Low -cost funding includes retail deposit
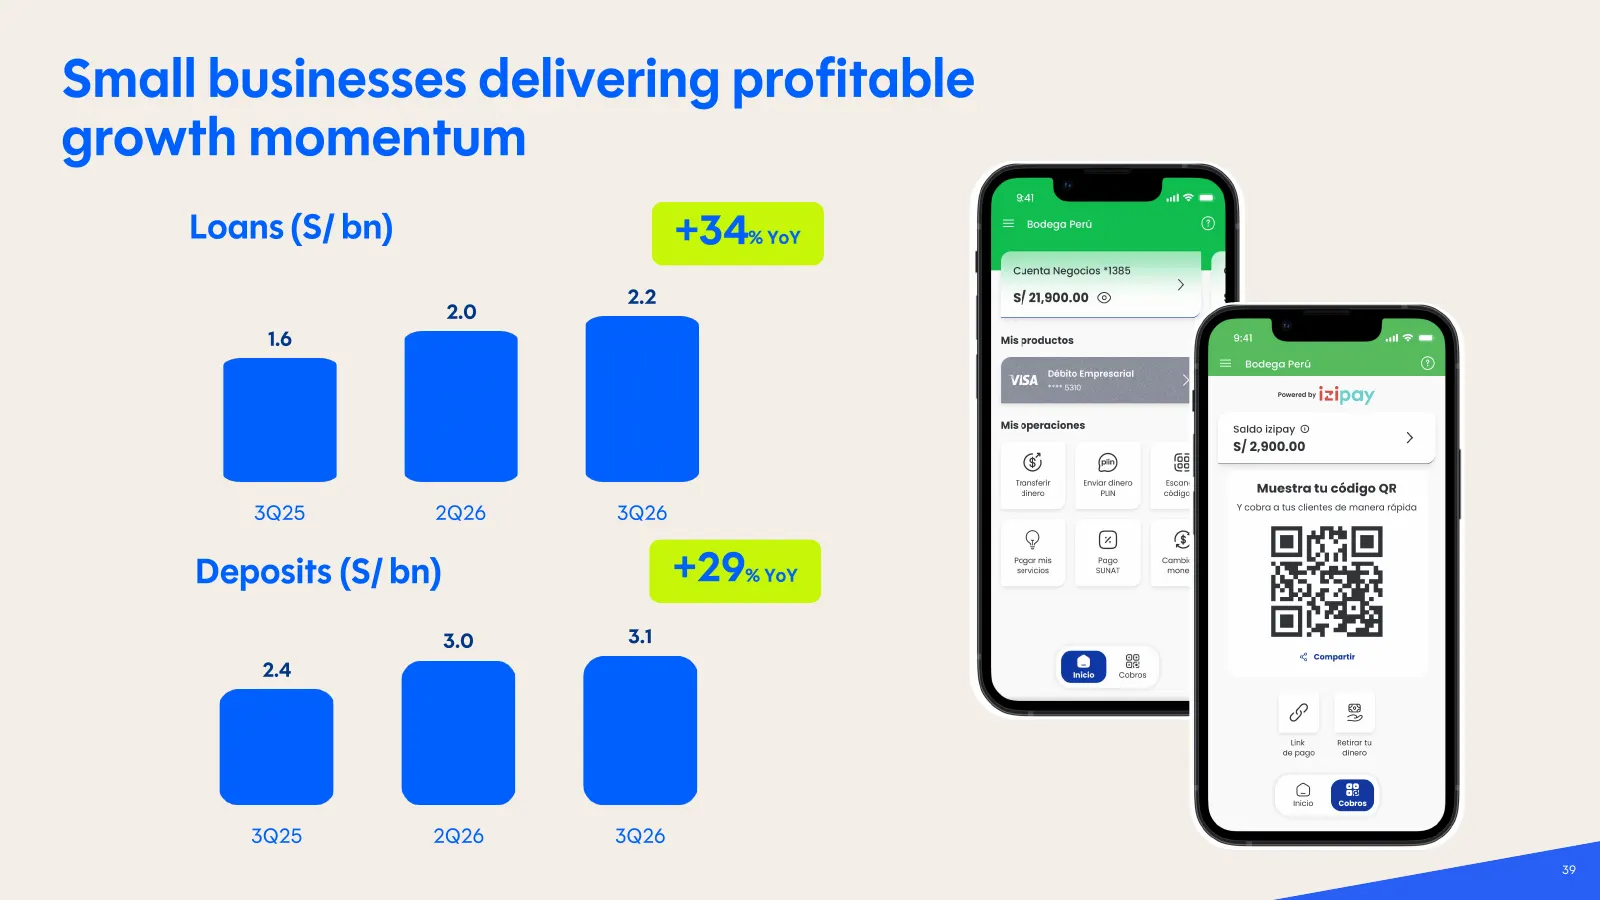
Slide 39: Small businesses delivering profitable growth momentum
Small businesses delivering profitable growth momentum Loans (S/ bn) +34 % YoY 2.2 2.0 1.6 3Q25 2Q26 3Q26 Deposits (S/ bn) +29 % YoY 3.0 3.1 2.4 3Q25 2Q26 3Q26 39
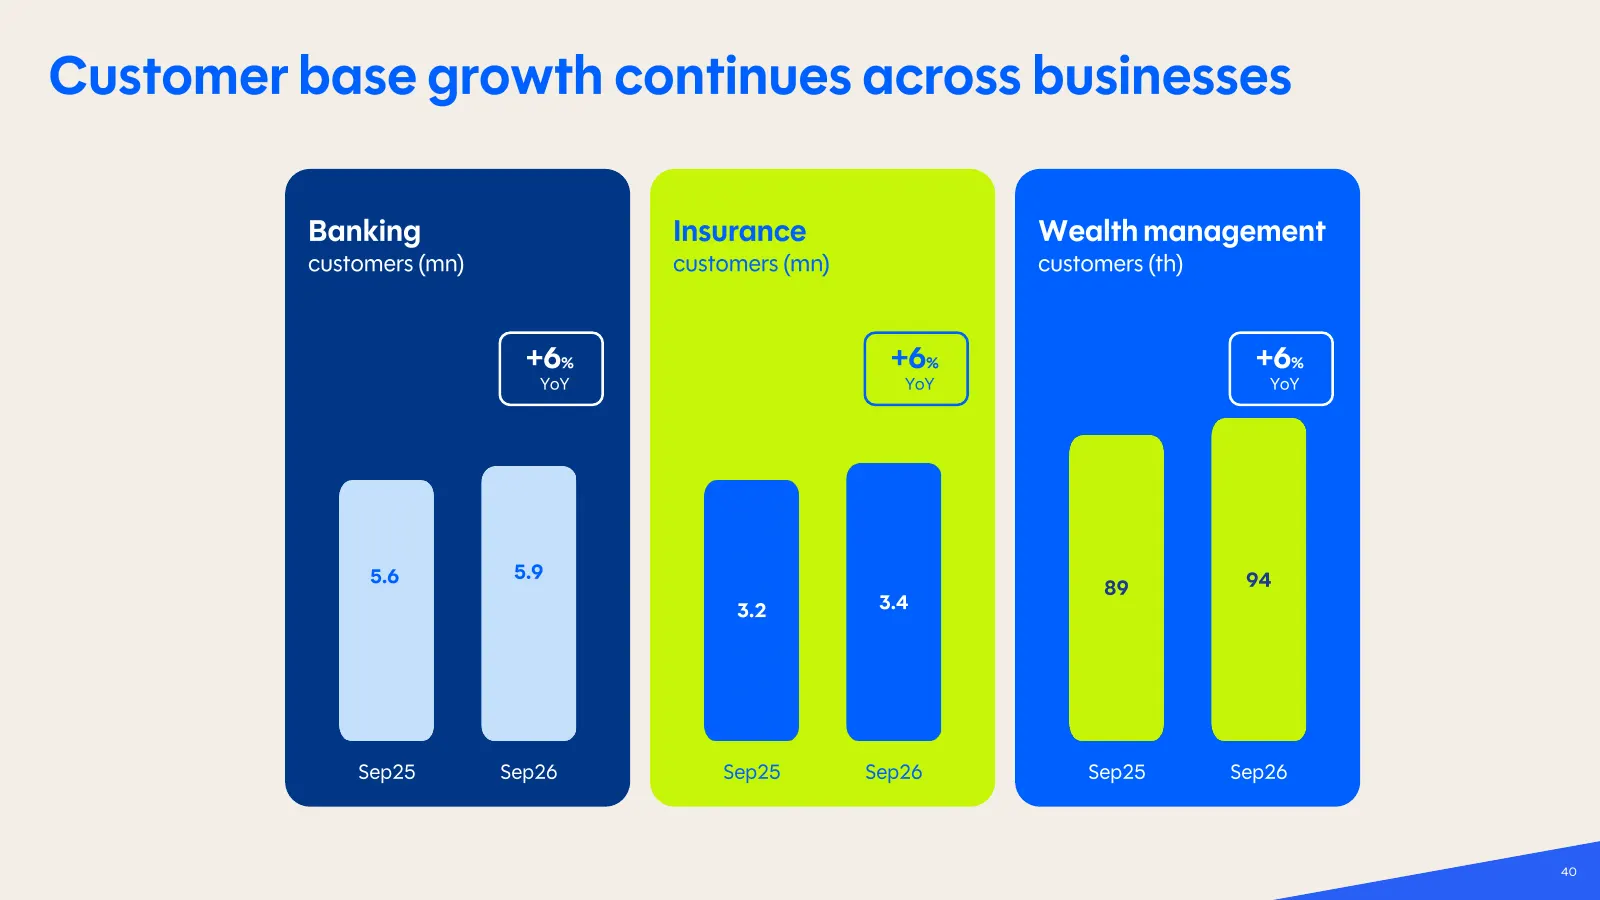
Slide 40: Customer base growth continues across businesses
Customer base growth continues across businesses Banking Insurance Wealth management customers (mn) customers (mn) customers (th) +6 % +6 % +6 % YoY YoY YoY 5.6 5.9 94 89 3.2 3.4 Sep25 Sep26 Sep25 Sep26 Sep25 Sep26 40
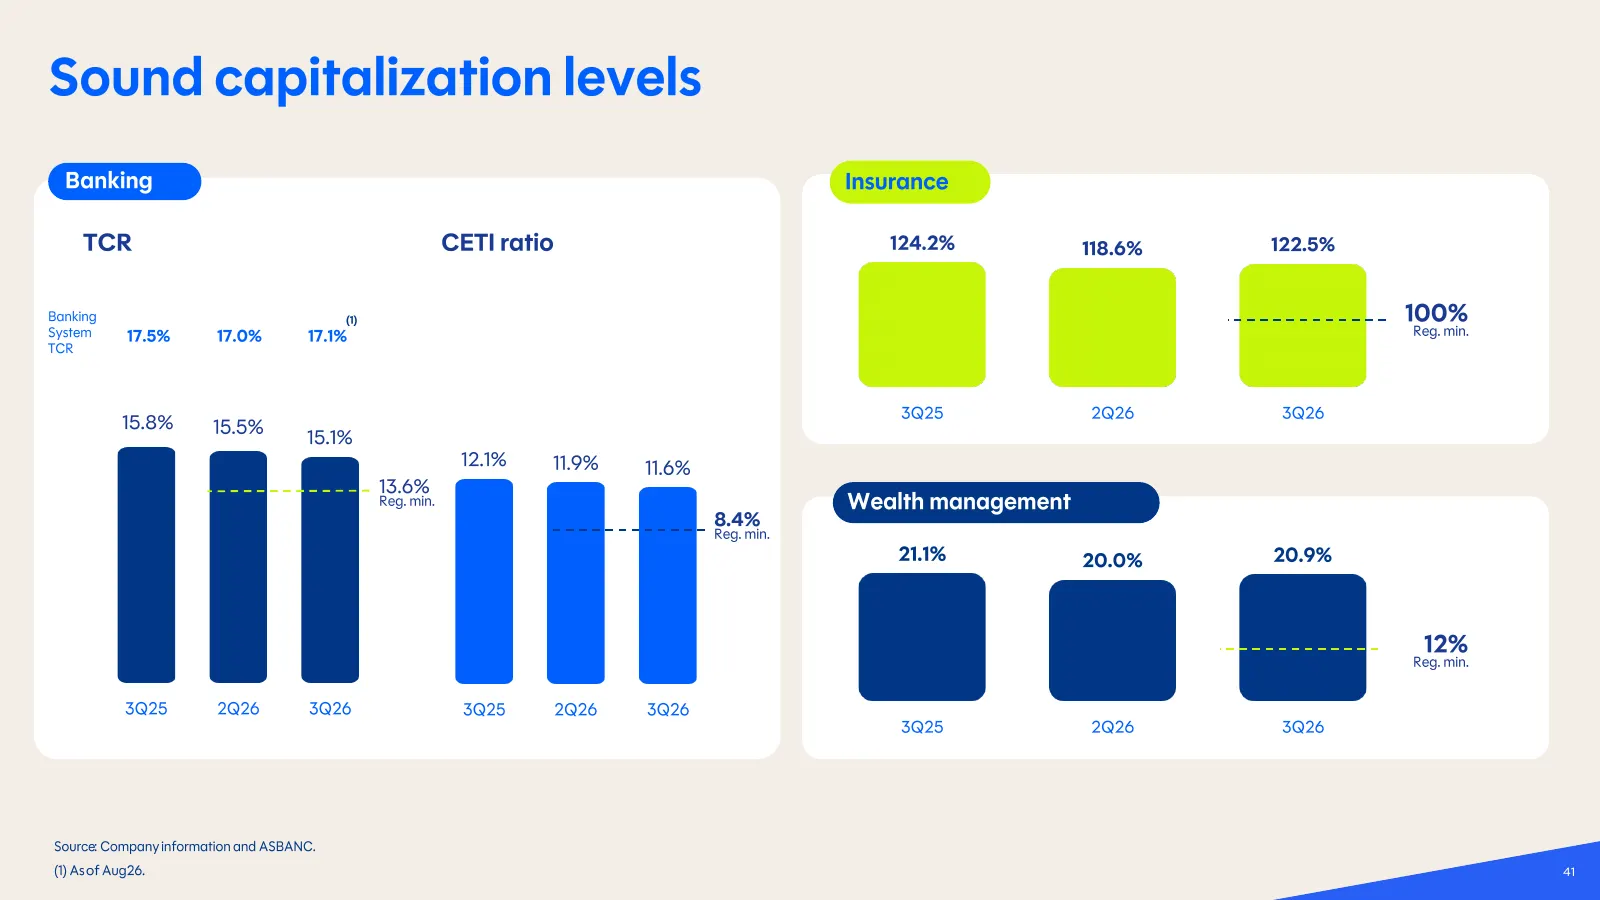
Slide 41: Sound capitalization levels
Sound capitalization levels Banking Insurance TCR CETI ratio 124.2% 118.6% 122.5% Banking (1) 100% System 17.5% 17.0% 17.1% Reg. min. TCR 3Q25 2Q26 3Q26 15.8% 15.5% 15.1% 12.1% 11.9% 11.6% 13.6% Reg. min. Wealth management 8 .4% Reg. min. 21.1% 20.0% 20.9% 12% Reg. min. 3Q25 2Q26 3Q26 3Q25 2Q26 3Q26
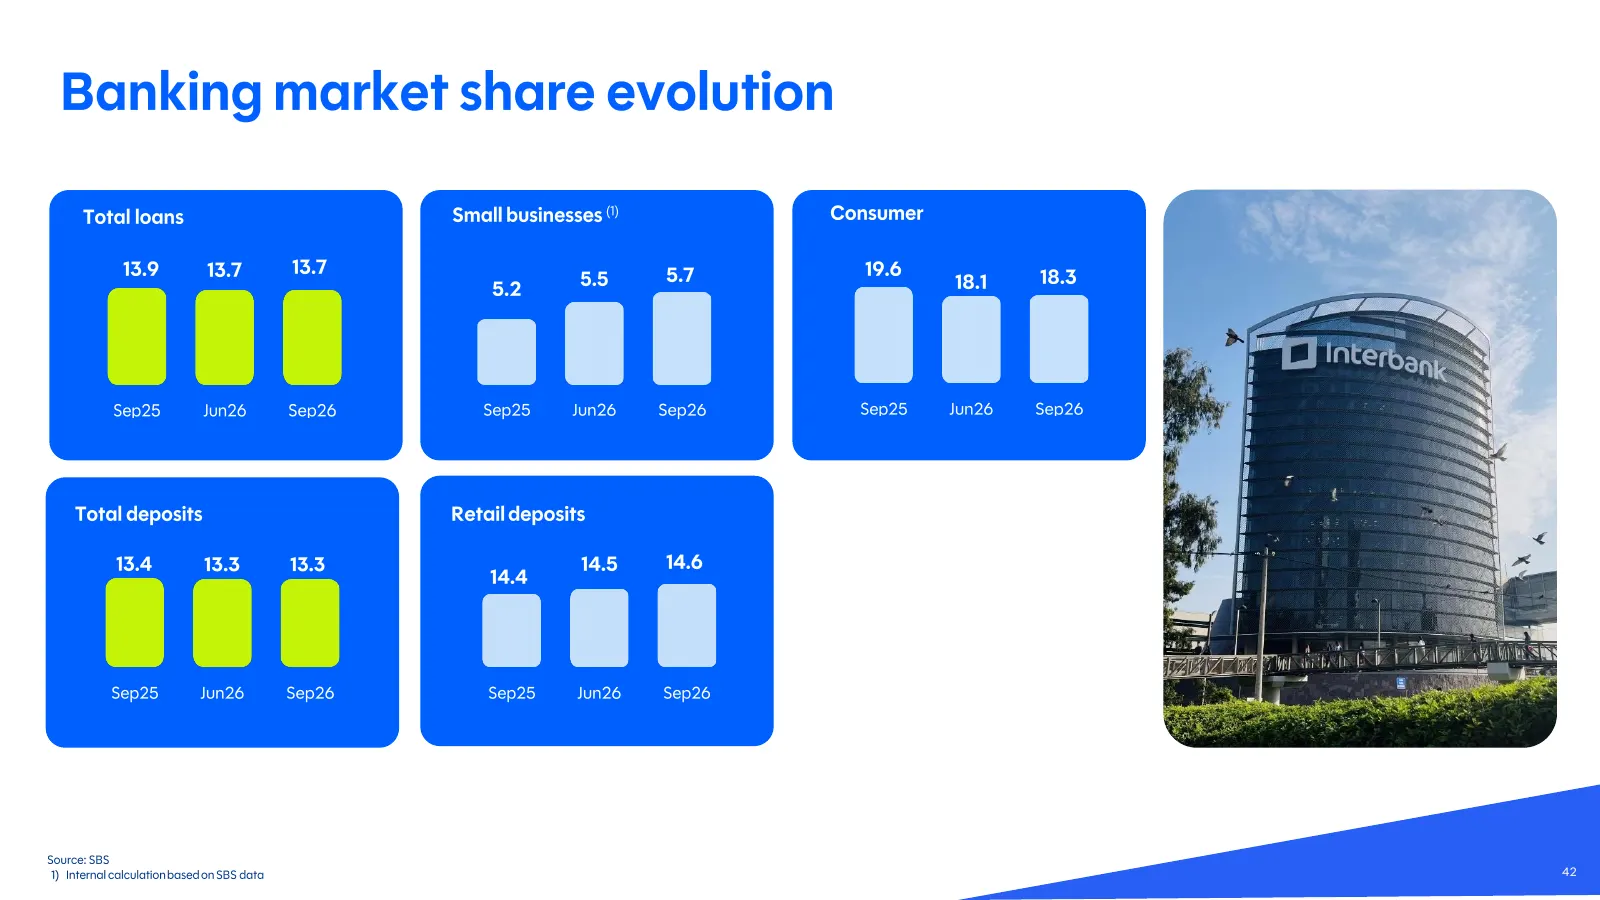
Slide 42: Banking market share evolution
Banking market share evolution Total loans Small businesses (1) Consumer 13.9 13.7 13.7 5.7 19.6 18.3 5.5 18.1 5.2 Sep25 Jun26 Sep26 Sep25 Jun26 Sep26 Sep25 Jun26 Sep26 Total deposits Retail deposits 13.4 13.3 13.3 14.5 14.6 14.4 Sep25 Jun26 Sep26 Sep25 Jun26 Sep26 Source: SBS 1) Internal calculatio
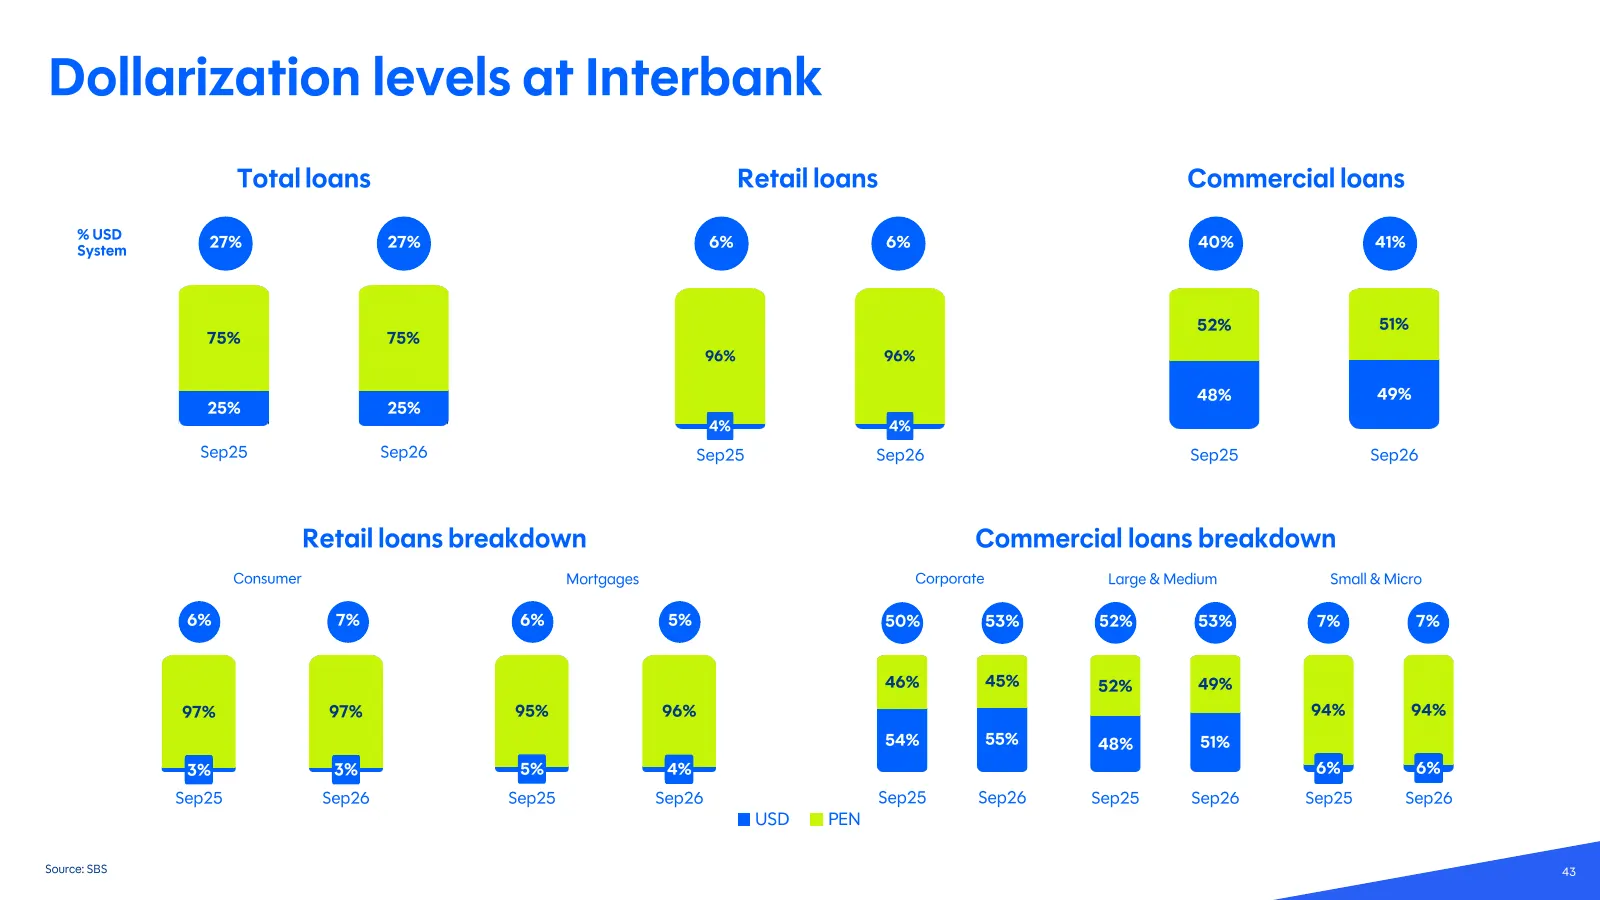
Slide 43: Dollarization levels at Interbank
Dollarization levels at Interbank Total loans Retail loans Commercial loans % USD System 27% 27% 6% 6% 40% 41% 52% 51% 75% 75% 96% 96% 48% 49% 25% 25% 4% 4% Sep25 Sep26 Sep25 Sep26 Sep25 Sep26 Retail loans breakdown Commercial loans breakdown Consumer Mortgages Corporate Large & Medium Small & Micro
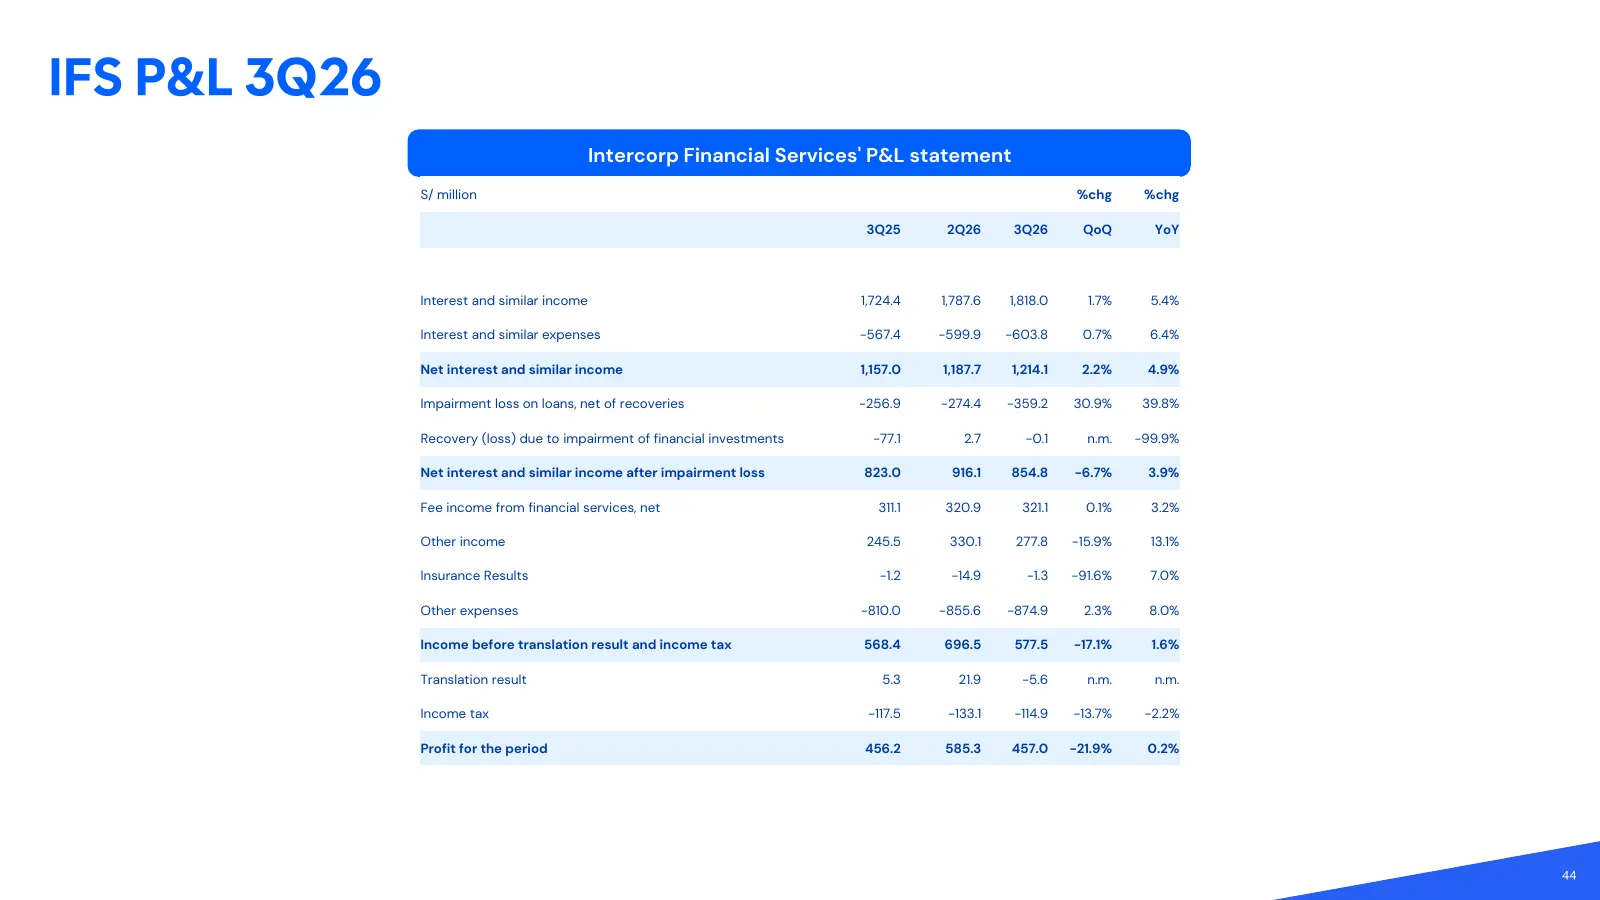
Slide 44: IFS P&L 3Q26
IFS P&L 3 Q26 Intercorp Financial Services' P&L statement S/ million %chg %chg 3Q25 2Q26 3Q26 QoQ YoY Interest and similar income 1,724.4 1,787.6 1,818.0 1.7% 5.4% Interest and similar expenses -567.4 -599.9 -603.8 0.7% 6.4% Net interest and similar income 1,157.0 1,187.7 1,214.1 2.2% 4.9% Impairmen
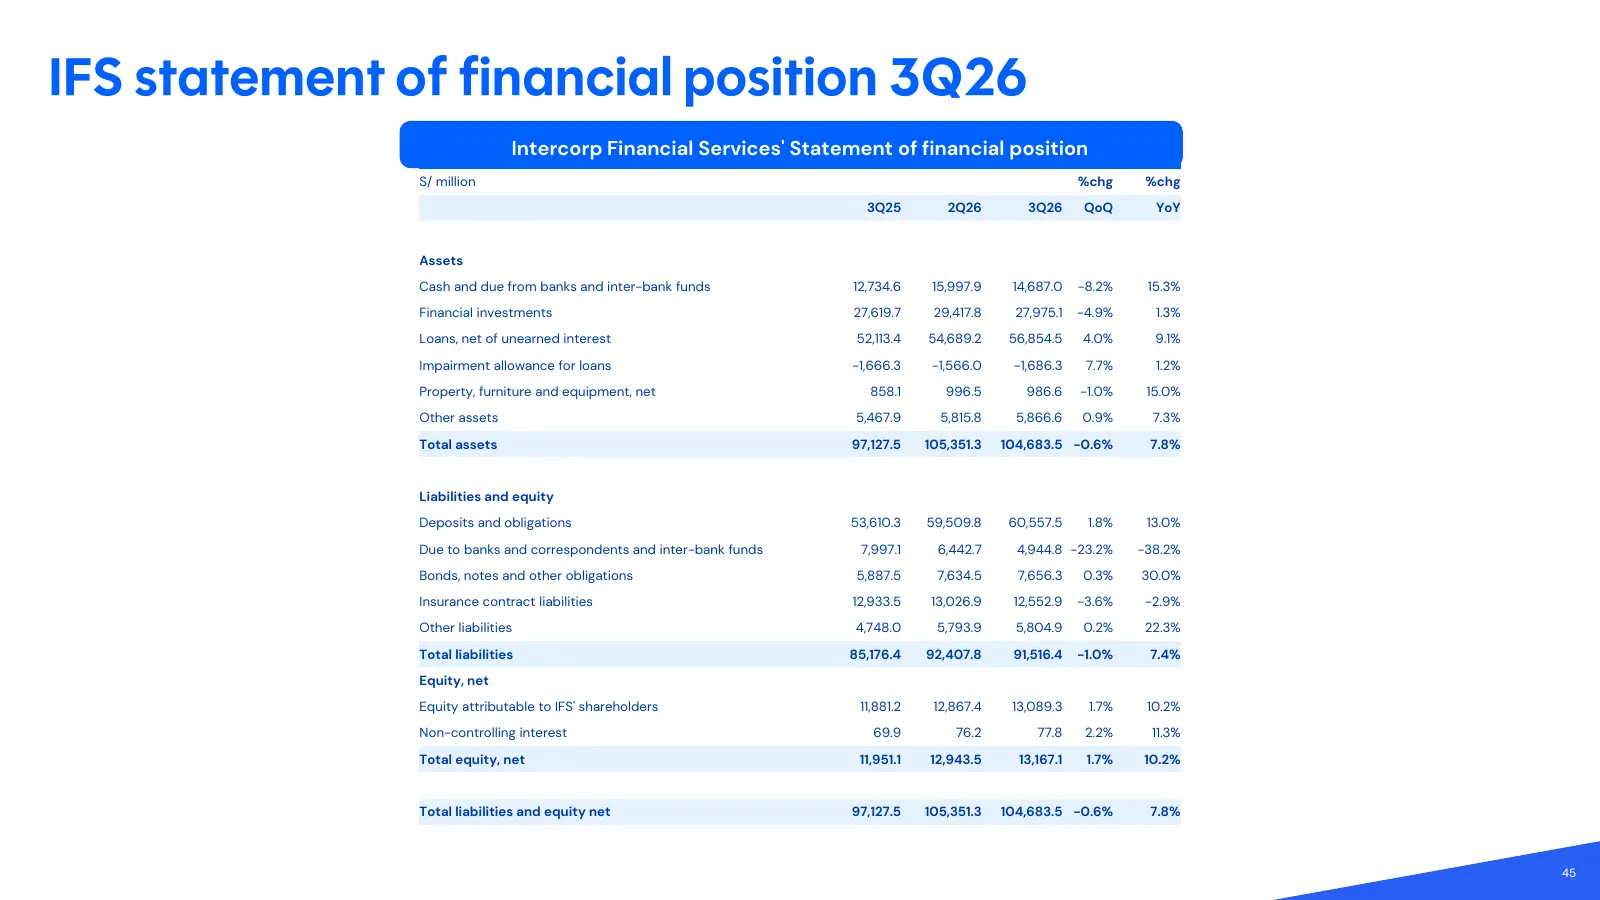
Slide 45: IFS statement of financial position 3Q26
IFS statement of financial position 3Q26 Intercorp Financial Services' Statement of financial position S/ million %chg %chg 3Q25 2Q26 3Q26 QoQ YoY Assets Cash and due from banks and inter-bank funds 12,734.6 15,997.9 14,687.0 -8.2% 15.3% Financial investments 27,619.7 29,417.8 27,975.1 -4.9% 1.3% Lo
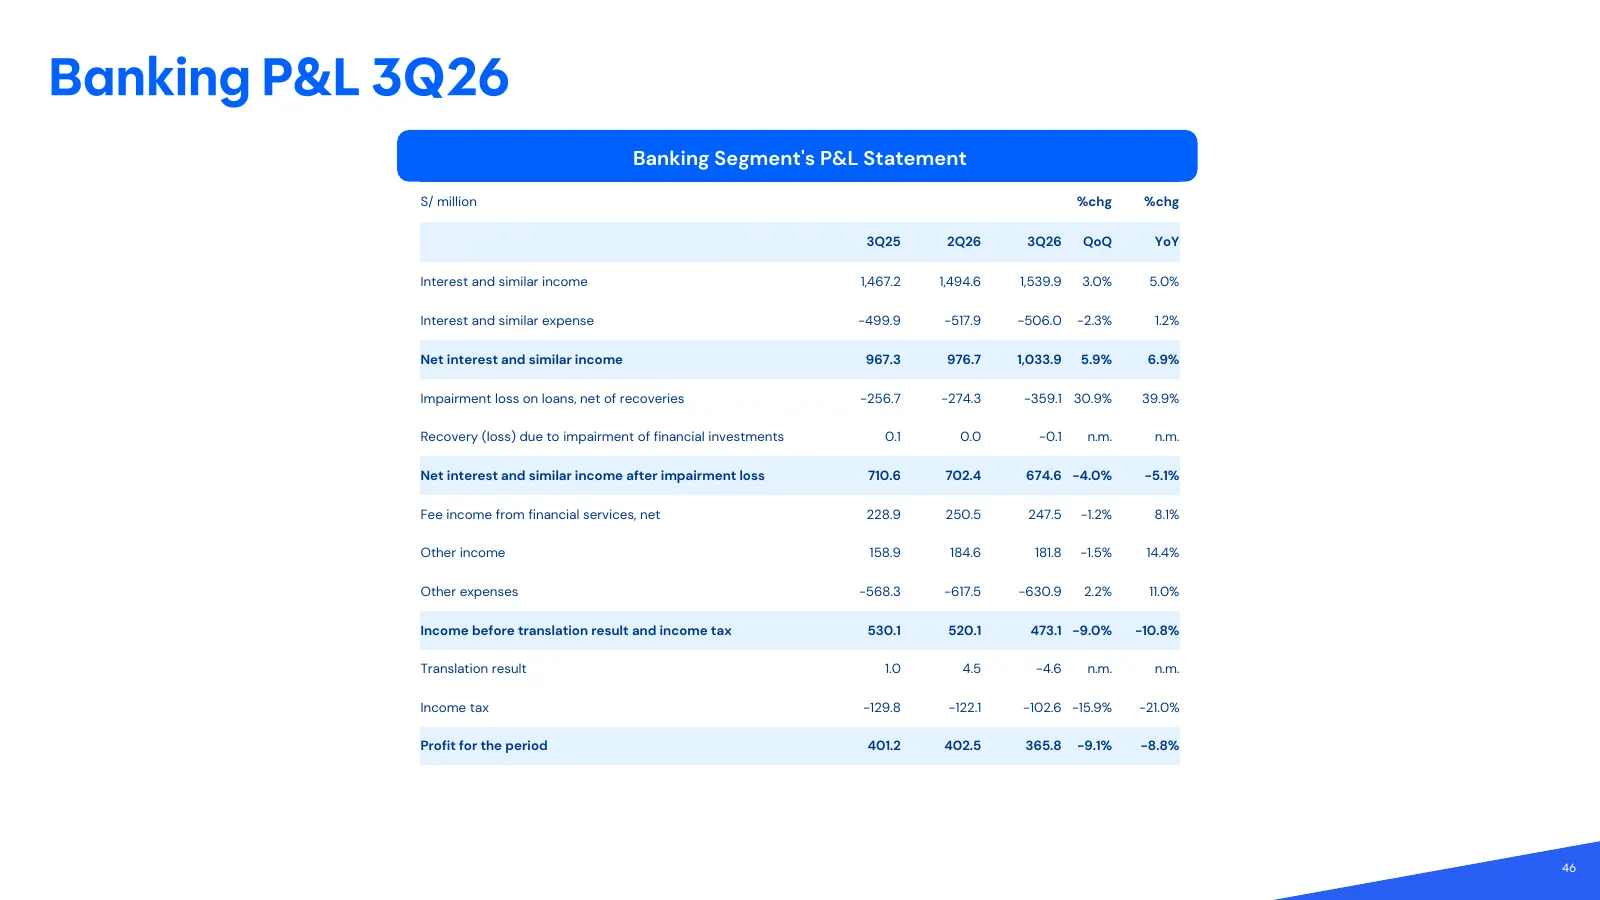
Slide 46: Banking P&L 3Q26
Banking P&L 3Q26 Banking Segment's P&L Statement S/ million %chg %chg 3Q25 2Q26 3Q26 QoQ YoY Interest and similar income 1,467.2 1,494.6 1,539.9 3.0% 5.0% Interest and similar expense -499.9 -517.9 -506.0 -2.3% 1.2% Net interest and similar income 967.3 976.7 1,033.9 5.9% 6.9% Impairment loss on loa
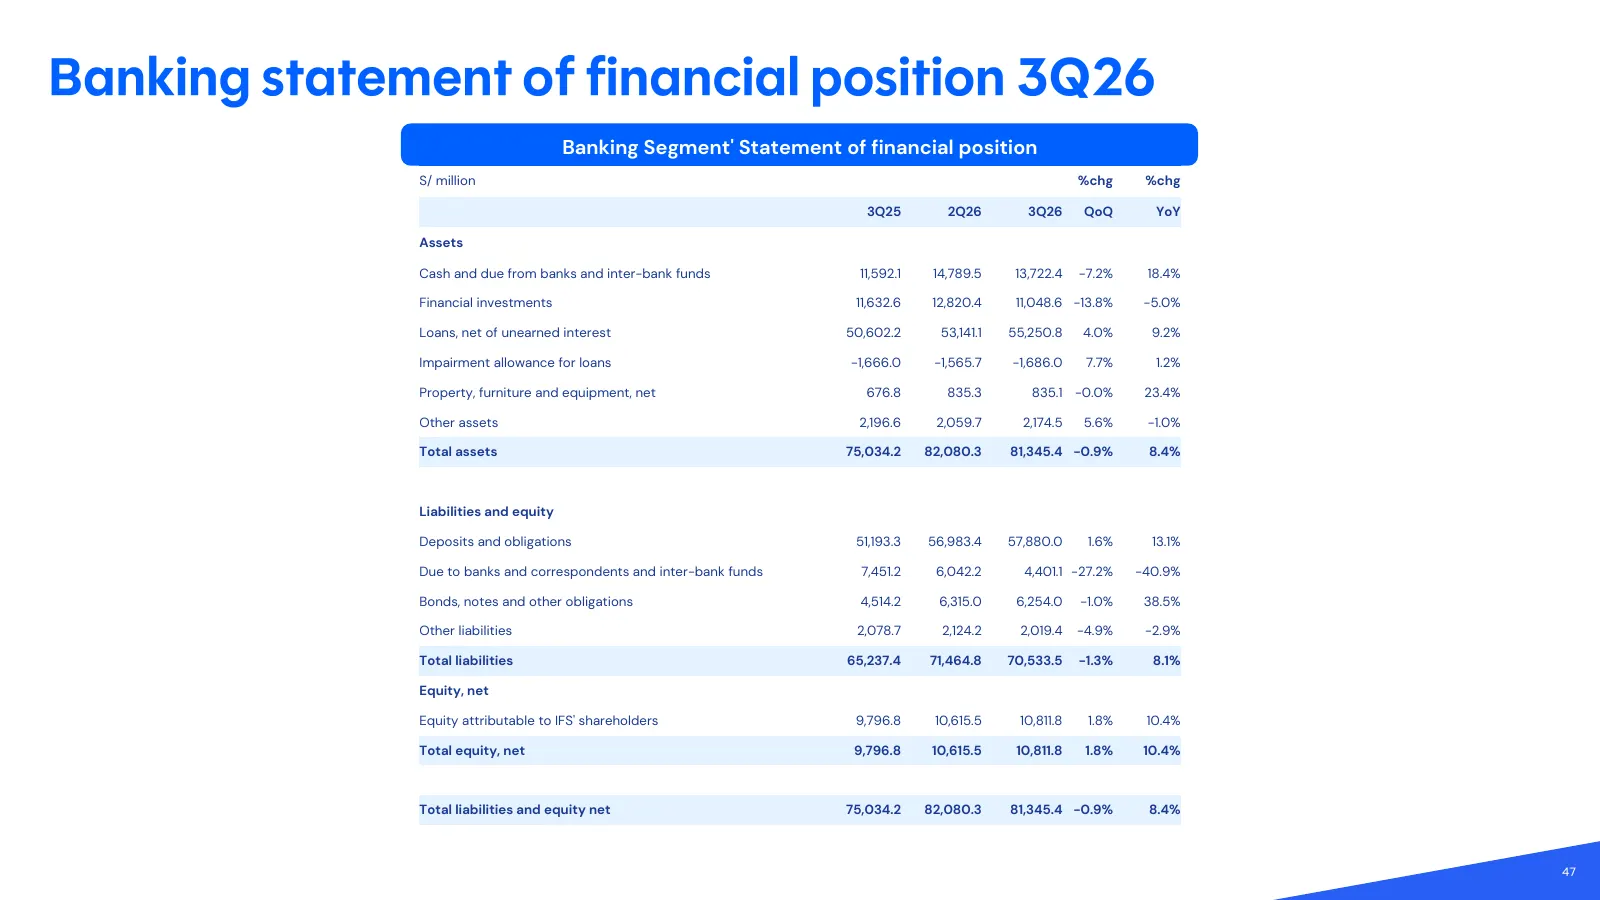
Slide 47: Banking statement of financial position 3Q26
Banking statement of financial position 3Q26 Banking Segment' Statement of financial position S/ million %chg %chg 3Q25 2Q26 3Q26 QoQ YoY Assets Cash and due from banks and inter-bank funds 11,592.1 14,789.5 13,722.4 -7.2% 18.4% Financial investments 11,632.6 12,820.4 11,048.6 -13.8% -5.0% Loans, ne
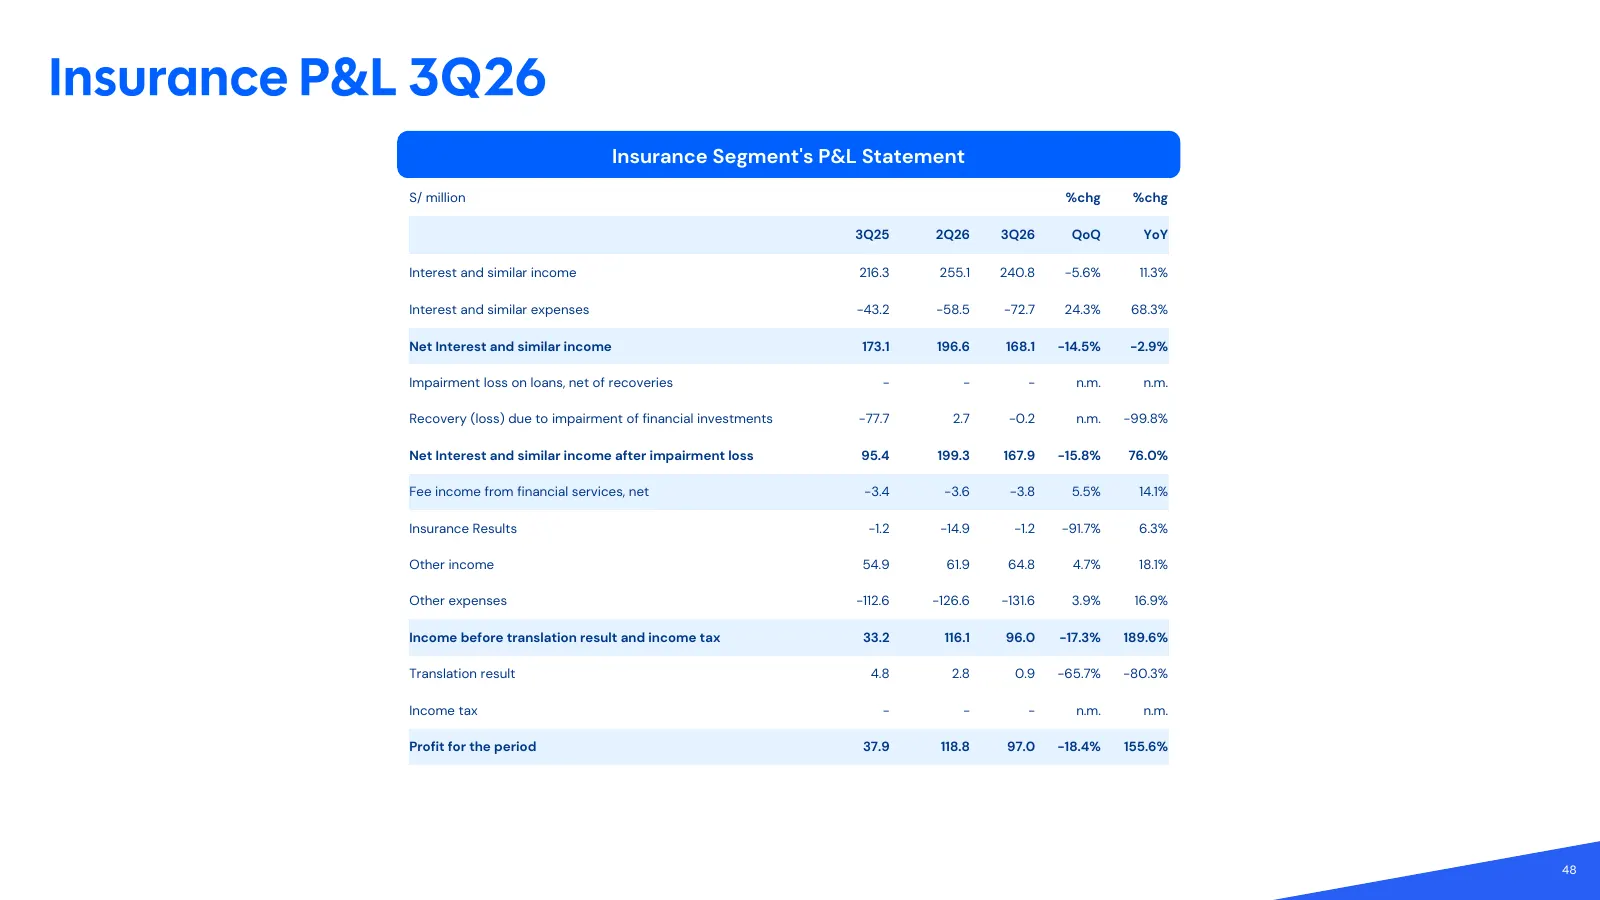
Slide 48: Insurance P&L 3Q26
Insurance P&L 3Q26 Insurance Segment's P&L Statement S/ million %chg %chg 3Q25 2Q26 3Q26 QoQ YoY Interest and similar income 216.3 255.1 240.8 -5.6% 11.3% Interest and similar expenses -43.2 -58.5 -72.7 24.3% 68.3% Net Interest and similar income 173.1 196.6 168.1 -14.5% -2.9% Impairment loss on loa
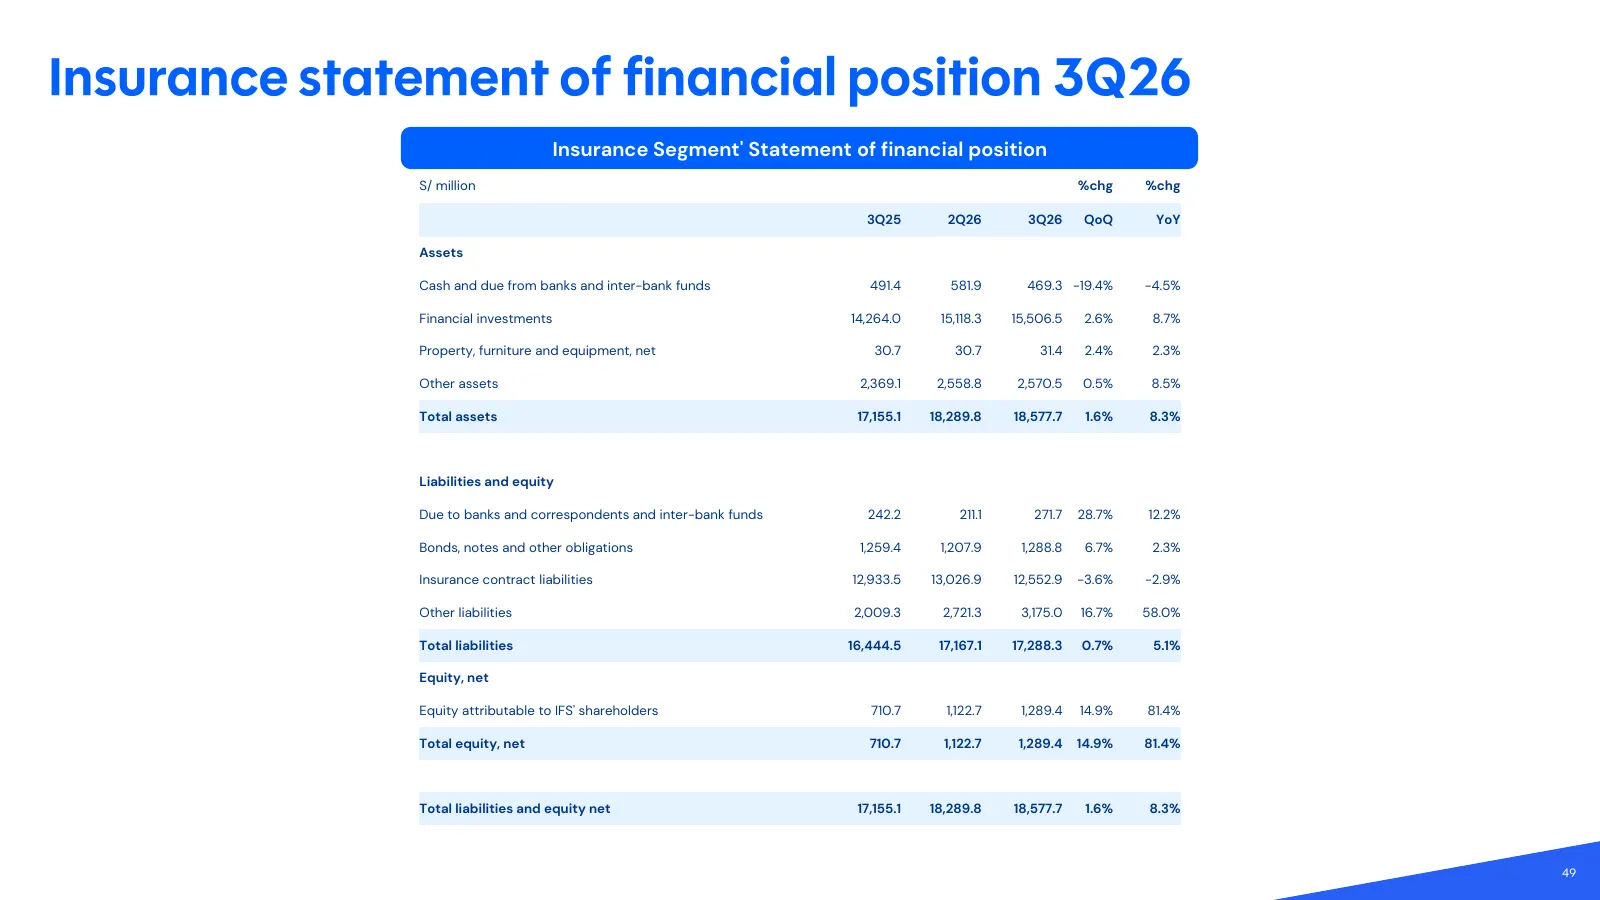
Slide 49: Insurance statement of financial position 3Q26
Insurance statement of financial position 3Q26 Insurance Segment' Statement of financial position S/ million %chg %chg 3Q25 2Q26 3Q26 QoQ YoY Assets Cash and due from banks and inter-bank funds 491.4 581.9 469.3 -19.4% -4.5% Financial investments 14,264.0 15,118.3 15,506.5 2.6% 8.7% Property, furnit
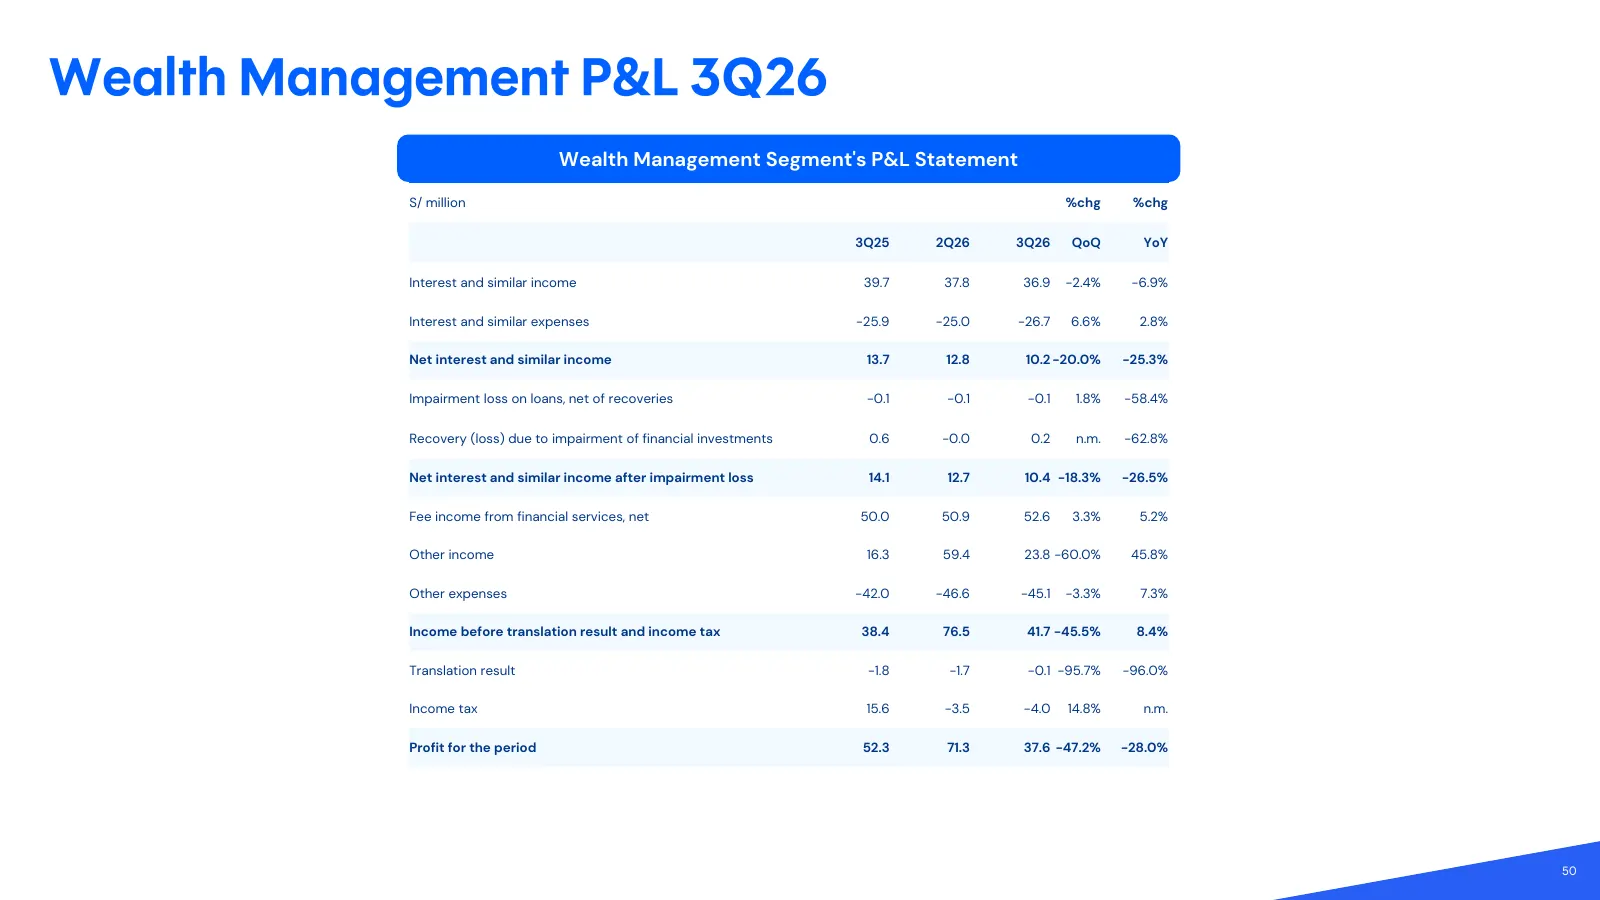
Slide 50: Wealth Management P&L 3Q26
Wealth Management P&L 3Q26 Wealth Management Segment's P&L Statement S/ million %chg %chg 3Q25 2Q26 3Q26 QoQ YoY Interest and similar income 39.7 37.8 36.9 -2.4% -6.9% Interest and similar expenses -25.9 -25.0 -26.7 6.6% 2.8% Net interest and similar income 13.7 12.8 10.2 -20.0% -25.3% Impairment lo
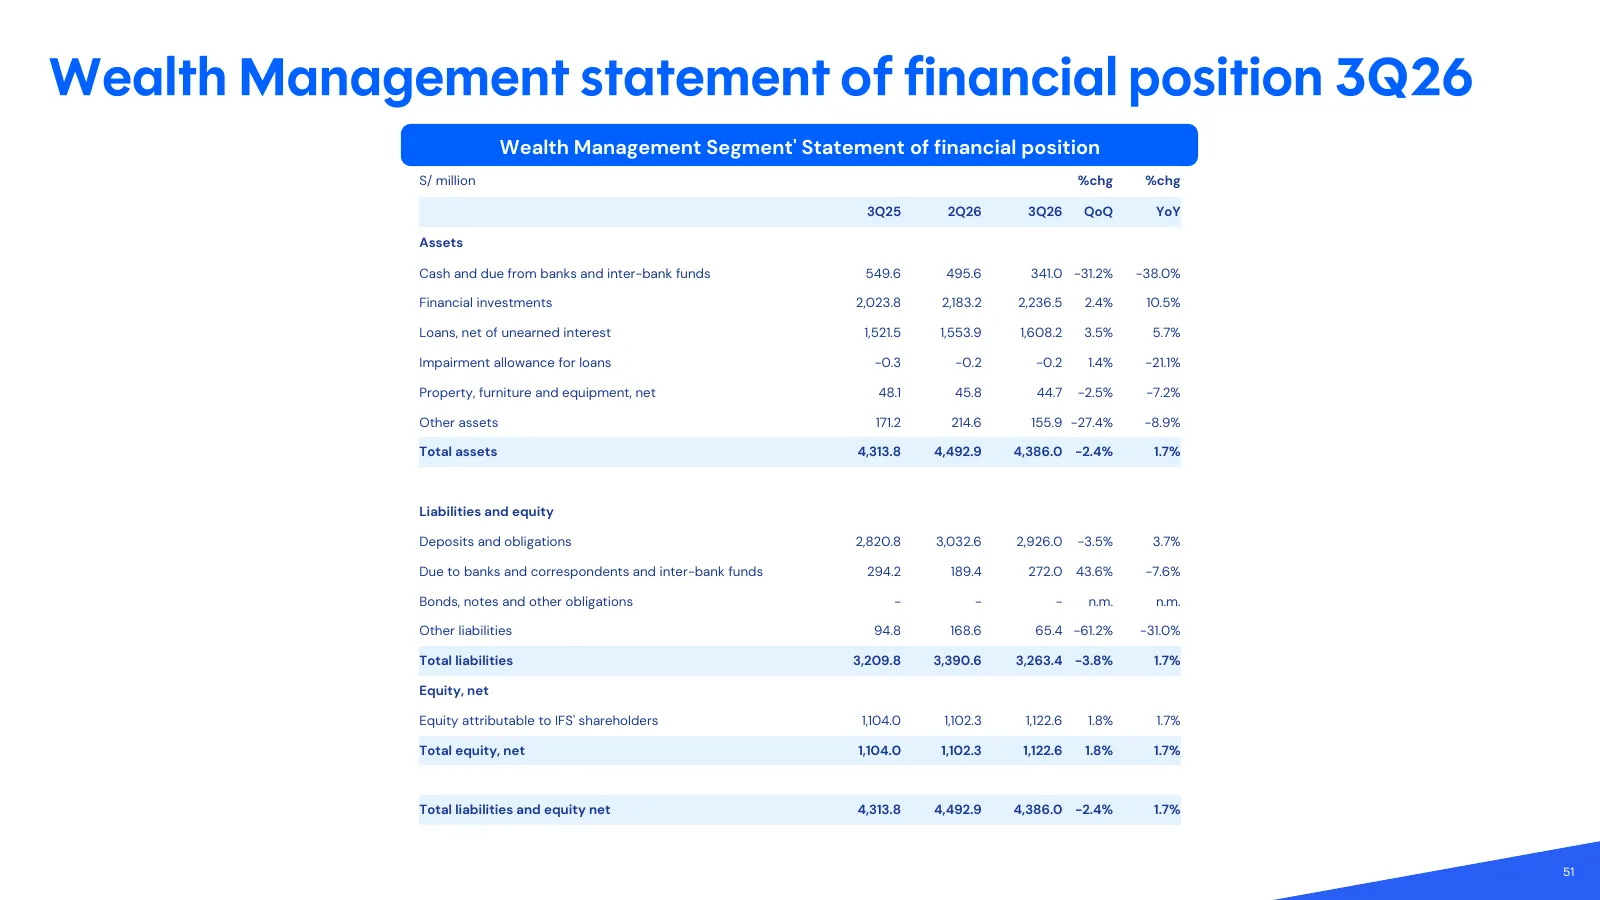
Slide 51: Wealth Management statement of financial position 3Q26
Wealth Management statement of financial position 3Q26 Wealth Management Segment' Statement of financial position S/ million %chg %chg 3Q25 2Q26 3Q26 QoQ YoY Assets Cash and due from banks and inter-bank funds 549.6 495.6 341.0 -31.2% -38.0% Financial investments 2,023.8 2,183.2 2,236.5 2.4% 10.5% L
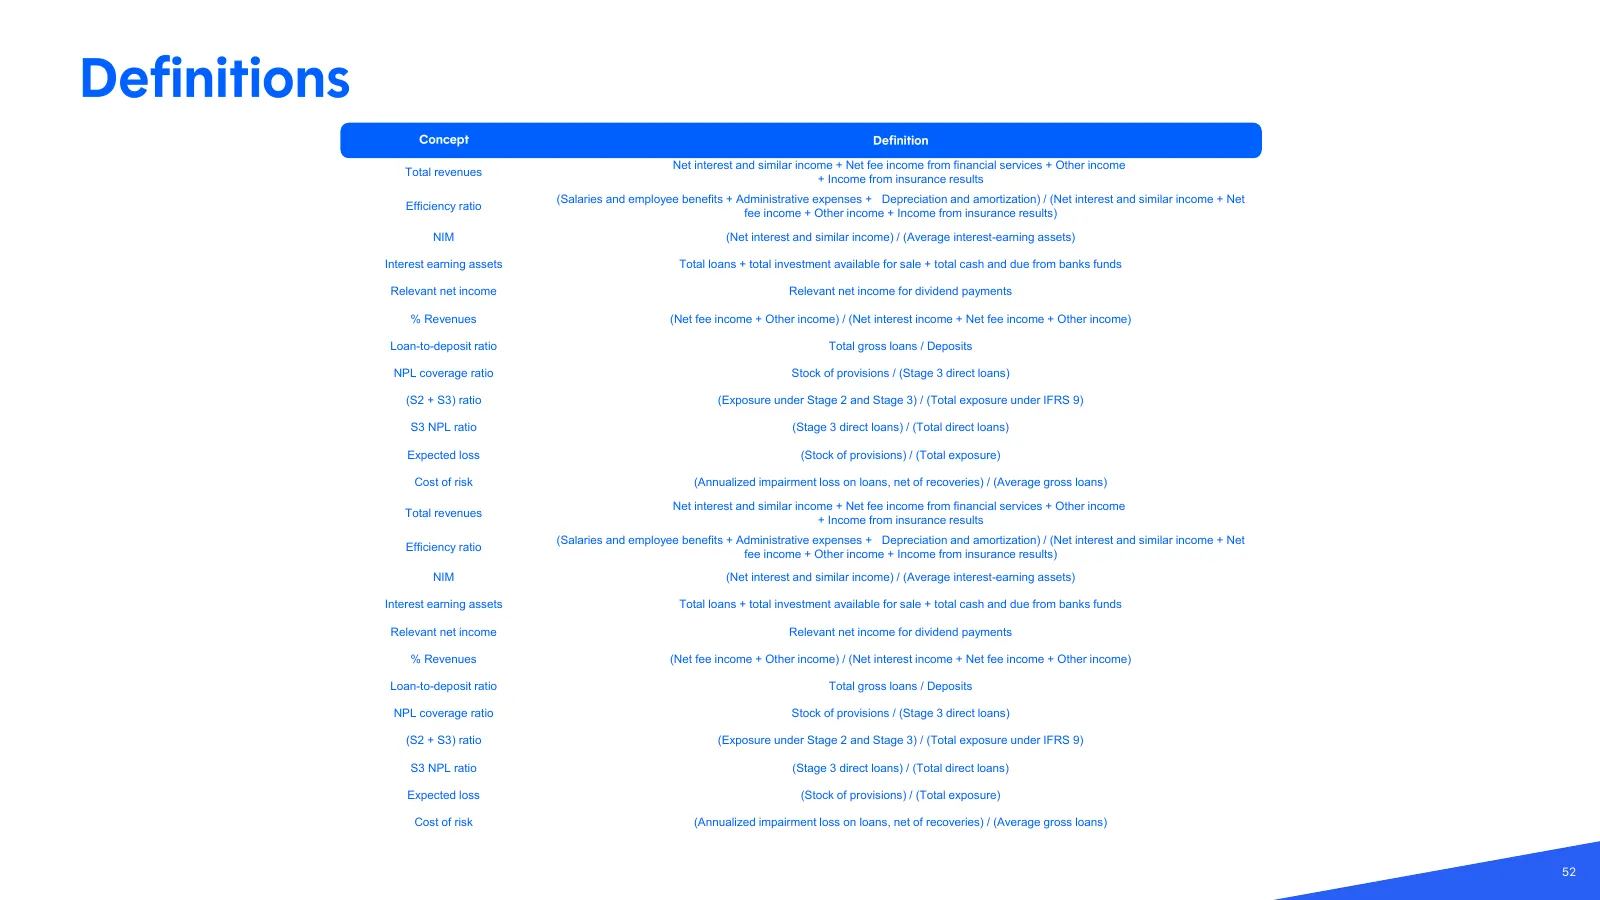
Slide 52: Definitions
Definitions Concept Definition Net interest and similar income + Net fee income from financial services + Other income Total revenues + Income from insurance results (Salaries and employee benefits + Administrative expenses + Depreciation and amortization) / (Net interest and similar income + Net Ef
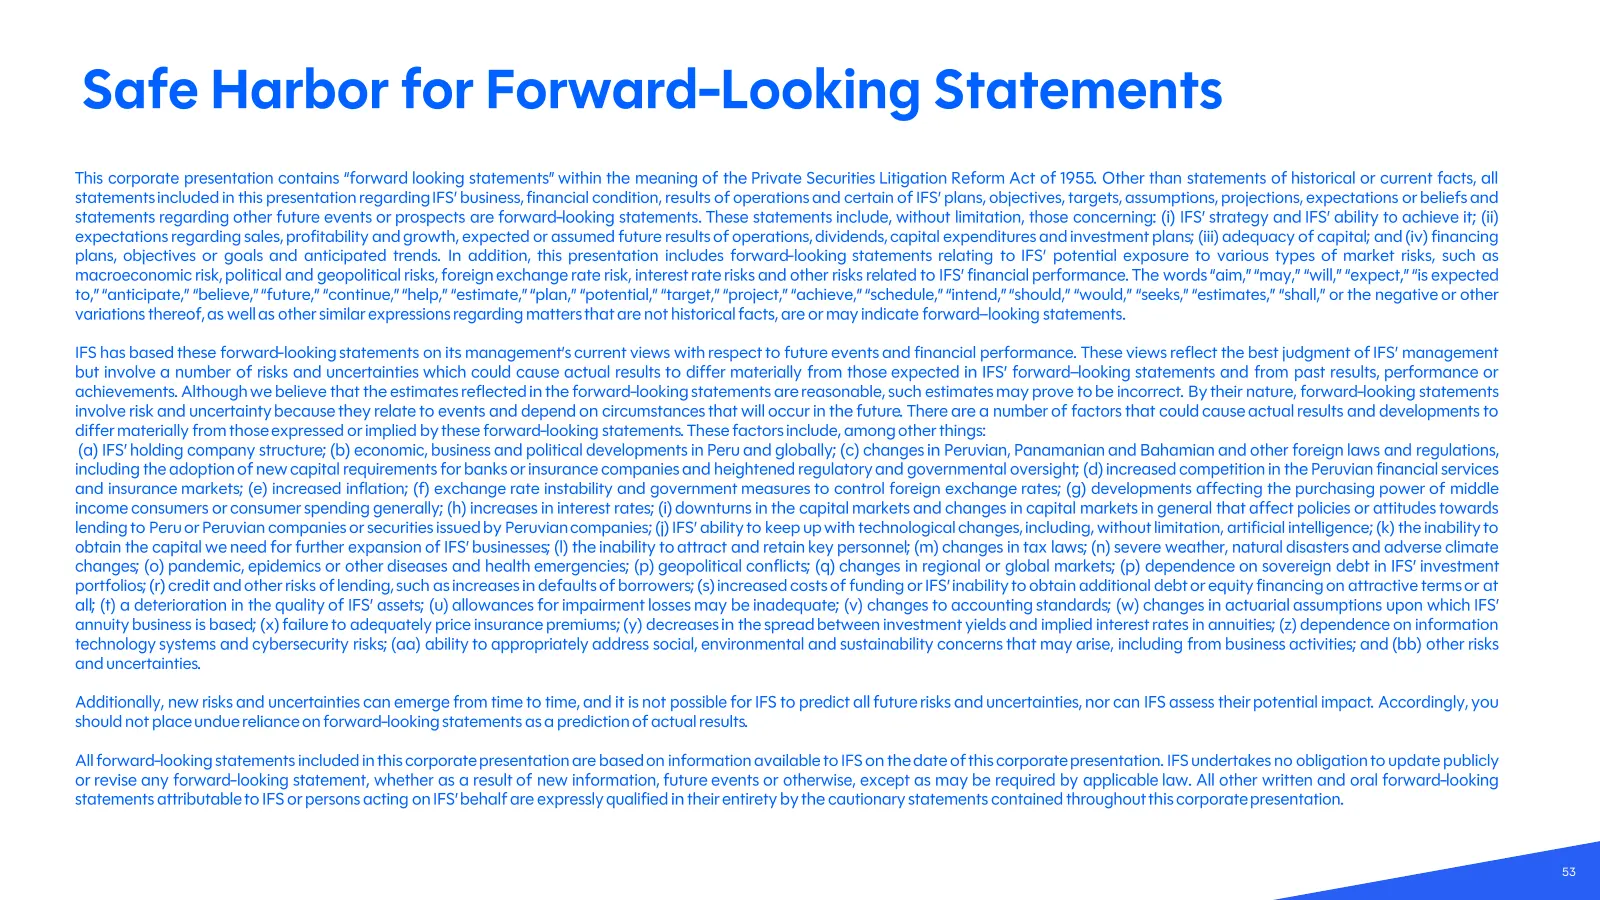
Slide 53: Safe Harbor for Forward-Looking Statements
Safe Harbor for Forward -Looking Statements This corporate presentation contains “forward looking statements” within the meaning of the Private Securities Litigation Reform Act of 1955. Other than statements of historical or current facts, all statements included in this presentation regarding IFS’

Slide 54: 54
54
Source: company website
More decks from Intercorp Financial Services Inc.
 Q2 2026 Earnings Presentation54 slides · Aug 12, 2026
 Q2 2026 Earnings Presentation57 slides · August 2026
 Q2 2026 Earnings Presentation38 slides · August 2026
 Q1 2026 Earnings Presentation54 slides · May 12, 2026
 Q1 2026 Earnings Presentation51 slides · May 2026
 Q1 2026 Earnings Presentation36 slides · May 2026