Sundance Energy — Sundance Energy Australia — Q1 2018 Earnings Presentation
11 slides from Sundance Energy's earnings presentation, May 18, 2018
Slide 1: Disclaimers: Important Notice and Disclaimer
Disclaimers Important Notice and Disclaimer IMPORTANT: You are advised to read the following carefully before making any use of the information contained in this presentation. Except as required by law, no representation or warranty, express or implied, is made by Sundance or any of the Sundance Rel
Slide 2: Disclaimers: Industry data, past performance, forward-looking statements
Disclaimers Industry data Certain market and industry data used in connection with this presentation, including in relation to other companies in Sundance’s peer group, may have been obtained from public filings, research, surveys or studies conducted by third parties, including industry or general
Slide 3: Disclaimers: Proved and probable reserves
Disclaimers Proved and probable reserves Ryder Scott Company, L.P. (Ryder Scott) has prepared an independent estimate of the proved and probable reserves, future production and income attributable to leasehold interests within the recently closed acquisition of 21,900 net acres for sale by Pioneer N
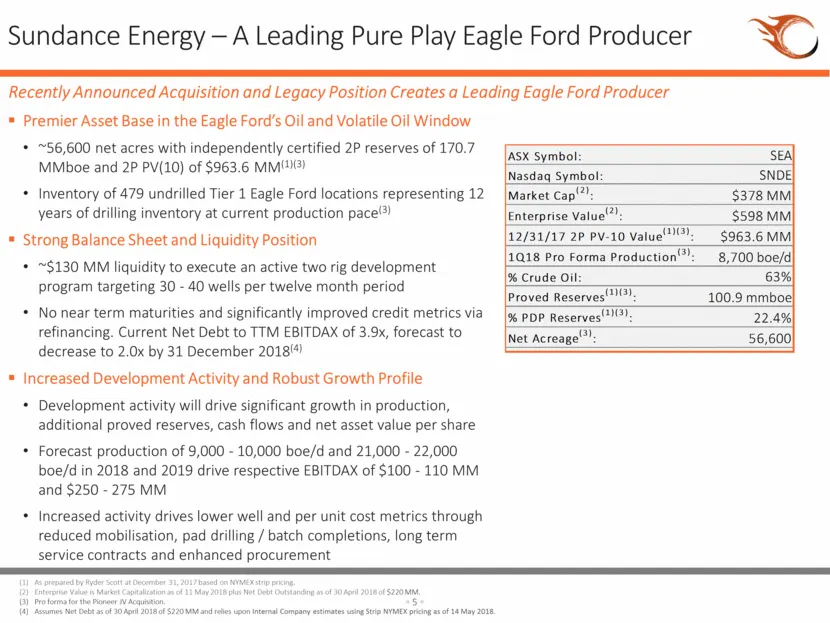
Slide 4: Sundance Energy – A Leading Pure Play Eagle Ford Producer
Sundance Energy – A Leading Pure Play Eagle Ford Producer Premier Asset Base in the Eagle Ford’s Oil and Volatile Oil Window ~56,600 net acres with independently certified 2P reserves of 170.7 MMboe and 2P PV(10) of $963.6 MM(1)(3) Inventory of 479 undrilled Tier 1 Eagle Ford locations representing
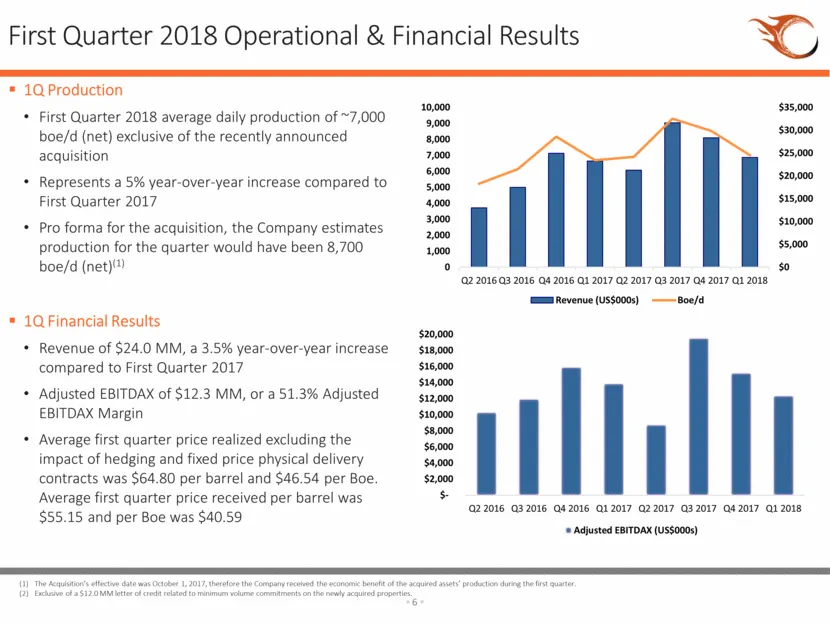
Slide 5: First Quarter 2018 Operational & Financial Results
First Quarter 2018 Operational & Financial Results 1Q Production First Quarter 2018 average daily production of ~7,000 boe/d (net) exclusive of the recently announced acquisition Represents a 5% year-over-year increase compared to First Quarter 2017 Pro forma for the acquisition, the Company estimat
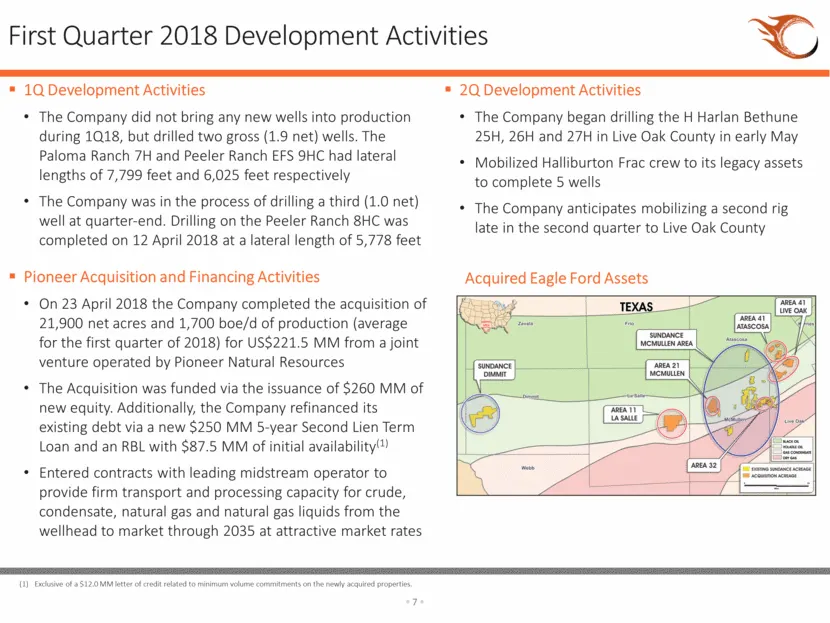
Slide 6: First Quarter 2018 Development Activities
First Quarter 2018 Development Activities 1Q Development Activities The Company did not bring any new wells into production during 1Q18, but drilled two gross (1.9 net) wells. The Paloma Ranch 7H and Peeler Ranch EFS 9HC had lateral lengths of 7,799 feet and 6,025 feet respectively The Company was i
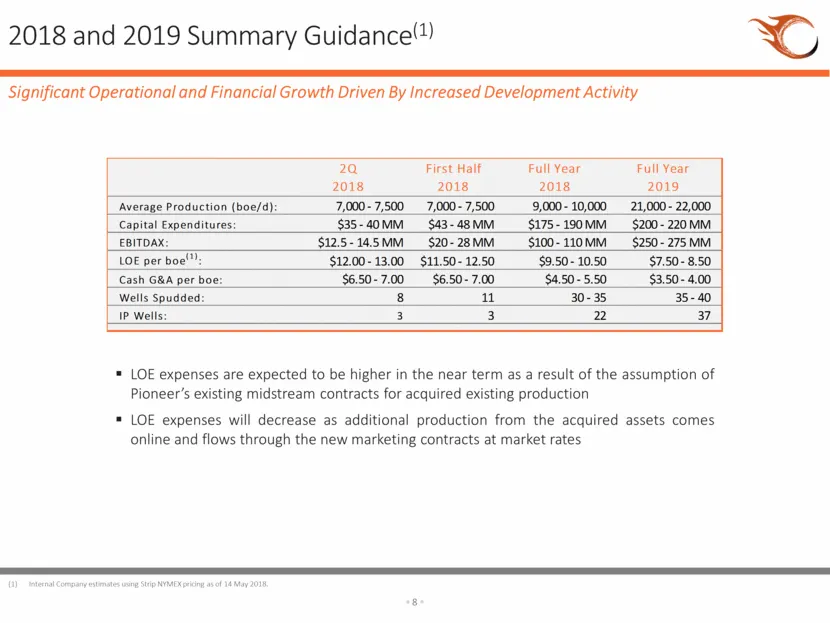
Slide 7: 2018 and 2019 Summary Guidance
2018 and 2019 Summary Guidance(1) Significant Operational and Financial Growth Driven By Increased Development Activity LOE expenses are expected to be higher in the near term as a result of the assumption of Pioneer’s existing midstream contracts for acquired existing production LOE expenses will d
Slide 8: Pioneer JV Acquisition – A Transformational Transaction Successfully Closed
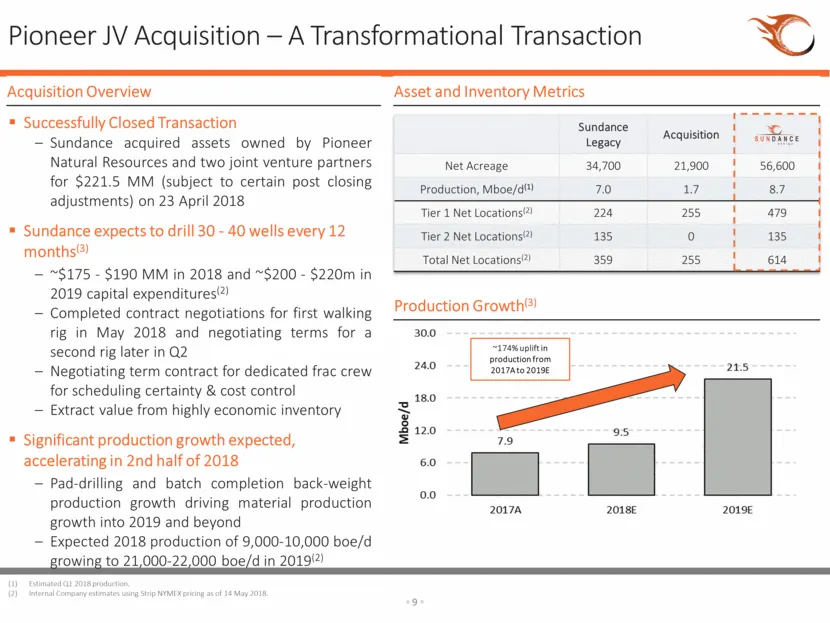
Sundance Legacy Acquisition Net Acreage 34,700 21,900 56,600 Production, Mboe/d(1) 7.0 1.7 8.7 Tier 1 Net Locations(2) 224 255 479 Tier 2 Net Locations(2) 135 0 135 Total Net Locations(2) 359 255 614 Pioneer JV Acquisition – A Transformational Transaction Successfully Closed Transaction Sundance acq
Slide 9: Operations – Continued Improvements Drive Production Growth
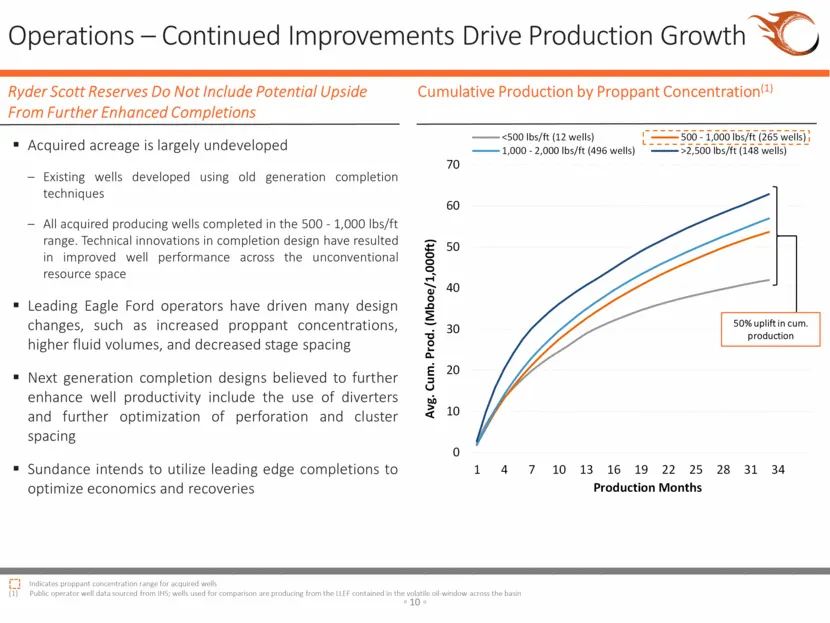
Operations – Continued Improvements Drive Production Growth Acquired acreage is largely undeveloped Existing wells developed using old generation completion techniques All acquired producing wells completed in the 500 - 1,000 lbs/ft range. Technical innovations in completion design have resulted in
Slide 10: Risk Management Overview – Commodity Price Hedging
Gas Hedge Contracts(1) Weighted-Avg. Pricing Year Mcf Mcf/d Floor Ceiling 2018 1,826,000 6,640 $2.87 $3.10 2019 1,932,000 5,293 $2.75 $3.18 2020 1,536,000 4,208 $2.65 $2.70 2021 1,200,000 3,288 $2.66 $2.66 2022 1,080,000 2,959 $2.69 $2.69 Total 7,574,000 $2.73 $2.91 Gas Hedges(1) Risk Management Ove
Slide 11: Investment Highlights
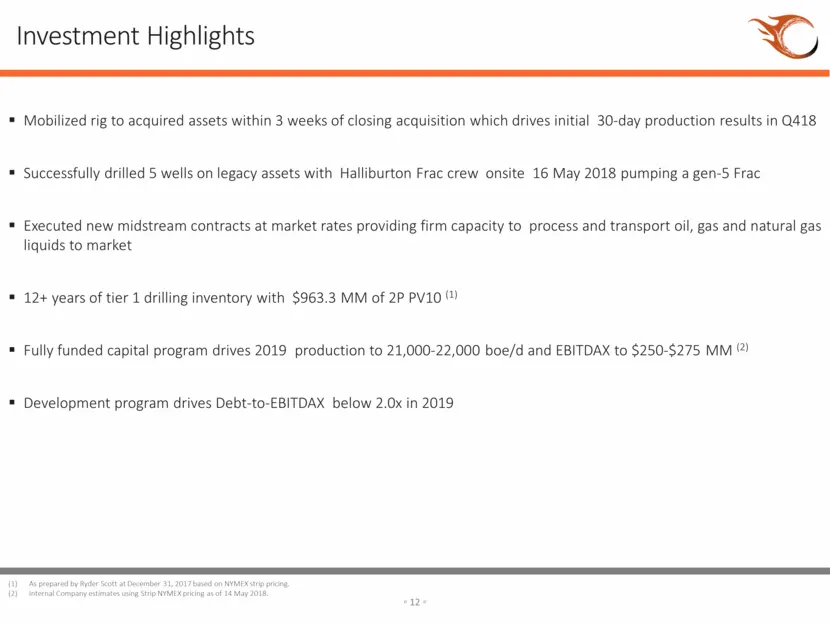
Investment Highlights .@ = Mobilized rig to acquired assets within 3 weeks of closing acquisition which drives initial 30-day production results in Q418 Successfully drilled 5 wells on legacy assets with Halliburton Frac crew onsite 16 May 2018 pumping a gen-5 Frac Executed new midstream contracts a
Source: SEC EDGAR · 6-K filed May 18, 2018
More decks from Sundance Energy Inc
 Investor Presentation (February 2020)25 slides · Feb 10, 2020
 Sundance Energy Australia — Q3 2019 Earnings Presentation24 slides · Nov 18, 2019
 Sundance Energy Australia — Q2 2019 Earnings Presentation25 slides · Aug 16, 2019
 Sundance Energy Australia — Investor Presentation (July 2019)19 slides · Jul 24, 2019
 Sundance Energy Australia — Investor Presentation (June 2019)16 slides · Jun 3, 2019
 Sundance Energy Australia — Q1 2019 Earnings Presentation17 slides · May 21, 2019